
Modeling Investment Trends: A Logarithmic-Modified Markov Chain Approach
 , James Augustine Ukpabio1, Emmanuel Alphonsus Akpan2, 3, *,
 - DOI
- 10.2991/jsta.d.201006.001How to use a DOI?
- Keywords
- Convergence; Heteroscdasticity; Logarithmic transformation; Markov chain; Stochastic process; Transition matrix
- Abstract
The study aimed at stabilizing the changing variance using the logarithmic transformation to achieve a significant proportion of stability and a faster rate of convergence of the steady state transition probability in Markov chains. The traditional Markov chain and logarithmic-modified Markov chain were considered. On exploring the yearly data on the stock prices from 2015 to 2018 as obtained from the Nigerian Stock Exchange, it was found that the steady state of logarithmic-modified Markov chain converged faster than the tradition Markov chain with efficiency in tracking the correct cycles where the stock movements are trending irrespective of which cycle it starts at time zero with differences in probability values by 1.1%, 0.7%, −0.41% and −1.37% for accumulation, markup, distribution and mark-down cycles, respectively. Thus, it could be deduced that the logarithmic modification enhances the ability of the Markov chain to tract the variation of the steady state probabilities faster than the traditional counterpart.
- Copyright
- © 2020 The Authors. Published by Atlantis Press B.V.
- Open Access
- This is an open access article distributed under the CC BY-NC 4.0 license (http://creativecommons.org/licenses/by-nc/4.0/).
1. INTRODUCTION
In Statistics, trends are steady and methodical fluctuations in the variance of a process over a long period of time and their underlying features are embedded with useful information that are viable for investment decisions [1–4]. The uncertainty or probabilistic nature of stock investment has made trend analysis a potential and promising tool for investors, who seek capital appreciation, hence, the quest for an appropriate model that could offer the best prediction.
The motivation for this study is drawn from the fact that investment trends are stochastic and follow a Markov process which deals with probability of any particular future behavior of a process with an exactly known current state which cannot be altered by additional knowledge concerning its past behavior [5]. According to [6], Markov chains are fundamental stochastic processes that have many diverse applications and it represents any dynamical system whose new state is simply a function of the last state and an auxiliary random on the past and present only through the present state.
The striking reason for continuous application of Markov chains in investment trend analysis is the existence of a limiting probability distribution which is independent of initial states, and this is associated with the convergence in probability of finding the Markov chain in a particular state irrespective of which state the chain began at time zero.
Prior studies such as [7–10] applied Markov chain model approach to analyze and forecast stock trends. On the other hand, given the fact that Markov chain models are appropriate in tracking long-run behavior of trends but failed in tracking short-term behavior prompted the studies of [11–15] to provide the missing link.
However, no previous studies have attempted to take into consideration the effect of changing variance while analyzing investment trends through Markov chains. It is evident in the literature that stocks trends are characterized by changing variance [16–23]. The consequential effect of neglecting changing variance is that it takes longer time to achieve convergence of the probabilities of Markov chain. For instance, in the study of [9], it takes about 2080 steps (about 8 trading years) to attain near convergence.
Therefore, this study seeks to bridge this gap by stabilizing the changing variance through logarithmic transformation to achieve good stability and quick convergence. This is advantageous in that, it reduces the number of n-step computation and increases the precision of the estimates of the probabilities, thus enhances investors to make quick and stable decision.
The remaining part of the paper is organized as follows: Section 2 treats materials and methods. Results and discussion are presented in Section 3 while the conclusion is handled in Section 4.
2. MATERIALS AND METHODS
2.1. Markov Process
A Markov chain
Mathematically, the Markov property is that
2.2. Transition Probability Matrices of a Markov Chain
The probability of
The notation emphasizes that in general, the transition probabilities are functions not only of the initial and final states, but also of the time of transition as well. When the one-step transition probabilities are independent of the time variable n, we say that the Markov chains have stationary transition probabilities. Given the Markov chains that have stationary transition probabilities, then,
A Markov process is completely defined once its transition probability matrix and initial state
2.3. Regular Transition Probability Matrices
Suppose that a transition probability matrix
Or, in terms of the Markov chain
This convergence means that, in the long run (
2.4. Proposed Transformation
In traditional Markov chain process, the problem of estimating transition probabilities is based on the observations on the Markov chain at time
Traditional Markov chain is so defined to enhance convergence to a certain probability distribution of interest. Howbeit, to achieve quick convergence rate of the steady state probabilities, this study considers natural logarithmic transformation of the observations on the Markov chain
3. RESULTS AND DISCUSSION
3.1. Data
The data on stock prices from 2015 to 2018 were obtained from Nigerian Stock Exchange annual report 2018 and are presented in Table 1 while the logarithmic-transformed stock prices are presented in Table 2. The data are grouped into four phases according to stock market cycles: accumulation phase (where the stocks are oversold); mark-up phase (where the demand for the stocks surpasses the supply); distribution phase (where the stocks are overbought) and mark-down phase (where the supply for the stocks overwhelms the demand).
| Accumulation | Mark-up | Distribution | Mark-down | Row Total | |
|---|---|---|---|---|---|
| Accumulation | 478 | 501 | 487 | 421 | 1887 |
| Mark-up | 524 | 523 | 536 | 540 | 2123 |
| Distribution | 605 | 521 | 526 | 507 | 2159 |
| Mark-down | 527 | 536 | 430 | 425 | 1918 |
| Grand Total | 8087 |
Stock prices (“000,000,000”) from 2015 to 2018 according to stock cycle.
| Accumulation | Mark-up | Distribution | Mark-down | Row Total | |
|---|---|---|---|---|---|
| Accumulation | 6.1696 | 6.2166 | 6.1883 | 6.0426 | 24.6171 |
| Mark-up | 6.2615 | 6.2596 | 6.2841 | 6.2916 | 25.0968 |
| Distribution | 6.4052 | 6.2558 | 6.2653 | 6.2285 | 25.1548 |
| Mark-down | 6.2672 | 6.2841 | 6.0638 | 6.0521 | 24.6672 |
| Grand Total | 99.5359 |
Natural logarithmic-transformed stock prices (“000,000,000”) from 2015 to 2018 according to stock cycle.
The plots of data in Tables 1 and 2 are shown in Figures 1 and 2, respectively. It is obvious that the direction of movement of the stock prices according to stock cycles changes due to variance stabilization through natural logarithm as shown in Figure 2 compared to the series in Table 1.
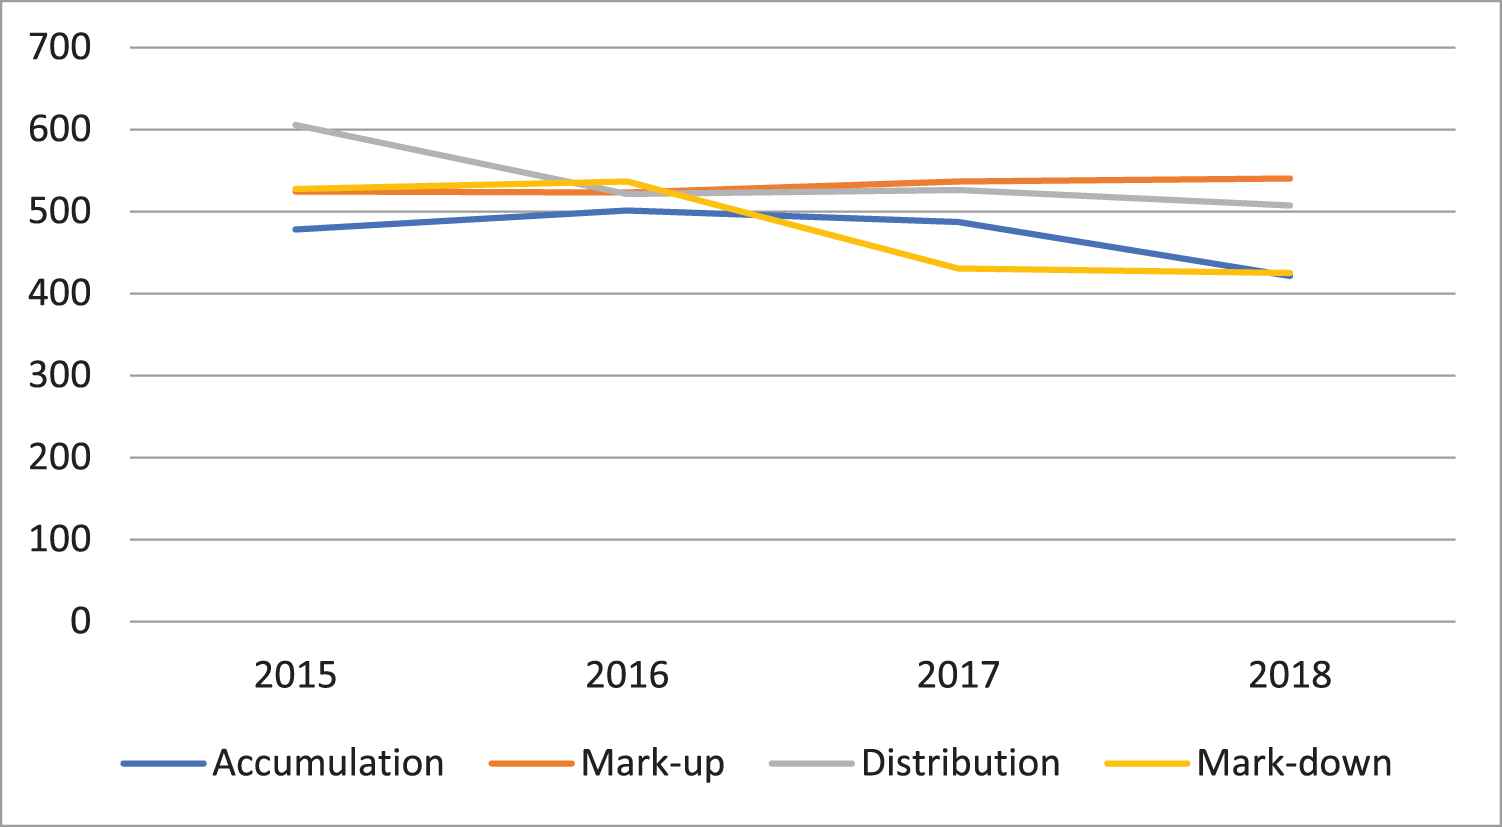
Graph stock prices according to stock cycle.
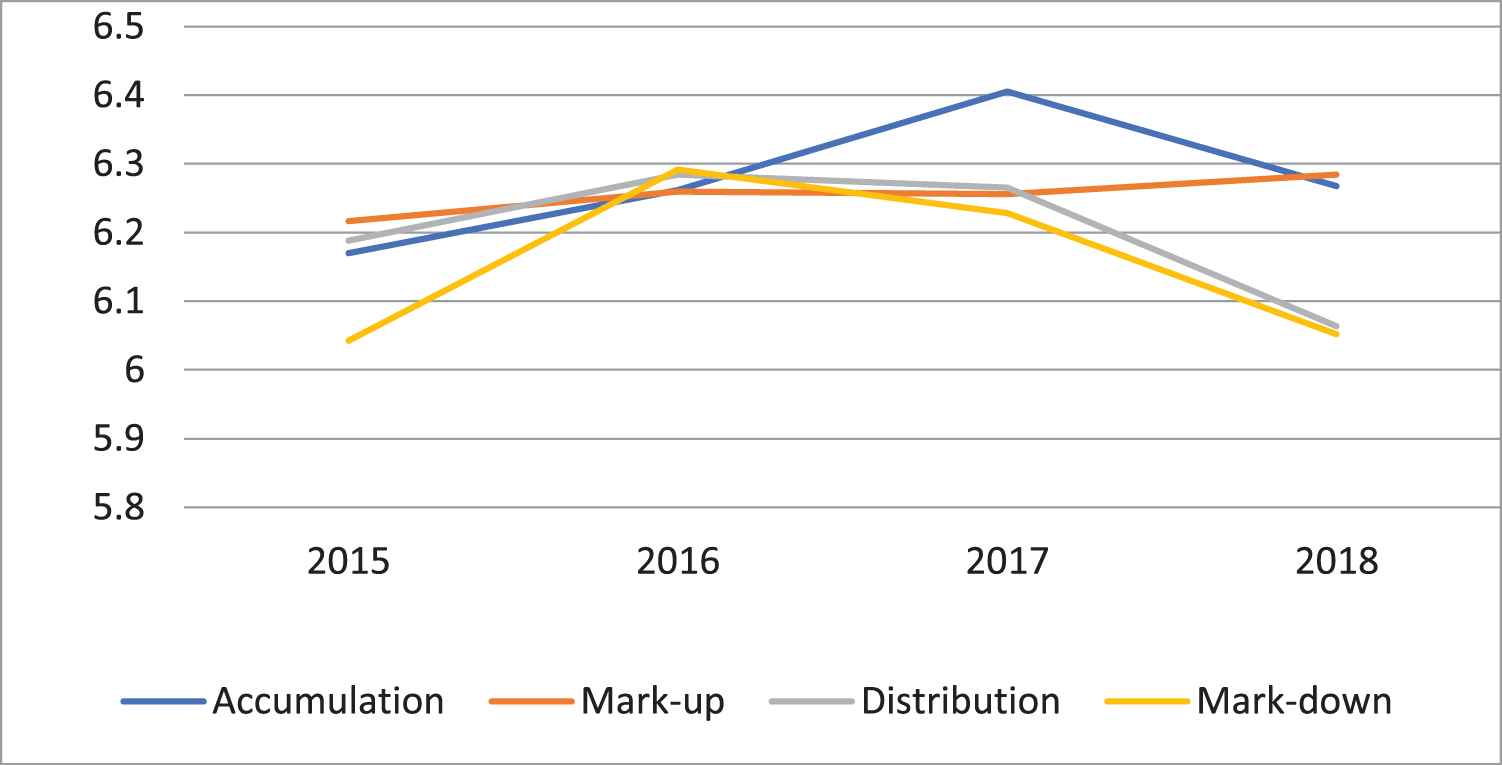
Graph of natural logarithmic-transformed stock prices according to stock cycle.
3.2. Building Transition Probability Matrix of the Stock Prices
The transition probability matrix of the stock cycle using the information in Table 1 are obtained as
| Accumulation | Mark-up | Distribution | Mark-down | ||
|---|---|---|---|---|---|
| Accumulation | 0.2533 | 0.2655 | 0.2581 | 0.2231 | |
| Mark-up | 0.2468 | 0.2463 | 0.2525 | 0.2544 | |
| Distribution | 0.2802 | 0.2413 | 0.2436 | 0.2348 | |
| Mark-down | 0.2748 | 0.2795 | 0.2242 | 0.2216 |
3.3. Convergence of Steady State Probability of the Stock Prices
The steady state probabilities are the constant probabilities to be attained in the states in the future. The interest is to ascertain the number of steps it takes
| Accumulation | Mark-up | Distribution | Mark-down | ||
|---|---|---|---|---|---|
| Accumulation | 0.2633 | 0.2573 | 0.2453 | 0.2341 | |
| Mark-up | 0.2640 | 0.2582 | 0.2444 | 0.2334 | |
| Distribution | 0.2633 | 0.2583 | 0.2452 | 0.2331 | |
| Mark-down | 0.2623 | 0.2578 | 0.2458 | 0.2341 |
| Accumulation | Mark-up | Distribution | Mark-down | ||
|---|---|---|---|---|---|
| Accumulation | 0.2633 | 0.2579 | 0.2452 | 0.2337 | |
| Mark-up | 0.2632 | 0.2579 | 0.2452 | 0.2337 | |
| Distribution | 0.2632 | 0.2579 | 0.2452 | 0.2337 | |
| Mark-down | 0.2633 | 0.2579 | 0.2451 | 0.2337 |
| Accumulation | Mark-up | Distribution | Mark-down | ||
|---|---|---|---|---|---|
| Accumulation | 0.2632 | 0.2579 | 0.2452 | 0.2337 | |
| Mark-up | 0.2632 | 0.2579 | 0.2452 | 0.2337 | |
| Distribution | 0.2632 | 0.2579 | 0.2452 | 0.2337 | |
| Mark-down | 0.2632 | 0.2579 | 0.2452 | 0.2337 |
Therefore, the
3.4. Convergence of Steady State Probability of the Natural Logarithmic-Transformed Stock Prices
The focus is to determine how fast the logarithmic-transformed transition probability matrix,
| Accumulation | Mark-up | Distribution | Mark-down | ||
|---|---|---|---|---|---|
| Accumulation | 0.2506 | 0.2525 | 0.2514 | 0.2455 | |
| Mark-up | 0.2495 | 0.2494 | 0.2504 | 0.2507 | |
| Distribution | 0.2546 | 0.2487 | 0.2491 | 0.2476 | |
| Mark-down | 0.2541 | 0.2548 | 0.2458 | 0.2454 |
| Accumulation | Mark-up | Distribution | Mark-down | ||
|---|---|---|---|---|---|
| Accumulation | 0.2522 | 0.2513 | 0.2492 | 0.2473 | |
| Mark-up | 0.2522 | 0.2514 | 0.2492 | 0.2473 | |
| Distribution | 0.2522 | 0.2514 | 0.2492 | 0.2473 | |
| Mark-down | 0.2522 | 0.2513 | 0.2492 | 0.2473 |
| Accumulation | Mark-up | Distribution | Mark-down | ||
|---|---|---|---|---|---|
| Accumulation | 0.2522 | 0.2513 | 0.2492 | 0.2473 | |
| Mark-up | 0.2522 | 0.2513 | 0.2492 | 0.2473 | |
| Distribution | 0.2522 | 0.2513 | 0.2492 | 0.2473 | |
| Mark-down | 0.2522 | 0.2513 | 0.2492 | 0.2473 |
It could be found that
3.5. Percentage Difference between the Steady State Transition Probability Matrix of Stock Prices and Natural Logarithm of Stock Prices
As indicated in Table 3, when the variance (variation in the prices) is not accounted for, at the accumulation cycle, the stocks have the probability of 0.2632, that is, about 26.32% of being oversold. At the mark-up cycle, the probability of the demand for the stocks surpassing the supply is 0.2579 which is about 25.79%. At the distribution cycle, the probability of the stock being overbought is 0.2452 which is about 24.52%, and at the mark-down cycle, the probability of the supply of stocks overwhelming the demand is 0.2337 (23.37%). On the other hand, when the stabilization of variance is considered, the accumulation cycle has the probability of 0.2522 (25.22%) of the stocks being oversold. At the mark-up cycle, the probability that the demand for stocks is higher than supply is 0.2513 (25.13%). At distribution cycle, the probability of the stocks being overbought is 0.2492 (24.92%), and at the mark-down cycle, the supply is greater than demand with the probability of 0.2473 (24.73%). Comparing the two approaches, it is shown that, when the logarithmic transformation is not considered, the probabilities that the stocks would remain in the accumulation and mark-up cycles are hyped by 1.1 % and 0.7%, respectively while the probabilities that the stocks remain in distribution and mark-down are played down by 0.41% and 1.36%, respectively.
| Stock Cycle | Steady State Transition Probability Matrix of Stock Prices | Steady State Transition Probability Matrix of Natural Logarithm of Stock Prices | Percentage Differences (%) |
|---|---|---|---|
| Accumulation | 0.2632 | 0.2522 | 1.1 |
| Mark-up | 0.2579 | 0.2513 | 0.7 |
| Distribution | 0.2452 | 0.2492 | −0.41 |
| Mark-down | 0.2337 | 0.2473 | −1.36 |
Comparison of the steady state transition probability matrix of stock prices and natural logarithm of stock prices.
Going forward, the logarithmic-modified transition probability matrix converged at third power, a step faster than that of the ordinary transition probability matrix which converged at the fourth power. In addition, the true direction of the stock cycles appeared to be misleading when the changing variance is not accounted for. The findings of this study are in agreement with previous studies of [7–15], and that Markov chain approach is sufficient for modeling stock/investment trends but proud of its novelty by application of logarithmic transformation of the transition matrix and provided the needed improvement to the study of [9]. The implication is that, a quicker convergence with higher precision estimates of the steady state probabilities is achieved when the variance is stabilized.
4. CONCLUSION
Concisely, the findings of the study showed that the logarithmic-modified approach to Markov chain modeling of the investment trends results in a faster convergence rate of the steady state transition probability with robust probabilities than the ordinary approach. Thus the aim of this study is sufficed by these findings. The weakness of the study is its inability to assess the expected number of stocks in the long run using logarithmic-modified approach and it is therefore recommended to be undertaken in our future studies.
CONFLICTS OF INTEREST
The authors declare no conflicts of interest regarding the publication of this paper.
AUTHORS' CONTRIBUTIONS
MIU designed the study and wrote the first draft. JAU managed the literature search, manuscript writing and data collection. EAA managed the analysis. All authors read and approved the final manuscript.
DATA AVAILABILITY STATEMENT
The authors confirm that the data supporting the findings of the study are available within the article.
ACKNOWLEDGMENTS
The authors received no specific funding for this article.
REFERENCES
Cite this article
TY  - JOUR
AU  - Imoh Udo Moffat
AU  - James Augustine Ukpabio
AU  - Emmanuel Alphonsus Akpan
PY  - 2020
DA  - 2020/10/16
TI  - Modeling Investment Trends: A Logarithmic-Modified Markov Chain Approach
JO  - Journal of Statistical Theory and Applications
SP  - 439
EP  - 445
VL  - 19
IS  - 3
SN  - 2214-1766
UR  - https://doi.org/10.2991/jsta.d.201006.001
DO  - 10.2991/jsta.d.201006.001
ID  - Moffat2020
ER  -