
EEG based Drowsiness Detection using Relative Band Power and Short-time Fourier Transform
- DOI
- 10.2991/jrnal.k.200909.001How to use a DOI?
- Keywords
- Drowsiness; polysomnography; band power; short-time Fourier transform
- Abstract
Sleeping on the wheels due to drowsiness is one of the major causes of death tolls all over the world. The objective of this research article is to classify drowsiness with alertness based on the Electroencephalogram (EEG) signals using spectral and band power features. A publicly available ULg DROZY database used in this research. Algorithms are developed to extract the five EEG channels from the raw multimodal signal. By using a higher-order Butterworth low pass filter, the high-frequency components above 50 Hz are removed. Another bandpass filter bank separates the raw signals into eight sub-bands, namely delta, theta, low alpha, high alpha, low beta, mid beta, high beta and gamma. During pre-processing step, the signals are segmented into an equal number of frames. An overlap of 50% and a frame duration of 2 s using a rectangular time windowing approach segments the signal into frames. Then, the feature extraction algorithm extracts the relative band power features based on the short-time Fourier transform for each frame. The extracted feature sets are further normalized and labelled as drowsy and alert and then combined to form the final dataset. K-fold cross-validation method is used. The dataset is trained using K-Nearest Neighbor algorithm (KNN) and support vector machine classifiers, and the results are compared. The KNN classifier produces 96.1% (dataset 1) and 95.5% (dataset 2) classification accuracy.
- Copyright
- © 2020 The Authors. Published by Atlantis Press B.V.
- Open Access
- This is an open access article distributed under the CC BY-NC 4.0 license (http://creativecommons.org/licenses/by-nc/4.0/).
1. INTRODUCTION
Amongst the various drowsiness detection techniques, the physiology-based methods involve the physiological signals. The Electroencephalogram (EEG) method yields high accuracy and is referred to as the gold standard. Thus, the physiology-based process produces high efficiency and reliability in detecting drowsiness at an early stage. The EEG signal, which is the most preferred physiological signal, has the closest association with sleepiness. The drawbacks of the EEG signals are that, as they have high temporal resolution and can be easily interfered by Electromyogram (EMG), eye blink and electromagnetic noise [1,2].
Drowsy driving is a vital issue and hence need to be identified at the earliest. Drowsiness has subsequent effects. (a) Driver’s reduced attention to surroundings, (b) considerable delay in reaction time, and (c) affect the driver’s capability to make decisions. The literature study attempts to review all the previous approaches in detecting drowsiness. Drivers involved in sleep-related crashes rate their quality of sleep was either inadequate or fair [3]. Missing an hour of sleep can lead to car crash risk. The only antidote for drowsiness is sleep [4].
The effects of sleepiness on wheels have been widely studied in the literature [5–8]. Few researcehers have attempted to use single channel EEG approach to classify drowsiness [9–16].
The remainder of this paper is organized as follows: Section 2 presents the multimodal DROZY database. Section 3 describes the feature extraction and modelling of drowsiness detection. The results are presented and discussed in detail in Sections 4 and 5, respectively. Section 6 presents the conclusions presented in this paper.
2. DROZY DATABASE
The ULg multimodality drowsiness (DROZY) database is considered in this research as it contains multimodal approach. The complete details of the multimodal data collection, data description and the protocol are represented in Figure 1 [17].
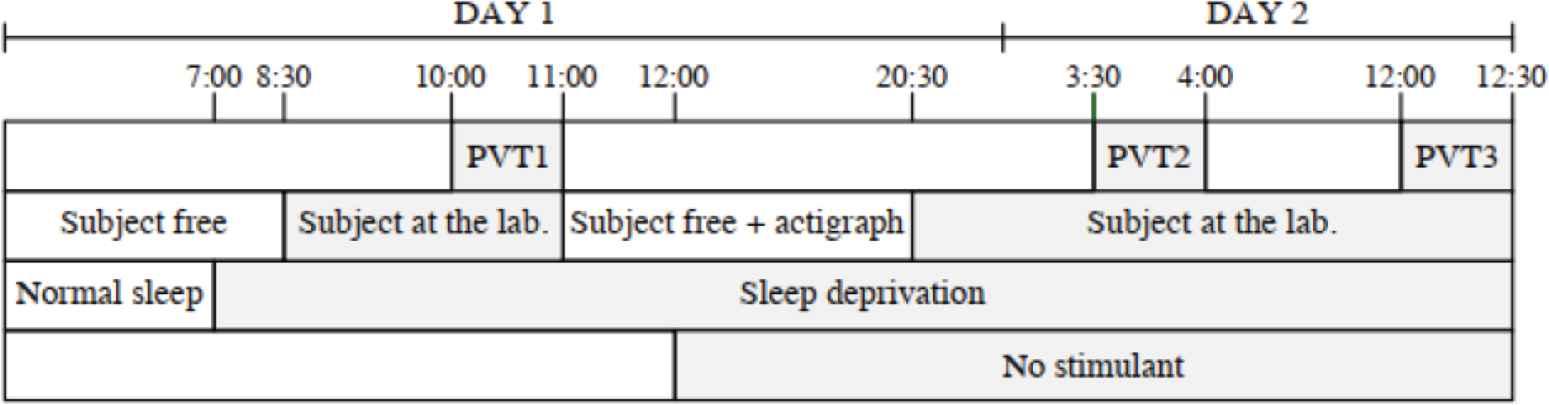
Protocol design during the data collection [17].
The database contains physiology related signals, i.e., EEG, Electrooculogram (EOG), Electrocardiogram (ECG), and EMG. By using the Embla Titanium system, the signals were recorded from EEG channels Fz, Pz, Cz, C3, and C4 referenced at A1 in the international 10–20 system. The vertical and horizontal EOG signals, EMG and ECG signals were also recorded at a sampling rate of 512 Hz. Along with these signals, video signals were also recorded. The drowsiness and alert signals were recorded from 14 male and female subjects. The test was conducted in a controlled environment in three trials. Before the first trial, the subjects were asked to have a good sleep pattern for the past week. In the first trial, the subjects were asked to perform an action watching the screen. After the first trial, the subjects were asked to stay awake for 36–38 h to keep them sleep-deprived. In the second and third trials, the subjects performed the same previous experiment. Post the final test, and the subjects were asked to take a sound sleep before they drive back home.
3. METHODOLOGY
3.1. Data Description
The experiment was conducted in three trials in 2 days, as mentioned in the protocol. The authors conducted a widely used tool to measure the performance impairments due to drowsiness using a 10-min psychomotor vigilance test. This test gives the reaction time to visual or auditory stimuli that occur at the random inter-stimulus interval. The database contains PSG signals from 11 electrophysiological signals (five EEG, two EOG, one ECG and one EMG) are considered. The five EEG channels are recorded from C3, C4, Cz, Pz, and Fz locations present in the central lobe of the brain. The placement of the EEG channels is depicted in Figure 2. The sensors placed around C3, C4 and Cz locations deal with the sensory and motor functions. C3 and C4 gave the best seizure detection performance. This research uses monopolar montage with C3 as a reference. The vertical and horizontal EOG signals are recorded from above and at the side of the right eye to capture the eye blinks. An ECG channel is recorded from the electrode placed on the chest. An EMG signal is recorded from the electrode placed on the neck of the participant.
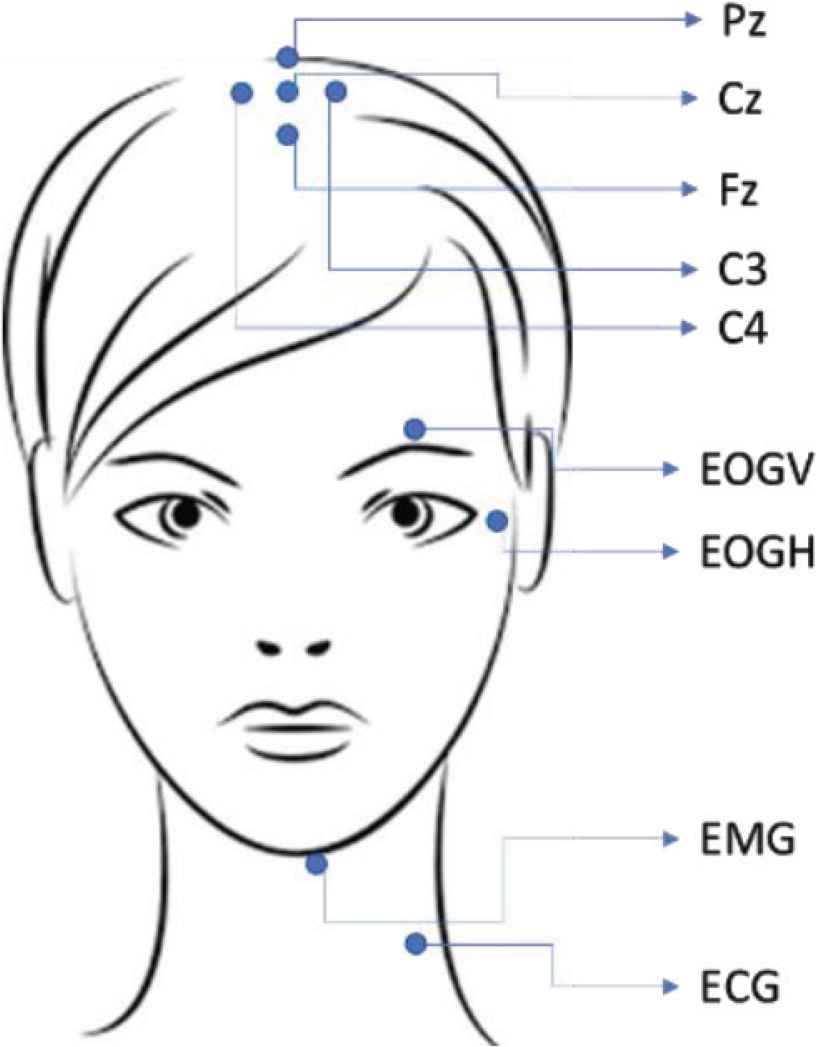
Multimodal electrode placement during the trials.
3.2. EEG Signal Processing
Electroencephalogram signals are the non-invasive physiological means of measuring brain activity. It has the closest relationship with drowsiness. The EEG has a neural domain signal information has high temporal resolution but can be easily interfered by EMG, eye blink and electromagnetic noise [18]. The EEG, along with the EMG, ECG, and EOG signals, remains the European data format. A MATLAB function is used to extract only the EEG signals, which is of the interest in this research. The experiment was conducted for 10 min, and the EEG signal contains information up to 600 s. The signals are recorded at 512 Hz sampling frequency. The signals include both EOG and EMG, which contribute toward the drowsiness detection. Hence the eye blink artefacts and the EMG artefacts which are removed in conventional biosignal processing is avoided in this research. The raw signal is processed directly without any artefact’s removal. However, a Butterworth low pass filter with a cut-off frequency of 50 Hz is designed, and the high-frequency components are eliminated.
3.3. Sub-Banding of EEG Signals
From the literature, the specific frequency ranges from the EEG signals such as alpha, beta, theta, gamma and delta are extracted using a suitable bandpass filter [19–21]. A Butterworth bandpass filter bank with eight frequency bands is designed and used to extract the sub-bands of the EEG signals. The details of the eight sub-bands are listed in Table 1.
| Wave type | Frequency (Hz) | Nature | Optimal |
|---|---|---|---|
| Delta | 0.1–4 | Very slow | Deep sleep |
| Theta | 4–8 | Slow | Depression |
| Low Alpha | 8–9 | Moderate | Relaxation |
| High Alpha | 9–12 | Moderate | Relaxation |
| Low beta | 12–16 | High | Conscious |
| Mid beta | 16–20 | High | Blinking |
| High beta | 20–30 | High | Agitation |
| Gamma | 30–50 | Very high | Cognition |
EEG subband filtering
3.4. Frame Analysis and Overlap
The raw signal is recorded for 10 min. It is difficult to apply any feature extraction methods to the whole signal. Hence the signal is divided using a time window. Signal epoch: Specific time windows are extracted from the continuous EEG signal. These time windows are called epochs. On a trial and error method, the time windows are selected based on the performance metrics. In this approach, a 2-s sliding window is chosen to segment the raw EEG signal.
4. FEATURE EXTRACTION
Dimensionality reduction plays an essential role in classifier performance. Dimensionality reduction is achieved either by feature extraction or feature selection. For both feature extraction and feature selection approach, feature evaluation criterion, the dimensionality of the feature space and optimization procedure are required. Feature extraction is the transformation of the original data to a data set with the selected number of variables which contains the most discriminatory information. Feature extraction, on the other hand, considers the whole original data and maps the useful information into a lower-dimensional space.
4.1. Windowing and Short-time Fourier Transform
During each trial of the experiment is recorded for an average of 10 min which is approximately 600 s. All the signals are read, and the maximum length of the signal is calculated and taken as reference. For those signals where the length is short, zeros are padded at the end to lengthen the signal so as to make all signals even. The raw EEG signal is segmented into 2 s pulses. After segmenting the signals into frames of 2 s with the windowing technique, the original raw signal grows to 300 per each subject per each trial, thereby enhancing the data.
For each frame, the average relative power (power in the specific band over total power) in the low alpha, high alpha and delta bands are calculated from the EEG power spectrum, computed using a Short-time Fourier Transform (STFT) using Eq. (1) [18]
Short-time Fourier transform is a frequently used feature extraction technique in which separation of stationary signals is performed into small fragments. The process is computed to extract the features from both alert and drowsy databases.
5. DATA PROCESSING
Finally, the output class is mapped according to the state of alertness or drowsiness. The database contained one trial for alert and two trials for drowsy situations. The extracted feature sets were further normalized and marked as ‘1’ for the features from the drowsy trial, and ‘0’ for the features extracted from the alert trial. The mixture of trial 1 (alert) and trial 2 (drowsy1) formed the final dataset 1 while the trial 1 (alert) and trial 3 (drowsy2) formed the final dataset 2. The dataset is split into training and testing using the K-fold cross-validation method. The final dataset was rescaled based on the bipolar normalization method between 0 and 1.
6. CLASSIFICATION MODEL
k-Nearest Neighbor algorithm (k-NN) is implemented using ‘fitcknn’ function in MATLAB. The K factor, training error rate and validation error rate and adjusted accordingly. The number of neighbor’s value was set to 3 while ‘minkowski’ method is used as a distance metric to classify the two classes ‘alert’ and ‘drowsy’.
Support Vector Machine (SVM) classifies between classes by finding the hyperplanes, which are a very crucial task in SVM. The ‘fitcsvm’ function in MATLAB is used to model the SVM. ‘Radial basis function’ kernel is used to classify between drowsy and alert classes.
7. RESULTS
Classifiers are evaluated based on the ease to interpret output, calculation time and prediction power. In order to develop a binary classification, the trial 1 data are labelled as alert while the trial 2 and 3 data are labelled as drowsy. Once the feature set is extracted, the output class is labelled accordingly, and the final dataset is processed.
8. DISCUSSION
The anomaly in the delta and alpha sub-bands are extracted using the entropy and band power features. The hypothesis, during this study, is to evaluate the alpha and delta activities. The alpha activity is inversely proportional to the delta activity during drowsiness. Microsleep is a temporary occurrence of sleep or sleepiness which may last from a fraction of a second to 2 min. Microsleeps occur while the person’s eyes are open. It is a straight result of sleep deprivation. Frequent blinking, sudden body jerk, a blank stare, head dropping are the results of microsleep. Also called as daytime drowsiness. During microsleep, there is an increase in theta and alpha waves for more than 3 s [8].
9. CONCLUSION
This study presented a method for detection and classification of drowsiness based on the EEG signal using STF transformation technique. The publicly available DROZY database from ULg was considered for the reason that it contains multimodal signals. Five EEG channels (C3, C4, Cz, Pz, Fz) were extracted from the database. The high-frequency components are not of the interest for this research, and they are removed using a higher-order low pass filter with a cut-off frequency at 50 Hz. The low pass filtered signal was further divided into eight sub-bands, namely delta, theta, low alpha, high alpha, low beta, mid beta, high beta and gamma using a Butterworth bandpass filter. The signal was recorded for 600 s (10 min) which is tedious to analyze the whole signal, and hence the raw signal was divided into frames using a rectangular window with an overlap of 50%. The STFT was computed for all the sub-bands on a frame-by-frame analysis. The database contained one trial for alert and two trials for drowsy situations. The extracted feature sets were further normalized and labelled as 1 for the features from the drowsy trial, and ‘0’ for the features extracted from the alert trial. The mixture of trial 1 (alert) and trial 2 (drowsy1) formed the final dataset 1 while the trial 1 (alert) and trial 3 (drowsy2) formed the final dataset 2. The dataset is split into training and testing using the K-fold cross-validation method. KNN and SVM models are trained using the datasets. The performance of the model to classify drowsiness is reported. KNN achieved better classification accuracy than the SVM model (96.1% in dataset 1 and 95.5% in dataset 2) (Table 2).
| Dataset 1 (%) | Dataset 2 (%) | |
|---|---|---|
| KNN | 96.1 | 95.5 |
| SVM | 93.7 | 94.9 |
Average classification accuracy
CONFLICTS OF INTEREST
The authors declare they have no conflicts of interest.
ACKNOWLEDGMENTS
The authors would like to thank the
AUTHORS INTRODUCTION
Dr. Pranesh Krishnan
 He completed his Masters (Mechatronics) and PhD (Mechanical) from Universiti Malaysia Perlis, Malaysia. He obtained his Bachelors (Information Technology) degree from Anna University, India. He is a member of the IEEE and a Graduate Technologist from MBOT. His research interests include Signal Processing, Driver Drowsiness and Machine Learning.
Prof. Dr Sazali Yaacob
 He completed his PhD and MS degrees from the University of Southampton and the University of Surrey, United Kingdom respectively. He has published over 300 articles in conferences and journals. He is a life member of the Institute of Engineers and recipient of several awards.
Mrs. Annapoorni Pranesh Krishnan
 She received her Master’s degree in Technology Management and Bachelor’s degree in Electronics and Instrumentation from Anna University, India. She is currently doing her PhD at Universiti Kuala Lumpur, Malaysia. Her interests include signal processing, operations research and automotive supply chain.
Dr. Mohamed Rizon
 He graduated Doctor of Engineering at Department of Computer Science and Intelligence Systems at Oita University, Japan. He was a Professor of Biomedical Technology at King Saud University, Saudi Arabia in 2010. He served at MIEC, Fuzhou University, China in 2019. Currently, he is a Professor at Department of Electrical and Electronics, UCSI University, Malaysia. MIET, MIEM member.
Dr. Chun Kit Ang
 He received his Bachelor of Engineering Degree with First Class Honors in Mechatronic Engineering from the University of UCSI, Malaysia in the year 2010. By the end of the year 2010, he was attached with Universiti Putra Malaysia for his PhD in Mechanical and Manufacturing Engineering and graduated in the year 2014. Currently, he is the Dean for Faculty of Engineering Technology and Built Environment, UCSI University. He is interested in artificial intelligence, soft computing, robotics, and mechatronics. He has published many papers related to the application of Artificial Intelligence in recent years.
REFERENCES
Cite this article
TY  - JOUR
AU  - Pranesh Krishnan
AU  - Sazali Yaacob
AU  - Annapoorni Pranesh Krishnan
AU  - Mohamed Rizon
AU  - Chun Kit Ang
PY  - 2020
DA  - 2020/09/11
TI  - EEG based Drowsiness Detection using Relative Band Power and Short-time Fourier Transform
JO  - Journal of Robotics, Networking and Artificial Life
SP  - 147
EP  - 151
VL  - 7
IS  - 3
SN  - 2352-6386
UR  - https://doi.org/10.2991/jrnal.k.200909.001
DO  - 10.2991/jrnal.k.200909.001
ID  - Krishnan2020
ER  -