
Real-Time System for Horizontal Asymmetry Analysis on Facial Expression and its Visualization
- DOI
- 10.2991/jrnal.k.190531.002How to use a DOI?
- Keywords
- Facial expression analysis; real-time system; moving image; mouth area; visualization; OpenCV
- Abstract
We report on the development of a real-time system for facial expression horizontal asymmetry analysis and visualization. In this system, the image signal input from a webcam is analyzed using OpenCV, and feature parameters (facial expression intensity) are measured separately for the left and right half regions in the mouth area. Our real-time system then draws a graph expressing facial expression intensity changes. The experimental results obtained thus far suggest that this system could be useful.
- Copyright
- © 2019 The Authors. Published by Atlantis Press SARL.
- Open Access
- This is an open access article distributed under the CC BY-NC 4.0 license (http://creativecommons.org/licenses/by-nc/4.0/).
1. INTRODUCTION
In Japan, society is aging at an unprecedentedly rapid pace, the average age of the population has been increasing, and these trends are expected to continue into the future. We have therefore been studying ways of applying information technology to improving the medical treatment provided to elderly people with psychiatric disorders.
One of our current studies is aimed at analyzing the facial expressions of persons in a moving image captured by webcams. In this study, we developed a real-time facial expression horizontal asymmetry analysis and visualization system. Unlike current and previously used methods [1,2] in which the moving image data are first saved in a Personal Computer (PC) and then analyzed, the moving image in our method is captured by a webcam and analyzed in real-time by using Open Source Computer Vision (OpenCV) image-processing software [3] and a previously proposed feature parameter (facial expression intensity) [1,2] that is based on the mouth area. The visualization method proposed in this paper is based on our reported method [4] which involves creating a graph from the OpenCV image data for analyzing the relationship between the facial expression intensity and time. This visualization is performed concurrently with the facial expression intensity measurement.
2. PROPOSED SYSTEM AND METHOD
2.1. System Overview and Outline of the Method
In this system, webcam moving imagery captured in real-time is analyzed via the following process. We constructed the modules in our system based on our reported research [4]. First, the sizes of faces in the captured image data are standardized, and then analyzed using OpenCV and our proposed facial expression feature parameters.
The frames of the moving images are then changed from RGB image data into YCbCr image data, after which the Y component obtained from each frame in the dynamic image is used to analyze the facial expressions. The proposed method consists of (1) extracting the mouth area, (2) measuring the facial expressions feature vectors, and (3) measuring the facial expression intensity. In (1), the mouth area is extracted from the frames by using OpenCV. In (2), for the Y component of the selected frame, facial expressions feature vectors are extracted for each 8 × 8-pixel section. In (3), the facial expression intensity, which is defined as the norm difference between the facial expression feature vector, which has 15 elements, of the reference and target frames, is measured. These details are explained in the following subsections.
2.2. Mouth Area Extraction
First, moving image data are changed from RGB to YCbCr image data, after which, by using OpenCV, the face area is extracted from the changed image as a rectangular shape, and the lower 40% portion of the face area is standardized. Next, the mouth area is extracted from that area. The reason the mouth area was selected for facial expression analysis is because it is where the differences between neutral and happy facial expressions appear most distinctly. An example of a face image and the extracted mouth area image is shown in Figure 1.
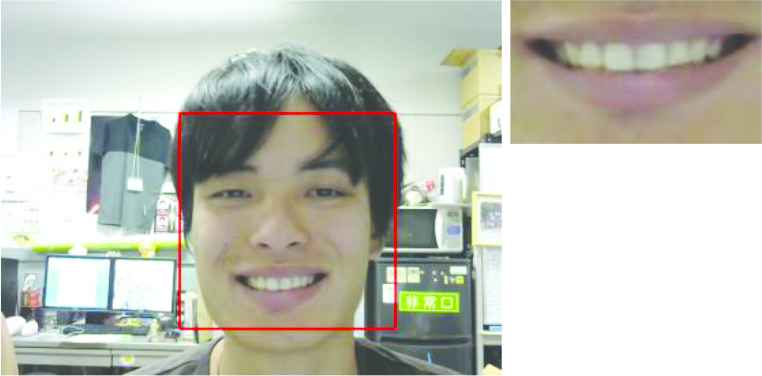
Moving image frame and extracted mouth area.
In this study, the mouth area is separated into left and right half regions, and the facial expression intensity of each region is separately measured. An example of a mouth area separated into the left and right half regions is shown in Figure 2.
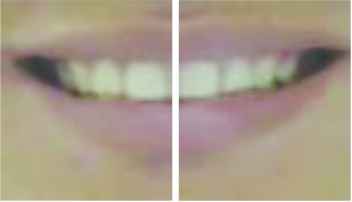
The mouth area separated in the left and right half regions.
2.3. Facial Expression Intensity Measurement
For the Y component of the selected frame, the facial expression feature vector is extracted separately for the left and right half regions of the mouth area; this is performed by using a Two-dimensional Discrete Cosine Transform (2D-DCT) for each section of 8 × 8 pixels. To measure the feature parameters of the facial expressions, we selected 15 low-frequency components from the 2D-DCT coefficients; this did not include the direct current component. Next, we obtained the mean of the absolute value of each of these components separately for the left and right half regions of the mouth area. In total, 15 feature vector elements are obtained for each of left and right half regions. As mentioned above, facial expression intensity is defined the norm difference between the facial expression feature vector of the reference and target frames. The reference frame selection method is explained in next subsection.
2.4. Reference Frame Selection
In this subsection, we propose a new method for automatically selecting reference frames. This method was adopted because, in our new system, the moving image captured by webcam is analyzed in real-time. This means we cannot use our previous method [1,2], which was designed for the non-real-time analysis.
In this method, the first ten continuous frames of mouth area data that are successfully extracted after the webcam recording begins are treated as reference frame candidates. Then, beginning with the first reference frame candidate, the facial expression intensity of all candidate frames is measured, and the sum of all facial expression intensities is calculated. The candidate frame with the minimum value is selected as the reference frame.
2.5. Facial Expression Intensity Visualization
Facial expression intensity is measured using our previously discussed method [4], in which a straight line is drawn on a graph image prepared using OpenCV.
3. EXPERIMENT
In this study, we used a Dell OPTIPLEX 780 PC equipped with Intel Core 2 Duo E8400 3.0 GHz central processing units and 4.0 GB of random access memory. The Microsoft Windows 7 Professional operating system (OS) was installed on the PC and Microsoft Visual C++ 2008 Express Edition was used as the development language.
The newly proposed system display is shown in Figure 3. We performed evaluation experiments for two test subjects (hereafter Subjects A and B) under the three conditions listed below. Furthermore, the message “SMILE, PLEASE!” was flashed on the display screen at points 20 and 40s from the system start.
- 1.
Subjects maintained neutral faces for about 60s.
- 2.
Subjects intentionally smiled when the above message was displayed.
- 3.
Subjects raised the right side of their mouth when the above message was first displayed, and raised the left side of their mouth when the above message was displayed a second time.
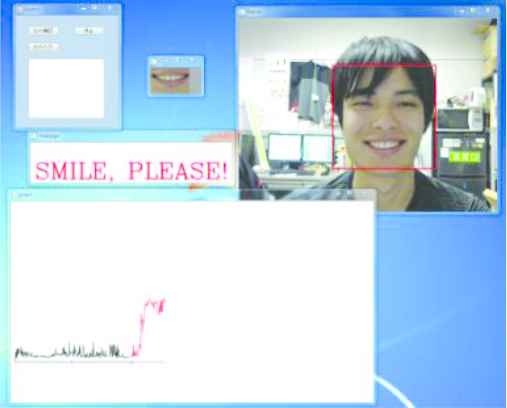
Display while new system is in operation.
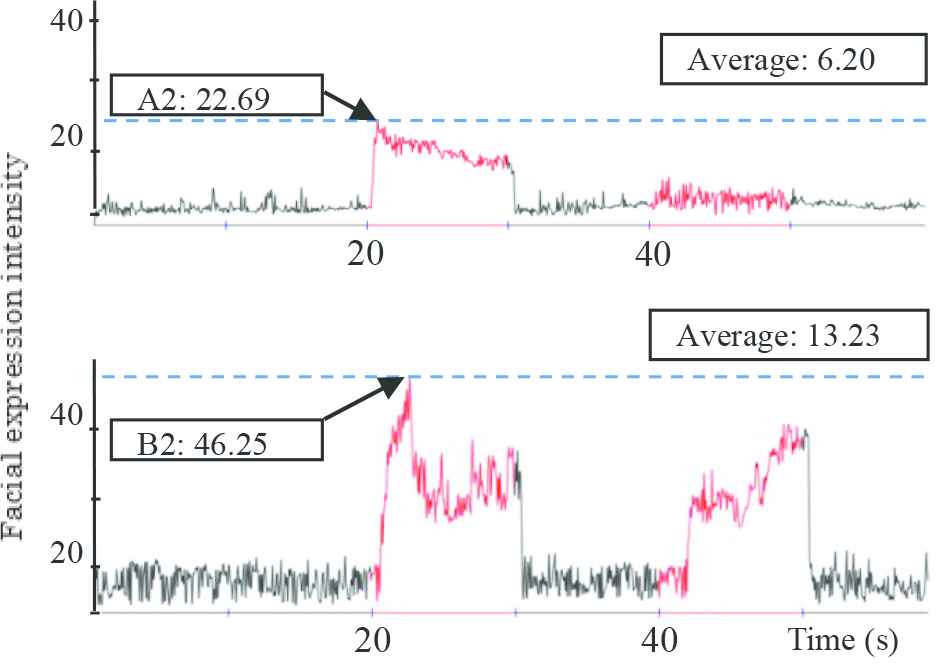
The experimental results are shown in the following figures (Figures 4–16). Arrows in each graph indicate the max point of the facial expression intensity.
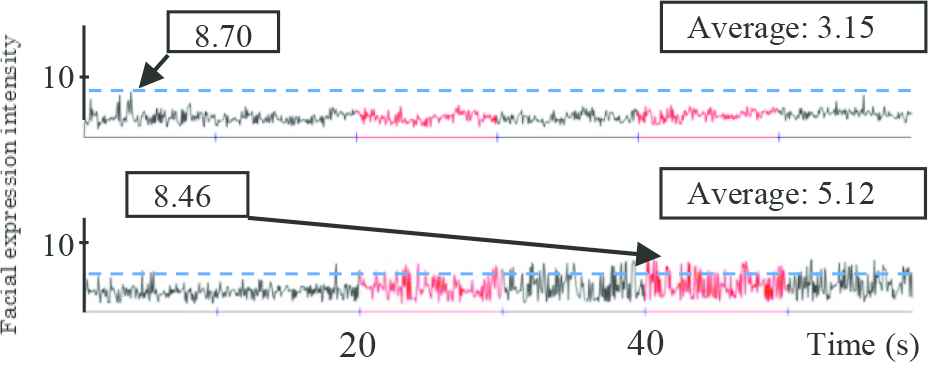
Facial expression intensity of the whole mouth under experimental condition 1 (upper: Subject A, lower: Subject B).
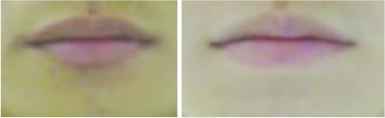
Reference frame under experimental condition 1 (left: Subject A, right: Subject B).
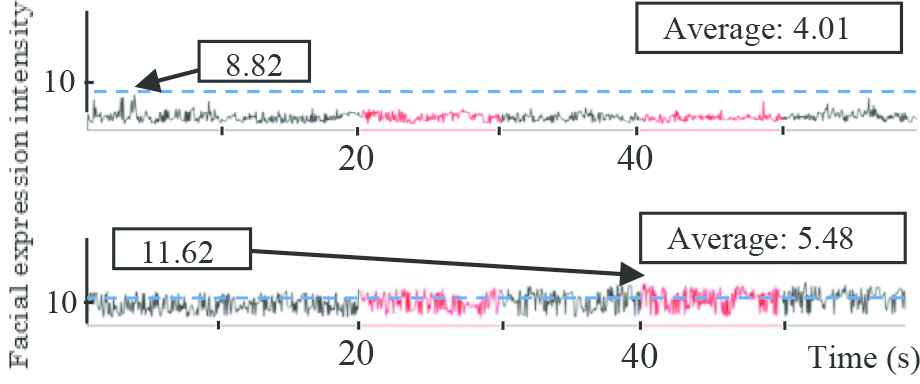
Facial expression intensity of the right half region of the mouth under experimental condition 1 (upper: Subject A, lower: Subject B).
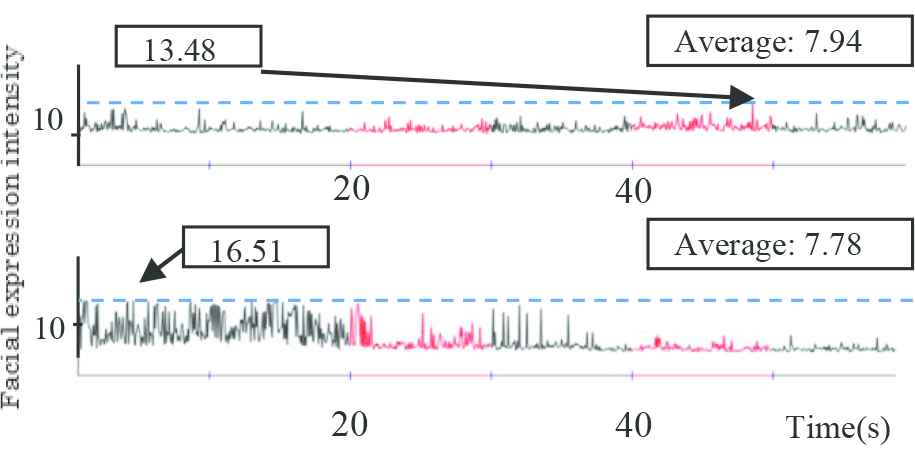
Facial expression intensity of the left half region of the mouth under experimental condition 1 (upper: Subject A, lower: Subject B).
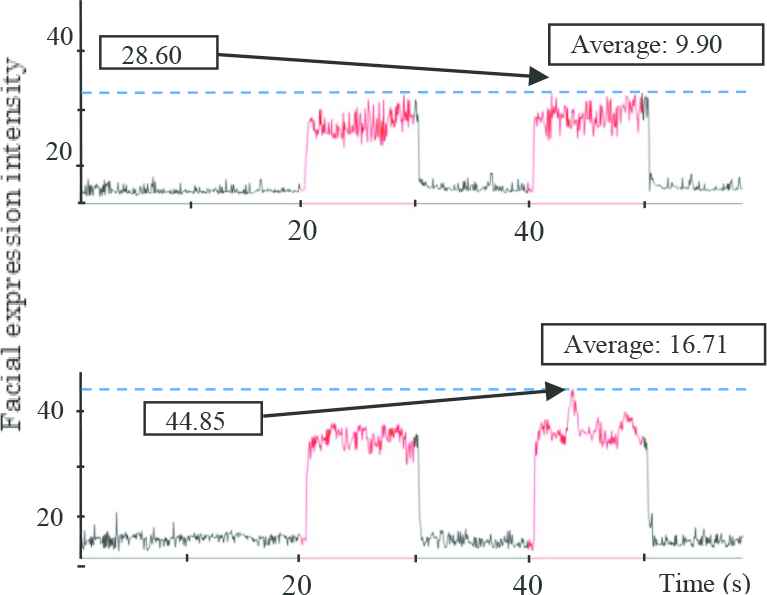
Facial expression intensity of the whole mouth under experimental condition 2 (upper: Subject A, lower: Subject B).
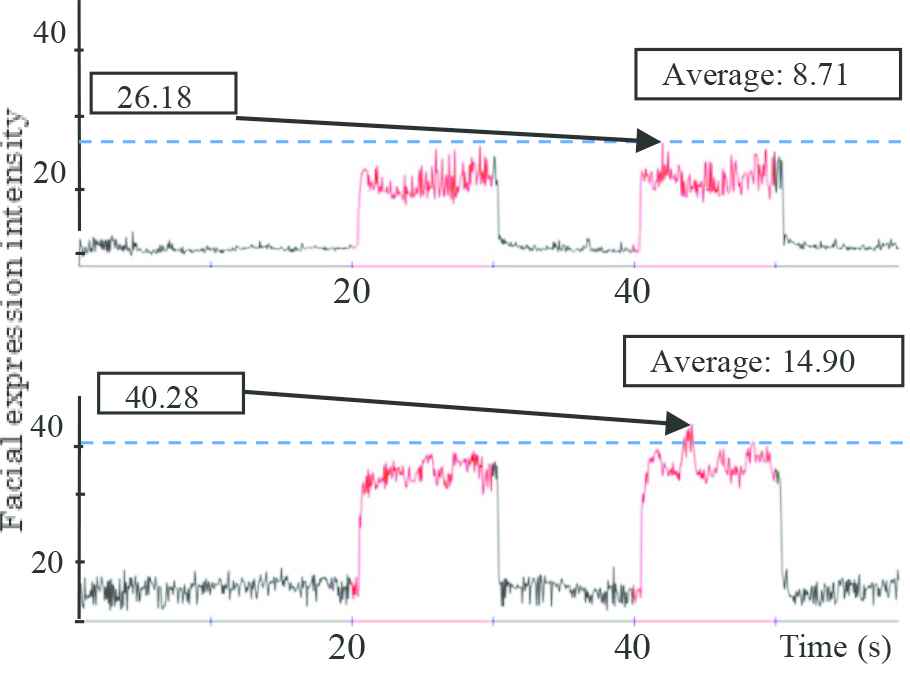
Facial expression intensity of the right half of the mouth under experimental condition 2 (upper: Subject A, lower: Subject B).
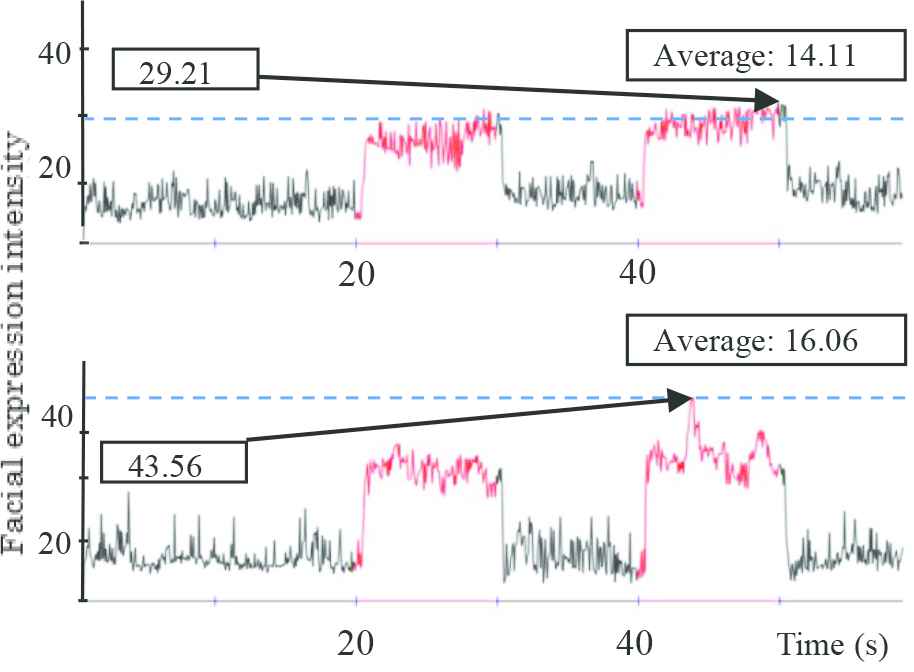
Facial expression intensity of the left half region under experimental condition 2 (upper: Subject A, lower: Subject B).
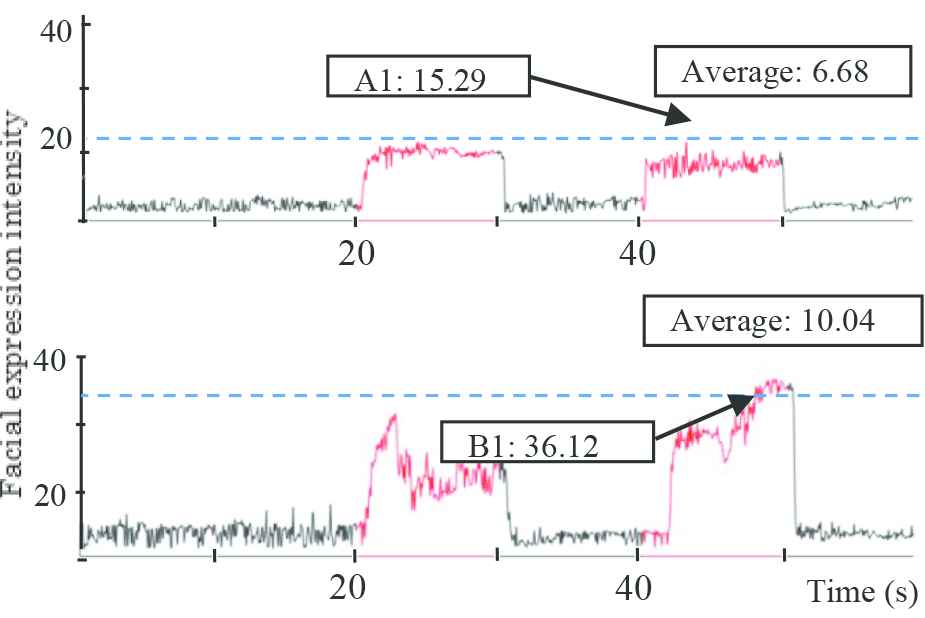
Facial expression intensity of the whole mouth under experimental condition 3 (upper: Subject A, lower: Subject B).
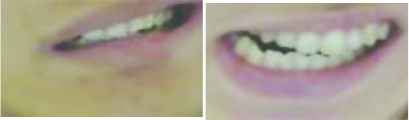
Mouth area of point A1 (left) and point B1 (right).
Facial expression intensity of the right half of the mouth under experimental condition 3 (upper: Subject A, lower: Subject B).
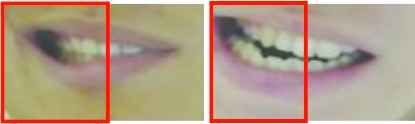
Right half mouth area of point A2 (left) and point B2 (right).
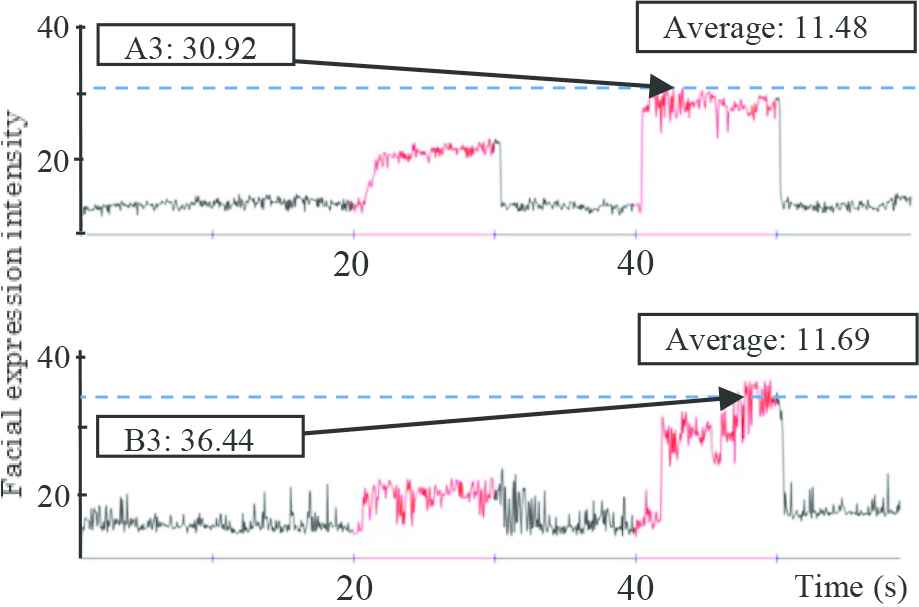
Facial expression intensity of the left half region under experimental condition 3 (upper: Subject A, lower: Subject B).
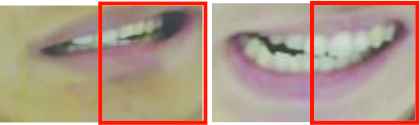
Left half mouth area of point A3 (left) and point B3 (right).
The experimental results obtained thus far suggest that this system could be useful for situations where real-time reaction to facial expressions is one of the important factors. Upon examining the experimental results, some problems were discovered. Facial expression intensities on the left half of the subject’s faces during neutral face recording were always higher than those of the right half, and the reason for this discrepancy is unclear.
4. CONCLUSION
We proposed a real-time system for facial expression horizontal asymmetry analysis and visualization and performed a number of evaluation experiments. It is believed that this system could prove useful in the treatment of psychiatric ailments such as depressive disorder and dementia, in addition to providing treatment options for persons with half side body paralysis.
CONFLICTS OF INTEREST
There is no conflicts of interest.
ACKNOWLEDGMENTS
The authors would like to thank Professor J. Narumoto of Kyoto Prefectural University of Medicine for his valuable support and helpful advice in the course of this research. We would also like to thank Mr. K. Nishimura, a student of the Graduate School of Kyoto Prefectural University, for his cooperation in the experiments. This research was supported by COI STREAM of the Ministry of Education, Culture, Sports, Science, and Technology of Japan.
Authors Introduction
Mr. Ryoichi Shimada
 He received his B.S. and M.S. degrees from Kyoto Prefectural University in 2015, 2017, respectively. He works at JFE Systems, Inc.
Dr. Taro Asada
 He received his B.S., M.S. and PhD degrees from Kyoto Prefectural University in 2002, 2004 and 2010, respectively. He works as an Associate Professor at the Graduate School of Life and Environmental Sciences of Kyoto Prefectural University. His current research interests are human interface and image processing. HIS, IIEEJ member.
Dr. Yasunari Yoshitomi
 He received his B.E, M.E. and PhD degrees from Kyoto University in 1980, 1982 and 1991, respectively. He works as a Professor at the Graduate School of Life and Environmental Sciences of Kyoto Prefectural University. His specialties are applied mathematics and physics, informatics environment, intelligent informatics. IEEE, HIS, ORSJ, IPSJ, IEICE, SSJ, JMTA and IIEEJ member.
Dr. Masayoshi Tabuse
 He received his M.S. and PhD degrees from Kobe University in 1985 and 1988 respectively. From June 1992 to March 2003, he had worked in Miyazaki University. Since April 2003, he has been in Kyoto Prefectural University. He works as a Professor at the Graduate School of Life and Environmental Sciences of Kyoto Prefectural University. His current research interests are machine learning, computer vision and natural language processing. IPSJ, IEICE and RSJ member.
REFERENCES
Cite this article
TY  - JOUR
AU  - Ryoichi Shimada
AU  - Taro Asada
AU  - Yasunari Yoshitomi
AU  - Masayoshi Tabuse
PY  - 2019
DA  - 2019/06/25
TI  - Real-Time System for Horizontal Asymmetry Analysis on Facial Expression and its Visualization
JO  - Journal of Robotics, Networking and Artificial Life
SP  - 7
EP  - 11
VL  - 6
IS  - 1
SN  - 2352-6386
UR  - https://doi.org/10.2991/jrnal.k.190531.002
DO  - 10.2991/jrnal.k.190531.002
ID  - Shimada2019
ER  -