
Analysis of Team Relationship using Self-Organizing Map for University Volleyball Players
- DOI
- 10.2991/jrnal.2018.5.3.12How to use a DOI?
- Keywords
- Sports science; SOM; machine learning; clustering
- Abstract
In Japan, sports efforts are actively being carried out to host the 2020 Olympic Games. Especially in the field of sports science, researches on ergonomics, development of sports equipment and pattern recognition technology using artificial intelligence are actively researched. In previous research, we developed a clustering algorithm for positioning adaptation and relationships in team sports using self-organizing maps in university rugby players. However, I have not yet confirmed whether the developed algorithm can be applied to other team sports. For this reason, we applied the same algorithm to a university volleyball player. Then, as an algorithm, we verify whether it can be generally used for team sports.
- Copyright
- © 2018 The Authors. Published by Atlantis Press SARL.
- Open Access
- This is an open access article under the CC BY-NC license (http://creativecommons.org/licences/by-nc/4.0/).
1. INTRODUCTION
In Japan, sports efforts are actively being carried out to host the 2020 Olympic Games. Especially in the field of sports science, researches on ergonomics, development of sports equipment and pattern recognition technology using artificial intelligence are actively researched. The budget of Japanese sports in 2016 is 32.4 billion yen, and considering that the budget for 10 years ago was 19 billion yen, it is a doubling momentum.
By the way, victory or defeat in team sports depends on each player’s individual technique, physical strength, and psychological condition. Similarly, it can be said that the suitability of an individual to a certain position in the team affects the team’s performance [1].
In the previous research, Barry and Cureton [1], Nick and Fleishman [2], Larson [3], McCloy and Young [4] and others clustered physical features and conducted factor analysis in investigating sports performance. In Japan, Tokunaga [5] studied the diagnosis criteria for athletic adaptation (i.e., suitability) in sports. These works showed that physical features are one of the strongest factors determining athletic adaptation. However, Matsuda and Singer [6] showed that an athlete, no matter how good his/her physical features, is not athletically suited to team sports without having good motivation in terms of setting goals and training. That is to say, for an individual or team to be successful, a player needs to have both good physical features (e.g., techniques, balance, height, and weight) and good psychological features. For example, Saijo et al. [7] presented the psychological features of Japanese and New Zealand rugby players.
In this way, the suitability of a player in a certain position and the relationships between different positions in team sports are related to physical and psychological features. As it stands now, a coach or selector decides the player suitability and relationships between positions him/herself. However, does it follow that good decisions are made? Previous research has not clarified athlete adaptation to positions and relationships between positions considering both physical and psychological features [8].
In the present study, we develop a clustering algorithm for positioning adaptation and relationships in team sports. We consider the two main types of features, which are physical and psychological features, and introduce the concept of using an algorithm to cluster player features in team sports. In previous works, we developed clustering algorithm using self-organizing maps (SOM) for team relationship map [8,9]. Previous work is adapted in university rugby players. However, I have not yet confirmed whether the developed algorithm can be applied to another team sports. For this reason, we applied the same algorithm to our volleyball players. Then, as an algorithm, we verify whether it can be generally used for team sports.
2. RESEARCH PLAN AND METHOD
2.1. Selection of Sport
We apply a team-sport clustering algorithm to volleyball. Volleyball is selected because a volleyball team is one of the most necessary cooperative works and interaction between a player and teammates.
2.2. Describe the Physical Data and Analysis Using Statistics
Physical data of members of the N university volleyball team were recorded in 2016 December. The N university volleyball team comprised 22 students. There were three RTs (right), six LTs (left), seven CNTs (center), two STs (setter position) and four LBRs. Physical features recorded were height (cm), weight (kg), grasping power (left hand, right hand) (kg), ante flexion (cm), toe touch (cm), jumping side-to-side (times), standing long jump (cm), 9 m dash (three round trips) (s), vertical jumping (cm), and back muscle strength (kg). The data set thus had 11 physical dimensions. Data showing statistically characteristic results could be shown below. It shows the adaptation result of the position derived from the data.
Figure 1 shows the height data. The horizontal axis denotes individual positions. The vertical axis shows the height (cm).
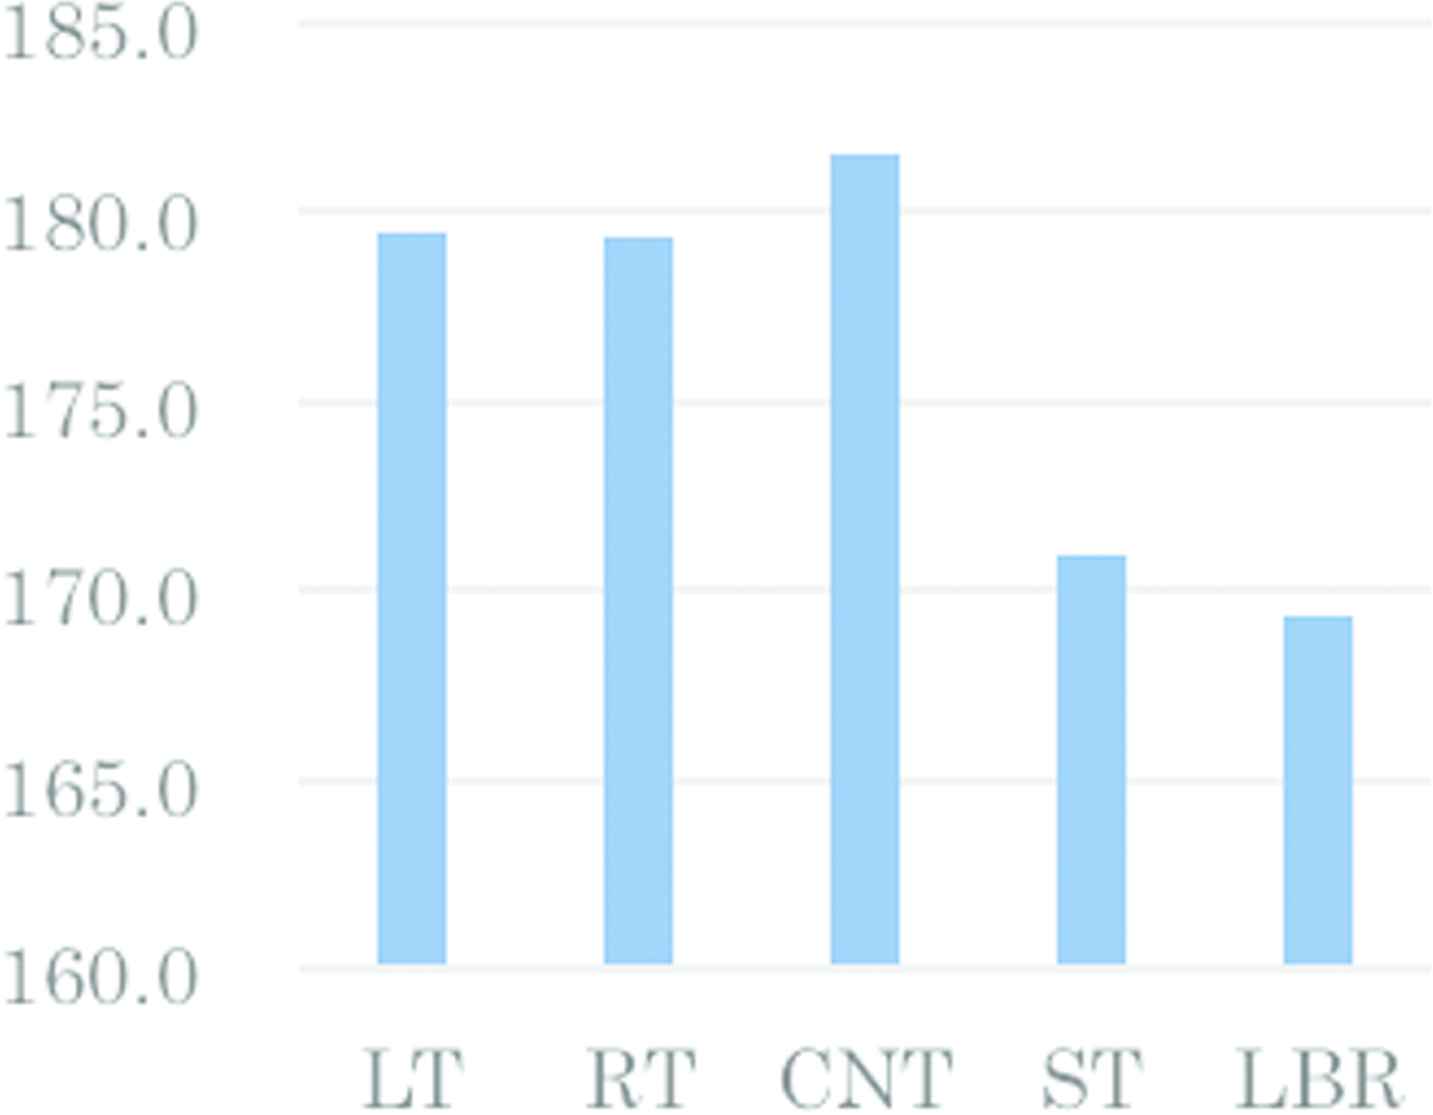
Heights of volleyball players (N university 2016 data)
As you can see from Figure 1, LT, RT and CNT show that players with relatively high stature are selected, and ST and LBR can be said that it is not necessary to be a player with a high height. This shows that the height of LT, RT and CNT is required as an attack such as attack.
Figure 2 shows the result of jumping side-to-side. The vertical axis shows the how many times they can do (times). The horizontal axis denotes individual positions. As you can see from the Figure 2, it shows that only CNT shows a large value. In other words, it can be seen by looking at this figure that the reflexes are necessary for the CNT position. In this way, the suitability of the position can be understood by analyzing several items statistically, but in many items there is not a big difference, it is impossible to decide suitability of the position unconditionally. Also, since the number of population is different as statistical data, it is difficult to find the suitability of the position only by comparing statistical data unconditionally.
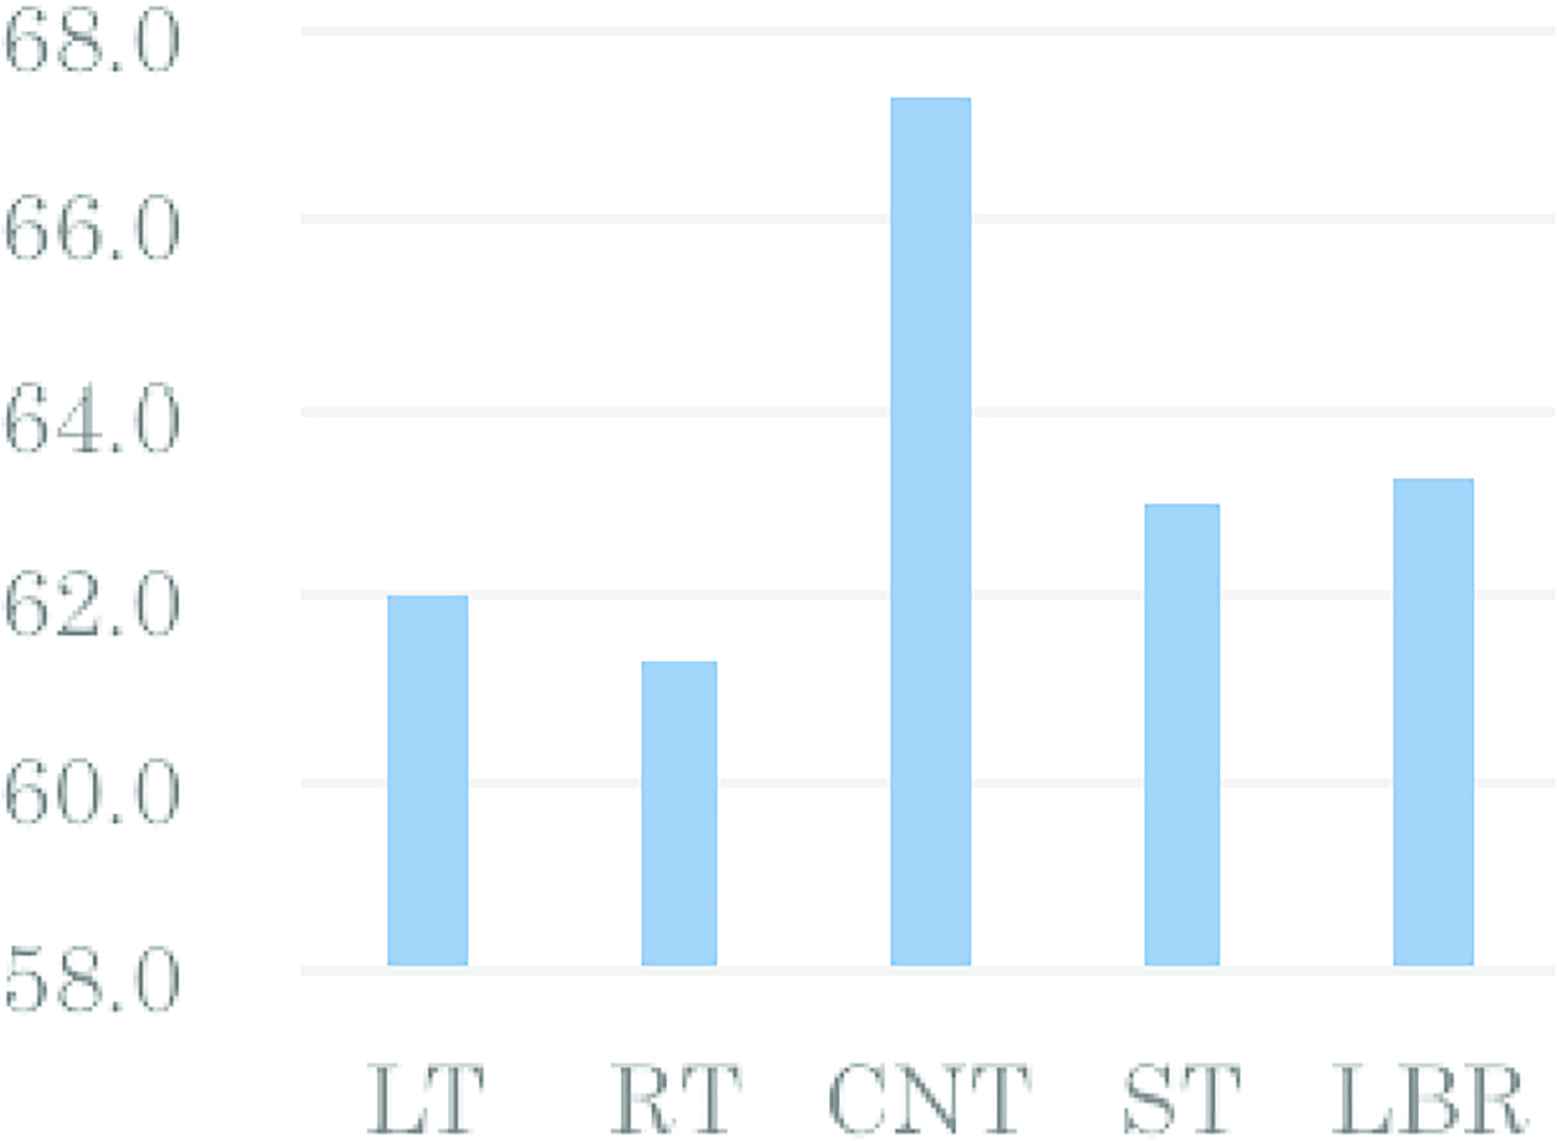
Jumping side-to-side result of volleyball players (N university 2016 data)
2.3. Describe the Psychological Data and Analysis Using Statistics
Psychological data of members of N university volleyball club were recorded in 2016 December. The N volleyball club in 2017 comprised 22 students (There are same members as physical data.).Psychological features measured were those of the Diagnostic Inventory of Psychological Competitive Ability for Athletes (DIPCA.3) [8]. DIPCA.3 measures 12 types of psychological ability in a 48-item questionnaire. DIPCA.3 is often used before mental training, because it reveals athletic strengths and weaknesses. The DIPCA.3 check sheet consists of 48 questions that measure psychological ability and four questions that measure reliability. These questions have already been analyzed by good–poor analysis (G–P analysis), and the answers provide 12 criteria relating to five factors. The factors are motivation in sport, mental stability and concentration, confidence, operation capability and cooperativeness. Additionally, we measure the reliability of the answers by comparing answers to similar questions. To examine these factors in detail, 12 criteria are described. Motivation in sport consists of four criteria: endurance, fighting spirit, self-realization motivation and motivation to win. Mental stability and concentration consist of three criteria: the ability to relax, capacity to concentrate and self-control. Confidence consists of two criteria: determination and confidence. Operation capability consists of two criteria: predictive capability and judgment. Cooperativeness has only one criterion, which is simply described as cooperativeness. DIPCA.3 provides a total score (ability). Each criterion is scored, and the score of each factor is the sum of scores for the related criteria. The total score is calculated by summing the score for each factor. Table 1 gives the total scores, which are classified into five levels. A classification of one indicates a very low overall mental ability and a classification of five indicates a very high ability. Each mass describes the total score. The methodology of DIPCA.3 is such that each person answers the 52 questions on a scale of 1–5 (1: I don’t think so, 2: I rarely think so, 3: I sometimes think so, 4: I often think so, 5: I always think so) within 10–15 min.
| Parameter | Description |
|---|---|
| θ | Training data |
| x | Input vector (physical features) [j = 1–19] |
| y | Input vector (psychological features) [j′ = 1, …. 12] (12 criterion scores) |
| i | Index denoting class (i = 1, /…, l) |
| w | Reference vector |
| k | Index expressing unit (k = 1, …, K) |
| E | Distance between input and reference vector |
| k* | Best matching unit |
| φ | Neighbor function |
| d(a, b) | Euclidean distance between a and b |
| ψ | Learning rate |
| σ | Neighbor radius |
| τ | Time constant |
List of the variables used in a SOM algorithm
Figure 3 shows the evaluation result of DIPCA.3. The horizontal axis denotes each evaluation criteria. The vertical axis shows evaluation value. Each evaluation maximum value is 20 (point). The color bars describe the each position (LT, RT, CNT, ST, and LBR).
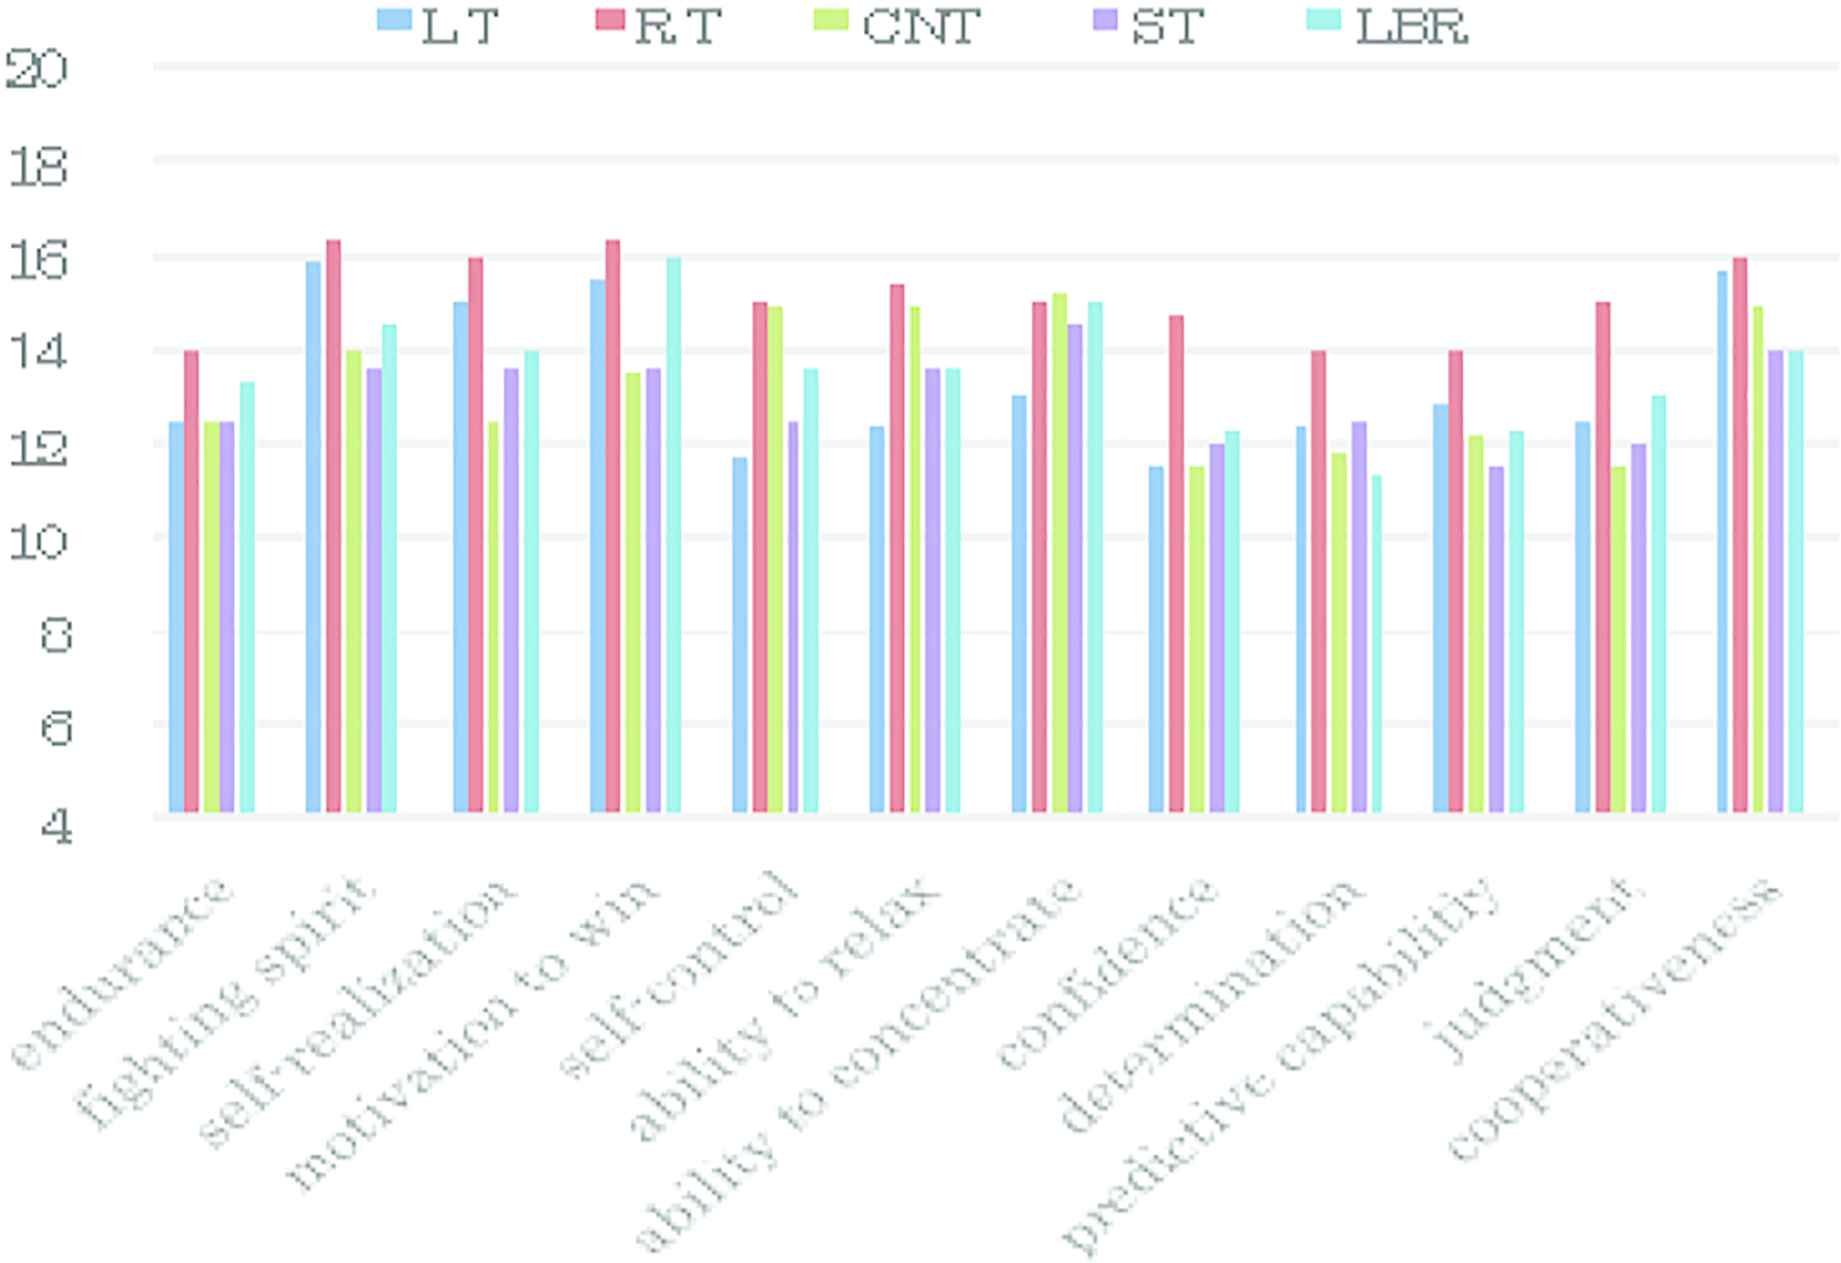
Psychological result using DIPCA.3 (N university 2017)
Comparing the psychological feature quantities, we can see that there is little difference between the positions. On the whole, however, RT knows that athletes with very psychological characteristics are selected. Moreover, as a whole, the ability as fighting sprit, self-realization and motivation to win is high in the team as a whole. Meanwhile, items such as confidence, deamination, endurance, and judgment need to be lowered in capability as whole team members.
3. PROPOSAL ALGORITHM USING SOM
The analysis of physical and psychological features indicates that the conventional statistical method cannot reveal player adaption to positions in team sports and relationships between positions [8,9]. We therefore propose a new method using SOMs. An SOM is a topologically correct feature map proposed by Kohonen and is well known as an attractive tool for extracting the characteristics of data and classifying data into clusters through its self-organizing process. The brains of many higher-order animals appear to achieve a topological relationship through a stream of sensory inputs, and several algorithms have been suggested to duplicate this neural processing. The SOM has an algorithm that is capable of establishing a feature map by learning a random sequence of input samples. Kohonen’s algorithm can be represented in a simple iterative form, thereby demonstrating its computational power. The SOM is an unsupervised learning algorithm for generating a topological transformation from a high-dimensional data vector space to a low-dimensional (usual one- or two-dimensional) space. Higher-dimensional maps are also possible, but are not discussed here. The neurons are programmed for various input patterns or classes of input patterns through a competitive learning process. The SOM algorithm includes four processes: an evaluation, competitive, cooperative, and adaptive process. Table 1 lists the variables used in an SOM algorithm. The training data are defined by Eq. (1), with suffix i denoting the input data set. x and y are normalized from −1 to 1 for input into the SOM algorithm.
3.1. Evaluation Process
In the evaluation process, θi is input into all units, and the square mean errors (differences)
3.2. Competitive Process
In the competitive process, to find the best matching input vector θ for reference vector w, the best matching unit (BMU) (k*) is selected in Eq. (3). That is, the closest environment to θ is selected in the w space.
3.3. Cooperative Process
The learning quantity for each module is calculated according to Eq. (4). The learning distributional rate
Let
3.3.1. Adaptive process
In the Kohonen’s SOM, all unit vectors are adjusted using Eq. (7) in the adaptive process.
4. EXPERIMENTAL RESULT
To evaluate the performance of the SOM algorithm, individually, at first, only x input data sets (only physical data sets) are used same as previous works [8]. Figure 4 shows the feature maps used for the 2017 physical data sets. Each lattice cell describes a unit. If a unit is the BMU for a data set, it is labeled as such as 1st line: number of player and 2nd line: position. The color of the lattice indicates the Euclidian distance to the neighboring unit (Figure 4) and Figures 5 and 6 are described vector values. For example, blue indicates that the neighboring unit is nearby; red indicates that it is far away (Figures 5 and 6 are high score), and green indicates that it is at mid-distance (Figures 5 and 6 are low score).
The feature maps which is inputted physical data sets
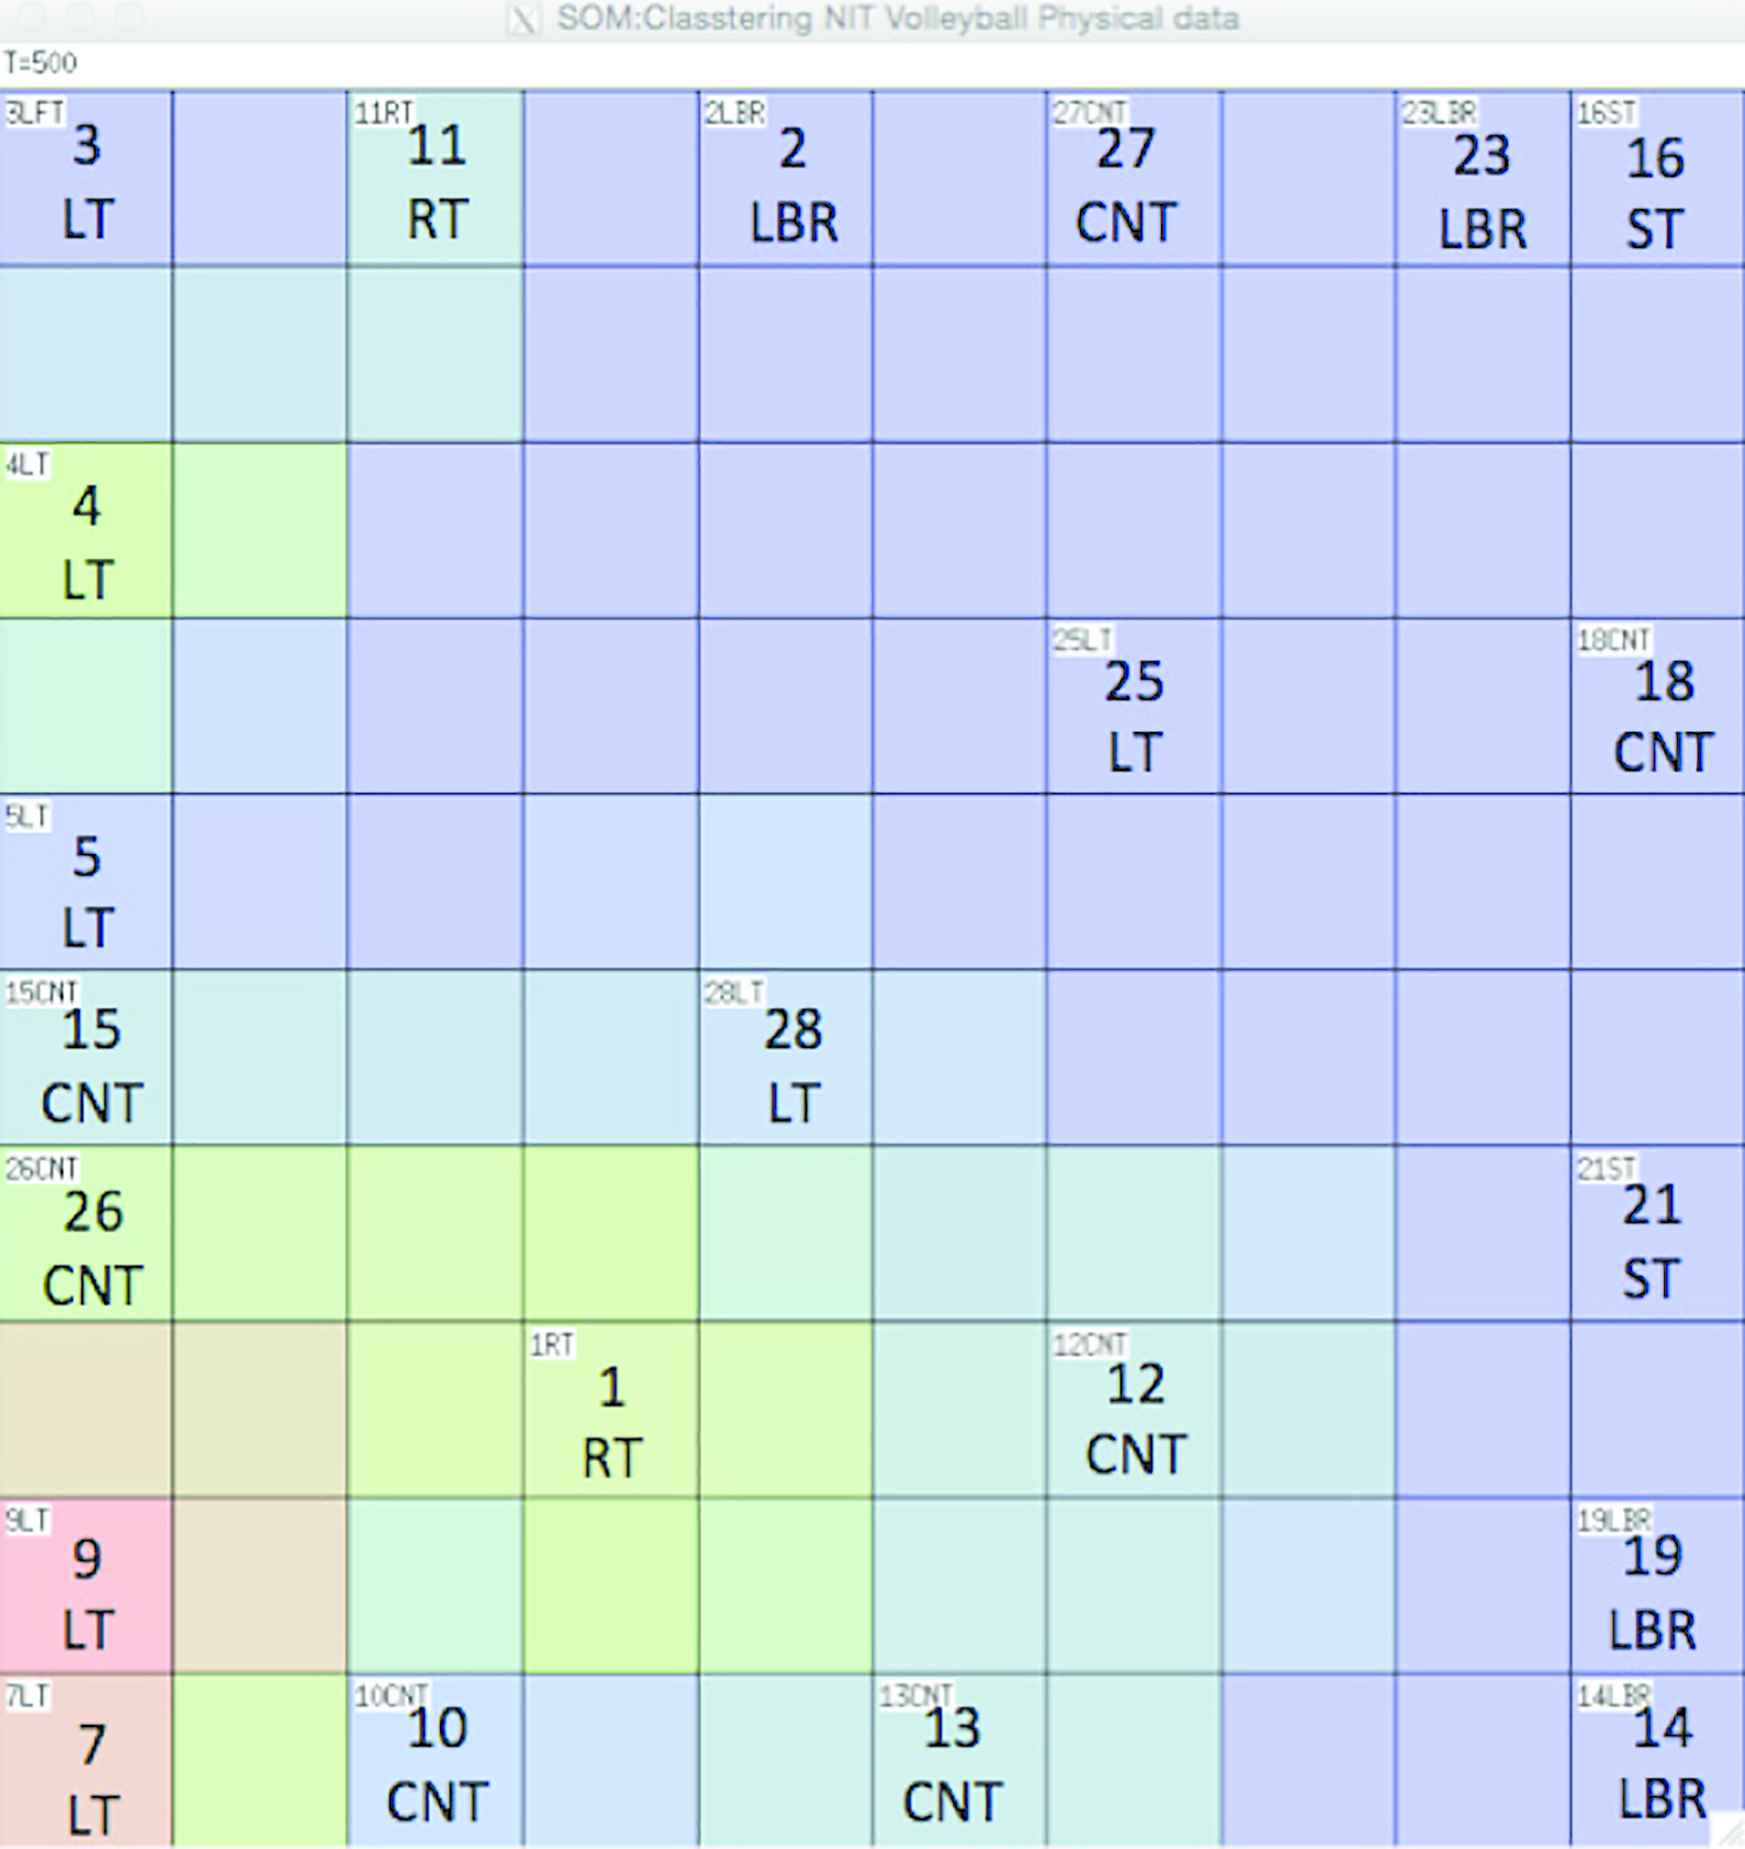
The feature maps of physical data sets which is colored by height data
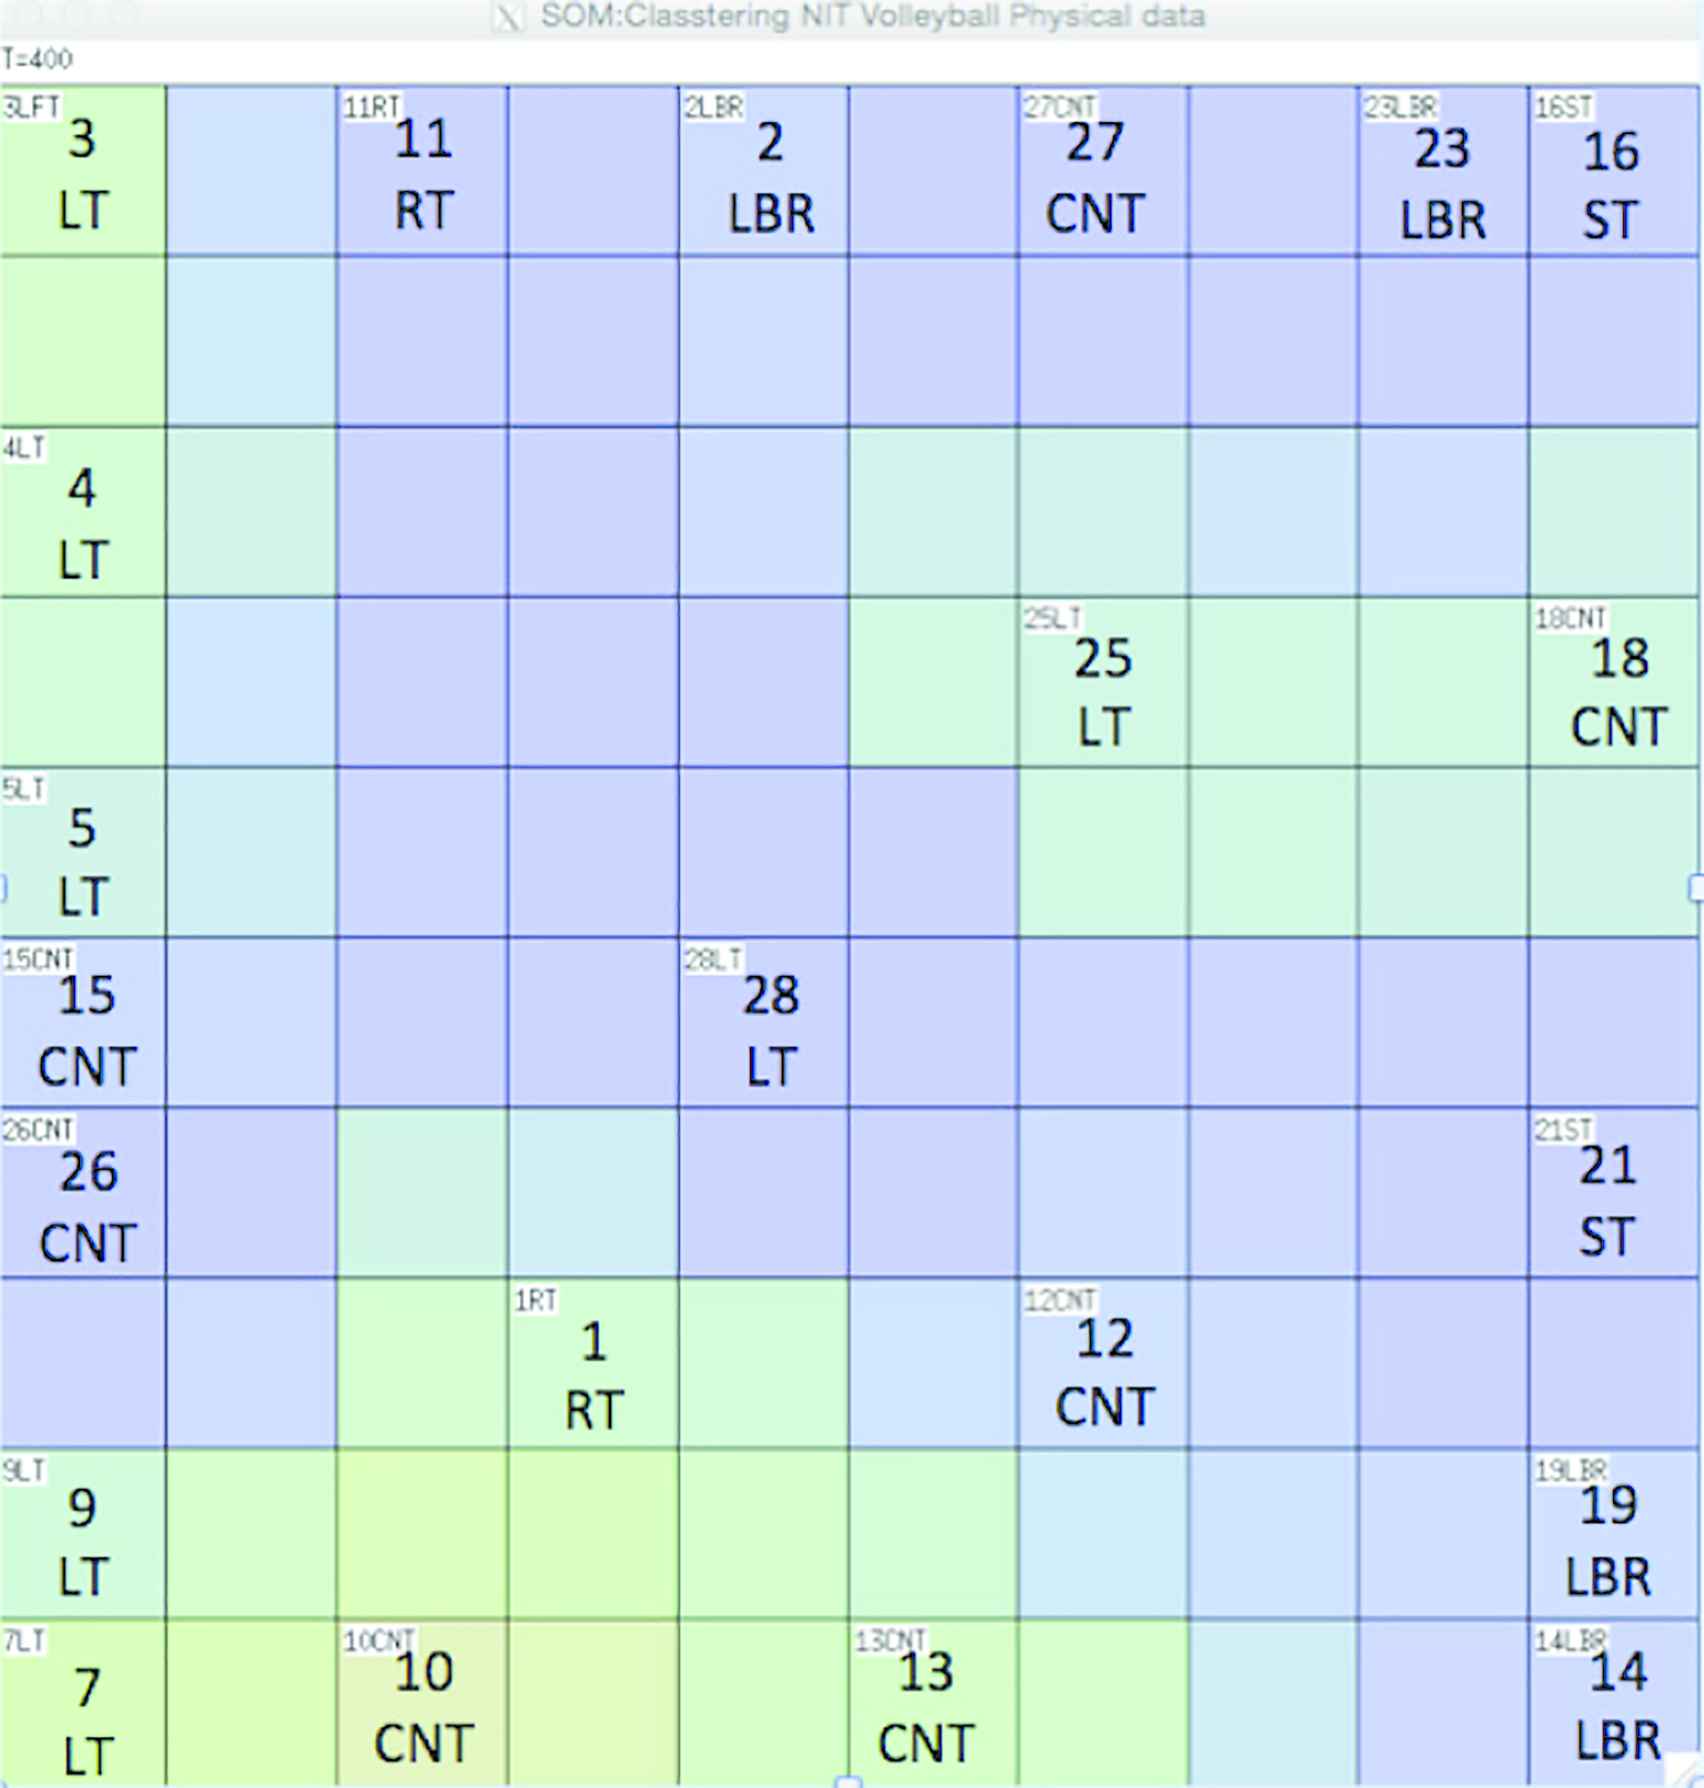
The feature maps of physical data sets which is colored by jump side to side
Figure 4 shows the feature map of physical data. For example, on the left side of the feature map, attack role people is gathered. On the other hand, right side is gathered to deffensive positon people and ST position. Figure 5 shows the same feature maps, however, the color label describe about the height. Looking at this figure, high-height (red lebeled) players are gathered on the left side, and players with relatively low height are gathered on the right side. That is, the same result as statistical data can be obtained also in the feature map using SOM. Next, Figure 6 shows the results of coloring the results of jumps side-to-side. The jumps side-to-side does not have a relatively large difference. However, it turns out that the CNT person shows a relatively high numerical value (green). In this way, similar results to statistics can be found in SOM feature map. However, the suitability of the position within the team was not able to obtain distinctive results even if examining other items.
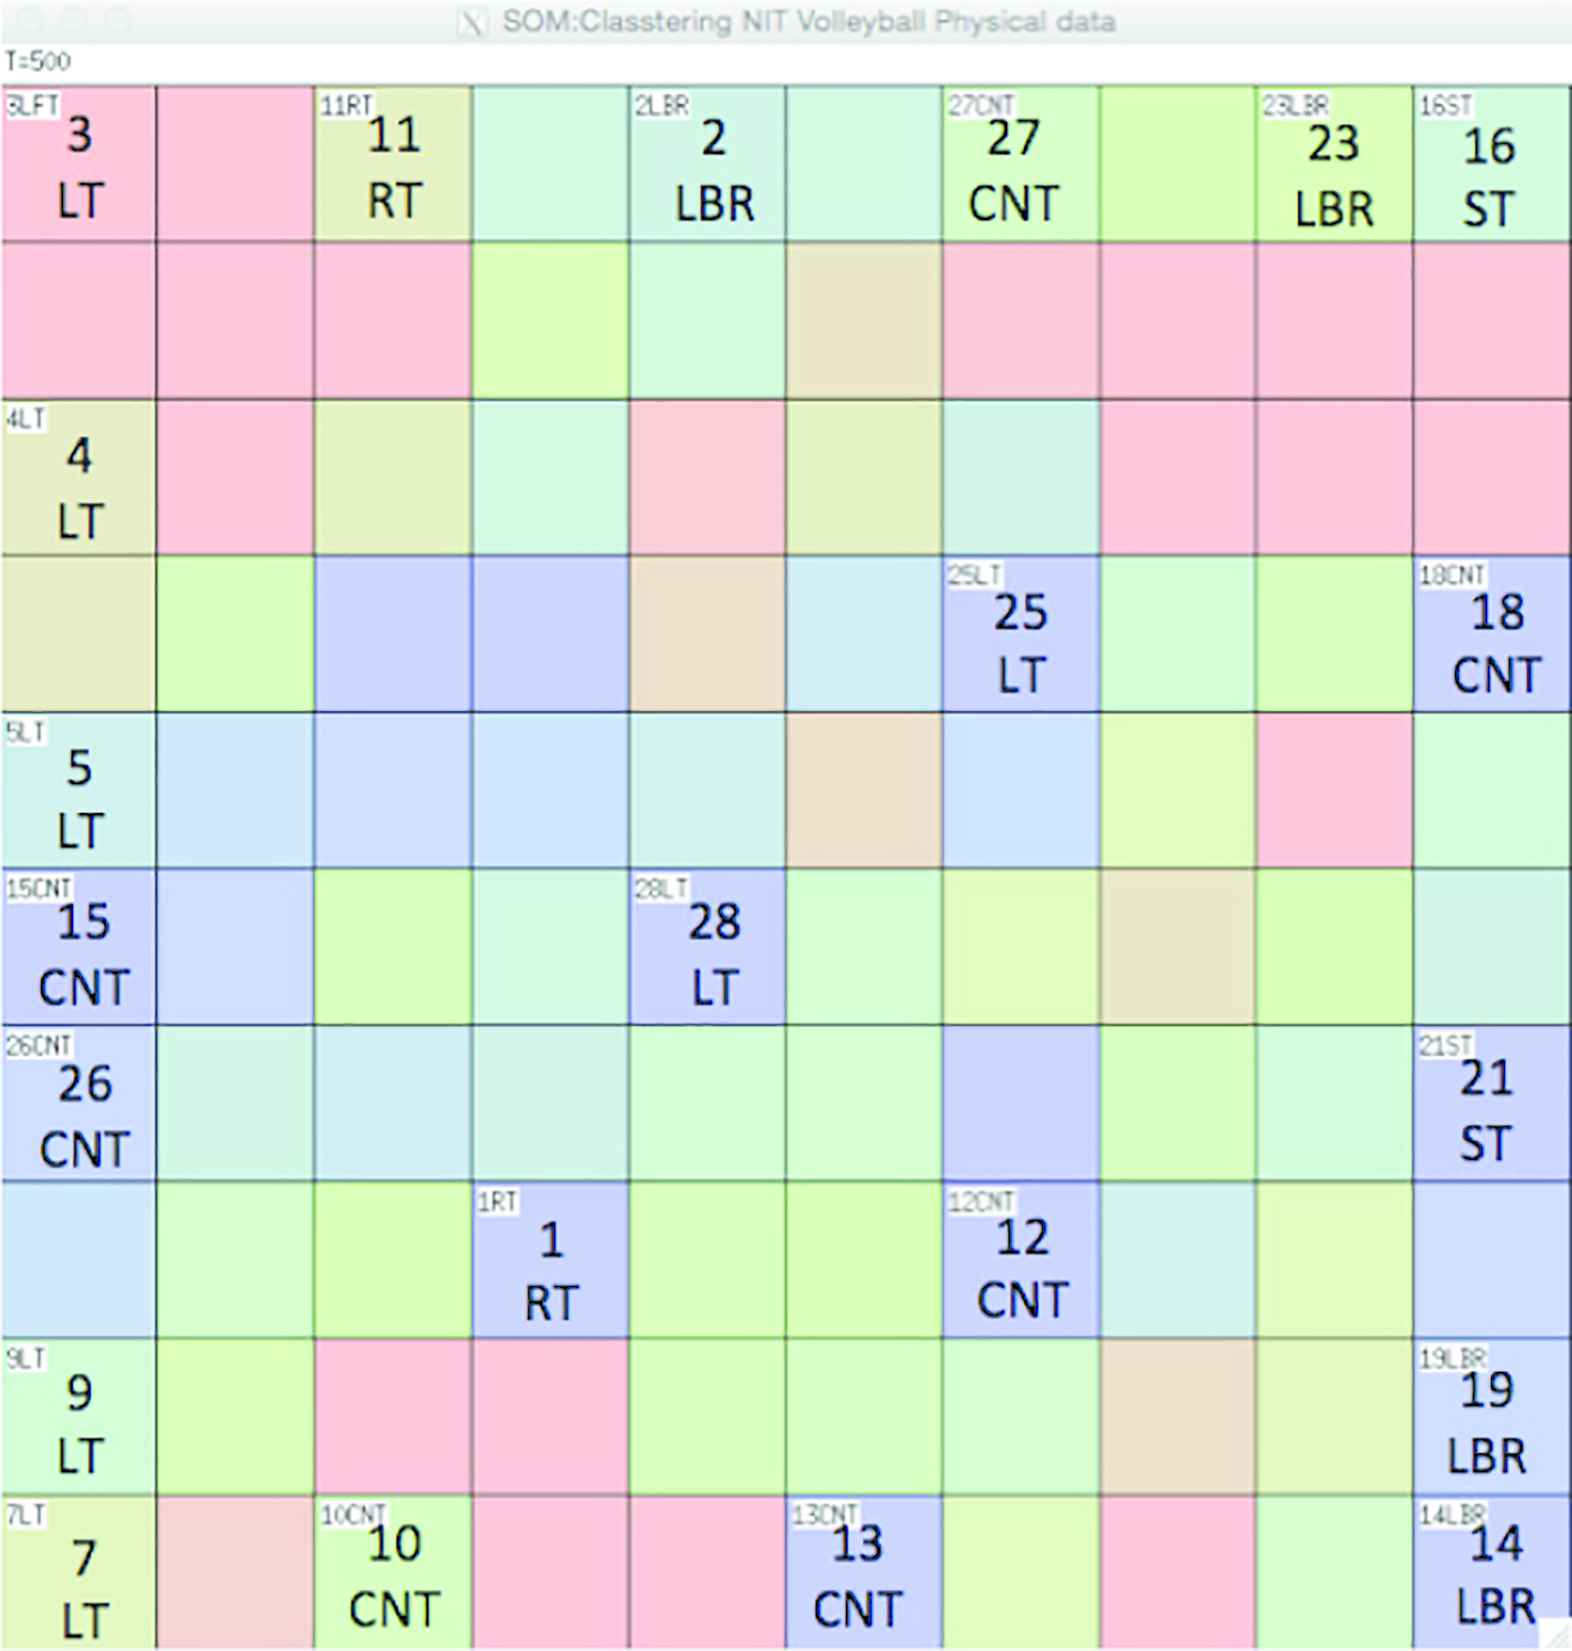
Second, we input y data (psychology data sets). Figure 7 shows the feature map which is inputted psychological data sets. Each lattice cell describes a unit. If a unit is the BMU for a data set, it is labeled as such as 1st line: number of player and position and 2nd line: total score evaluation (1: low level to 5: high level using DIPCA.3 statistics result). In this figure, right up side is gathered to low-level players. On the other hand, left bottom side is gathered to high-level people. Therefore, players in the upper right corner of the map are mentally immature players and need mental training. On the contrary, many of the players belonging to the lower left are elected regular members, and the director also knows that they consider mental reach. In addition, because mental elements are still being analyzed, we will explain the details in the conference.
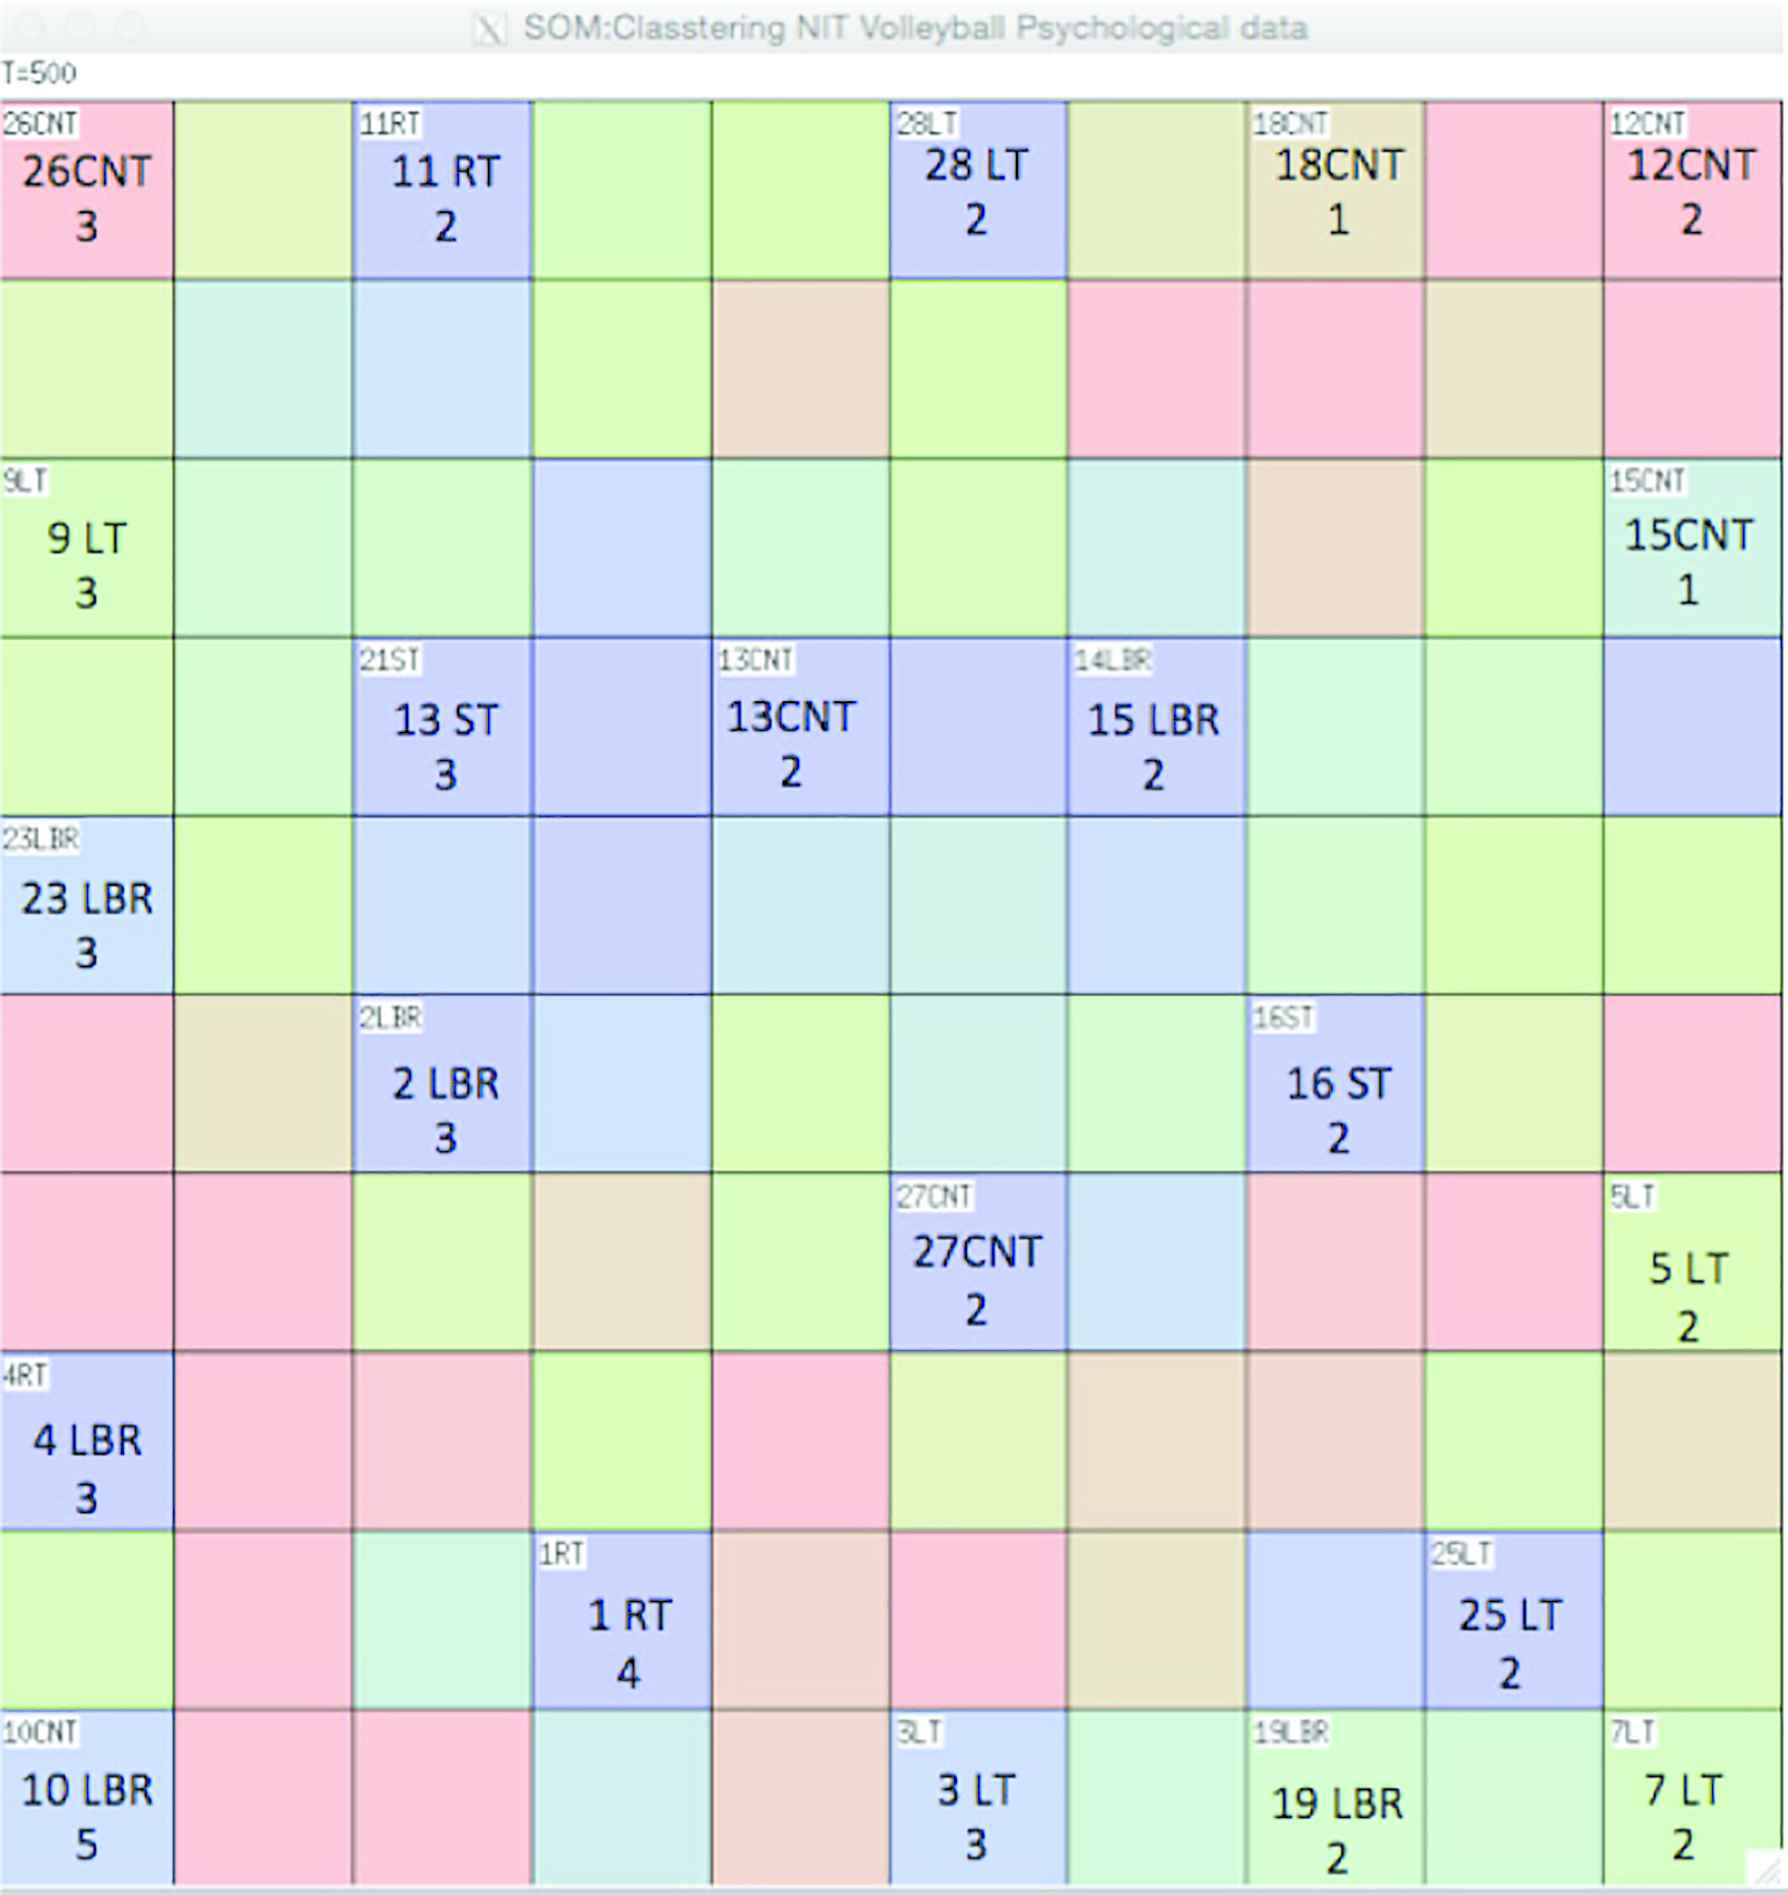
The feature map of psychological data sets result
5. CONCLUSION
In this paper, we developed team relationship clustering algorithm-using SOM for volleyball team players. In previous works, we analyzed team relationship clustering algorithm-using SOM for university rugby players [8,9]. However, I have not yet confirmed whether the developed algorithm can be applied to another team sports. For this reason, we applied the same algorithm to our volleyball players.
In previous research [8,9], we succeeded in electing the position of the rugby players using the physical data sets. From the psychological data sets, we were able to find out what kind of people the regular members are. In addition, if two data groups are used comprehensively, the suitability of positioning and the selection of regular members were possible. In this paper, we confirmed whether we can obtain the same knowledge as statistical data by using physical data group according to the method. We also examined whether statistically similar results can be obtained for psychological data group as well. In the future, we need to analyze the suitability of the position and the relationship with the company. We also plan to analyze integrated physical data group and psychological data group.
In addition, as a future task, it is necessary to consider a method for general use because there is a difference in results, compared with the result of the clustering in the rugby player performed in the preceding research [8,9] and the result of the volleyball player.
ACKNOWLEDGMENT
This work was supported by a Grant-in-Aid for Young Scientists (B) 15K21570 from JSPS KAKENHI.
Authors Introduction
Dr. Yasunori Takemura
 He graduated Ph.D. in Kyushu Institute of Technology, Japan in 2010 and now he is working as an Associate Professor at Nishinippon Insitutute of Technology, in Japan. His research area is about machine learning, data mining and robotics.
Mr. Michiyoshi Ono
 He received his bachelor degree of engineering from Nishinippon Institute of Technology, Japan in 2018. He is currently doing Master degree student of engineering at Kyushu Institute of Technology, in Japan.
Mr. Kazuya Oda
 He received his bachelor degree of engineering from Nishinippon Institute of Technology, Japan in 2017. He is currently doing Master degree student of engineering at Kyushu Institute of Technology, in Japan.
REFERENCES
Cite this article
TY  - JOUR
AU  - Yasunori Takemura
AU  - Kazuya Oda
AU  - Michiyoshi Ono
PY  - 2018
DA  - 2018/12/01
TI  - Analysis of Team Relationship using Self-Organizing Map for University Volleyball Players
JO  - Journal of Robotics, Networking and Artificial Life
SP  - 199
EP  - 203
VL  - 5
IS  - 3
SN  - 2352-6386
UR  - https://doi.org/10.2991/jrnal.2018.5.3.12
DO  - 10.2991/jrnal.2018.5.3.12
ID  - Takemura2018
ER  -