
Patterns of Fatal Explosion Accidents in China
 , Zhiwen Zhang1, Kai Yang1, 2, , Pengfei Lv1, 2, Siheng Sun1, 2, *
- DOI
- 10.2991/jracr.k.200714.001How to use a DOI?
- Keywords
- Fatal explosion accident; pattern; statistical analysis; Cramer’s coefficient
- Abstract
Explosion accidents usually lead to serious fatality and disability. To investigate the patterns of Fatal Explosion Accidents (FEA), a database containing 1835 FEA that happened in China during 2001–2018 was built. Statistical analysis was made based on the year, month, time interval of day, day of week, province, type of accident, place of occurrence and severity of accident. The result shown that, (1) FEA were more likely to occur in November; (2) 08: 00-10: 00 and 14: 00-16: 00 were two time intervals of frequent accident occurrence; (3) hazardous chemical FEA mostly happened on Tuesday and Wednesday, whereas pressurized container FEA often happened on Saturday; (4) coal mine gas FEA still accounted for a dominant proportion with the highest fatality rate. In addition, the correlation was measured by calculating Cramer’s coefficients, which indicated that the severities and types of FEA were significantly correlated with month. To be specific, (1) major and extraordinarily serious FEA were more likely to occur in November; (2) most of gas FEA were observed in April; (3) gunpowder and dust FEA happened most commonly in May; (4) more fireworks FEA happened in November. The patterns found in this study will provide explosion accident prevention and control with references.
- Copyright
- © 2020 The Authors. Published by Atlantis Press B.V.
- Open Access
- This is an open access article distributed under the CC BY-NC 4.0 license (http://creativecommons.org/licenses/by-nc/4.0/).
1. INTRODUCTION
China is a developing country with rapid economic growth. However, large numbers of safety accidents happen every year due to various reasons like unbalanced economic development between provinces and insufficient economic or technical investment. Not only have frequent safety accidents casted adverse effects on the rapid development of China’s national economy, but they have also resulted in enormous economic losses. Explosions are accidents with high fatality and disability rates among all the safety accidents. For example, there were 493 fatal accidents in China in 2018, 51 or 10.35% of which were explosion accidents. Of the 1860 deaths caused, 198 died in explosion accidents, which accounted for 10.65% of the total.
According to incomplete statistics, nearly 2000 Fatal Explosion Accidents (FEA) that caused about 15,000 deaths were reported in China during 2001–2018. For example, the extraordinarily serious aluminum dust explosion that happened in Zhongrong Metalwork Plant, Kunshan, Jiangsu Province on August 2, 2014 had killed 75 people and wounded 185 others on the day. In August 12, 2015, the extraordinarily serious explosion in Tianjin Binhai New Area had left 165 people dead and 74 others missing. With heavy casualties, explosion accidents have become the costliest disasters in China over the past few years. However, the occurrence of explosion accidents is a combined result of multiple factors. To effectively prevent and control accidents in such a severe situation, it is of great practical significance to study the patterns of FEA.
Many researchers have considered the patterns of accidents by focusing on the circumstances in which accidents are more likely to occur. Considering that China is a major coal producer and mine gas explosions take up about 25% of coal mine accidents [1], the characteristics of mine gas explosion accidents in Chinese were analyzed using the statistical theory from various perspectives like the number of gas explosions, deaths, ignition source, time of accident and area [2–5]. In a study by Zheng et al. [6], a statistical method was used to investigate the 106 fatal coal dust explosions in China during 1949–2007. The statistical characteristics of accident-related factors were analyzed, such as space, time, volatilization ratio of coal dust, ignition source and type of accident. Wu [7] and Li et al. [8] focused on hazardous chemical accidents that occurred in China during “the 11th Five-Year Plan” and “the 12th Five-Year Plan”. Data statistics of fireworks explosion accidents that happened in China during 2006–2015 were carried out by Zhao et al. [9] by means of clustering analysis of the overall situations and regions of these accidents using Statistical Product and Service Solutions (SPSS), based on which the law of the occurrence of fireworks safety accidents in China was summarized. In a study by Li et al. [10], the safety accidents in China during 2010–2014 were counted. A general trend of China’s safety accidents was obtained by them by analyzing the overall situations of accidents, the occurrence trend of serious and extraordinarily serious accidents and the death toll in the safety accidents in various industries. On that basis, some rational countermeasures and suggestions were made. Previous studies mostly focus on some certain types of explosion accidents that are generally divided into fatal and nonfatal ones. Therefore, it is necessary to delve into FEA on a general basis for the sake of accident prevention and control.
There are many reasons for explosion accidents, such as safety management, backward technology, lack of preventive measures and so on. To further identify the patterns of FEA, the statistics and analysis of explosion accidents in China during 2001–2018 were carried out by probing the statistical information of explosion accidents in this study, thereby providing accident prevention and control with countermeasures and facilitating the implementation of safety supervision.
2. DATE AND METHODS
2.1. Data Collection
To ensure the authenticity and validity of accident information, the data used in this study were collected from Ministry of Emergency Management of the People’s Republic of China (PRC) [11], National Bureau of Statistics of PRC [12] and Safety Management Network [13].
Data statistics covered a total number of 1858 FEA that happened in all 34 provinces, municipalities and autonomous regions of China (including Hong Kong, Macao and Taiwan) from January 1, 2001 to December 31, 2018. Due to the discontinuity of data statistics in some regions, 1835 explosion accidents that caused 13,930 deaths were considered in this study. In addition, for lack detailed explanation of cause was given from the data source, this paper only analyzes the objective attributes of the accident, such as the year, month, time interval of day, day of week, province, type of accident, etc.
2.2. Data Collation
The FEA were sorted and analyzed by the following key factors:
- (1)
The accidents were sorted by geographical location (province, municipality and autonomous region), the year (2001–2018), month (January–December) and day of week (Monday–Sunday);
- (2)
Statistics of the time of FEA were given by the specific time interval of day (8: 00-10: 00, 10: 00-12: 00, 12: 00-14: 00, 14: 00-16: 00, 16: 00-18: 00, 18: 00-22: 00 and 22: 00-08: 00);
- (3)
FEA were counted by type, namely mine gas explosion (TA1), fireworks explosion (TA2), hazardous chemical explosion (TA3), fuel gas explosion (TA4), pressurized container explosion (TA5), gunpowder explosion (TA6), dust explosion (TA7) and other explosions (TA8);
- (4)
The severity of each fatal explosion accident was determined by death toll. According to Regulations on the Reporting, Investigation and Handling of Production Safety Accidents (2007) issued by State Council of PRC, accident severity can be divided into four levels: minor accidents (SA1), serious accidents (SA2), major accidents (SA3) and extraordinarily serious accident (SA4), which refer to the accidents that cause one death to two deaths, three to nine deaths, 10–29 deaths and over 30 deaths each, respectively.
2.3. Data Analysis Methods
Frequency analysis was used to analyze the basic characteristics of accident occurrence, followed by the investigation of the correlation between various accident factors using correlation coefficient analysis of SPSS. Whether there was significant difference between two factors was verified by calculating the corresponding p-value. In addition, the correlation between different factors was identified based on Cramer’s coefficient V and Phi correlation coefficient φ. The relevant calculation formula is shown in formulas (1)–(3).
3. RESULT ANALYSIS AND DISCUSSION
3.1. Frequency Analysis
In this section, statistical description of FEA was made by the year, month, time of day and day of week, province, type of accident (TA), place of occurrence (PO) and severity of accident (SA).
3.1.1. Year
The annual variation trend of the FEA in China during 2001–2018 is shown in Figure 1, which indicates that the death toll of explosion accidents declined with fluctuations year by year. During 2001–2018, there were 1835 FEA that caused 13,930 deaths in total. The accident frequency, average death toll per accident and average daily death toll were 102, 774 and 2.12, respectively. By contrast, the number of people who died from building construction was 1.57/day on average in China [14]. 2005 was the year with highest death toll from explosion accidents, which left 1830 deaths in total. It can be seen from Tables 1 and 2 that 98 (60.5% of the total) of the 162 FEA that occurred in 2005 were mine gas explosion accidents; there were 10 extraordinarily serious explosion accidents that caused 843 deaths in the same year, which accounted for 46.1% of the total annual death toll. There were three FEA that killed over 100 people each, all of which were mine gas explosion accidents. From a provincial perspective, these three accidents happened in Liaoning Province, Heilongjiang Province and Hebei Province and caused 214, 171 and 108 deaths, respectively.
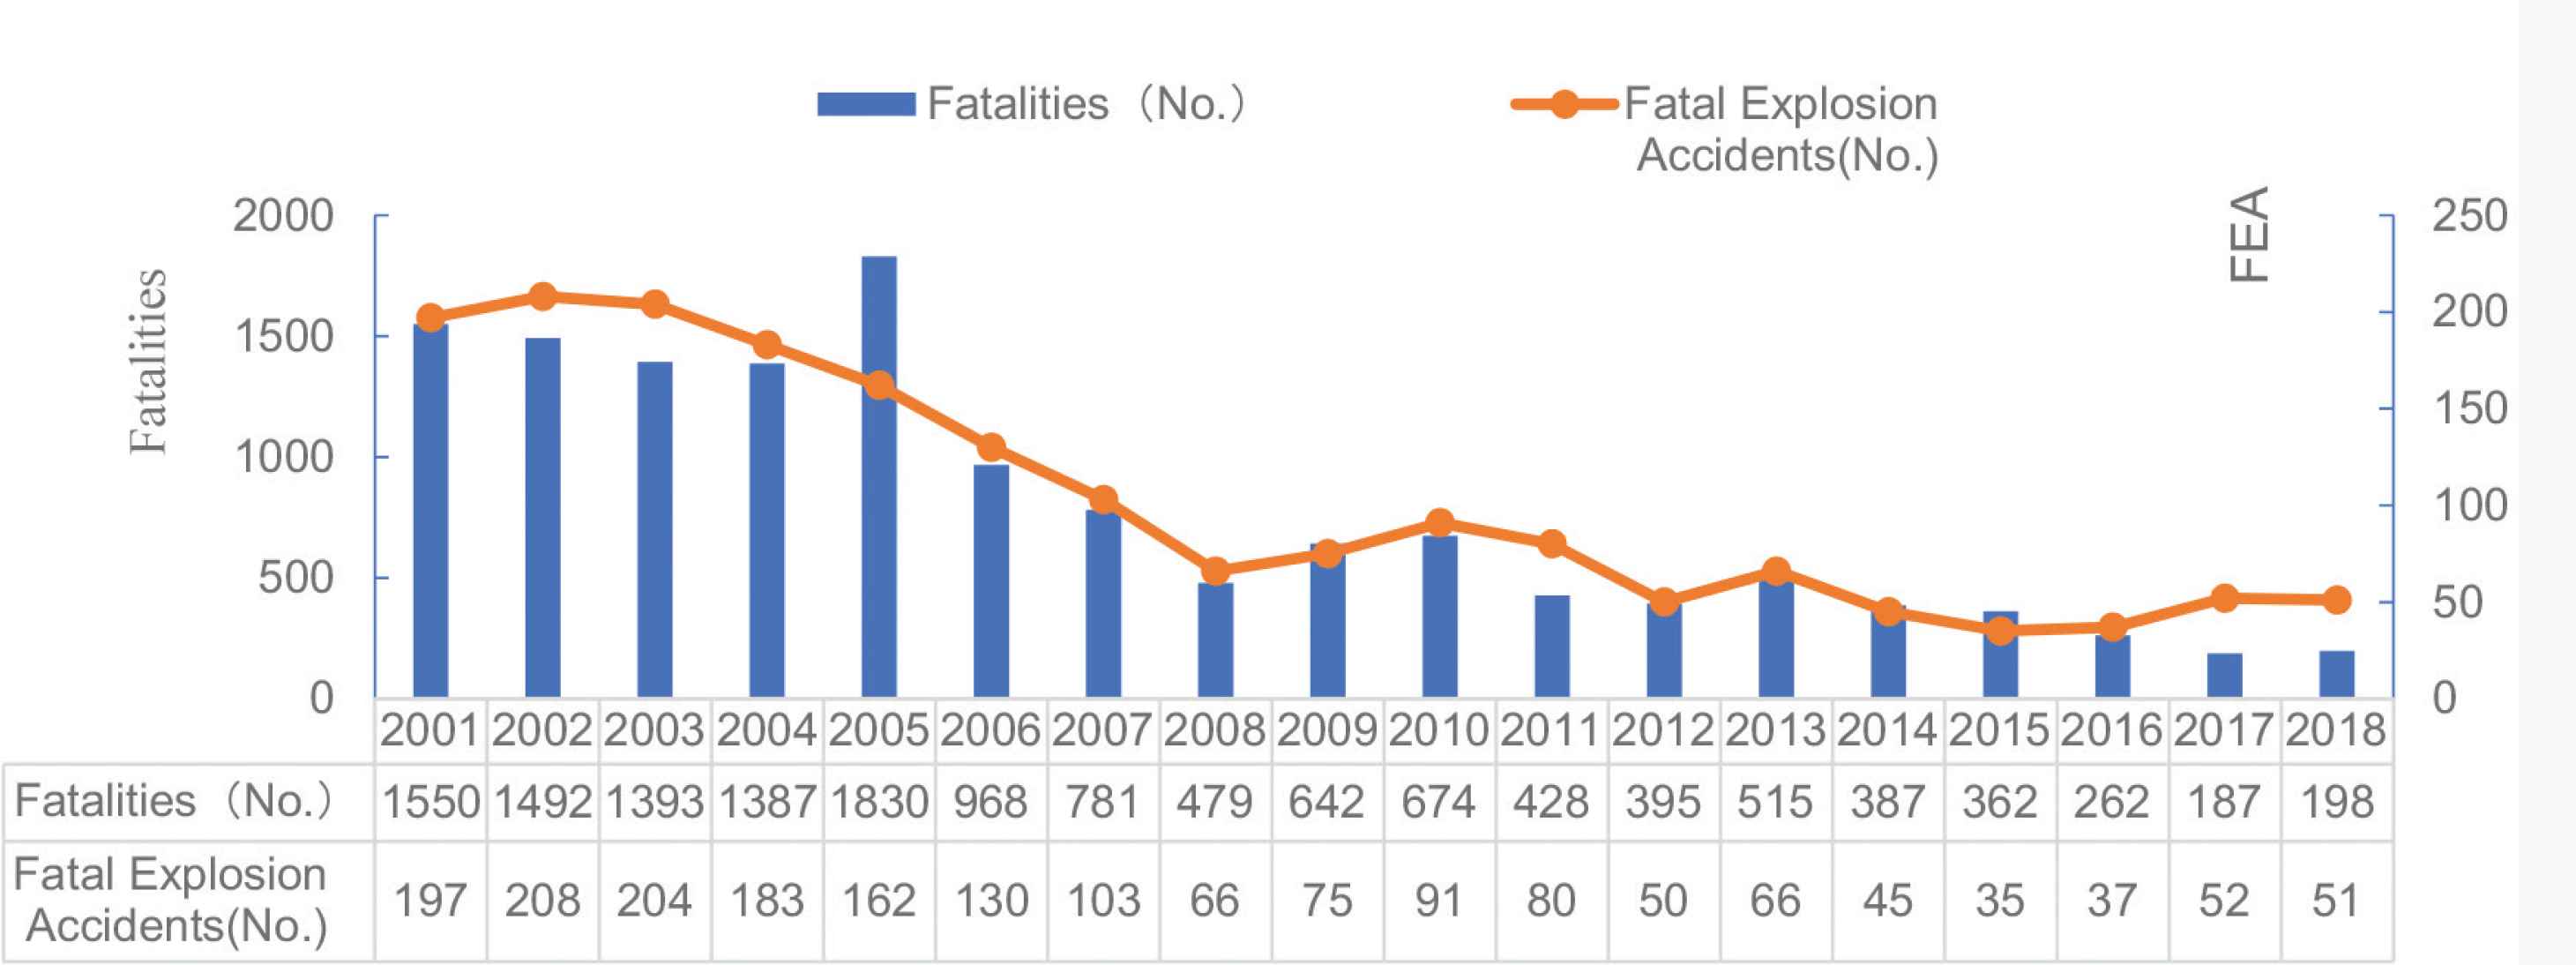
Distribution of fatal explosive accidents by year.
| Type of accident | TA1 | TA2 | TA3 | TA4 | TA5 | TA6 | TA7 | TA8 | Total |
|---|---|---|---|---|---|---|---|---|---|
| No. | 98 | 22 | 6 | 1 | 11 | 16 | 2 | 6 | 162 |
Summary of types of FEA in 2005
| Severity of accident | SA1 | SA2 | SA3 | SA4 | Total |
|---|---|---|---|---|---|
| FEA (No.) | 19 | 105 | 28 | 10 | 162 |
| Fatalities (No.) | 30 | 468 | 489 | 843 | 1830 |
Summary of severity of explosion accidents in 2005
3.1.2. Month
The distribution of explosive fatal accidents by month is shown in Figure 2. It can be seen that November was the month with the largest number of FEA (169) and the highest death toll (1813), February was the month with the fewest FEA, and that the month with the lowest death toll was September. There is a persistent febrile period after the weather turns warm from March to August, during which more FEA happened and resulted in a higher death toll. One reason is that distractedness and fatigue are more likely to occur in warm weather. Continuing high temperature can result in significant physical and mental changes to operators, which casts adverse effects on production safety and thus leads to accidents. However, both the frequency of FEA and the death toll as caused were found to slightly decline in June. One possible reason is that China has implemented a “production safety month” activity in June every year since 2002. This activity is aimed to improve universal safety awareness, remove accident potential to the largest extent and thus effectively curb the occurrence of accidents by publicizing a series of guidelines of production safety and popularizing the knowledge on production safety-related laws and regulations. Due to the high inflammability, explosibility and volatility of most explosive materials, the dry weather in November makes explosion accidents frequent [15]. In addition, the dry weather tends to fatigue workers, which is also a reason why fatal accidents happen frequently. Compared with November, the occurrence frequency of FEA and the death toll as caused were both lower in September. One possible reason is that China is planning large-scale celebrations in this month every year as National Day approaches, during which the law enforcement on safety will be improved to ensure the risks during the National Day is controllable. Lower accident frequencies were also observed during major festivals in other countries [16]. It can also be seen that there were fewer explosion accidents in February (a month in winter), which was partly because low temperature is to the advantage of the storage and transportation of explosives and helps prevent them from reaching the temperature of explosion. Moreover, Spring Festival, the most important traditional festival of China, is around February. All units are required to carry out complete year-end safety inspections and employees also start to enjoy this holiday or take working days off before and after Spring Festival. Hence, FEA occurred less often in February.
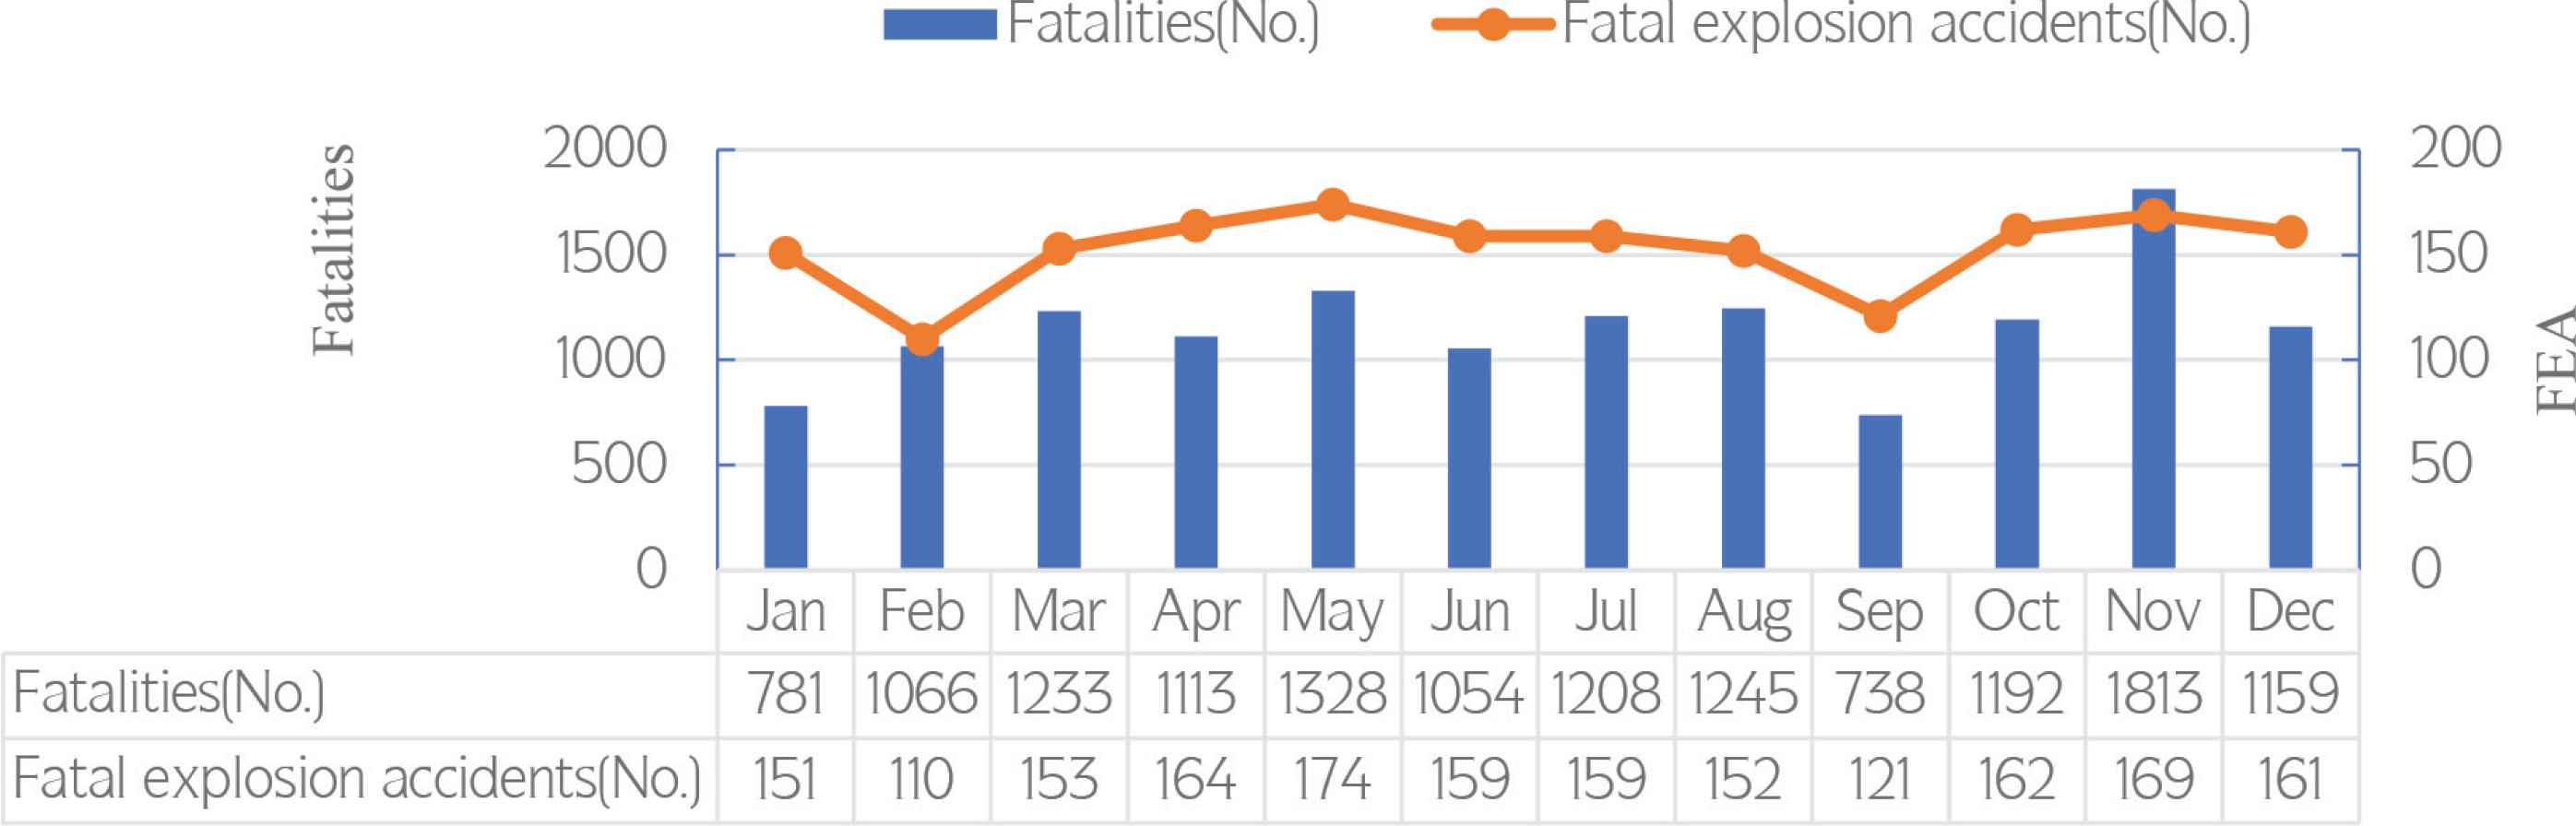
Distribution of FEA by month.
3.1.3. Time interval of day
According to statistics, the number of explosion accidents differed significantly time intervals of a day and followed a certain regularity (Figure 3). In the daytime, explosion accidents happened most frequently during 08: 00-10: 00 and 14: 00-16: 00, during which there were 275 and 256 explosion accidents occurred, respectively. These two time intervals are exactly the time when people start working. In addition, this was also directly associated with people’s routines. Most of Chinese office workers stay up late, which results in operational errors due to poor performance and inattention. Considering that 10: 00-12: 00 and 16: 00-18: 00 are commuting hours when people are distracted for lack of energy due to starvation or fatigue, accidents are more likely to occur. FEA still occurred frequently when it came to the time from 22:00 to 08:00 in the next morning. According to the analysis of the accident types during this period (as shown in Table 3), mine gas explosion accidents accounted for the largest proportion, accounting for 55.8% of the total. Moreover, the mine gas explosions that occurred during this time interval took up 25.9% of the total number of mine gas explosion accidents, most of which happened in small-scale local coal mines [3]. Inadequate illumination at night makes it difficult for workers to discover accident potentials, specially, gas leakage that can lead to a fatal explosion accident upon an ignition source. Having been working for long, workers are too tired to concentrate themselves on mechanical operation. FEA are more likely to happen in the context of operational error or negligence in management. It can also be seen that there were the fewest FEA during 12: 01-14: 00 (noontime), which is because people are either taking noon breaks or having lunch with mechanical equipment in the outage state.
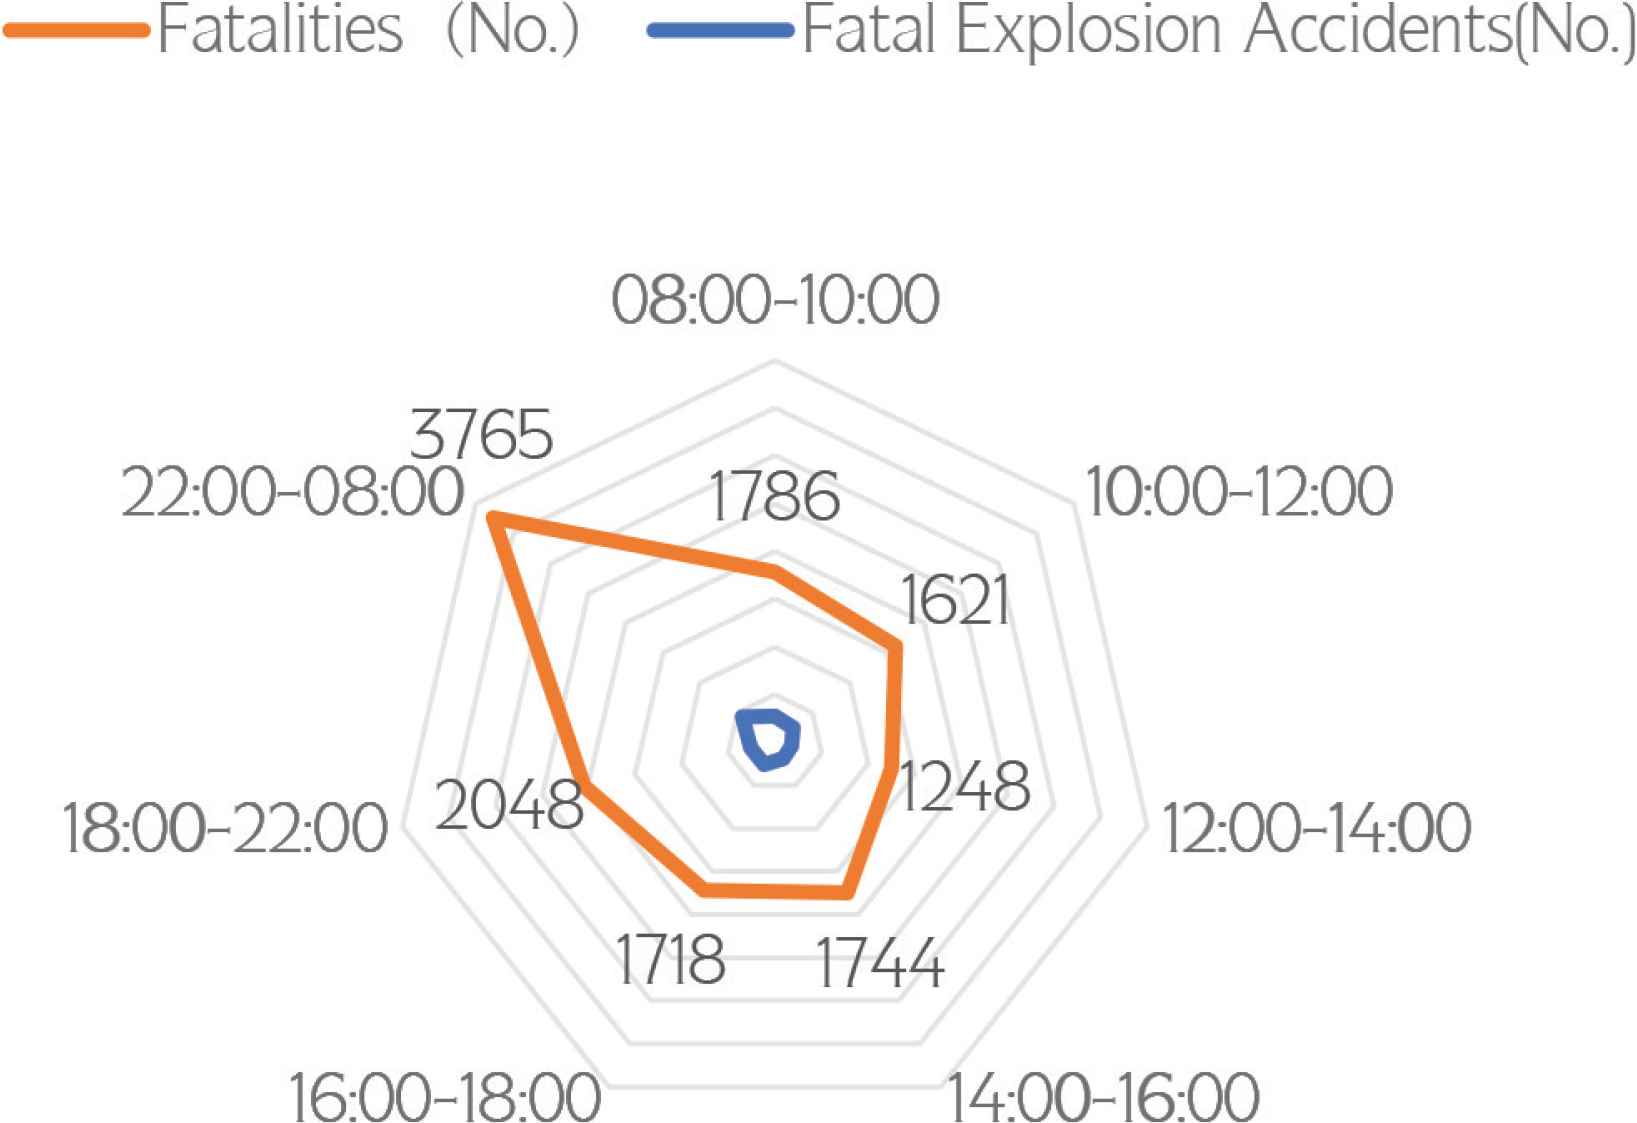
Distribution of FEA by time interval of day.
| Type of accident | TA1 | TA2 | TA3 | TA4 | TA5 | TA6 | TA7 | TA8 | Total |
|---|---|---|---|---|---|---|---|---|---|
| No. | 241 | 39 | 25 | 37 | 27 | 35 | 10 | 18 | 432 |
Summary of type of FEA from 22:00-08:00 during 2001–2018
3.1.4. Day of week
As shown in Figure 4, the statistics of China’s FEA suggest that there were the fewest FEA on Sunday, which is probably because people do not work on weekends. From the perspective of explosion accident types, mine gas explosions were still the most common accidents; hazardous chemical explosions mostly happened during transportation on Tuesday and Wednesday. Most of the pressurized container explosions occurred on Saturday. One reason is that container reliability declines after continuous service for a whole week. Another reason is that people take weekend breaks on Saturday and Sunday, which makes accident hazards difficult to be spotted in time. It is thus recommended that employees give emphasis on pressurized container inspection by the end of every Friday. Lopez et al. [17] and Campolieti and Hyatt [18] found that there were more accidents on Monday, known as “Monday effect”. However, the statistical analysis of China’s FEA did not show evident Monday effect. Neither can people concentrate on work immediately after the weekend break, nor are they flexible enough to identify and handle potential safety hazards. This indeed was part of the reason why accidents happened more frequently on Monday.
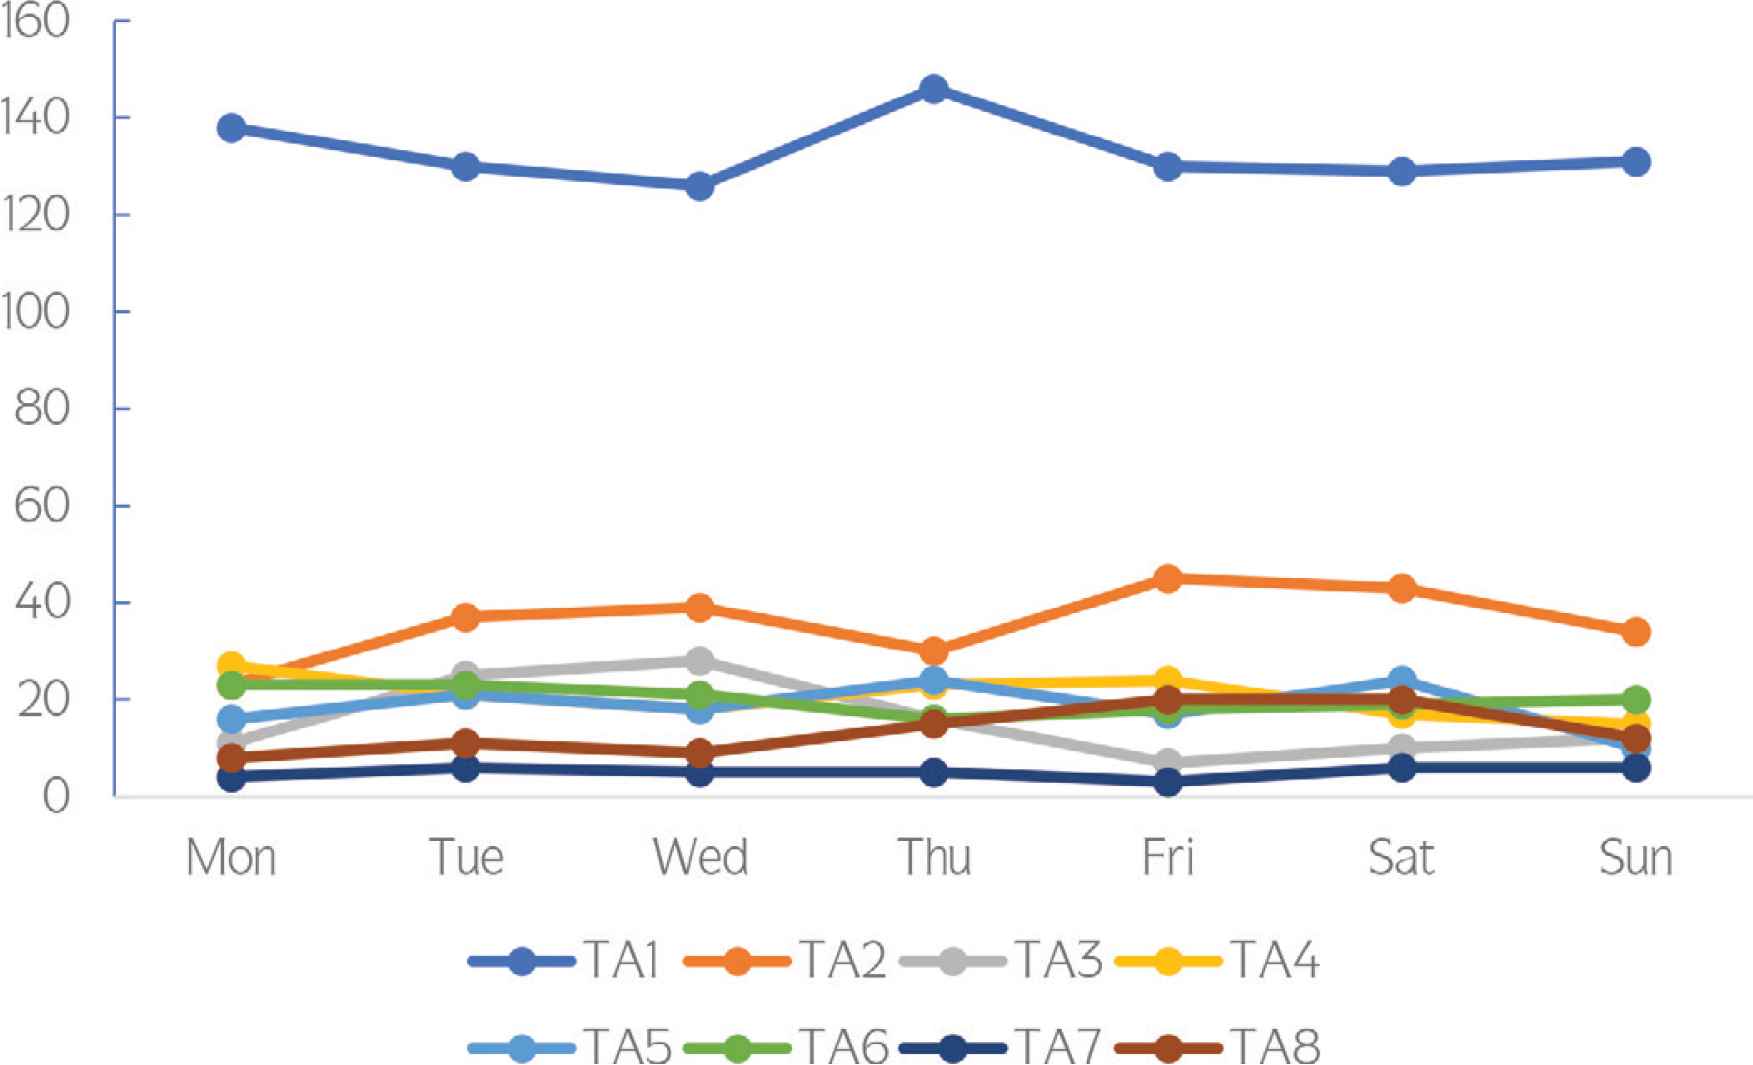
Distribution of FEA by day of week.
3.1.5. Province
The Distribution of explosive fatal accidents by province is given in Figure 5. Geographical difference has led to varied industrial orientations between various provinces and municipalities. For example, coastal provinces and municipalities develop manufacturing industry and trade; Shanxi Province primarily depends on coal mines; some inland provinces and municipalities give priority to chemical industry. This has resulted in significant difference in the number of FEA between various provinces. It can be seen from the figure that the FEA in Shanxi Province, Guizhou Province and Heilongjiang Province caused the most deaths, which were 1739 (122 accidents), 1357 (224 accidents) and 1136 (80 accidents), respectively. Further analysis of the FEA that occurred in these three provinces by type of accident (Figure 6) indicated that mine gas explosion was the primary type of FEA. Specifically, mine gas explosions accounted for 63.9%, 87.5% and 75.0% of the total explosion accidents in these provinces, respectively. This was closely associated with the situations of these provinces.
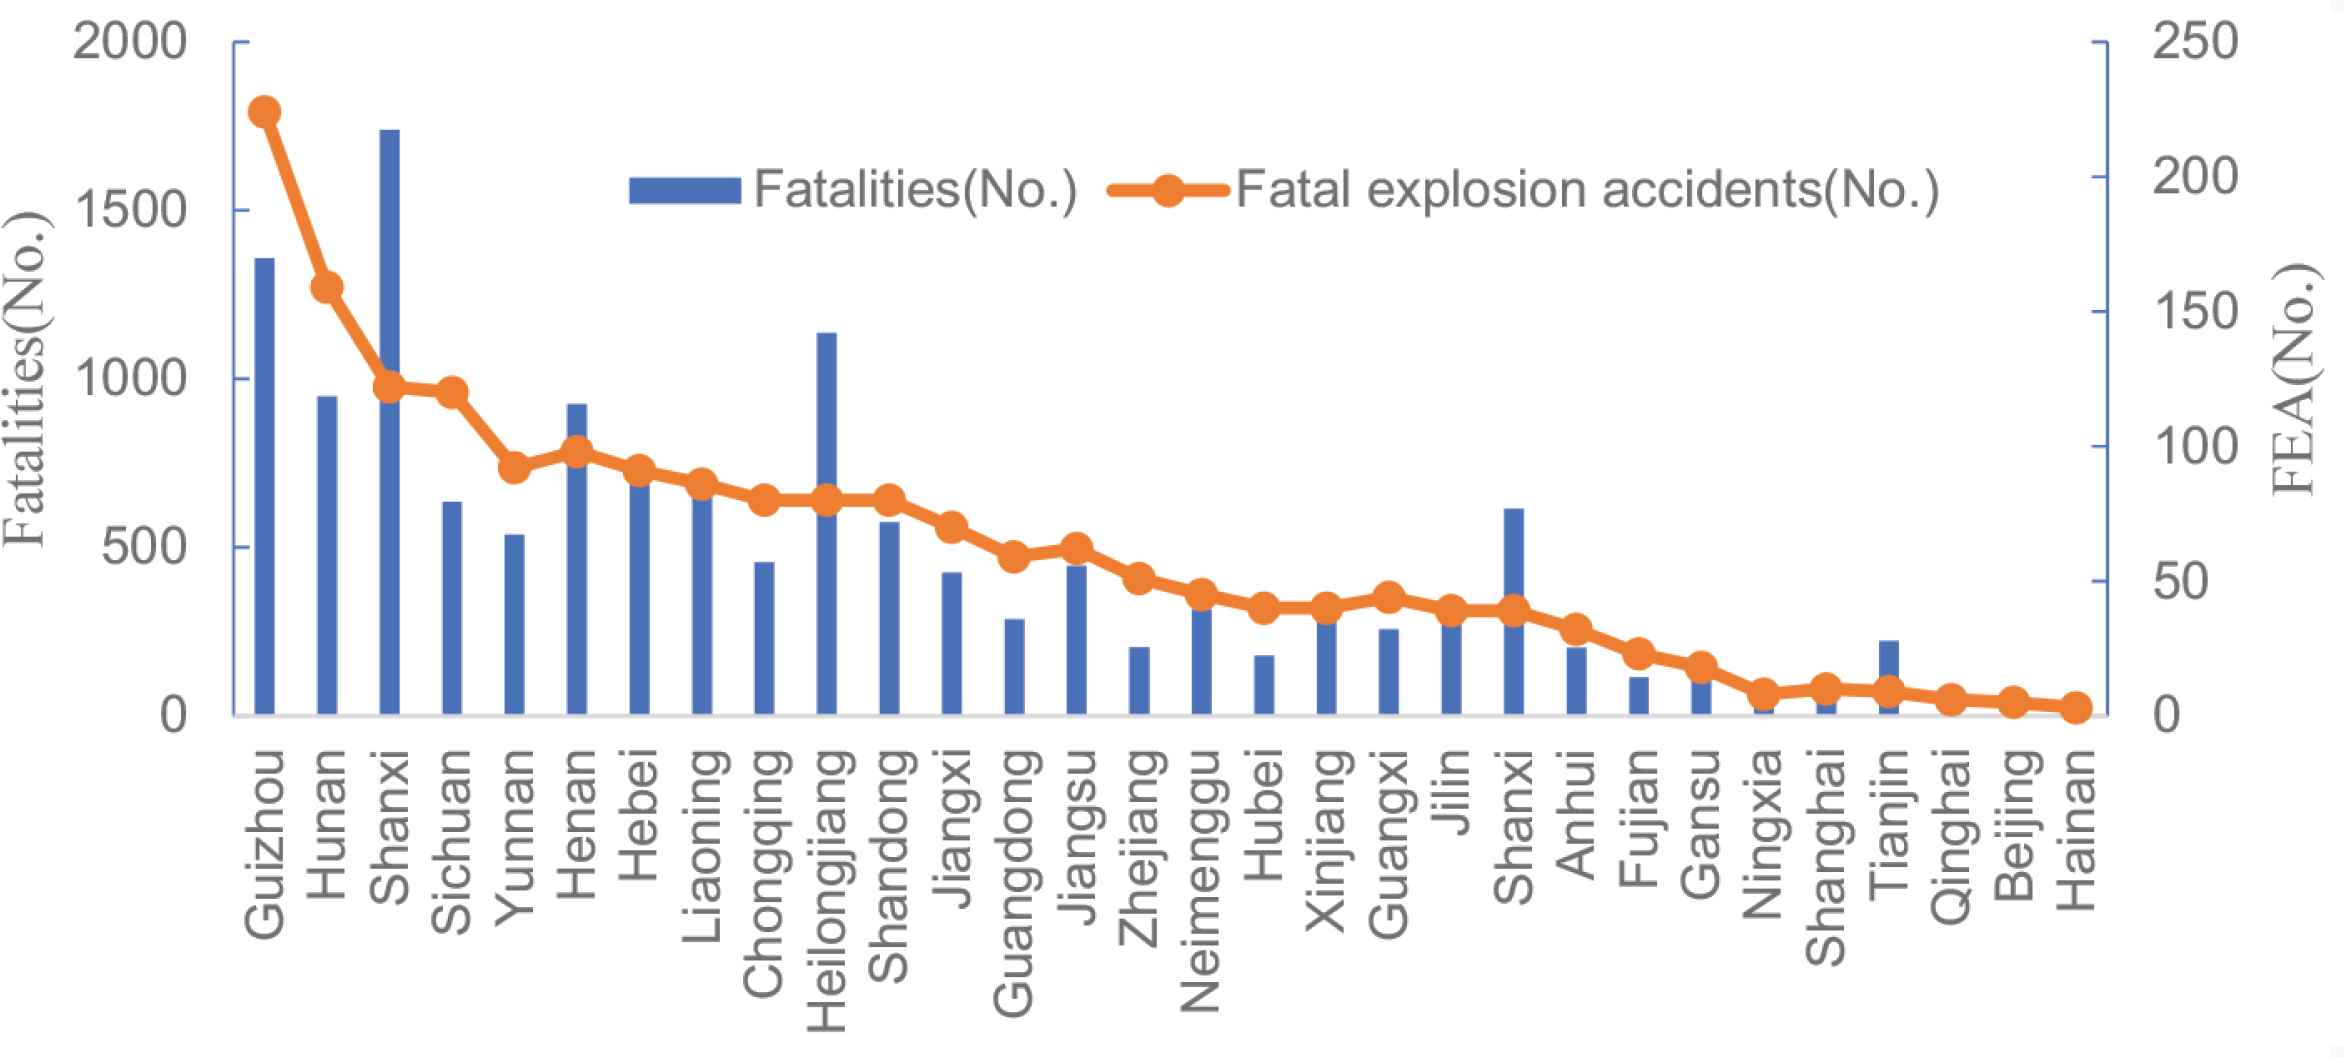
Distribution of FEA by province.
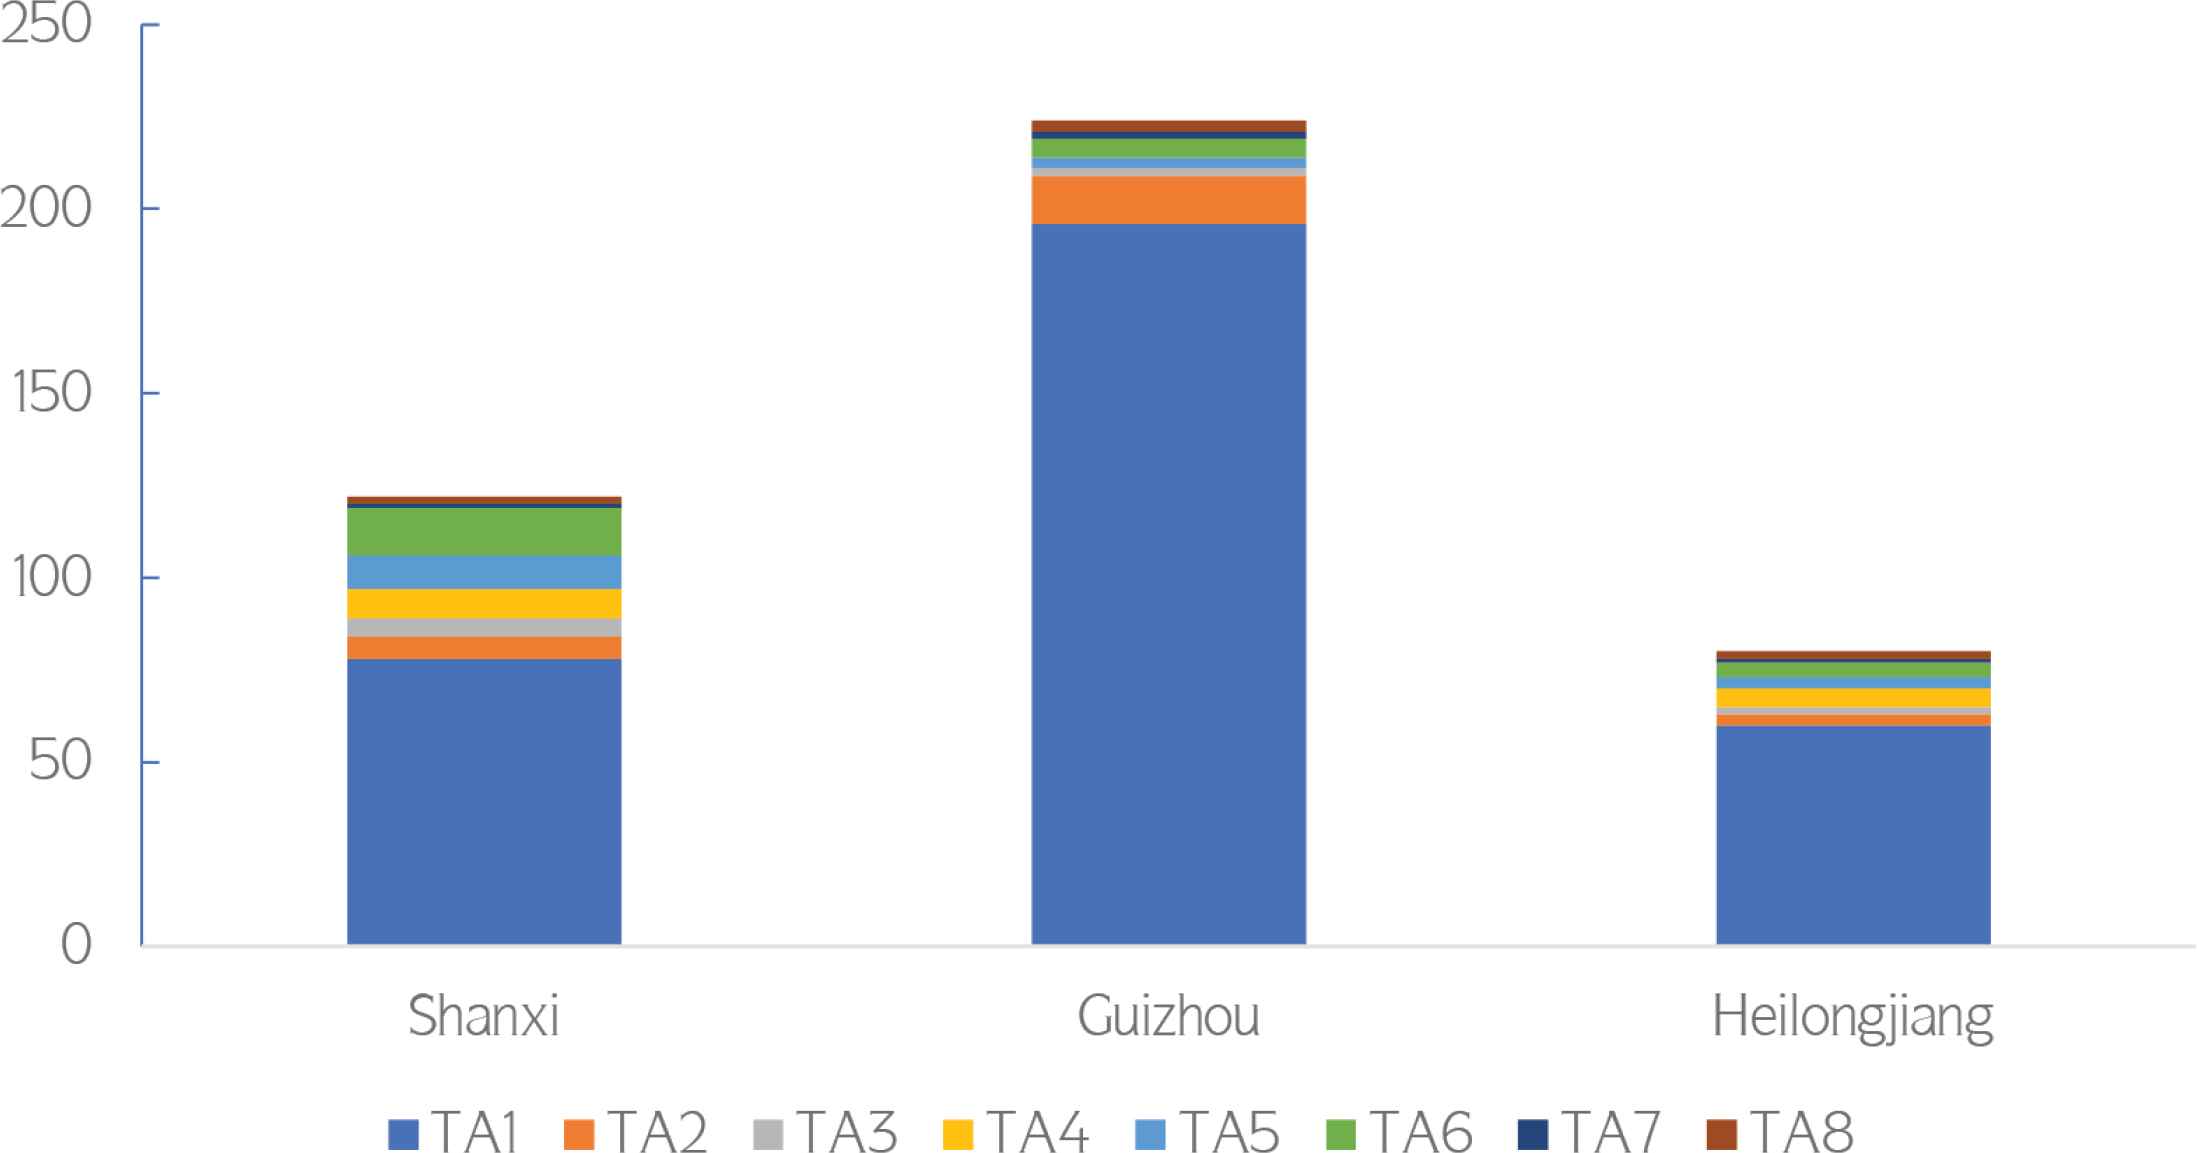
Distribution of FEA of Shanxi/Guizhou/Heilongjiang.
With economic cycle considered, the annual GDPs of various Chinese provinces during 2008–2017 were counted based on global data (Figure 7). These, together with the death toll and the number of accidents included in the database, were used to analyze the relationship between the death rate per 100 million yuan of GDP and death toll. According to analysis result, the death rate per 100 million yuan of GDP of Guizhou Province (0.0026) was the highest, followed by Shanxi Province (0.0024) and Heilongjiang Province (0.0023). One possible reason for the high death rate per 100 million yuan of GDP of Guizhou Province is that there is unbalanced systematic development between various regions of this province. They have neglected the danger of safety accidents whilst pursuing GDP growth. In addition, unbalanced social development, poor organizational management and inadequate infrastructure can also contribute to a higher death rate per 100 million yuan of GDP. Although the FEA had resulted in high death tolls in both Hunan Province and Henan Province, their death rates per 100 million yuan of GDP was lowered by higher GDPs. From the perspective of economics, development will inevitably invite accidents that lead to economic losses and causalities. Thus, handling the relationship between production safety and social economic development to promote sustainable economic development is a long-term issue of safety economics [19].
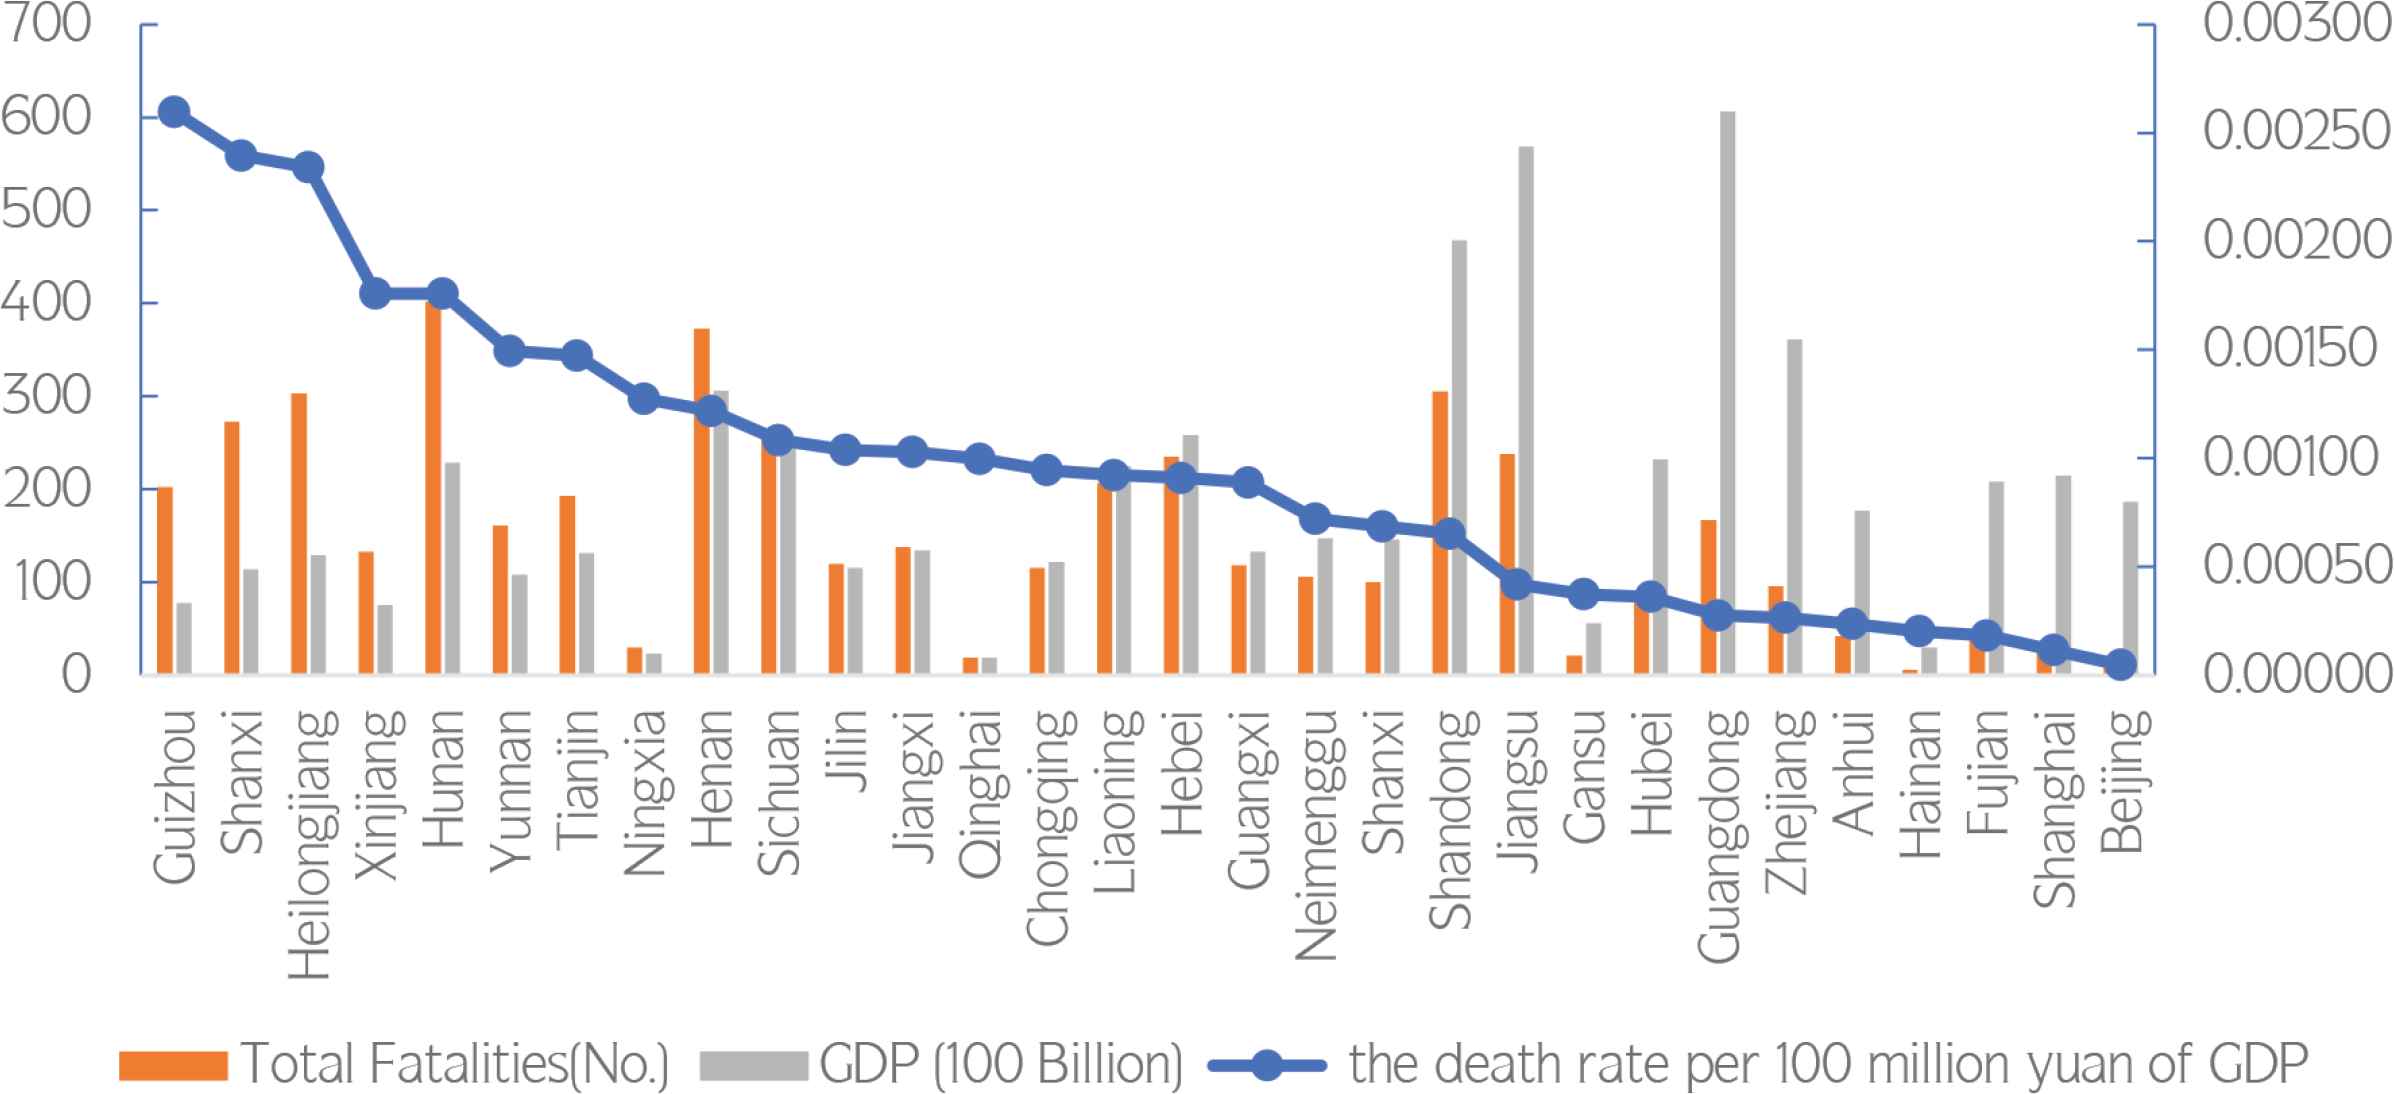
Distribution of GDP and the fatalities of FEA.
3.1.6. Severity of accident
As shown in Table 4, the number of serious accidents occupied a dominant position in the four accident levels and accounted for 71.2% of the total. This indicated that the explosion accidents that caused the most deaths in China were serious accidents with a death toll of 3–9 people each and they contributed 43.3% of the total death toll. It can be seen from the type of accident divided by accident level that serious accidents accounted for a majority in all types of FEA (Figure 8). The number of extraordinarily serious accidents was 58, which was the smallest and took up only 3.1% of the total. Specifically, 79.3% (46) of them were mine gas explosions; there were nine explosion accidents that caused over 100 deaths each. Since 2010, only one extraordinarily serious accident had been reported, namely the hazardous chemical explosion that killed 165 people in Tianjin in 2015. In addition, no more FEA that caused over 30 deaths each were reported in both 2017 and 2018, which had indirectly evidenced that China is paying more and more attention to production safety and the overall safety situation has been improved over the past few years.
| Severity of accident | FEA | Fatalities | ||||
|---|---|---|---|---|---|---|
| Number | Percentage (%) | Cumulative percentage (%) | Number | Percentage (%) | Cumulative percentage (%) | |
| SA1 | 229 | 12.5 | 12.5 | 354 | 2.5 | 2.5 |
| SA2 | 1306 | 71.2 | 83.7 | 6030 | 43.3 | 45.8 |
| SA3 | 242 | 13.2 | 96.9 | 3982 | 28.6 | 74.4 |
| SA4 | 58 | 3.1 | 100 | 3564 | 25.6 | 100 |
Distribution of FEA by severity of accident
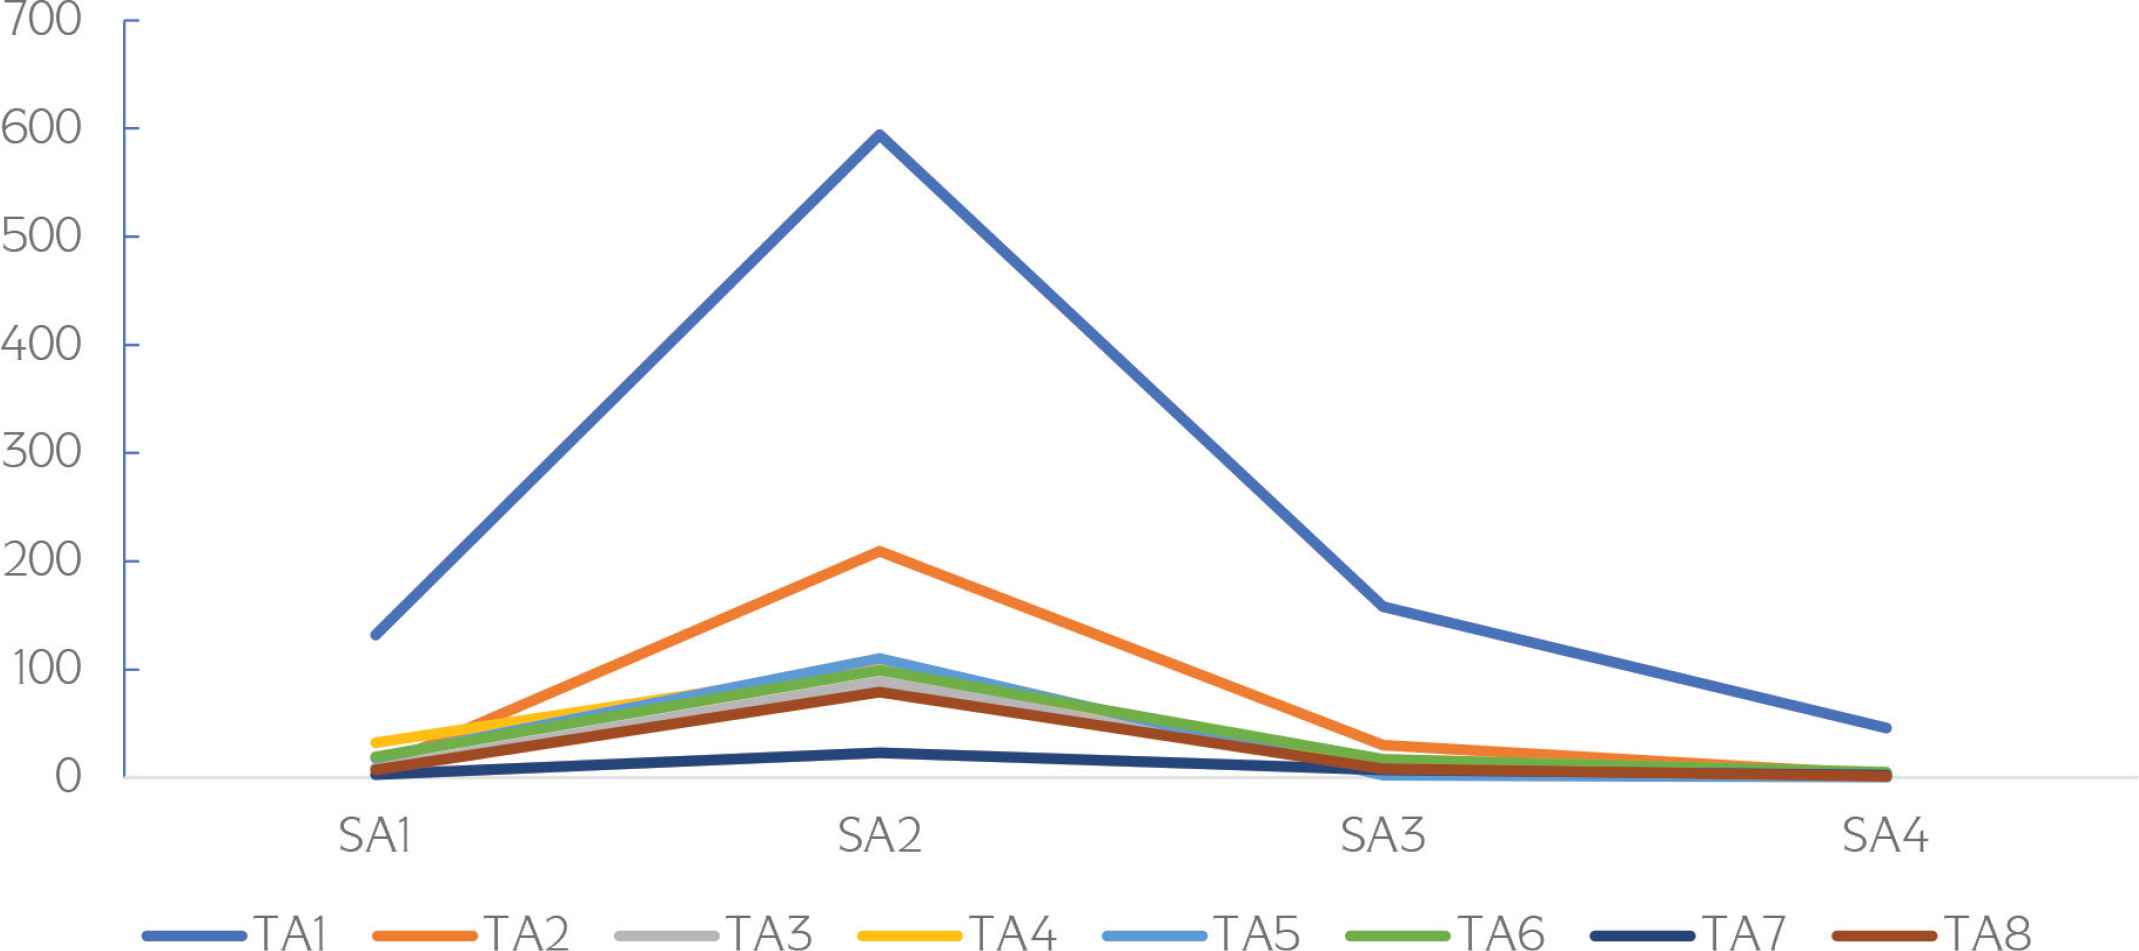
Distribution of type of FEA by severity of accident.
3.1.7. Type of accident
As shown in Figure 9, mine gas explosion, fireworks explosion, fuel gas explosion and gunpowder explosion were the top four types of FEA. There were 930 mine gas explosion accidents that resulted in 8761 deaths during 2001–2018, which accounted for 50.7% of the total number of FEA and 62.9% of total death toll as caused. To be specific, 46 of them were extraordinarily serious accidents and killed 2902 people in total, which took up 33.1% of the total death toll caused by mine gas explosions. However, the number of mine gas explosion accidents showed a generally downward trend [20,21], as shown in Table 5. It can thus be inferred that strengthening mine gas monitoring, early waring and extraction control is still the focus. Moreover, dust explosions have frequently occurred in recent years. For example, five out of the 51 FEA reported in 2018 were dust explosions, which caused 16 deaths in total.
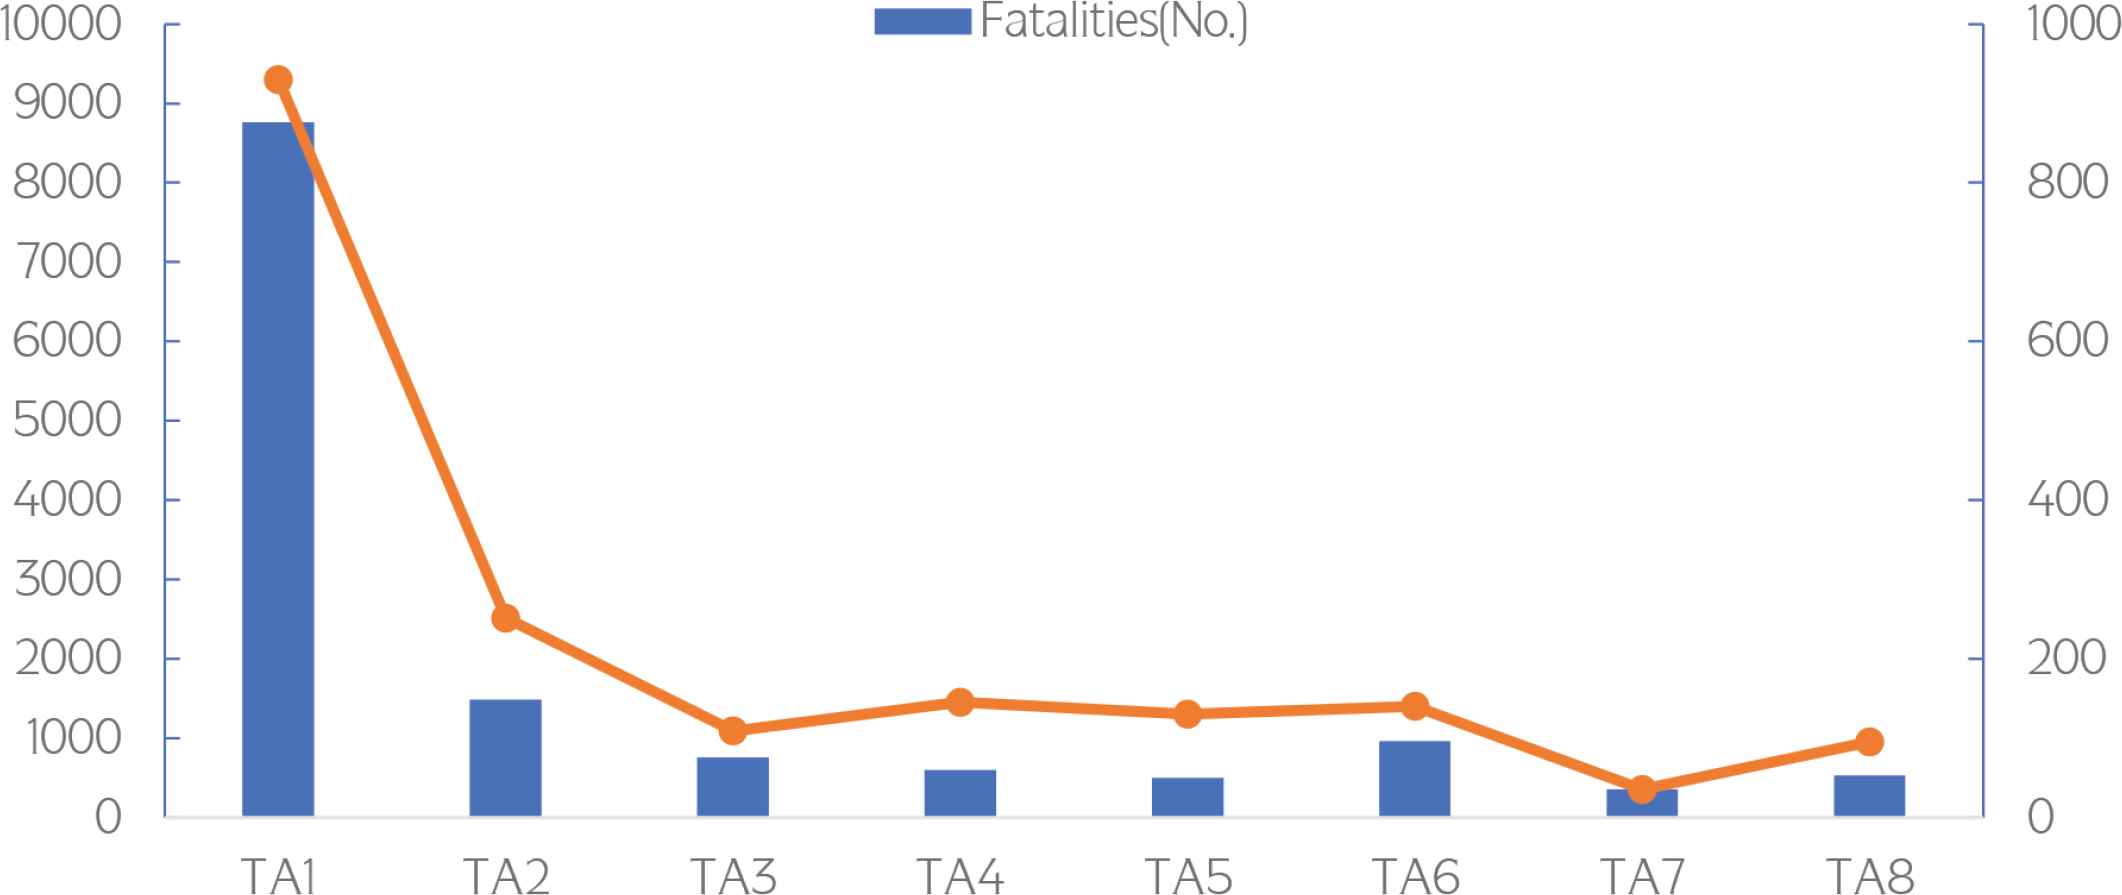
Distribution of FEA by type of accident.
| Year | 2001 | 2002 | 2003 | 2004 | 2005 | 2006 | 2007 | 2008 | 2009 |
|---|---|---|---|---|---|---|---|---|---|
| FEA (No.) | 157 | 156 | 135 | 107 | 98 | 66 | 43 | 27 | 24 |
| Year | 2010 | 2011 | 2012 | 2013 | 2014 | 2015 | 2016 | 2017 | 2018 |
| FEA (No.) | 26 | 22 | 11 | 18 | 14 | 7 | 9 | 9 | 1 |
Distribution of gas FEA by year
3.1.8. Place of occurrence
It can be seen from Figure 10 that a majority of FEA happened in coal mines, which accounted for 54% of the total. One reason is that China is a major coal producer with densely distributed coal mines and inadequate mine gas techniques. Factories contributed to the second largest number of FEA, which took up 17% of the total. One reason for the frequent explosions in factories is that equipment like boilers, reactors and pressurized containers can explode during production and processing in various plants. Also, recent years has witnessed a number of explosions of wood dust, grain dust and metal dust. Another reason is that some hazardous chemicals are more likely to cause explosions in chemical enterprises due to their unique properties. Residential buildings were the third most common places of FEA, which is because residents’ safety awareness and their ability to handle fuel gas leakage are still insufficient in the context of rapid fuel gas popularization in cities. For this reason, FEA due to fuel gas leakage, tank corrosion and other factors are constantly being reported. In addition, fireworks factories were also places of frequent explosions. This is because Spring Festival is a traditional Chinese festival, during which people will set of fireworks to celebrate it. However, some fireworks manufacturers pursue pecuniary interests at the cost of production safety. This, together with the backward production technology, negligence of safety training, imperfect safety management system and illegal production despite repeated prohibitions, has led to FEA in these factories. Fewer FEA happened in other places, but they still resulted in casualties and property losses.
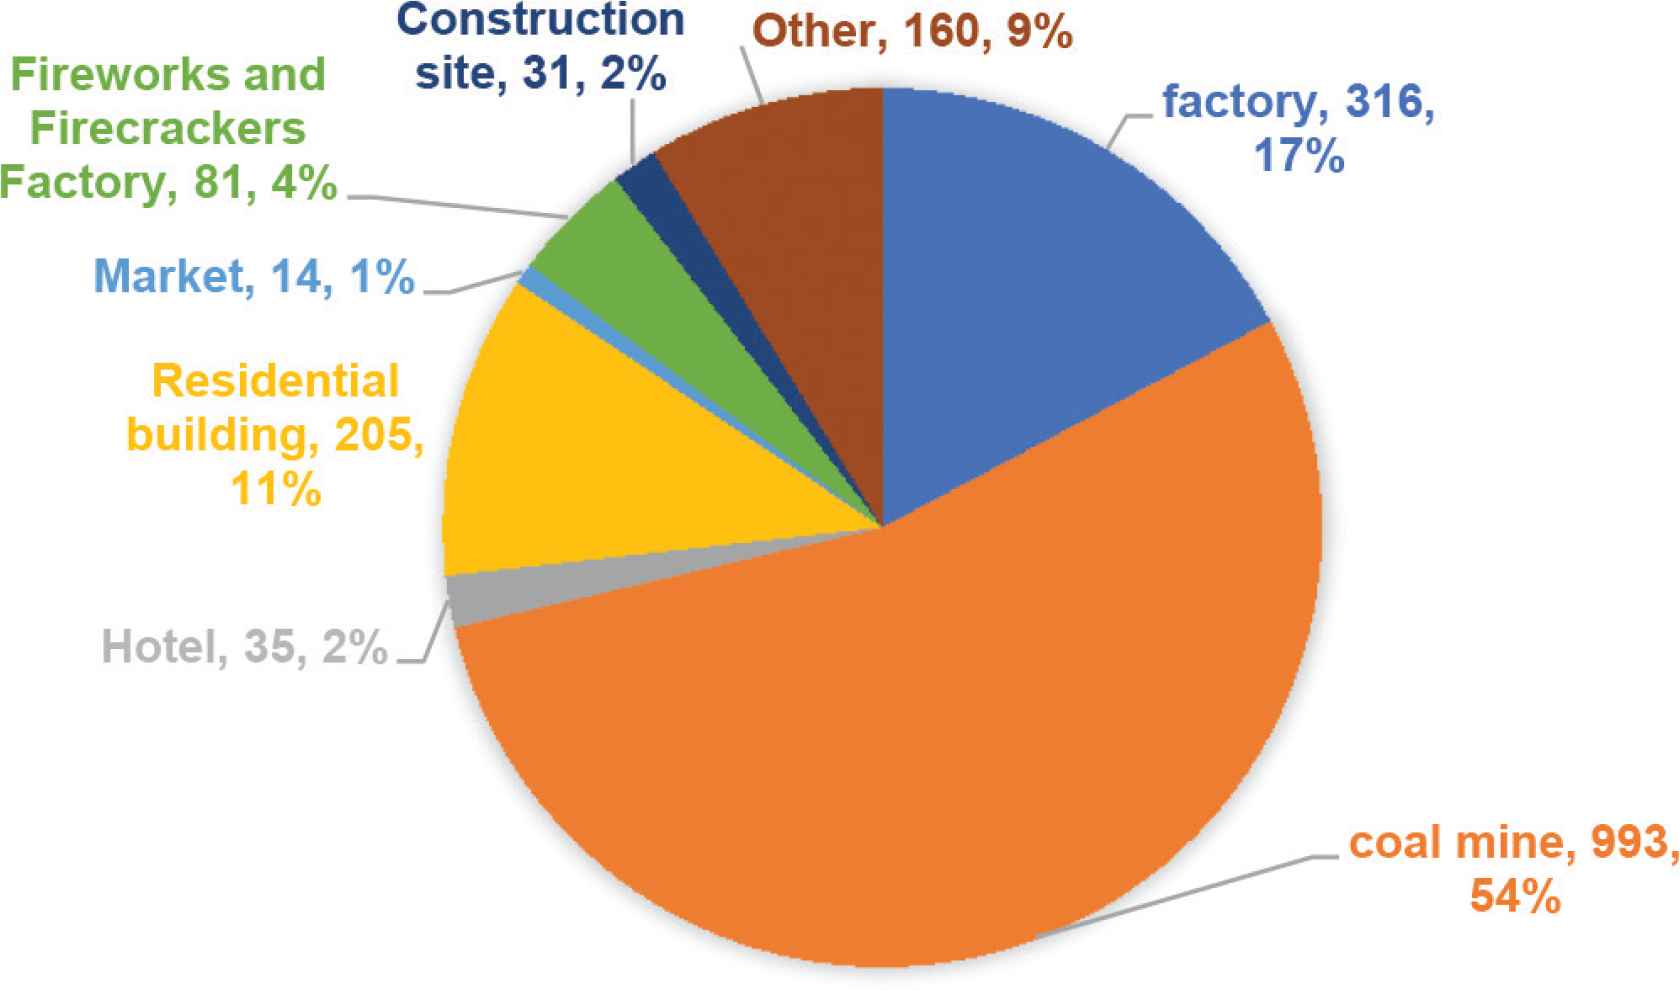
Distribution of FEA by place of occurrence.
3.2. Correlation Coefficient Analysis
To further identify the patterns of FEA, the correlation between the factors of 1835 fatal explosions except year was investigated. To begin with, the correlation analysis was made with Severity of Accident (SA) as the dependent variable and month Day of Week (DW), Time Interval of Day (TD) and Type of Accident (TA) as independent variables, followed by another correlation analysis with TA as the dependent variable and month DW and TD as independent variables.
The contingency table was used in this study. The coefficients of the correlation between various factors are shown in Table 6 (confidence interval: 95%). According to the table of r × c (r > 2 and c > 2), the correlation was verified using Cramer’s coefficient. If Cramer’s coefficient between two factors was larger than 0.1 (p < 0.05), they are considered to be significantly correlated.
| SA1 | SA2 | SA3 | SA4 | SUM | |
|---|---|---|---|---|---|
| January | 21 | 115 | 14 | 1 | 151 |
| February | 19 | 67 | 20 | 4 | 110 |
| March | 17 | 108 | 22 | 6 | 153 |
| April | 27 | 110 | 23 | 4 | 164 |
| May | 8 | 134 | 28 | 4 | 174 |
| June | 16 | 124 | 15 | 4 | 159 |
| July | 19 | 118 | 15 | 7 | 159 |
| August | 24 | 103 | 20 | 5 | 152 |
| September | 18 | 86 | 16 | 1 | 121 |
| October | 19 | 112 | 26 | 5 | 162 |
| November | 20 | 106 | 32 | 11 | 169 |
| December | 21 | 123 | 11 | 6 | 161 |
| SUM | 229 | 1306 | 242 | 58 | 1835 |
Distribution of FEA by severity of accident and month
Take the correlation between SA and month as an example. The statistics of relevant accidents are shown in Table 6.
Other data calculation results are shown in Table 7. It can be seen that there was significant correlation between SA and Month (V = 0.1003, p < 0.05) and between TA and Month (V = 0.1052, p < 0.01).
| Dependent factor | Independent factor | Chi-square | df. | Sig. p | Phi φ | Cramer’s V |
|---|---|---|---|---|---|---|
| SA | Month | 55.4 | 47 | 0.002** | 0.1738 | 0.1003 |
| DW | 24.13 | 27 | 0.570 | 0.1147 | 0.0662 | |
| TD | 29.53 | 27 | 0.304 | 0.1269 | 0.0732 | |
| TA | 109.8 | 31 | 0.349 | 0.2446 | 0.1412 | |
| TA | Month | 142.18 | 95 | 0.000** | 0.2784 | 0.1052 |
| DW | 60.29 | 55 | 0.009** | 0.1813 | 0.0740 | |
| TD | 42.63 | 55 | 0.292 | 0.1524 | 0.0622 |
p < 0.05,
p < 0.01.
Contingency table for correlation coefficients between factors
It can also be seen from Table 6 that the Sig. values p of the correlation between SA and DW, TD and TA were larger than 0.05, so there were no significant difference between them, indicating that the severity of a fatal explosion accident was uncorrelated with DW, TD and TA. Likewise, the Sig. values p of the correlation between TA and TD was also larger than 0.05 and there was no significant difference between them. Although the p-value of the correlation between TA and DW was smaller than 0.01, the Cramer’s coefficient was 0.0740, which indicated that there was no significant correlation between them. Thus, the type of a fatal explosion accident was uncorrelated with DW and TD.
To obtain more useful information from the factors of significant correlation, the internal relations between SA and Month and between TA and Month of the 1835 FEA were investigated. The relationship between SA and Month is shown in Figure 11.
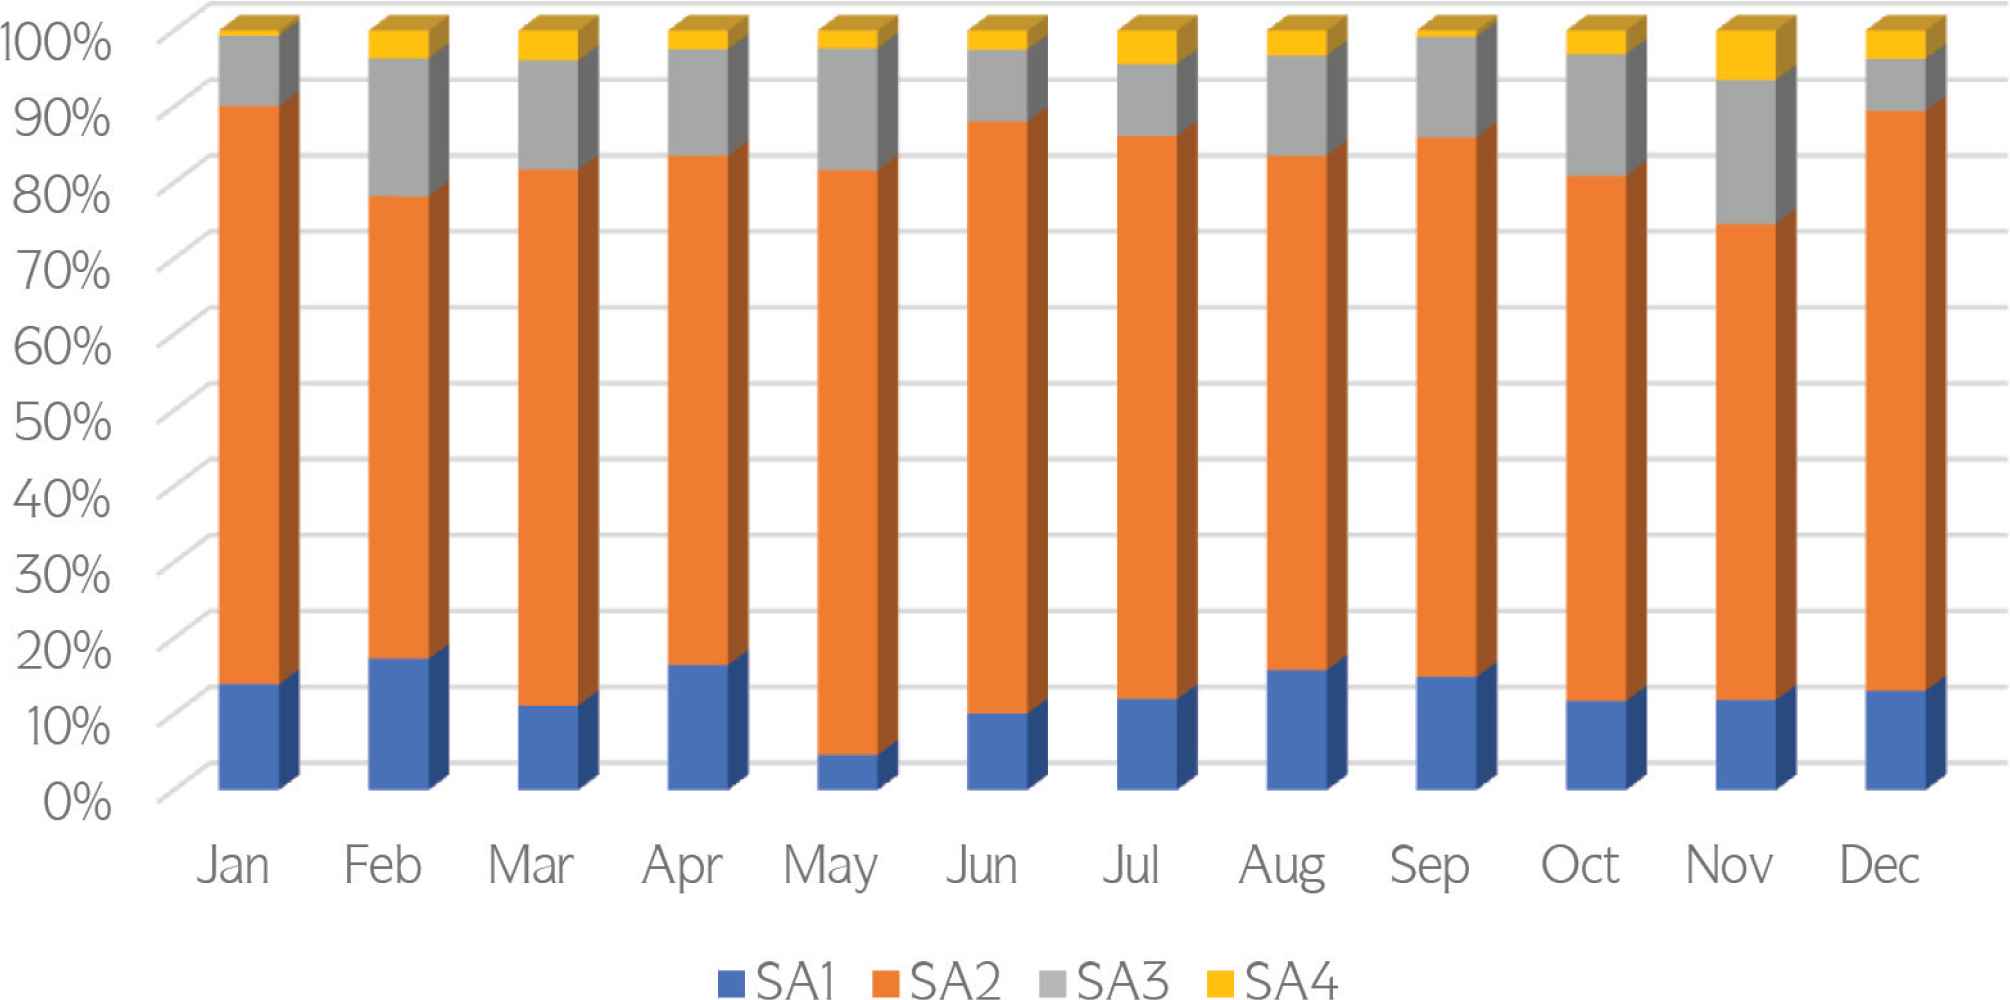
Cumulative percentage of SA vs. Month.
As shown in Figure 11, major and extraordinarily serious accidents were more likely to occur in November. Statistics suggested that there were 32 major FEA and 11 extraordinarily serious FEA in November, which accounted for 13.2% and 19.0% of the totals, respectively.
The relationship between TA and Month of FEA is presented in Figure 12, which indicates that there were more fuel gas explosions in April. 90% of fuel gas explosions were caused by improper use, valves and rubber hoses, etc. Gunpowder and dust explosions occurred more frequently in May because gunpowder and explosive dust may generate heat upon moisture and are thus more likely to explode as air humidity rises when the rainy season starts from late April to May every year. In November, fireworks explosions were constantly reported since November is the peak season of fireworks production and sales by the end of the year [9,22]. Workers in fireworks manufacturers are more prone to drop their guard as they are busy fulfilling the production targets, which can result in explosion accidents. In addition, many unlicensed small workshops recklessly disregard production safety, leading to an increase an increase in the number of fatal accidents caused by fireworks explosion.

Cumulative percentage of TA vs. Month.
4. CONCLUSION AND SUGGESTIONS
Explosion accidents feature high fatality and disability rates due to their intrinsic danger. This study is aimed to investigate the patterns of FEA that happened in practice in China, thereby providing the prevention and control of similar accidents with some references. According to the research above, the following conclusions can be reached:
Frequency statistics suggest that: (a) November is the month with the largest number of FEA and the highest death toll as caused. Thus, regulators need to strengthen daily supervision, especially safety inspections on fireworks manufacturers upon the Spring Festival. After the festival, however, it is advisable that safety managers take measures to restore the post awareness of workers from the festival atmosphere as soon as possible; (b) In terms of work hours, 08: 00-10: 00 and 14: 00-16: 00 are two time intervals when explosion accidents are more likely to happen. Hence, it is critical the enterprise safety managers hold pre-shift mobilization meetings to strengthen employees’ safety consciousness; (c) Although there is no typical “Monday effect” in FEA, it is still necessary for enterprises to carry out safety training once on every Monday before work; (d) In addition, most of the hazardous chemical explosions occur on Tuesday and Wednesday and pressurized container explosions mostly on Saturday; (e) Fatal mine gas explosions still account for a dominant proportion in FEA, which is especially true in Guizhou Province, Shanxi Province and Heilongjiang Province. For this reason, coal mine supervision should be strengthened; (f) Discussion from the Place of Occurrence, a majority of FEA happened in coal mines, accounted for 54% of the total. The government still needs to strengthen the supervision of coal mines, promote the coal mine gas collection and control technology research, to reduce the occurrence of explosion accidents.
The correlation analysis shown that: there is significant correlation both between TA and Month (Cramer’s V = 0.1003, p < 0.05) and between SA and Month (Cramer’s V = 0.1052, p < 0.01) of FEA, whereas other factors are not significantly correlated. Major and extraordinarily serious accidents are more likely to occur in November, fuel gas explosions in April, gunpowder and dust explosions in May and fireworks explosions in November. Therefore, safety supervisory authorities need to carry out specific rectification to ensure production safety.
CONFLICTS OF INTEREST
The authors declare they have no conflicts of interest.
ACKNOWLEDGMENTS
The authors appreciate the financial support from the
REFERENCES
Cite this article
TY  - JOUR
AU  - Lei Pang
AU  - Zhiwen Zhang
AU  - Kai Yang
AU  - Pengfei Lv
AU  - Siheng Sun
PY  - 2020
DA  - 2020/08/03
TI  - Patterns of Fatal Explosion Accidents in China
JO  - Journal of Risk Analysis and Crisis Response
SP  - 54
EP  - 63
VL  - 10
IS  - 2
SN  - 2210-8505
UR  - https://doi.org/10.2991/jracr.k.200714.001
DO  - 10.2991/jracr.k.200714.001
ID  - Pang2020
ER  -