
A Game Theory Approach for Multi-agent System Resources Allocation against Outside Threats
- DOI
- 10.2991/jracr.k.191024.003How to use a DOI?
- Keywords
- Multi-agent system; external threat value; resources allocation; Nash equilibrium; Shapley value
- Abstract
This study proposes an integrated model for the deployment of multiagent resources for resisting outside threats. The proposed two-stage model applies the divide-and-conquer strategy to solve the resources allocation problem. First, the interactive actions between an external attack and a response agent are modeled as a non-cooperative game, after which the external threat value is derived from the Nash equilibrium. Second, the threat values of all response agents are utilized to compute each agent’s Shapley value. Then an acceptable resource allocation of agents based on their expected marginal contribution creates a minimum set of resource deployment costs. The experimental results show that our approach is feasible as a means to mobilize search and rescue resources from a non-affected district and to improve relief efforts against earthquake damage. The Shapley value allocation approach proposed in this study; the percentage of resources allocation of districts is closer to death rate of each district than the proportional division of resources.
- Copyright
- © 2019 The Authors. Published by Atlantis Press SARL.
- Open Access
- This is an open access article distributed under the CC BY-NC 4.0 license (http://creativecommons.org/licenses/by-nc/4.0/).
1. INTRODUCTION
Emergency Response Systems (ERS) and Homeland Security Advisory Systems (HSAS) are both centralized Multiagent Systems (MASs) which delegate multiple interacting agents to resist outside attacks. However, the effectiveness of these MASs as a means to defend entire large-scale geographic regions is constrained by the available resources. The system administrator faces a density of agent deployment dilemmas, where the disposition of more agents easily leads to higher costs. These systems also lack specific measures for rational decision-making, and do not apply mathematical models to capture the interactions between attacker and defender. The administrator of a MAS should have a tool to measure the strength of the attacks and the resistance capability of the response agents. By considering the utilities of moves available to the attacker and the defender, we can find a way to build a rating system for decision making [1].
Game theory tools provide analytical techniques that are already applied in many other research areas, where multiple agents compete and interact with each other within a specific system. In most multiple agent interactions, the overall outcome depends on the choices made by all self-interested agents. The goal is to make choices that optimize the outcome [2]. Game theory also provides general mathematical techniques for analyzing goal-conflict and cooperation between two or more individuals [3].
This study surveyed several game theoretic approaches to be applied when external attacks threaten the MAS. These MASs include ERS, HSAS, and security force reallocation systems. However, there are common problems related to extension and scalability that are often encountered [4]. When these game theory models are played by more than four players (i.e., agents), it is not easy to compute the Nash Equilibrium (N.E.) of the payoff matrix in a multi-dimensional game. Because MASs consist of multiple agents, these computations are complex and therefore pose a challenge for classical game theory. The model uses two steps for solving the growing amount of MAS agent work. A framework is formed for deploying multiple agents using game theory, which analyzes the detected threats (or attacks) and allocates the resources of the MAS as much as efficiently as possible.
The game theory model is appropriate for analyzing the interactions of MAS agents and to deal with the Resource Allocation Problem (RAP) [5,6]. However, when many agents face external attacks, the whole MAS may suffer from limited resources to resist these attacks. The two-stage model applies the divide-and-conquer idea to divide the scalability problem into two parts. First, a non-cooperative game is applied to model the conflict of goals between an attacker and a response agent, after which the external threat value (i.e., the strength of the attacker) is derived from the Nash equilibrium. Second, a cooperative game is used to solve the RAP among MAS agents, in particular, by increasing the number of agents. The threat values of all response agents are utilized to compute each agent’s Shapley value. Then an acceptable resource allocation of agents based on the expected marginal contribution creates a minimum set of resource deployment costs.
The proposed model is applied to reallocate Search-and-Rescue (SAR) resources after a strong earthquake event, to maximize the capacity of the security response teams and minimize the number of emergency responders needed. The experimental results show that the model is feasible as a means of mobilizing SARs from a non-affected district and to improve relief efforts against earthquake damage.
2. MAS RESPONSE REGION
In general, the MAS agent is regarded as a software agent although they could be robots, humans or human teams, or even a combination of human-agent teams. MASs can represent self-organized and complex behaviors even when the individual skills of all their agents are simple [7]. In this study, various MASs including Intrusion Detection System (IDS), HSAS, and ERS are surveyed. The agents possess skills and offer emergency services to protect the MAS from external threats. A response agent can be a node in the IDSs software, a response crisis unit comprised of human teams in HSAS, or agencies which assist in dealing with any emergency, such as a detector, SAR-group, security force agency, etc. Figure 1 shows the interactions of an agent in the MAS under external threats (or attacks). As the external attacker chooses its moves to attack the MAS, the response agent uses their moves to resist the external attack.
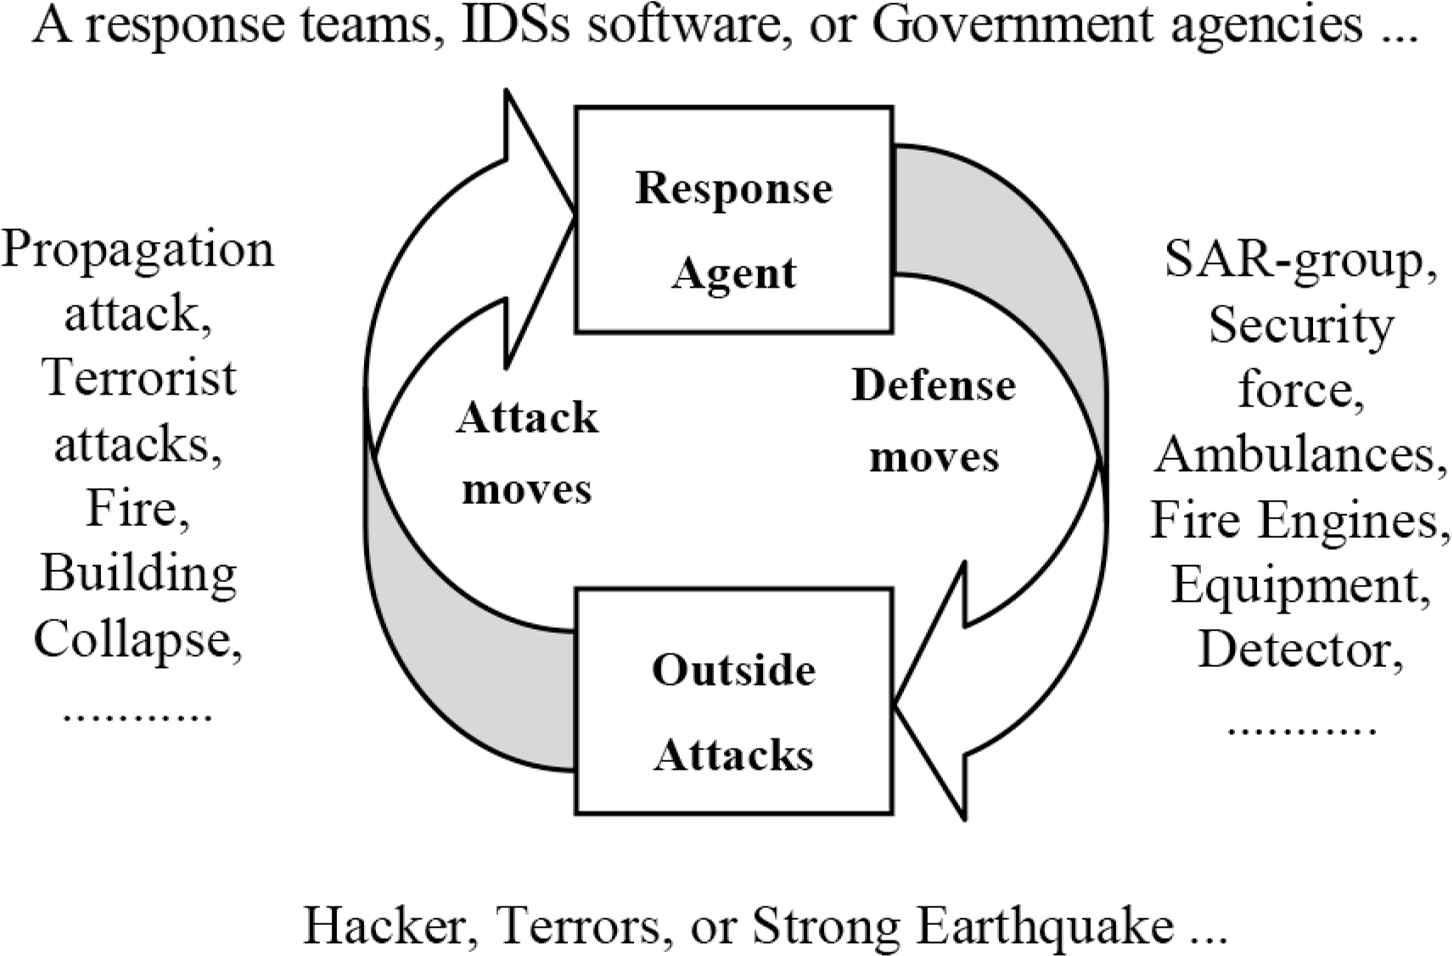
Behaviors and interactions between response agents and external attacks.
This study assumes that the MAS architectures (e.g., ERS or HSAS) will face external threats, rather than internal attacks. Each agent has a possibility of an attack that is an external threat to the MAS. An attack is an event which happens in the MAS. In contrast, a threat is not an actual event. Therefore, we define an external threat as “a possibility of outside attack” created by an attacker who will attack the MAS, or by an unexpected disaster, such as a strong earthquake. In this situation, each agent possesses detection techniques, raises alerts, and improves emergency responses against the external attacks (e.g., large earthquake attacks) (see Figure 1).
Figure 2 shows the five interaction steps among SAR agents faced with external attacks.
- (i)
Each agent faces a sudden attack in the external threat environment.
- (ii)
The agent’s goal is to resist the external attack. He/she utilizes specific resources, such as fire fighters, rescue-groups, ambulances, equipment and statistical analysis to report and relieve damage. These specific techniques refer to the SAR agent’s capability which controls and handles its resources.
- (iii)
Each agent reports to the coordinator (e.g., Emergency Operation Center: EOC) about its own capability and resources as it resists the attack.
- (iv)
The only goal in this environment is the optimization of MAS resource allocation. After the coordinator measures the value of a threat to all agents and analyzes its decisions, he/she determines and commands all SAR agents to mobilize and redistribute resources.
- (v)
According to the commands of the EOC, each agent begins to employ his/her own resources or make them available for someone else. In other words, some agents’ resources are redistributed to the critical agents so as achieve the goal of resisting serious attacks and discarding non-affected agents.
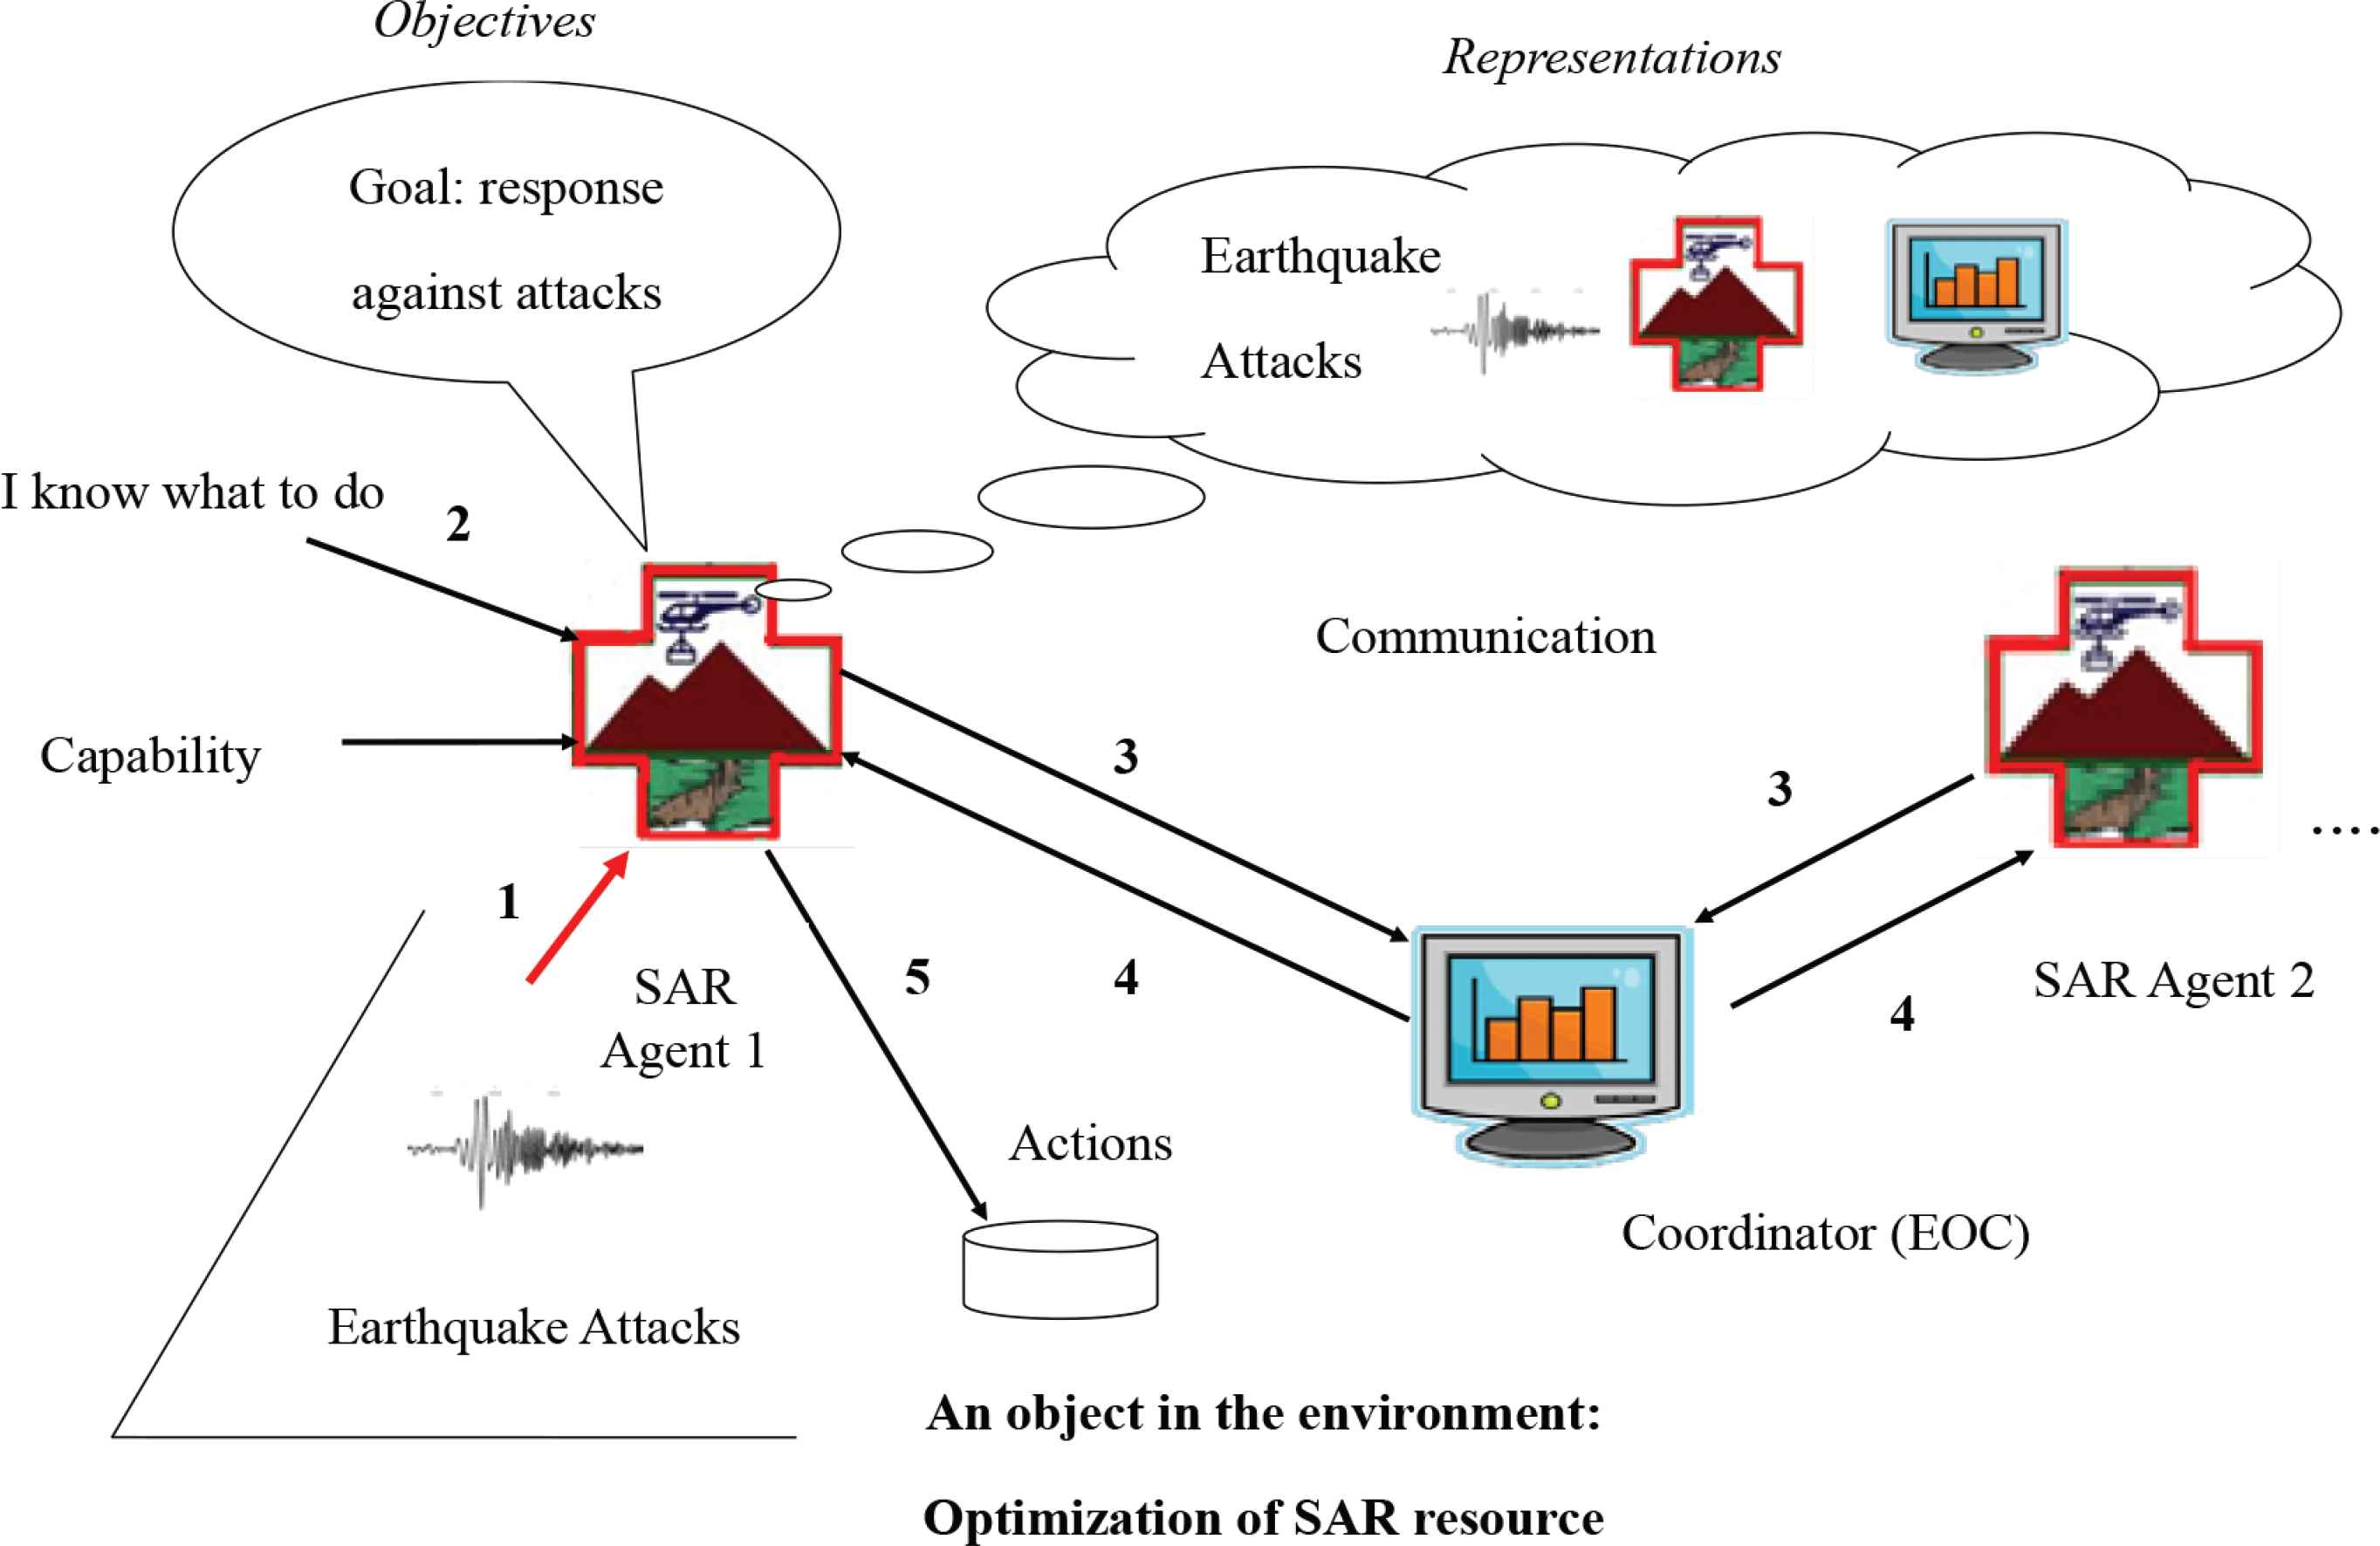
An illustration representing the interactions of an SAR agent with its external attacker and EOC.
3. RELATED WORKS
Several game theory approaches have been applied in which external attacks threaten a MAS which could include ERS, HSAS, and security force reallocation systems. Various approaches have been applied to model the interactions between attackers and defenders for computer network intrusion detection. Burke [8] proposed a two-player game framework to model the information warfare between two players, an attacker and a system administrator. In his model, the mixed strategy equilibrium was used to construct a player’s optimal solution. The strategies and scenarios of the model are simple extensions of a few simulations to analyze how it would behave in real situations.
Other approaches also have been applied to model the interactions between terrorists and defenders for counter-terrorism purposes. Paruchuri et al. [9] deployed a software assistant agent that aided police or other security agencies in randomizing their security schedules. They improved the security capability of anti-terrorism forces when dealing with multiple agents posing an intentional threat. The model maps the problem of check-point scheduling as a Bayesian Stackelberg game. The proposed model is faster than the multiple-LP method because it simply solves the mixed-strategy N.E. However, Bayesian concepts do not fully apply in real situations, and the model did not consider incomplete information regarding the type of adversary. The solution of the Bayesian N.E. is an NP computation. Their model also encountered the many-players problem, which involves the extension and scalability of the proposed model.
Alpcan and Basar [10] proposed the utilization of cooperative and non-cooperative game theory concepts to address some of the basic network security tradeoffs. They constructed a sensor warning system and a security game for making various decisions, analysis and, IDS control schemes. The sensor warning system generates a security risk value for the IDS agent (i.e., sensor). This value could have various levels and the calculation is based on simple detection output. However, the strategy between the IDS and the attacker was incomplete, because it did not consider the propagation attacks in a game, therefore their model could not satisfy the decision-making requirements for IDS control. Their proposed model consists of two independent schemes. Our study combines their proposed non-cooperative game with a cooperative game to solve the RAP in a MAS.
3.1. Why Game Theory?
Gupta and Ranganathan [11] surveyed several optimization approaches such as Genetic Algorithms (GA), the Bayesian Search (BS) method, as well as Random Search (RS) and Greedy Allocation (GS) methodologies. These algorithms cannot be applied to the multi-crisis management problem because they do not provide individual rationality and some of the members of the population become dominant as the algorithm progresses. However, using game theory, scenarios that optimize multiple competing objectives can be modeled. Game theory presents interactions between self-interested agents and analysis as to which strategies can be designed that will maximize the benefits of an agent in a MAS. Many of the applications of game theory have been to analyze the negotiation and coordination of multiple agents. Game theory can be a useful tool for building future generations of mixed game theory and decision theory agents [3].
In a non-cooperative game, each player tries to utilize resources at minimum cost and the coordination is not enforced externally but is self-enforcing. All players optimize their decisions which maximize their payoffs in a non-cooperative game. N.E. is a solution concept for a non-cooperative game which identifies a prediction of the game outcome such that every player in the game is satisfied with respect to every other player [12]. N.E. provides a theoretical prediction of attack in a conflict situation, where individual MAS agents suffer from external attacks. The interactions between an external attacker and a response agent can be modeled as a non-cooperative game.
The Shapley value is a solution concept for cooperative games which computes the power index of an individual for cost allocation [13]. The cooperative game provides a suitable model for the design and analysis of response agent deployment, and it has been shown that the famous Shapley value rule satisfies many nice fairness properties [14]. The Shapely value also identifies a socially fair, good quality allocation for all agents. Here, the individual fairness for each player is optimal and the average fairness of the MAS is high. The social optimality property ensures that each player in the game receives the best utility for herself/himself and the complete MAS. A power index in the form of the Shapley value is applied to calculate the marginal contribution among agents and achieve a mutually agreeable division of cost for MAS deployment [2].
4. THE PROPOSED MODEL
There are two schemes applied in the proposed model. A simplified workflow chart describing the principles for optimal agent deployment is given in Figure 3. In the first scheme, the interaction processes between the attacker (or attacks) and the defensive agent are modeled as a two-person non-cooperative game (zero- or general-sum game), taking into account the interactions of security measures among agents and attackers. The proposed payoff functions utilize the external threat measures (such as defensive or offensive capability) for two players. The N.E. derived from these functions is calculated to assign a unique external threat value for the agent. Then, the second scheme constructs a resource allocation game. The power index of the Shapley value is applied to calculate the marginal contribution among MAS agents, to find a mutually agreeable division of cost for deployment. This study revises Owen’s method [15] to propose a Shapley value formula. MAS agents are grouped into coalition groups based on the threat levels to provide an acceptable MAS deployment. The Shapley value can be used to assure the derivation of a unique solution for each agent in the MAS resource sharing interactions. Let
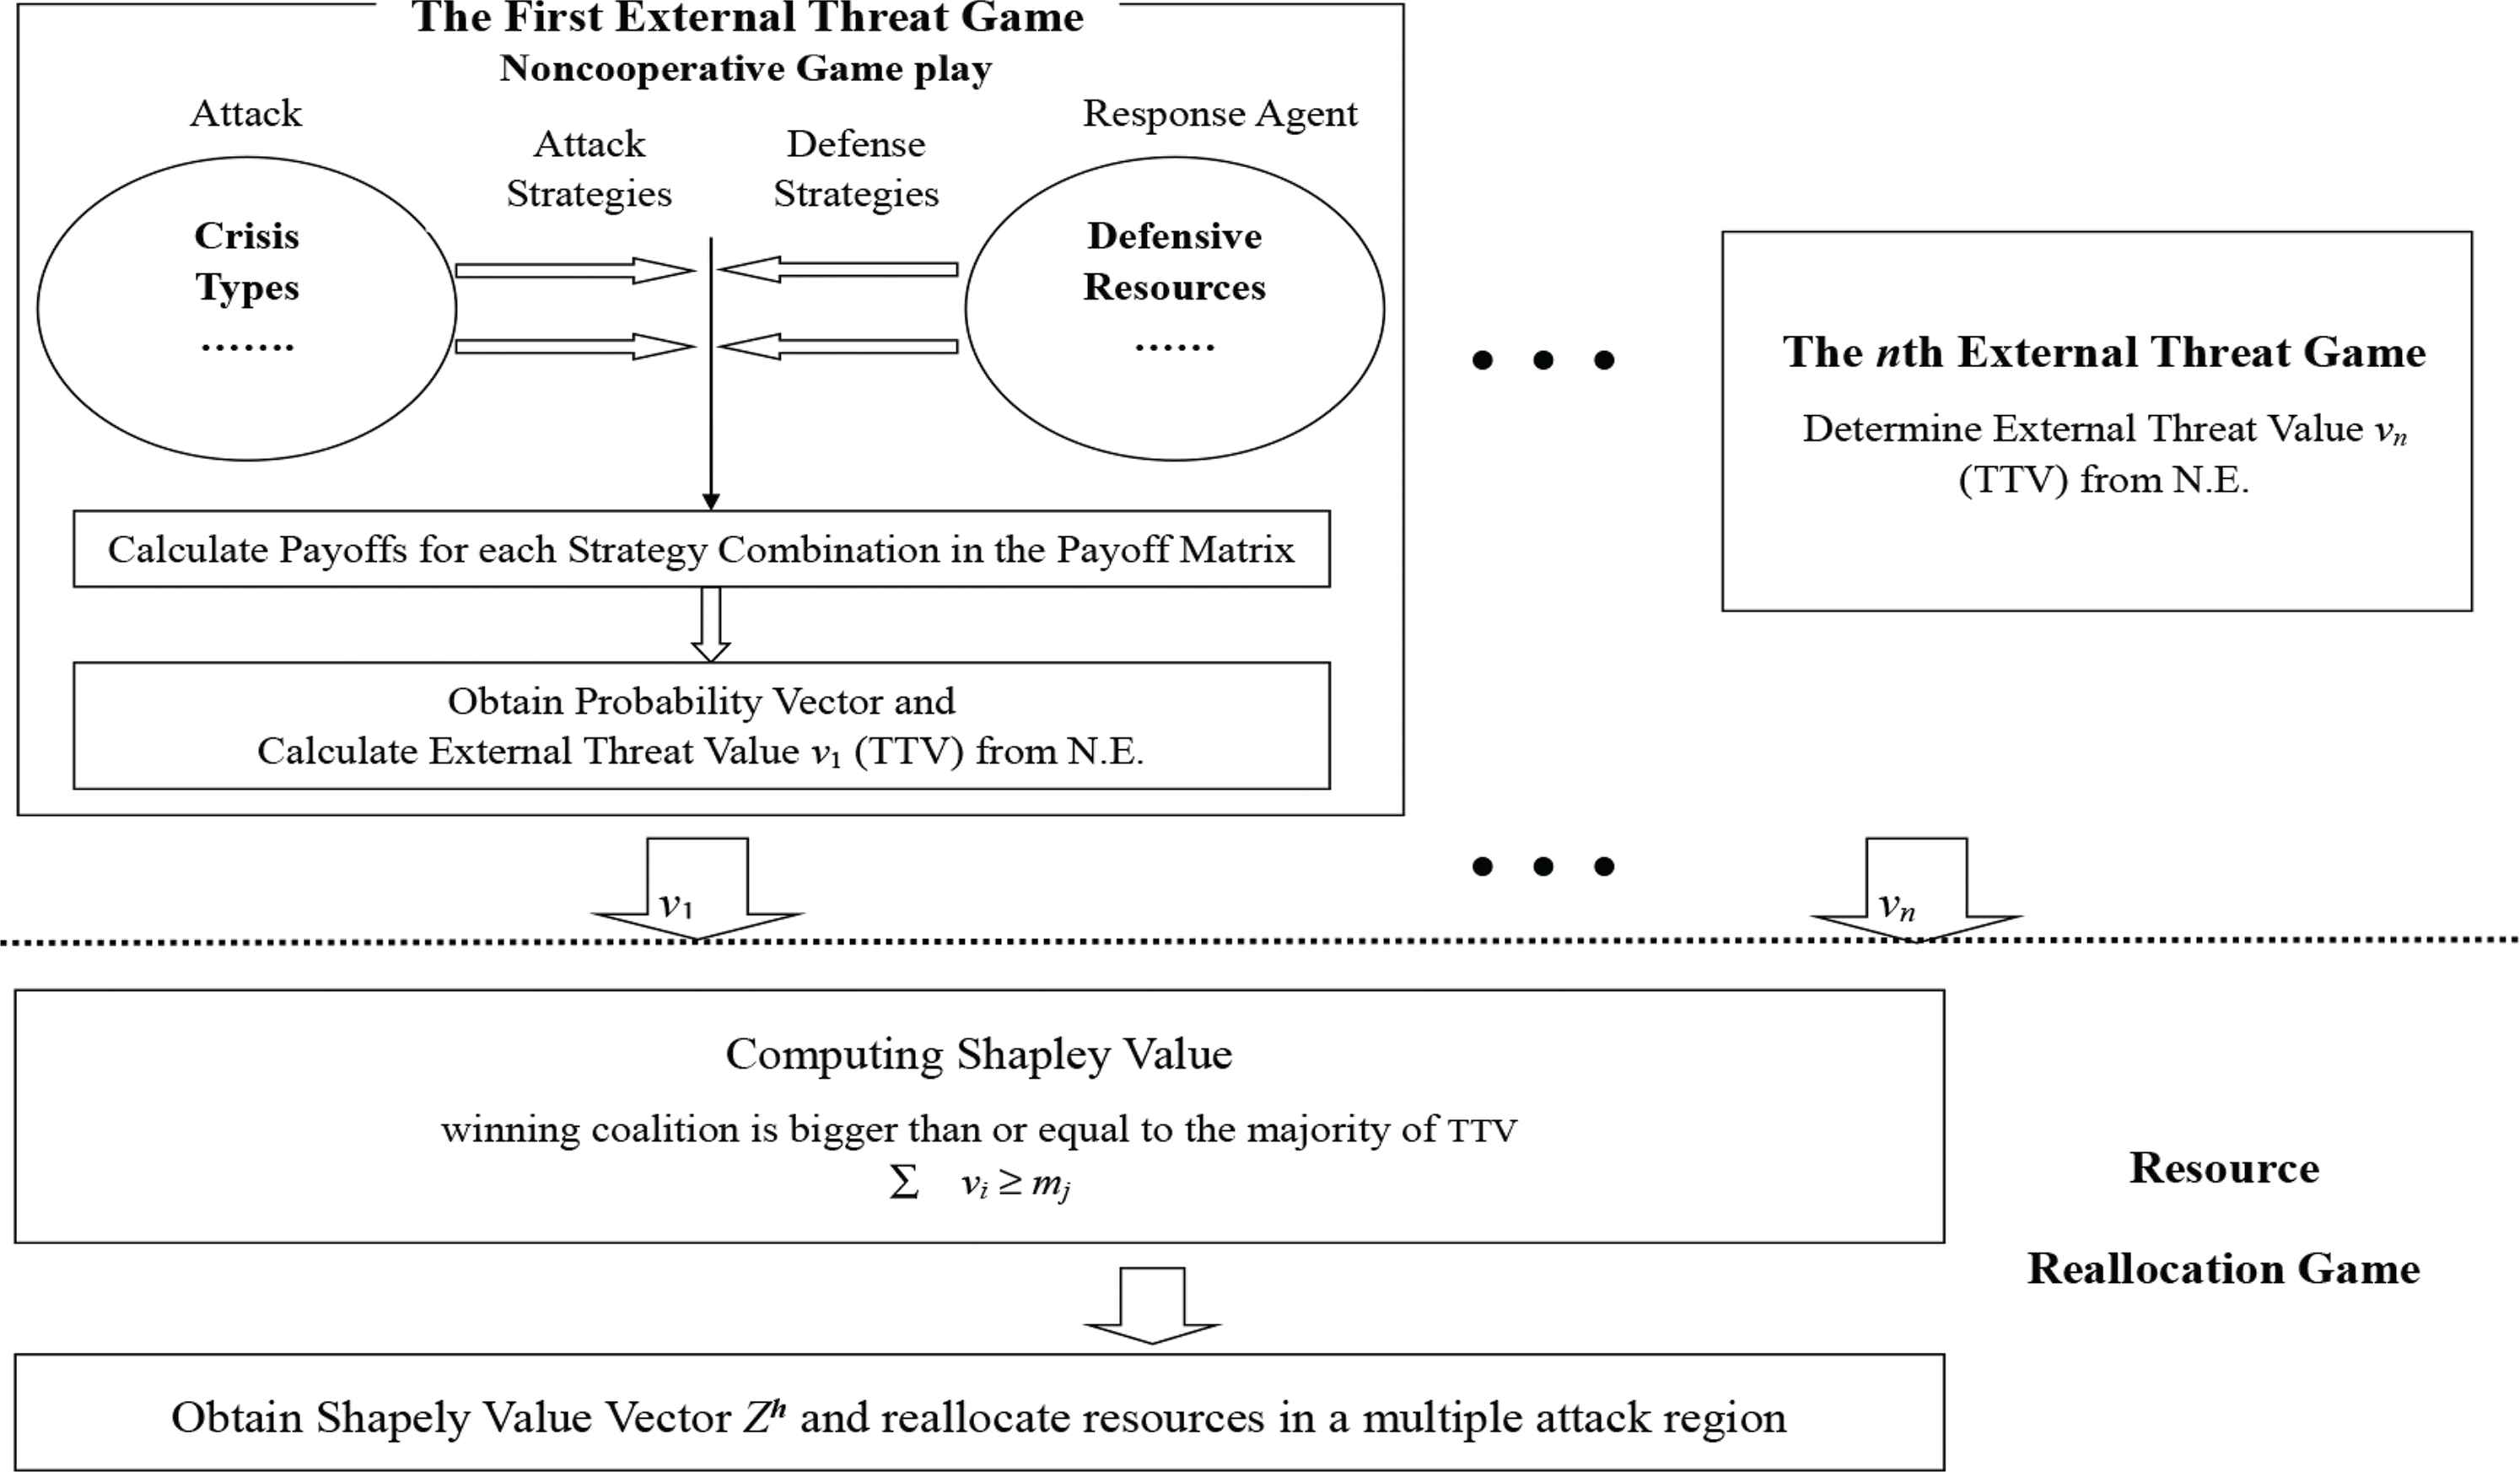
Flowchart of the proposed model.
4.1. The External Threat Game
The first game models the interactions of an attacker (or attack) and a response agent. When an agent confronts an external attacker, both face a competitive situation. The relationships between external attacker and response agents include pure and impure conflicts, and their behaviors are non-cooperative. Thus, in the first stage, a non-cooperative game is applied to model decisions and to analyze the best responses. The two-player non-cooperative game is defined as follows:
- (i)
The set of players A: The first model only has two players. The attacker is player 1 and the response agent is player 2. A = {Attacker, Response agent}.
- (ii)
Strategy space Si: A set of all possible strategies available to two players in a game.
- (iii)
Payoff πi: The expected utility to a player as a function of the strategies chosen by an attacker or response agent.
Let G = <A, (Si), (πi)> be such a normal form game. Sometimes this game cannot determine a pure N.E. strategy, because there is probably no N.E. However, every finite normal form game has a mixed-strategy N.E [16]. Thus, this study can also derive another strategic game from G, called the “mixed extension” of G, in which the set of actions Ai of each player i is the set of mixed strategies in G. More generally, suppose that player i has K pure strategies: Si = {si1, …, s1K}. Then, a mixed strategy for player i has a probability distribution (pi1, pi2, …, piK), where piK is the probability that player i will play siK, for k = 1, …, K. Since pik is a probability, this study requires 0 ≤ piK ≤ 1 for k = 1, …, K and pi1 + ⋯ + piK = 1, where pi is used to denote an arbitrarily mixed strategy from the set of probability distributions over Si, just as si is used to denote an arbitrary pure strategy from Si.
Let J denote the number of pure strategies in S1 and K indicate the number in S2. Now, S1 = {u1, u2, …, uJ} and S2 = {d1, d2, …, dK} are rewritten using uj and dk to denote pure arbitrary strategies from S1 and S2, respectively. A J × K payoff matrix is created for the external threat game based on the two players’ strategies and interactions (see Table 1).
| Response agent | ||||||
|---|---|---|---|---|---|---|
| d1 | d2 | ... | dK | r-mix | ||
| Attacker | u1 | π1(u1, d1), π2(u1, d1) | π1(u1, d2), π2(u1, d2) | ... | π1(u1, dK), π2(u1, dK) | r(u1) |
| u2 | π1(u2, d1), π2(u2, d1) | π1(u2, d2), π2(u2, d2) | ... | π1(u2, dK), π2(u2, dK) | r(u2) | |
| ... | ... | ... | ... | ... | ... | |
| uJ | π1(uJ, d1), π2(uJ, d1) | π1(uJ, d2), π2(uJ, d2) | ... | π1(uJ, dK), π2(uJ, dK) | r(uJ) | |
| q-mix | q(d1) | q(d2) | ... | q(dK) | ||
A payoff matrix for the external threat game
If player 1 believes that player 2 will play the strategies {d1, d2, …, dK} with the probability q = (q(d1), q(d2), …, q(dK)) then player 1’s expected payoff from playing the pure strategy uj is [Equation (1)]
Player 1’s expected payoff from the mixed strategy r, given in Equation (2), is the weighted sum of the expected payoff for each of the pure strategies {u1, u2, …, uJ}, given in Equation (1), where the weights are the probabilities r(u1), r(u2), …, r(uJ). Thus, for the mixed strategy r(u1), r(u2), …, r(uJ) is the best response for player 1 and 2’s mixed strategy q(dk), and it must be that r(uj) > 0 only if [Equation (3)]
This study computes player 2’s expected payoff when players 1 and 2 play the mixed strategies r and q, respectively. If player 2 believes that player 1 will play the strategies (u1, u2, …, uJ) with the probabilities (r(u1), r(u2), …, r(uJ)), then player 2’s expected payoff from playing the strategies (d1, d2, …, dK) with the probabilities (q(d1), q(d2), …, q(dK)) is [Equation (4)]
Given M1(r, q) and M2(r, q) this study restates the N.E. requirement that each player’s mixed strategy is the best response to the other player’s mixed strategy: for the pair of mixed strategies (r*, q*) to be a N.E., r* must satisfy [Equation (5)]
In Table 1, player 2’s expected payoff is computed when players 1 and 2 play mixed strategies r and q respectively. If the game G has no pure strategy N.E., a mixed N.E. pair (r*, q*) exists in this game, which is an optimal strategy [18]. The mixed N.E. for the probability vector is r* = {r*(u1), r*(u2), ..., r*(uJ)} with actions {u1, u2, ..., uJ} for the external attacker and the vector q* = {q*(d1), q*(d2), ..., q*(dK)} with actions {d1, d2, ..., dK} for the response agent. The external attacker’s expected payoff for a N.E. (pure or mixed strategy) is defined as its external threat value. Player 1 (i.e., the external attacker) obtains the positive payoff (+), because player 1 gains a profit from player 2’s resource responses. Player 2 (i.e., the response agent) obtains a negative payoff (−), which means that player 2 pays for player 1’s attack. When the response agent (i.e., player 2) gets a low expected payoff, the external attacker (i.e., player 1) gets a high expected payoff and the threat of external attack is high. Because player 1’s expected payoff always represents a gain (+), this study defines the vi as the ith response agent’s threat value, given by [Equation (7)]
Therefore, vi is derived from the attacker optimal strategies’ expected payoff which represents the threat value in the first game model. The next proposed model uses the threat value vi to compute the Shapley value of each agent within the cooperative game.
4.2. Resource Reallocation Game
In this study, it is assumed that a central planner of the Security of Center (SOC) or Emergency Operation Center (EOC) can command and control MAS resource allocation [19]. Each agent reports its degree of threat (or threat value) to the central planner. The central planner computes the Shapley value based on the threat values of all agents in order to command agents to dispatch resources. In this second game, the interactions of all response agents in the MAS response region are likened to the playing of a cooperative game. An efficient method is needed to decide the number and priority of the deployment of resources to various response events when multiple attacks occur simultaneously. The Shapley value is applied to create an optimal allocation of resources for the SOC commander during multiple attacks. We utilize the concept of the majority coalition in a party voting game to deal with MAS resource reallocation. A majority of voters can pass any bill in the majority game. The power of a voter will depend on how crucial that voter is to the formation of a winning coalition [15]. The Shapley value can provide a measure of the power of each voter, which is represented by the power index. When the sum of external threat values of some attacks passes the threshold of the majority level, the formation of a winning coalition is enabled, and the power index of each attack can be computed.
We define y: V → R+ as a one-to-one function by assigning a positive real number to each element of v (i.e., external threat value) and y(0) = 0, V = {v1, v2, …, vi}, i ∈ n. The majority of the attack level hH is derived from a majority of all external threat values which represents the corresponding threshold value mH. The allocation of the response agent resources is based on the concept of the majority of external threat values. Given the output vector of all external threat values of attacked events, the majority level is hH, if the sum of the external threat values of attacks is greater than or equal to mH [Equation (8)]
The external threat values of attacks can be grouped into the majority level hH. This is divided by 2 from the maximum value vMax to minimum value vMin. All response agents can be modelled as an N-person game with X = {1, 2, …, N}, which includes a set of players (i.e., response agents) and each subset V ⊂ X, and where vj ≠ 0, ∀j ∈ V is called a coalition [2]. The coalition of X response agent groups in the mth threshold of the threat level, and each subset of X (coalition), represents the observed threat pattern for different threat levels H. The aggregate value of the coalition is defined as the sum of the threat values of the response agent, y(C) = ∑i∈c vi and is called a coalition function. Each response agent coincides with one or another given m thresholds of the threat level. Therefore, the different priorities for the response agent deployment are derived from the thresholds. Based on the external threat for each MAS response agent with respect to others, and the effect of the threshold values on various threat levels, the Shapley value represents the relative importance of each response agent. Now let y(C) = ∑i∈c vi vi ∈ V, C ⊂ X be the value of coalition C with a cardinality of c. The Shapley value of the ith element of the response agent vector is defined by [Equations (9) and (10)]
Equation (9) can be simplified to Equation (10), because the term y(C) − y(C − {i}) will always have a value of 0 or 1, taking the value 1 whenever c′ is a winning coalition. If it is not a winning coalition, the terms C − {i} and y(C) are 0 [15]. Hence, the Shapley value is ω(i), where C′ denotes the winning coalitions with ∑i∈c vi ≥ mi. The Shapley value of the ith response agent output indicates the relative threat value for the thresholds mH (i.e., threat levels). Therefore, a Shapley value vector shows the strength of all external attacks. We can use all Shapley values to compute the reallocation amount of emergency response resources of the agent. The numbers of resources of type k reallocated to the ith agent are defined by [Equation (11)]
5. SAR RESPONSE CASE
The September 21, 2009 earthquake claimed 2297 fatalities, according to the National Fire Agency and Ministry of the Interior of Taiwan. Almost 90% of these victims died within 1 day of the event and 56% died within 6 hours (nearly 1284 victims) [20]. As we know, the key point to minimizing the total number of fatalities after an earthquake is the deployment of SAR efforts in the first few hours. In an emergency response region, there are usually a number of alarm districts-each equipped with resources that must be able to be deployed quickly and effectively after any kind of emergency. However, the SARs (e.g., fire fighters, rescue-groups, ambulances, and equipment) available to some affected districts may be limited.
A devastating earthquake brings with its multiple disasters such as fire, building collapse and a combination of fire and collapse. In cases of multiple emergencies, each affected district might possess different response capabilities. Some form of the central emergency management system must be present in order to allocate response resources. This study focuses on the problem faced by the emergency manager: which affected districts are the major ones and which ones are minor? Which affected districts require first aid and to need more SAR resources? This is a deployment efficiency problem. An emergency manager must find an optimal resource allocation for assigning response resources in space and time to the affected districts and improve the relief efforts against earthquake attacks.
We apply the proposed model to solve the SAR resources allocation problem. Two games are constructed, representing the two stages needed for the economical deployment of available resources. One is the earthquake damage game which calculates the value of the earthquake threat in each district. Another is the SAR resource reallocation game which efficiently mobilizes the available resources of the response agent to increase the survival rate of earthquake victims.
5.1. The Model Assumptions
Certain assumptions must be made when treating a multi-emergency and response management scenario as a game theory framework. The assumptions are listed below.
- (i)
After the deadliest quakes, emergencies will occur in different districts in a time-overlapped manner, and resource requests will be simultaneously received by the central response agent managers (see Table 2). We assume the multi-emergency event is player 1 and the district response agent is player 2. Hence, two players can use a static single step. Each player plays a non-cooperative and a zero-sum game. A response agent manages one district. Three types of earthquake emergencies (i.e., fire, house collapse, and fire and house collapse) could occur simultaneously when evaluating the value of the earthquake threat in a specific time period.
- (ii)
The EOC has developed a training program to improve the emergency response agents’ capabilities. As seen in Table 3, the annual emergency training gives us the time needed to perform search and rescue activities from each of the resource sites. These data are generated by the training program through annual earthquake drills or exercises.
- (iii)
The first model is a normal form game for capturing the interactions between two players. This model assumes complete information; that is, every player knows the available strategies of every other player. Each district has a different number of resources available. In multiple emergencies, there is also complete information regarding the resource requirements, emergency priorities and the population density of the affected district (see Tables 2 and 4).
| Rescue groups | Ambulances | Fire engines | Machine and equipments | Priority (1–3) | |
|---|---|---|---|---|---|
| Fire | 0 | 1 | 2 | 0 | 1 |
| Collapse | 3 | 2 | 0 | 0.3 | 2 |
| Fire and collapse | 3 | 3 | 2 | 0.5 | 3 |
Emergency priorities, types, and the ratio of four resource requests
| Rescue groups | Ambulances | Fire engines | Machine and equipments | |
|---|---|---|---|---|
| Fire | 5 | 5 | 5 | 5 |
| Collapse | 5 | 5 | 5 | 5 |
| Fire and collapse | 10 | 10 | 10 | 10 |
| Total | 20 | 20 | 20 | 20 |
These average times (or min) are measured by the annual earthquake exercise.
Average times needed to perform search and rescue activities from the resource sites in ith district
| Districts | The number of available resources | |||||
|---|---|---|---|---|---|---|
| Population density | Rescue workers | Ambulances | Fire engines | Machine and equipments | ||
| A1 | TAIPEI | 94 | 350 | 250 | 600 | 100 |
| A2 | TAOYUAN | 100 | 100 | 100 | 200 | 60 |
| A3 | HSINCHU | 37 | 50 | 60 | 100 | 50 |
| A4 | MIAOLI | 19 | 25 | 40 | 50 | 45 |
| A5 | TAICHUNG | 73 | 125 | 100 | 250 | 65 |
| A6 | CHANGHUA | 74 | 75 | 50 | 150 | 65 |
| A7 | NANTOU* | 8 | 25 | 50 | 50 | 45 |
| A8 | YUNLIN | 34 | 25 | 50 | 50 | 45 |
| A9 | CHIAYI | 25 | 30 | 60 | 70 | 47 |
| A10 | TAINAN | 52 | 80 | 80 | 180 | 60 |
| A11 | KAOHSIUNG | 57 | 125 | 200 | 250 | 65 |
| A12 | PINGTUNG | 19 | 50 | 40 | 100 | 50 |
| A13 | TAITUNG | 4 | 20 | 20 | 30 | 44 |
| A14 | HUALIEN | 4 | 20 | 20 | 30 | 44 |
| A15 | YILAN | 13 | 25 | 20 | 40 | 45 |
| Total | 613 | 1125 | 1140 | 2150 | 830 | |
A strong earthquake occurred.
Population density and resource available in 15 disaster districts
5.2. Earthquake Damage Game
This game applied the first scheme of the proposed model, which is designed to obtain the threat value of the earthquake in each district. We assume that the multi-emergency event is player 1 and the district response agent is player 2. The interactions between multi-emergency event and response agent are modeled by a two-person game. It is assumed that both players are forming a set of non-cooperative players I = {I1, I2}, where I1 generates multiple emergency events; and I2 is the district response agent responding to allocate finite SAR resources, obtained by prioritizing the different districts. The parameters for determining the threat measures are defined in the following paragraphs.
5.2.1. Multi-emergency events
In the earthquake damage game, we assume the multi-emergency event to be player 1; three emergencies could happen simultaneously as a result of the player’s actions. S1 denotes the set of strategies available to player 1: S1 = {u1, u2, u3} = {fire, house collapse, and fire and house collapse}. The greater the seriousness of the emergency events, the more resources are needed. W denotes the set of resource requirements for multiple emergencies in one urban region. W = {w1, w2, ..., wn}. The variable wj,k denotes the number of resources required by uj emergency event from resource dk. Moreover, the priority for each emergency is related to the resource requirement. Typically, in a priority-based system, a high priority emergency needs more resources, and a lower priority emergency needs fewer resources. Each event is assigned a priority P on a scale of 1–3 indicating the severity of the emergency, which is used as a weight in the payoff function to facilitate the calculation of losses. pj denotes the priority of the jth emergency: pj = 1, 2, 3, where 1 is the lowest level and 3 is the highest. An emergency event on a densely populated target would increase the number of fatalities and thus would gain greater benefit for player 1, while the response agent must pay a higher rescue cost. βi denotes the population density of the ith district in the whole region.
5.2.2. Response agent
Each alarm district has different response agents, which in turn have varied resources to prepare for multiple emergencies. In the earthquake damage game, the response agent is player 2, who holds four resources (i.e., four strategies). S2 denotes the sets of strategies player 2 has access to: S2 = {d1, d2, d3, d4} = {rescue worker, ambulance, fire engine, and machine and equipment}. O denotes the set of resources available to response agents in one district: O = {o1, o2, o3, o4}. ok denotes the number of resources available at resource dk, and tj,k denotes the time for resource dk to reach the uj emergency; k ∈ 1, 2, 3, 4. We assume these times are measured based on the annual emergency drill or exercise.
Two players will simultaneously make their strategic decisions. A 3 × 4 payoff matrix for the earthquake damage game is created based on two players’ strategies and interactions as seen in Table 5. The payoff to player 1 for choosing a particular strategy when player 2 makes his selection can be represented as a gain by player 1(+) or a loss for player 2(−). In this model, a summation of the losses of player 2 is depicted, and player 1 tries to maximize this loss. Player 2 tries to minimize the losses. Player 1 gains a profit from player 2’s effort of resource responses. Player 2 pays as a result of player 1’s multi-emergency events. We assume that each player’s aim in the game is to achieve as high a payoff for player as possible.
| Response agent | |||||
|---|---|---|---|---|---|
| d1 (Rescue groups) | d2 (Ambulances) | d3 (Fire engines) | d4 (Machine and equipments) | ||
| Multi-emergency events | u1(Fire) | ||||
| u2(Collapse) | |||||
| u3(Fire and collapse) | |||||
A payoff matrix for the external threat game
The payoff for the jth strategy for player 1 when player 2 chooses the kth strategy to the response can be formulated as [Equation (12)]
A mixed Nash equilibrium pair (r*, q*) exists in the normal form game if this game has no pure strategy Nash equilibrium, which is an optimal strategy. The mixed N.E. for the probability vector is r* = {r*(u1), r*(u2), r*(u3)} with actions {u1, u2, u3} for the Multi-emergency event and the vector q* = {q*(d1), q*(d2), q*(d3), q*(d4)} with actions {d1, d2, d3, d4} for the response agent. Now, the proposed model lets vi be the ith threat value of a strong earthquake in a district which is the expected payoff of player 1. vi is computed by Equation (7).
5.3. Reallocation of SAR Resources Game
This game applies the second scheme of the proposed models as explained in Section 4.2. We assume that the 15 SAR districts of Taiwan are modeled as a 15-person cooperative game (see Figure 4). The threshold value mH is generated by Equation (8). Given the mH threshold of the majority value, we can compute the majority of coalitions which are pivotal to each district. The different priorities for response resource deployment are derived from the majority of coalitions. Based on the earthquake threat value for each district with respect to the others, and the impact of the threshold values on the majority of emergency level represents the relative importance of each district. Equations (9) and (10) are used to compute the Shapley value for each agent and the amount of reallocation of each agent’s resources in Section 4.2. According to SAR resource reallocation, the EOC mobilizes resources from all districts to assure that even rescue of victims in multiple emergency events across the whole region is possible.
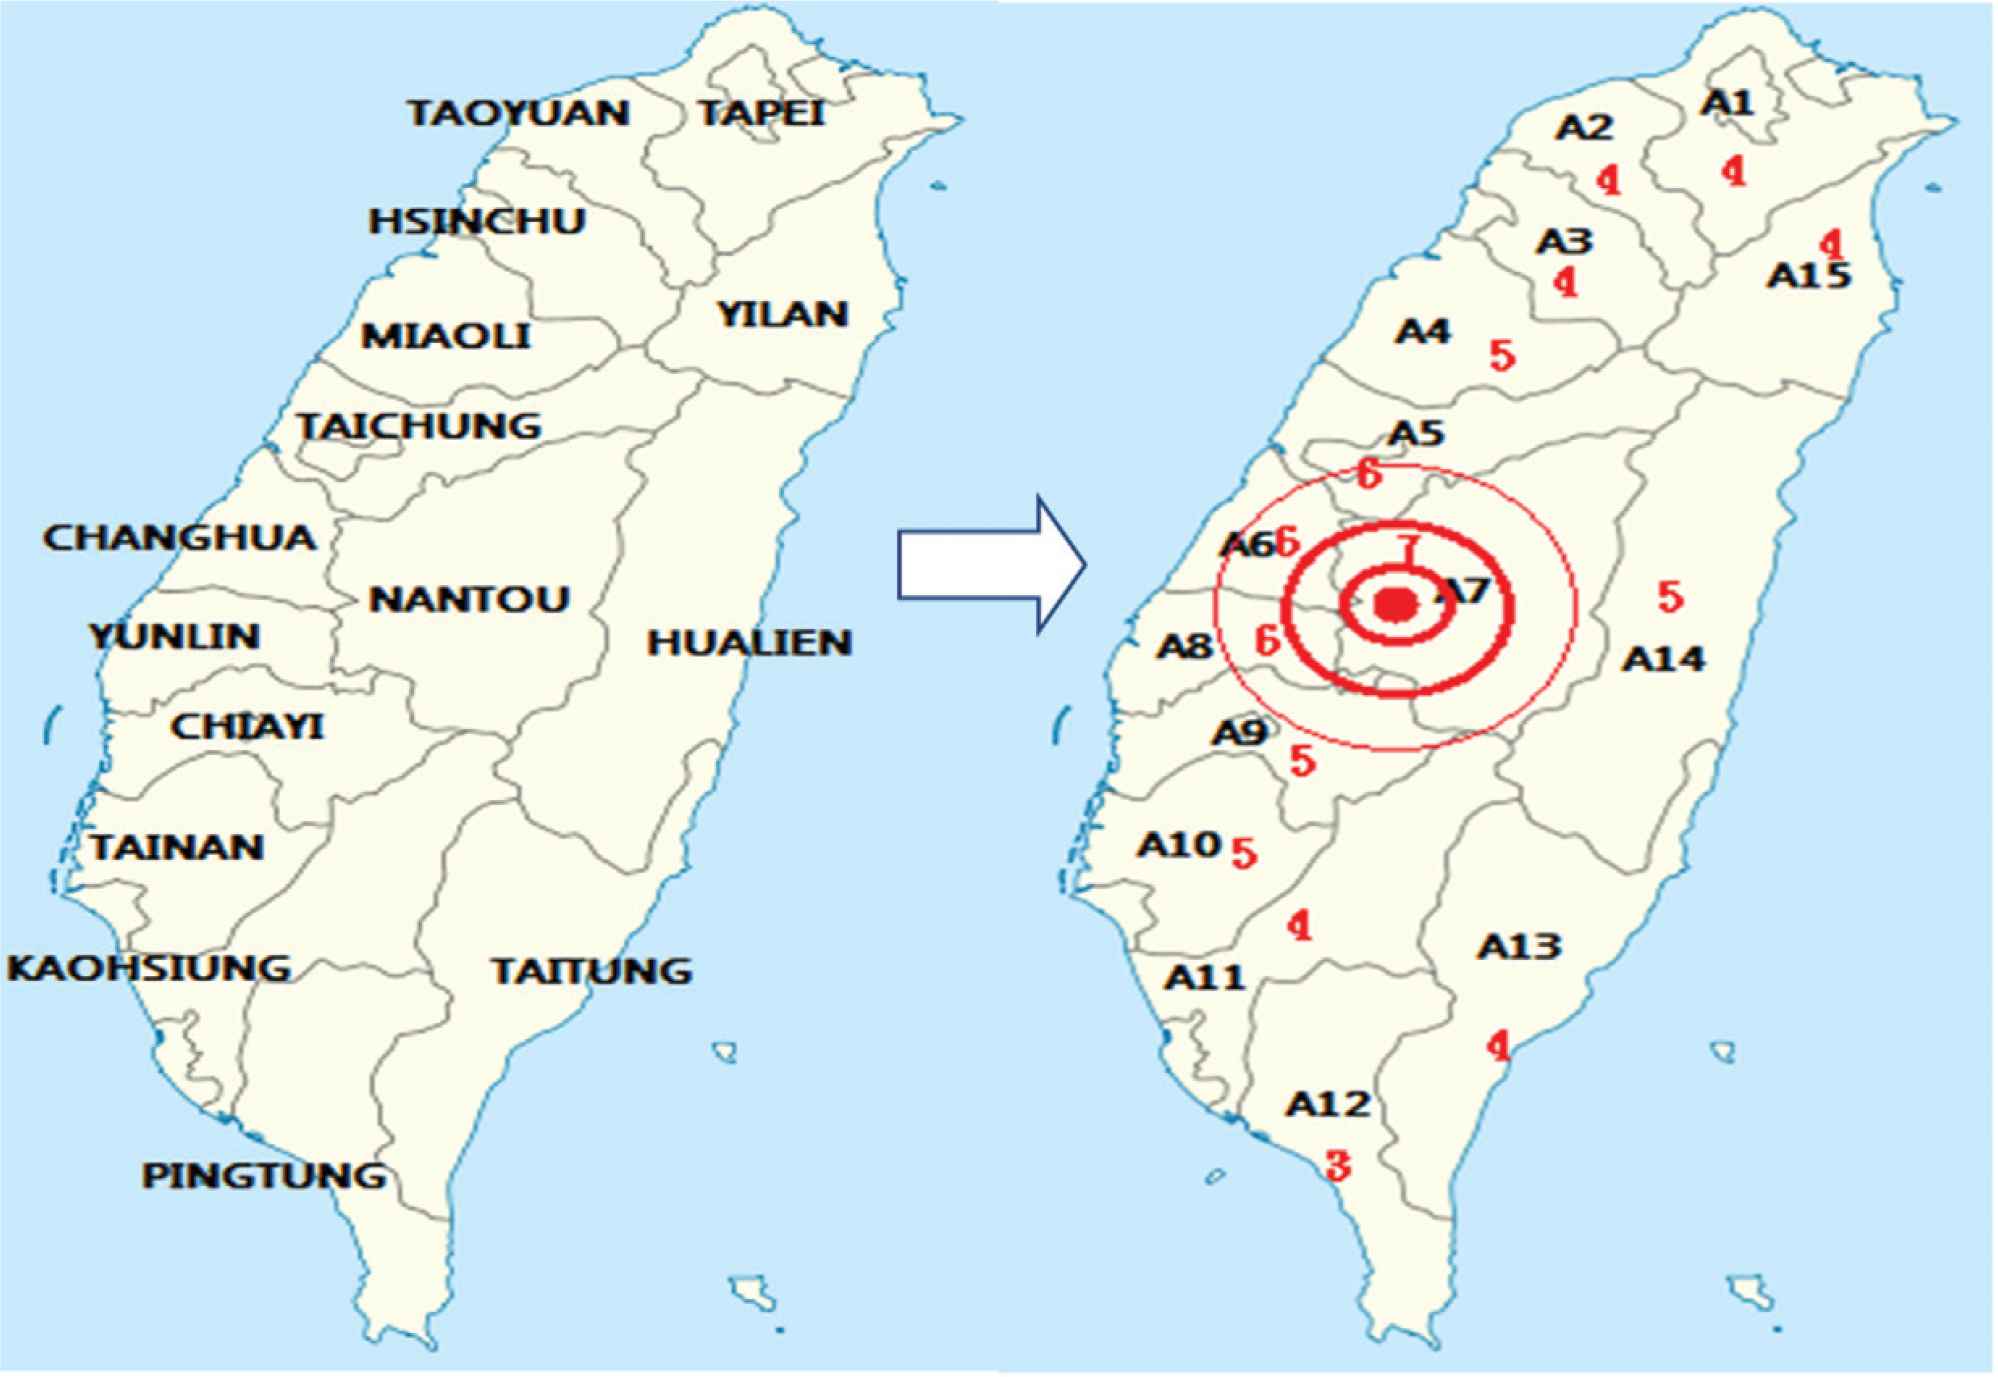
15 Search and rescue (SAR) districts of Taiwan.
5.4. Simulation Experiments
The simulation takes advantage of the 921-earthquake data to verify the proposed model. We hypothesize that a strong earthquake occurs as it did in Jiji, Nantou County, Taiwan. The EOC deploys 15 response agents from the district (or county) in the whole region (from A1 to A15) and provides central management and monitoring for homeland security of Taiwan (see Figure 4). In the first stage, the information in Tables 2–4 is used, regarding the resource types and the availability, population density, emergency requests, emergency priorities, and time taken to reach the crisis area from each of the resource centers. Each district’s emergency resource request is derived from the number of emergency calls (i.e., 119) multiplied by the ratio of the resource requests (see Tables 2 and 6). We model the non-cooperative game and generated simulation sets of threat measures for the strong earthquake and the response agent in each district. The payoff matrix of the zero-sum earthquake damage game for each district is modeled according to Equations (12) and (13) and Table 5. Then, 15 earthquake threat values are calculated using Equations (12–14). Table 6 shows 15 earthquake threat values of the response agent derived from Nash equilibrium points by enumerating the strategies in the normal form game.
| Districts | Number of emergency calls | Requirements | Earthquake threat values | Shapley values | ||||||
|---|---|---|---|---|---|---|---|---|---|---|
| Fire | Collapse | Fire and collapse | Rescue groups | Ambulances | Fire engines | Machine and equipments | ||||
| A1 | TAIPEI | 5 | 50 | 40 | 275 | 225 | 180 | 46 | 160 | 0.086353 |
| A2 | TAOYUAN | 5 | 10 | 10 | 65 | 55 | 50 | 11 | 80 | 0.036489 |
| A3 | HSINCHU | 8 | 16 | 20 | 116 | 100 | 92 | 19.6 | 53 | 0.022389 |
| A4 | MIAOLI | 8 | 20 | 30 | 158 | 138 | 126 | 26.6 | 37 | 0.015335 |
| A5 | TAICHUNG | 30 | 200 | 200 | 1230 | 1030 | 860 | 206 | 618 | 0.334121 |
| A6 | CHANGHUA | 5 | 150 | 150 | 605 | 505 | 410 | 101 | 89 | 0.040354 |
| A7 | NANTOU* | 20 | 300 | 350 | 1990 | 1690 | 1430 | 333 | 610 | 0.334121 |
| A8 | YUNLIN | 4 | 100 | 100 | 604 | 504 | 408 | 50.4 | 129 | 0.062895 |
| A9 | CHIAYI | 10 | 10 | 20 | 200 | 170 | 160 | 17 | 31 | 0.013536 |
| A10 | TAINAN | 8 | 8 | 16 | 212 | 196 | 188 | 19.6 | 75 | 0.034316 |
| A11 | KAOHSIUNG | 4 | 4 | 8 | 40 | 36 | 36 | 3.6 | 15 | 0.005728 |
| A12 | PINGTUNG | 2 | 2 | 20 | 68 | 66 | 66 | 6.6 | 23 | 0.011142 |
| A13 | TAITUNG | 2 | 2 | 10 | 38 | 36 | 36 | 3.6 | 3 | 0.001931 |
| A14 | HUALIEN | 2 | 2 | 10 | 38 | 36 | 36 | 3.6 | 3 | 0.001931 |
| A15 | YILAN | 5 | 5 | 5 | 35 | 30 | 30 | 3 | 4 | 0.00129 |
| Total | 118 | 879 | 989 | 2229 | 1 | |||||
Epicenter.
Fifteen examples for computing earthquake threat values and Shapley values
In the second stage, all earthquake threat values are utilized to compute the Shapley value for each district. Given the vector output for all the values, we use Equation (8) to compute the majority of the threat values; the threshold value (i.e., mH) is 310. According to this threshold value 15 Shapley values of the district are calculated using Equation (10). The results obtained are shown in Table 6. Assume that all SAR resources available are unable to satisfy the requirements for all the earthquake-related emergencies occurring in Taiwan. Table 4 provides the experimental number of total available SAR resources. According to these experimental data, the number of reallocated SARs for each district can be computed using Equation (11). The results obtained are presented in Table 7.
| Districts | Resource allocation after earthquake | Resource allocation rate after earthquake (%) | Average distribution rate (%) | Number of deaths | Death rate (%) | |||||||
|---|---|---|---|---|---|---|---|---|---|---|---|---|
| Rescue workers | Ambulances | Fire engines | Machine and equipments | Rescue Workers | Ambulances | Fire engines | Machine and equipments | |||||
| A1 | TAIPEI | 97 | 98 | 186 | 72 | 8.62 | 8.60 | 8.65 | 8.67 | 8.64 | 134 | 5.40 |
| A2 | TAOYUAN | 41 | 42 | 78 | 30 | 3.64 | 3.68 | 3.63 | 3.61 | 3.64 | 1 | 0.04 |
| A3 | HSINCHU | 25 | 26 | 48 | 19 | 2.22 | 2.28 | 2.23 | 2.29 | 2.26 | 0 | 0.00 |
| A4 | MIAOLI | 17 | 17 | 33 | 13 | 1.51 | 1.49 | 1.53 | 1.57 | 1.53 | 6 | 0.24 |
| A5 | TAICHUNG | 376 | 381 | 718 | 277 | 33.42 | 33.42 | 33.40 | 33.37 | 33.40 | 1305 | 52.58 |
| A6 | CHANGHUA | 45 | 46 | 87 | 33 | 4.00 | 4.04 | 4.05 | 3.98 | 4.01 | 30 | 1.21 |
| A7 | NANTOU* | 376 | 381 | 718 | 277 | 33.42 | 33.42 | 33.40 | 33.37 | 33.40 | 916 | 36.91 |
| A8 | YUNLIN | 71 | 72 | 135 | 52 | 6.31 | 6.32 | 6.28 | 6.27 | 6.29 | 82 | 3.30 |
| A9 | CHIAYI | 15 | 15 | 29 | 11 | 1.33 | 1.32 | 1.35 | 1.33 | 1.33 | 7 | 0.28 |
| A10 | TAINAN | 39 | 39 | 74 | 28 | 3.47 | 3.42 | 3.44 | 3.37 | 3.43 | 1 | 0.04 |
| A11 | KAOHSIUNG | 6 | 7 | 12 | 5 | 0.53 | 0.61 | 0.56 | 0.60 | 0.58 | 0 | 0 |
| A12 | PINGTUNG | 13 | 13 | 24 | 9 | 1.16 | 1.14 | 1.12 | 1.08 | 1.12 | 0 | 0 |
| A13 | TAITUNG | 2 | 2 | 4 | 2 | 0.18 | 0.18 | 0.19 | 0.24 | 0.20 | 0 | 0 |
| A14 | HUALIEN | 2 | 2 | 4 | 2 | 0.18 | 0.18 | 0.19 | 0.24 | 0.20 | 0 | 0 |
| A15 | YILAN | 1 | 1 | 3 | 1 | 0.09 | 0.09 | 0.14 | 0.12 | 0.11 | 0 | 0 |
| Total | 1125 | 1140 | 2150 | 830 | 100 | 100 | 100 | 100 | 100 | 2482 | 100 | |
Epicenter.
Our proposed division of resources for 15 affected districts
5.5. Discussion
We analyze the application of the proposed model to determine whether the relief effort of SAR resources is improved after the 921-earthquake or not. Assume specific SAR resources for the entire Taiwan region. When the 921-earthquake occurred, the results calculated by our model guided the EOC to mobilize resources from all districts to assure even rescue of victims in multiple emergency events across the whole region (see Table 7). The number of people killed in all districts during the 921-Earthquake is revealed by the Ministry of the Interior of Taiwan statistics (see Table 7). Central Taiwan suffered major damage, particularly Nantou County and Taichung County. The majority of the casualties were concentrated in these two districts. Table 7 is interesting; because the proposed model dispatches most SAR resources to the two most severely affected districts. In addition, it shows the Average Distribution Rate (ADR) for Nantou County (i.e., 33.4%) which almost matches the death rate (i.e., 36.91%). Therefore, the proposed model is able to improve relief effort to counteract damage from external attacks.
We also evaluated the proposed division of resources by comparing the results obtained with those from the proportional division. The epicenter of the 921-earthquake was in Nantou County (i.e., agent A7) where the seismic intensity measured 7 on the Richter scale. Different magnitudes were measured at other counties in Taiwan when the 921-earthquake occurred. We assume that the higher the magnitude in a district, the more SARs resources needed. Therefore, we can use the proportional division to compute the amount of reallocation of each agent’s resources. The numbers of resources of type k reallocated to the ith agent are defined by [Equation (15)]
| Districts | Magnitude | Resource allocation after earthquake | Resource allocation rate after earthquake (%) | Average distribution rate (%) | Number of deaths | Death rate (%) | |||||||
|---|---|---|---|---|---|---|---|---|---|---|---|---|---|
| Rescue workers | Ambulances | Fire engines | Machine and equipments | Rescue workers | Ambulances | Fire engines | Machine and equipments | ||||||
| A1 | TAIPEI | 4 | 63 | 64 | 121 | 47 | 5.63 | 5.63 | 5.63 | 5.63 | 5.63 | 134 | 5.40 |
| A2 | TAOYUAN | 4 | 63 | 64 | 121 | 47 | 5.63 | 5.63 | 5.63 | 5.63 | 5.63 | 1 | 0.04 |
| A3 | HSINCHU | 4 | 63 | 64 | 121 | 47 | 5.63 | 5.63 | 5.63 | 5.63 | 5.63 | 0 | 0.00 |
| A4 | MIAOLI | 5 | 79 | 80 | 151 | 58 | 7.04 | 7.04 | 7.04 | 7.04 | 7.04 | 6 | 0.24 |
| A5 | TAICHUNG | 6 | 95 | 96 | 182 | 70 | 8.45 | 8.45 | 8.45 | 8.45 | 8.45 | 1305 | 52.58 |
| A6 | CHANGHUA | 6 | 95 | 96 | 182 | 70 | 8.45 | 8.45 | 8.45 | 8.45 | 8.45 | 30 | 1.21 |
| A7 | NANTOU* | 7 | 111 | 112 | 212 | 82 | 9.86 | 9.86 | 9.86 | 9.86 | 9.86 | 916 | 36.91 |
| A8 | YUNLIN | 6 | 95 | 96 | 182 | 70 | 8.45 | 8.45 | 8.45 | 8.45 | 8.45 | 82 | 3.30 |
| A9 | CHIAYI | 5 | 79 | 80 | 151 | 58 | 7.04 | 7.04 | 7.04 | 7.04 | 7.04 | 7 | 0.28 |
| A10 | TAINAN | 5 | 79 | 80 | 151 | 58 | 7.04 | 7.04 | 7.04 | 7.04 | 7.04 | 1 | 0.04 |
| A11 | KAOHSIUNG | 4 | 63 | 64 | 121 | 47 | 5.63 | 5.63 | 5.63 | 5.63 | 5.63 | 0 | 0 |
| A12 | PINGTUNG | 3 | 48 | 48 | 91 | 35 | 4.23 | 4.23 | 4.23 | 4.23 | 4.23 | 0 | 0 |
| A13 | TAITUNG | 3 | 48 | 48 | 91 | 35 | 4.23 | 4.23 | 4.23 | 4.23 | 4.23 | 0 | 0 |
| A14 | HUALIEN | 5 | 79 | 80 | 151 | 58 | 7.04 | 7.04 | 7.04 | 7.04 | 7.04 | 0 | 0 |
| A15 | YILAN | 4 | 63 | 64 | 121 | 47 | 5.63 | 5.63 | 5.63 | 5.63 | 5.63 | 0 | 0 |
| Total | 1125 | 1140 | 2150 | 830 | 100 | 100 | 100 | 100 | 100 | 2482 | 100 | ||
Epicenter.
Proportional division of resources for 15 affected districts
In Figure 5, it can be seen that with the Shapley value allocation approach proposed in this study, the average distribution of resource rate is closer to the death rate of each district than the proportional division of resources. The results of this comparison support the idea of the proposed model, which creates a minimum set of resource allocation costs when the MAS confronts external attacks. The EOC rapidly commands all agents and efficiently mobilizes and redistributes SAR resources for seriously affected districts.
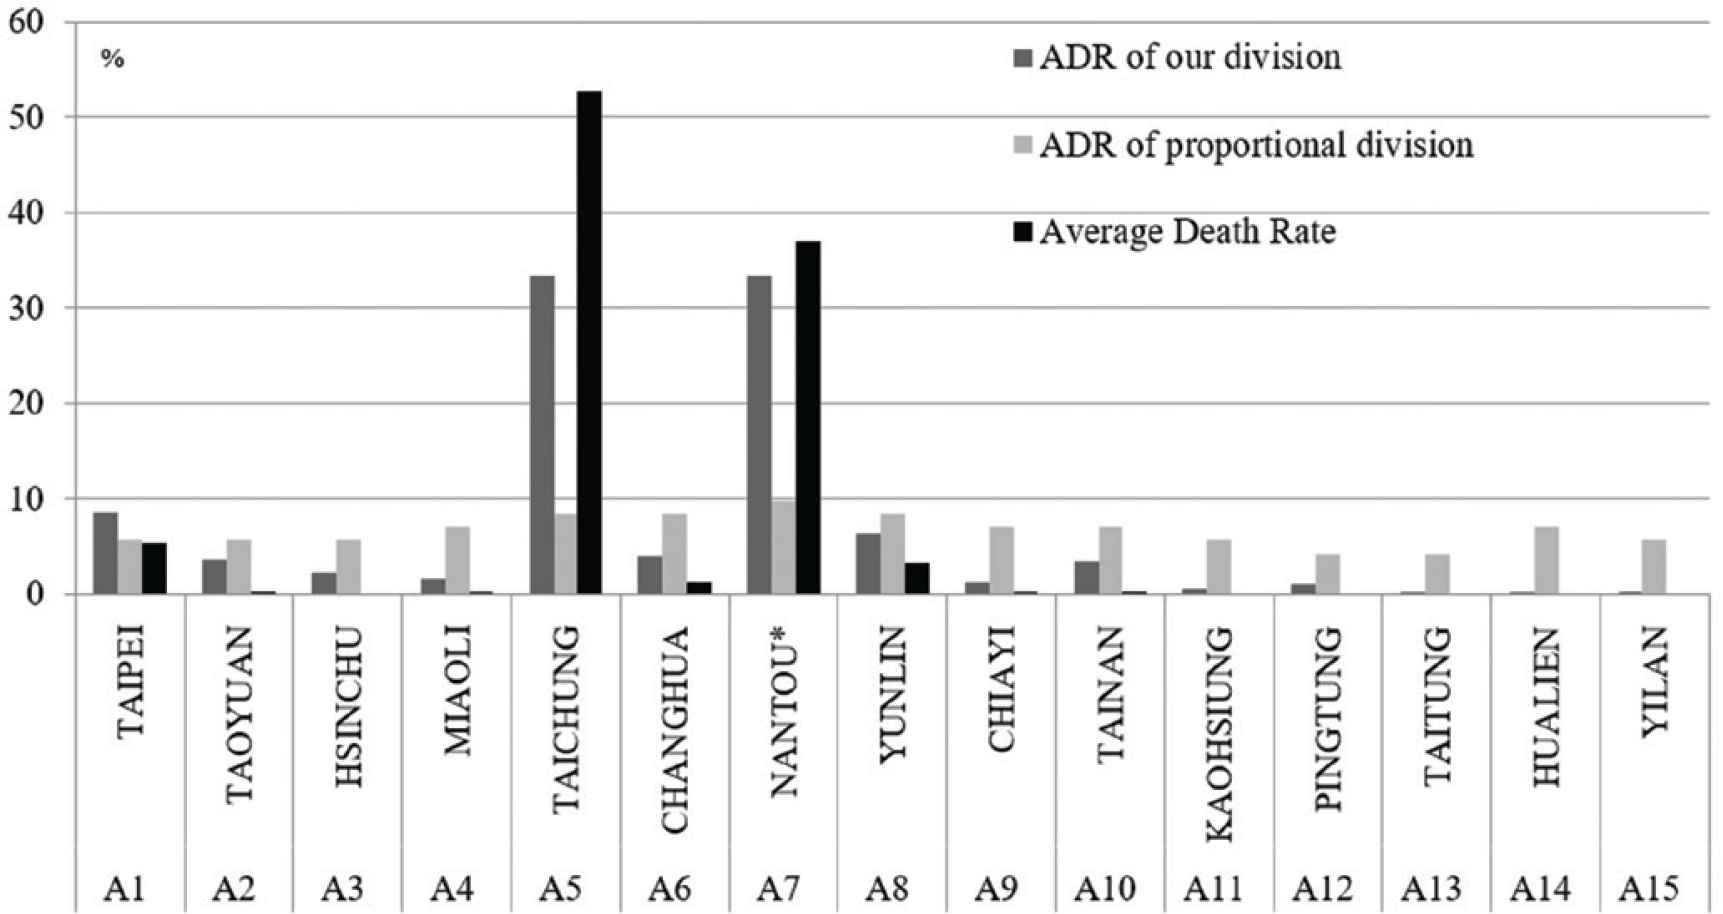
Comparison of our division and proportional division.
6. CONCLUSION
IDS, HSAS, and the emergency response system deploy multiple interacting agents to resist outside attackers. The resources of MAS are constrained for defending entire large-scale geographic regions. The emergency manager faces problems in agent resource deployment. The divide-and-conquer idea is utilized to improve the scalability of resource allocation. A two-stage model is proposed in this study to combine a non-cooperative game with a cooperative game to provide acceptable reallocation of resources for the MAS. The proposed model is applied to one strong earthquake attack case and is able to allocate resources efficiently in the overall system. Future work will design a computer-based decision-support system based on the proposed model. Real data will be applied and the feasibility of resource allocation from an organization’s emergency operational center point of view verified.
CONFLICTS OF INTEREST
The authors declare they have no conflicts of interest.
ACKNOWLEDGMENTS
The authors appreciate the time and effort of the editors and reviewers in providing constructive comments.
REFERENCES
Cite this article
TY  - JOUR
AU  - Cheng-Kuang Wu
AU  - Xingwei Hu
PY  - 2019
DA  - 2019/10/31
TI  - A Game Theory Approach for Multi-agent System Resources Allocation against Outside Threats
JO  - Journal of Risk Analysis and Crisis Response
SP  - 134
EP  - 144
VL  - 9
IS  - 3
SN  - 2210-8505
UR  - https://doi.org/10.2991/jracr.k.191024.003
DO  - 10.2991/jracr.k.191024.003
ID  - Wu2019
ER  -