
First Prototype of the Infectious Diseases Seeker (IDS) Software for Prompt Identification of Infectious Diseases
 , O. Cenciarelli2, A. Malizia3, P. Gaudio1,
 - DOI
- 10.2991/jegh.k.200714.001How to use a DOI?
- Keywords
- Infectious diseases; epidemiology; pathogens; outbreaks; modelling
- Abstract
The rapid detection of ongoing outbreak – and the identification of causative pathogen – is pivotal for the early recognition of public health threats. The emergence and re-emergence of infectious diseases are linked to several determinants, both human factors – such as population density, travel, and trade – and ecological factors – like climate change and agricultural practices. Several technologies are available for the rapid molecular identification of pathogens [e.g. real-time polymerase chain reaction (PCR)], and together with on line monitoring tools of infectious disease activity and behaviour, they contribute to the surveillance system for infectious diseases. Web-based surveillance tools, infectious diseases modelling and epidemic intelligence methods represent crucial components for timely outbreak detection and rapid risk assessment. The study aims to integrate the current prevention and control system with a prediction tool for infectious diseases, based on regression analysis, to support decision makers, health care workers, and first responders to quickly and properly recognise an outbreak. This study has the intention to develop an infectious disease regressive prediction tool working with an off-line database built with specific epidemiological parameters of a set of infectious diseases of high consequences. The tool has been developed as a first prototype of a software solution called Infectious Diseases Seeker (IDS) and it had been established in two main steps, the database building stage and the software implementation stage (MATLAB® environment). The IDS has been tested with the epidemiological data of three outbreaks occurred recently: severe acute respiratory syndrome epidemic in China (2002–2003), plague outbreak in Madagascar (2017) and the Ebola virus disease outbreak in the Democratic Republic of Congo (2018). The outcomes are promising and they reveal that the software has been able to recognize and characterize these outbreaks. The future perspective about this software regards the developing of that tool as a useful and user-friendly predictive tool appropriate for first responders, health care workers, and public health decision makers to help them in predicting, assessing and contrasting outbreaks.
- Copyright
- © 2020 The Authors. Published by Atlantis Press International B.V.
- Open Access
- This is an open access article distributed under the CC BY-NC 4.0 license (http://creativecommons.org/licenses/by-nc/4.0/).
1. INTRODUCTION
Infectious diseases represent a serious risk for public health; their spread can result in a large impact on people and populations [1]. Infectious diseases are still a fact of modern life: emerging and re-emerging diseases (e.g., Ebola Virus Disease - EVD) cause major problems across the world to people, society, and national and international economies [2]. In addition to the concerns linked to naturally occurring diseases, the potential intentional release of Biological Agents (BAs) with terrorist or criminal intent is very real. Thanks to greatly expanded trade and travel, infectious diseases – either naturally occurring or caused by accidental or intentional release of pathogens, can spread rapidly, resulting in a potentially significant impact on life, major economic crises, and political instability [3].
Information systems play a central role in developing a comprehensive and effective approach to prevent, detect, respond to, and manage infectious disease outbreaks [4,5]. Currently, a large amount of epidemiological data is being collected by laboratories, public health and health care providers, and government agencies at local, regional, national, and international levels [2]. Furthermore, many agencies and institutions have developed information systems to access, analyse, and report outbreaks. As an example, the Center for Disease Control and Prevention (CDC) in the U.S.A. has developed web-based reporting systems for health departments.
In addition to infectious disease-related data sources, the research and public health communities have developed a wide array of analytical and statistical models targeted at analysing diseases data for surveillance and outbreak prediction purposes. Some examples of these outbreaks are:
- •
the recent EVD outbreak in the Democratic Republic of Congo (DRC), started in 2018;
- •
the re-emergence of Chikungunya virus in Africa, Europe, and Asia in 2018;
- •
the emergence of Middle East respiratory syndrome Coronavirus (CoV) in the Middle East in 2012;
- •
the worldwide H1N1 influenza pandemic in 2009;
- •
the outbreak of Severe Acute Respiratory Syndrome (SARS) in China in 2003.
All of these recent outbreaks highlight the importance of large-scale infectious diseases surveillance networks. The emergence of infectious diseases is associated with human (i.e., population density, travel, trade, changes in land use) and environmental determinants, and with the combination of them [6–9]. The improved ability to study infectious disease dynamics has made possible – thanks to innovative mathematical models – to construct advanced tools for the early detection (and, in some cases, prediction) of outbreaks. For example, a better understanding of human mobility patterns has enabled simulation of the spread of SARS and novel influenza A/H1N1 diseases [10].
Global and regional surveillance of novel or re-emerging infectious diseases aims to rapidly detect changes in the incidence rate of endemic diseases and promptly recognise and characterise syndromes caused by previously unknown pathogens of epidemic potential. Once an infectious threat is identified, surveillance on the disease spread is paramount to apply and assess preventive and control measures [11].
The goal of infectious disease surveillance is to help in reducing the incidence and prevalence of infectious diseases by providing relevant public health information and knowledge to public health professionals, health care professionals, and decision makers, to promote actions that can result in the timely prevention and control of infectious diseases [11].
In this framework, this study aims to introduce and develop an infectious disease prediction tool – working with an off-line database – built with specific epidemiological parameters of a set of infectious diseases of high consequences. This application would be a useful and user-friendly predictive tool appropriate for first responders, health care workers, and public health decision makers to help them in predicting, assessing, and contrasting outbreaks.
2. MATERIALS AND METHODS
The tool has been developed according to the two steps described below: the database building stage and the software implementation stage.
2.1. Database Building
The key to this first software prototype being useful and workable in practice is the quality and reliability of the database on which the predictions are based. To test this prototype, the database has been populated with the relevant data of 35 pathogens and the relative infectious diseases they cause. The list of 35 pathogens and related diseases is reported in Annex 1. Investigating the current landscape of publicly available data on infectious disease outbreaks, the database is built using data reported through several sources: World Health Organization (WHO)/United Nations (UN) [12], U.S. CDC [13], European Centre for Disease Prevention and Control (ECDC) [14], Global Burden of Disease [15], Program for Monitoring Emerging Disease [16] and scientific literature [17–47]. The period of the data collected from these different sources is from January to December 2019.
At this level of development, the list is not fully exhaustive and it does not include pathogens that cause rare infectious diseases. The list has been built up selecting different categories of pathogens (viruses, bacteria, and parasites) to cover as much as possible the most significant infectious diseases of high consequences.
The epidemiological parameters selection for each pathogen descends from a deep consultation of some of the major scientific papers existing in the literature and other correlated sources (e.g., WHO, CDC, or ECDC official websites, reports and publications). The choice of this kind of collection is to describe as better as possible the main characteristics of each agent and its related disease; in fact, the goal is to define unequivocally with refined parameters each pathogen that has been taken into account to help the software in its searching and prediction process.
Table 1 shows an example of a database string. Principally, it is possible to consult the epidemiological parameters and other significant data of the agent (e.g., Ebola virus) and its related disease (Ebola Haemorrhagic Fever - EHF) that have been considered. In particular:
- •
the agent name and related disease;
- •
geographical distribution;
- •
the signs and symptoms, which are, respectively, any objective and subjective evidence of the disease;
- •
the vector, that is, any carrier able to transmit a pathogen into a living organism; most carriers regarded as vectors are living organisms, but they could be inanimate media of infection such as dust particles;
- •
the age group, which is defined as the age susceptibility for a specific agent and the related disease;
- •
the gender, male or female, that is more susceptible to a specific disease;
- •
the transmission route, which is, the pathway of causative agents from a source of infection to a susceptible host; regarding this parameter, it has been also reported an additional column called “the transmission routes more information” where detailed data on the transmission route are reported;
- •
the reservoir, which is a living host inside of which a pathogen survives, often (though not always) without causing disease for the reservoir itself;
- •
the Case Fatality Rate (CFR), which is, the fraction of deaths per case and it defines the fraction of deaths over the entire period of infection, in percentage;
- •
the transmission rate, which is the rate at which infectious cases cause secondary or new cases in a population with susceptible individuals; it is a constant rate and it has units of inverse time (day−1);
- •
the incubation rate, which is the time elapsed between exposure to a pathogenic organism and when symptoms and signs appear; it has units of inverse time (day−1);
- •
the recovery rate, which is the rate of individuals who recover or die, leaves the infected class at a constant per capita probability per unit of time (day−1);
- •
the infectious mortality rate, which represents the rate at which infected people die per unit of time (day−1); it is not to be confused with the CFR.
| Agent | Disease | Geographical distribution | Signs and symptoms | Vector/Other way | Age group | Gender | Transmission routes |
|---|---|---|---|---|---|---|---|
| Ebola virus | Ebola hemorrhagic fever | Central Africa, Western Africa | Fever, severe headache, muscle pain, weakness, fatigue, diarrhoea, vomiting, abdominal (stomach) pain, lack of appetite, unexplained haemorrhage (bleeding or bruising) | No vector | All | Male, female | Blood, body fluids, zoonotic disease, sexual |
| Transmission routes detailed information | Reservoir/host/source | CFR (decimals) | Transmission rate (day−1) | Incubation rate (day−1) | Recovery rate (day−1) | Infectious mortality rate (day−1) | |
| Blood or body fluids (urine, saliva, sweat, faeces, vomit, breast milk, and semen), Objects (such as needles and syringes) contaminated with body fluids from a person sick with EVD or the body of a person who died from EVD; Infected fruit bats or nonhuman primates (such as apes and monkeys); Semen from a man who recovered from EVD (through oral, vaginal, or anal sex). | Human, bat, primate, chimpanzees, gorillas, fruit bats, monkeys, forest antelope, porcupines | 0.5 | 0.284 | 0.607 | 0.135 | 0.135 |
Example of a database string and the epidemiological parameters reported. A 95% confidence interval for all of the detailed numeric parameters has been considered
2.1.1. Assumptions and generalization
In the database, some data are absent, due to two main reasons: there are not data available from the scientific literature or other existing sources or – for a specific disease – these data do not make sense (i.e., Legionellosis is not a vector borne disease and the vector dataset is not available).
The detailed numeric parameters of the database (CFR, transmission rate, incubation rate, recovery rate, infectious mortality rate) have been selected in accordance with dedicated scientific literature that concern mathematical modelling of infectious diseases. In particular, in the case of CFR, the average data come from infectious disease studies and scientific literature on past outbreaks, and this parameter refers to untreated and unvaccinated individuals, and it is stated in decimals. In case of transmission rate, incubation rate, recovery rate, and infectious mortality rate, these rates are reported as the reciprocals (day−1) of the respective periods (days). And, even if do not shown in Table 1, a 95% confidence interval for all the detailed numeric parameters has been considered.
For simplifying the choice, the successive database parameters have been divided as follows:
- •
the age group dataset in seven main groups: baby (0–6 years), child (7–12 years), teenager (13–19 years), young (20–35 years), adult (36–65 years), senior (66–99 years), all (0–99 years);
- •
the transmission routes dataset in 12 options: foodborne, waterborne, vectorborne, zoonosis, contaminated surface, person-to-person, sexual, mother-to-child, faecal-oral, aerosol, blood, and body fluids.
2.2. Software
The software has been named Infectious Disease Seeker (IDS) and it has been developed in the MATLAB™ environment. The first prototype of IDS software has been developed for a still working MATLAB® environmental, however, without requiring an internet connection to work. This is possible because IDS is loaded with a database that includes the epidemiological parameters of 35 infectious diseases (Table 1). Thus, the tool can be useful and applicable in many different situations in the field and remote areas where internet connection and other kinds of communication systems are not always available.
At this stage of development, the prototype is structured as a single user-friendly layout with five tabs, each of them characterized of a specific color (Figure 1).
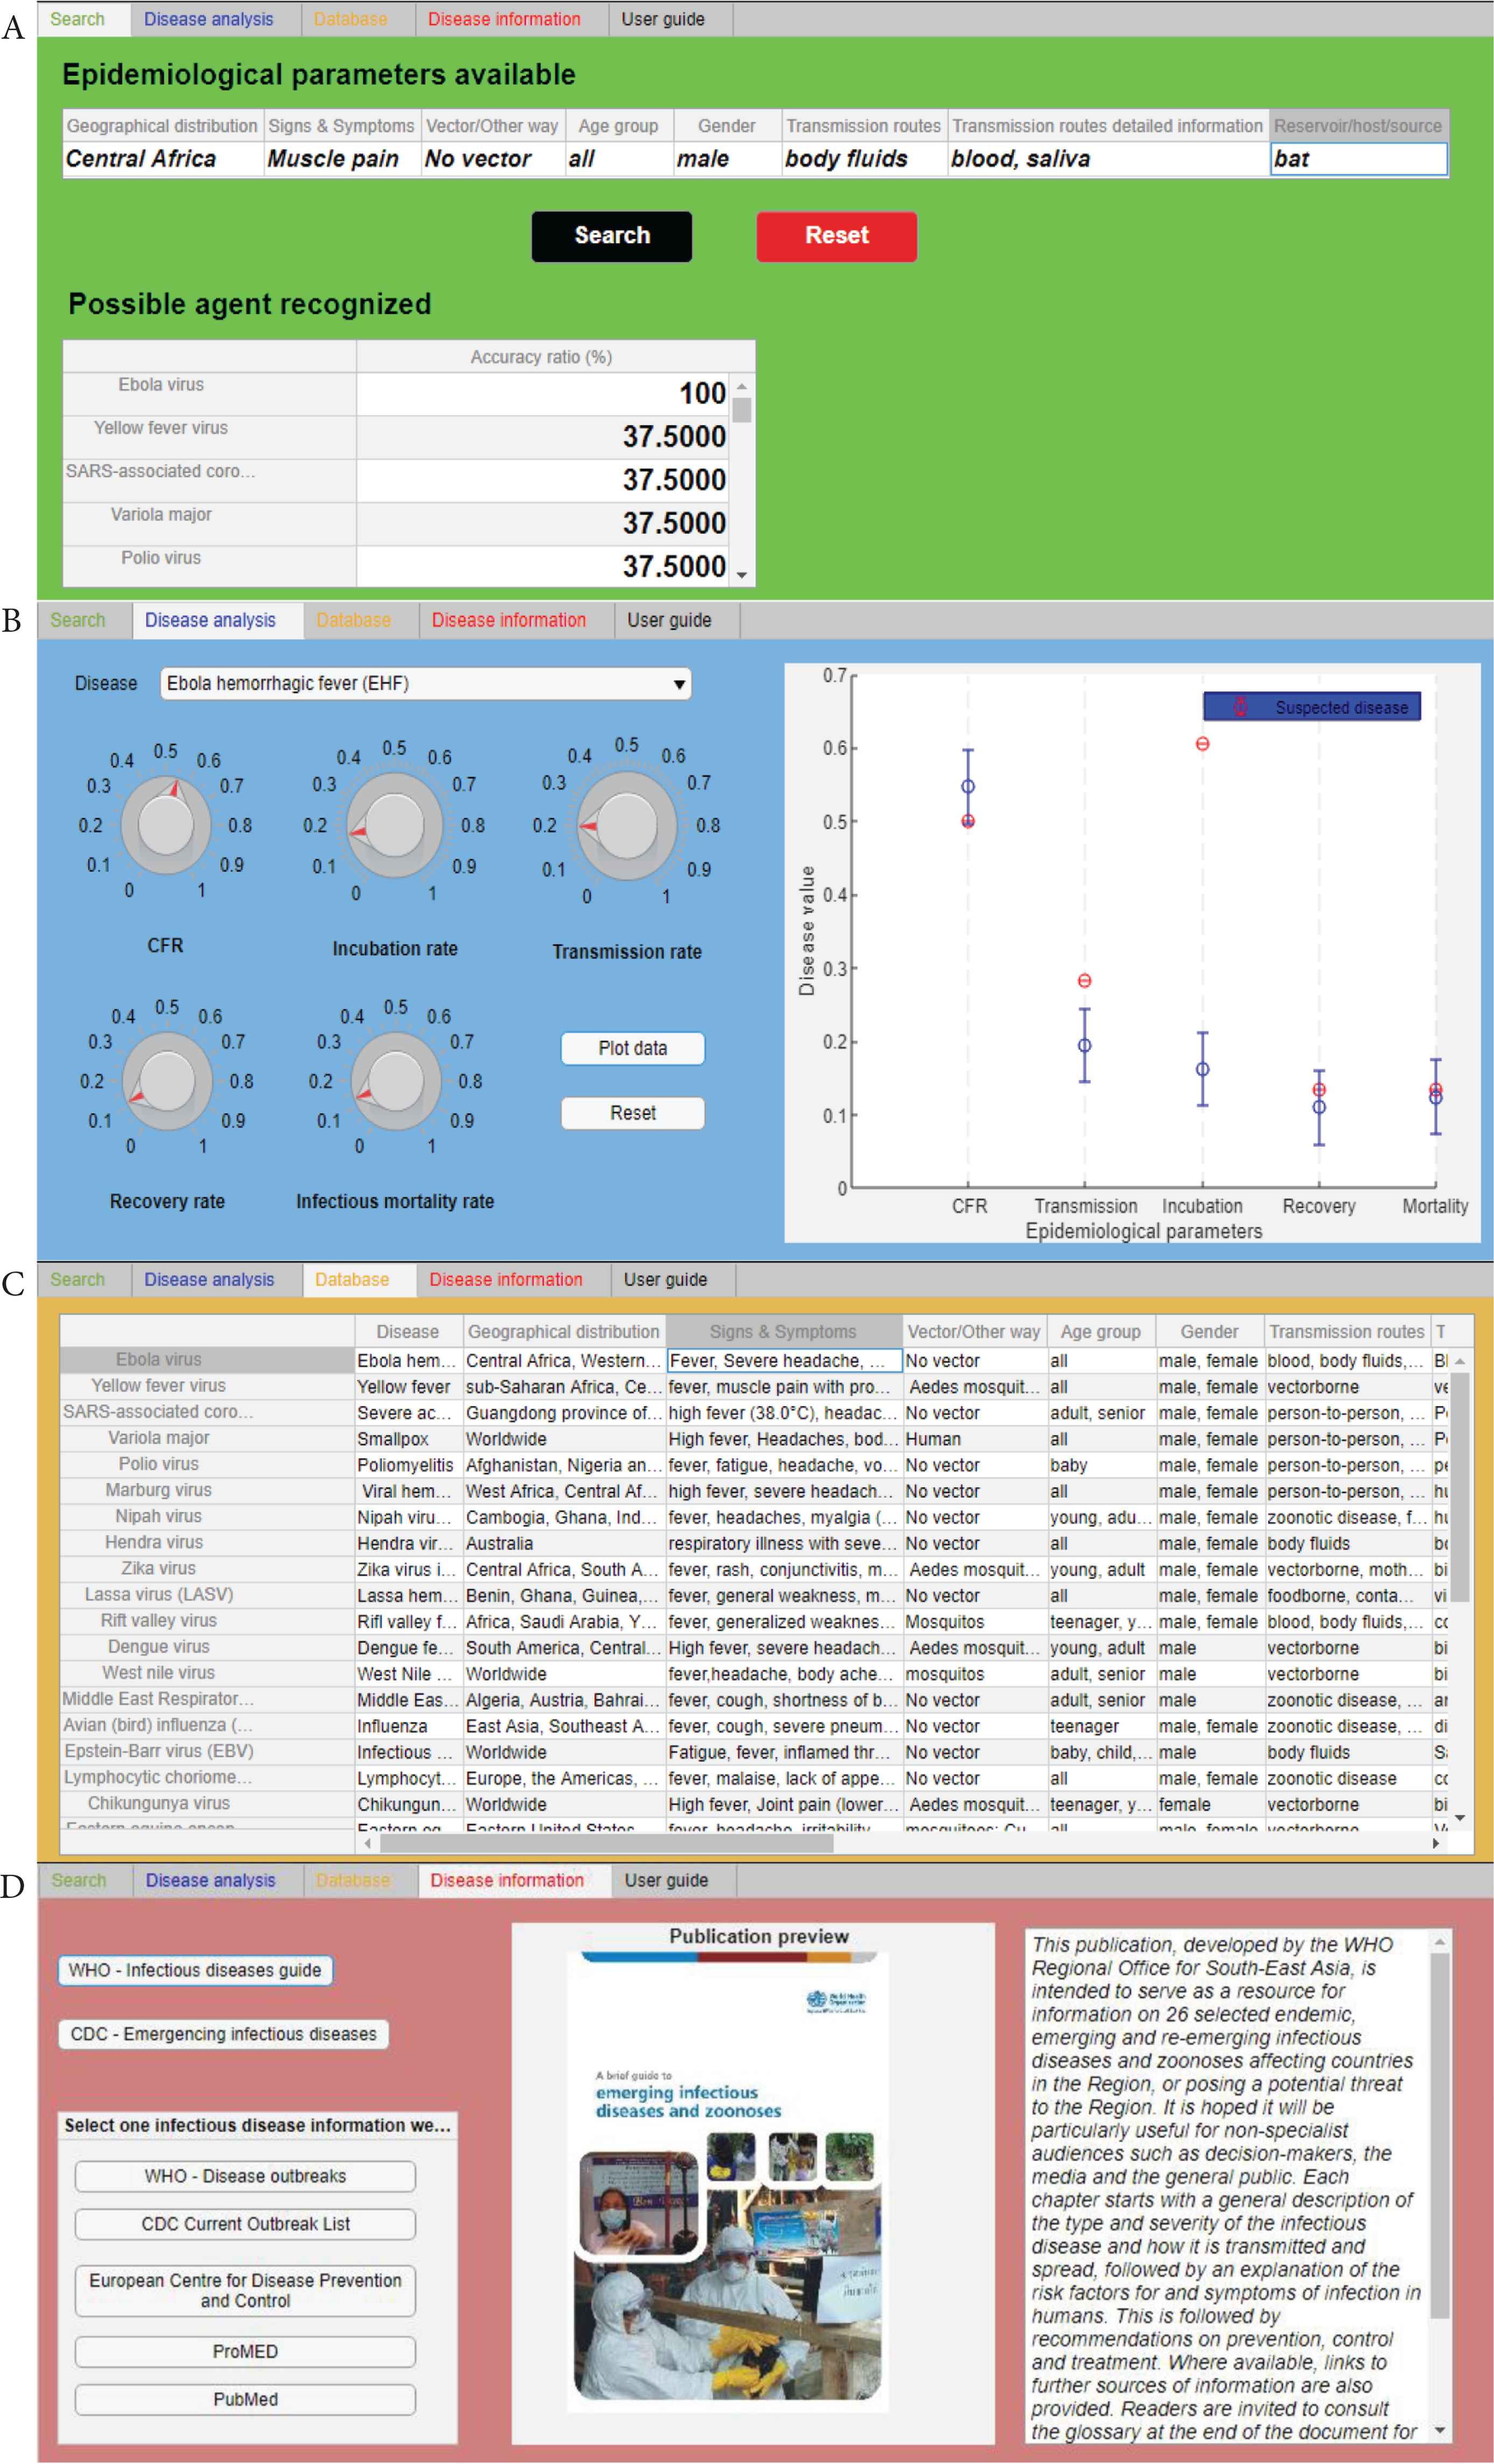
Screenshots of four of the five software tabs. (A) Search tab (green tab), (B) disease analysis (blue tab), (C) database (orange tab), and (D) disease information (red tab).
2.2.1. Search tab
The “Search” tab or green tab (Figure 1A), which is the core of the tool, where the identification of an agent and the related disease reporting some indispensable epidemiological parameters is run. Eight essential parameters (“Epidemiological parameters available” section) have been selected because it has been considered that they are the most important factors that also a non-health worker can identify and recognize. The user is able to load these parameters as free text values following the instructions reported in the “User guide” tab or black tab (see Subsection 2.2.3 Others tabs).
The MATLAB® code developed for regression analysis (logistic regression analysis) permits to determinate if data loaded by users in the “Epidemiological parameters available” section are in the database datasets and then recognize the associated correspondences and the related accuracy ratio. As schematized in Figure 2, each time that one parameter that the user loads in the software matches with its related database dataset the software provides a value equal to 1; if not a value equal to 0.
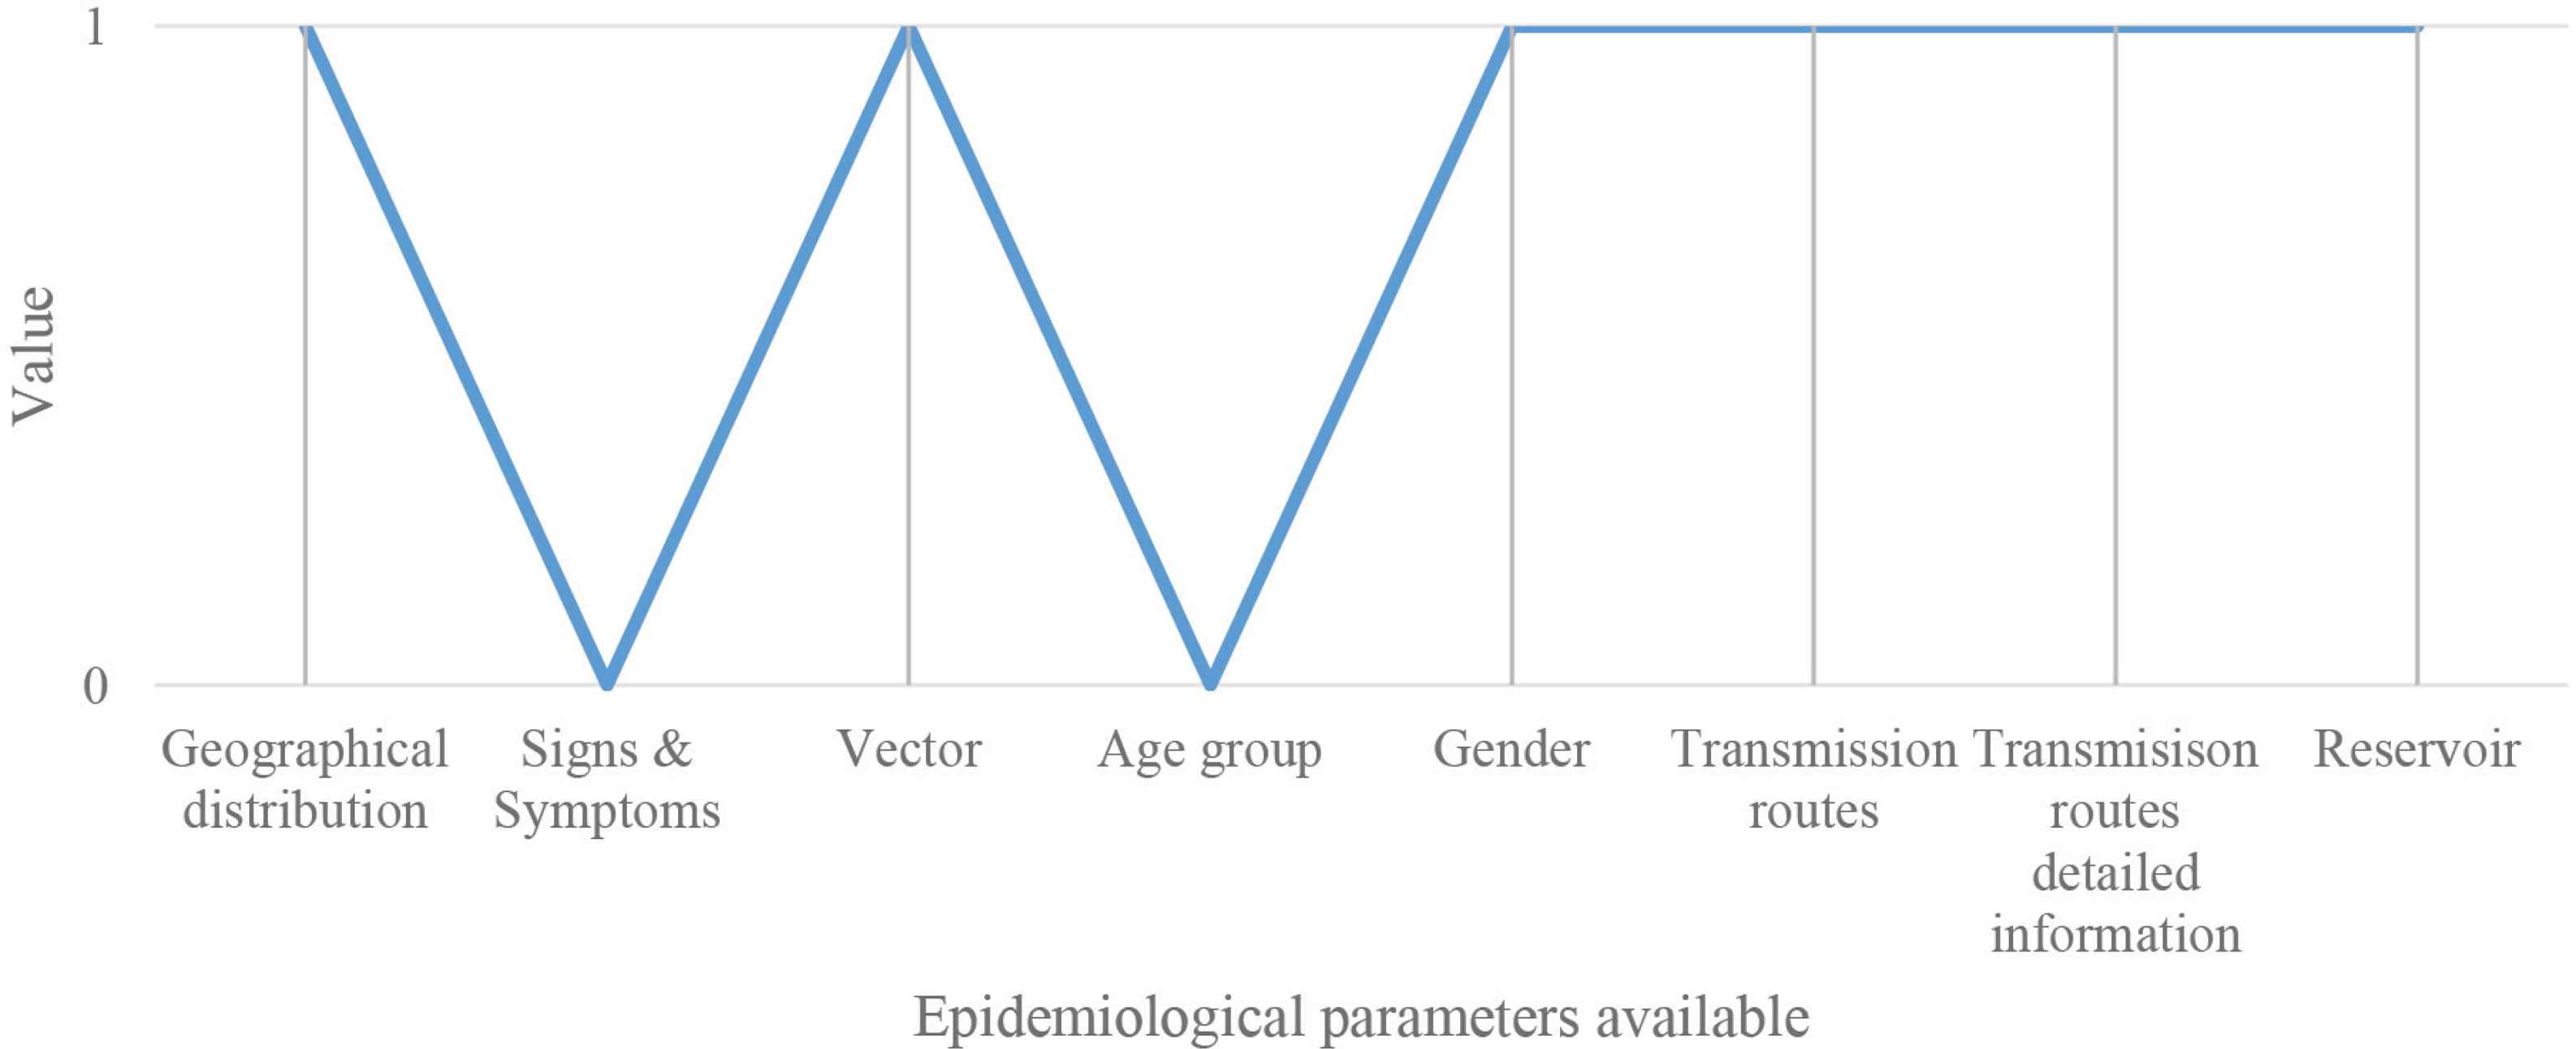
Schematic representation for describing the values assignment process: value 1 means match, and value 0 means no match. In this specific example, there are six correspondences and two no correspondences.
The accuracy ratio is reported in percentage and it is calculated as follows:
For example of Figure 2, the accuracy ratio is 75%.
Even at this level of development, applying this type of regression analysis, the tool is able to find the possible causative agent and consequently the related disease. Considering the actual phase of software development, the level of accuracy ratio accepted is over 35%.
2.2.2. Disease analysis tab
The “Disease analysis” tab or blue tab (Figure 1B), in which expert users can analyse and compare another specific epidemiological parameters (CFR, transmission rate, incubation rate, recovery rate, infectious mortality rate) of two or more diseases.
2.2.3. Others tabs
- •
The “Database” tab or orange tab (Figure 1C), in which the entire database has been loaded and users can consult it directly in the tool.
- •
The “Disease information” tab or red tab (Figure 1D), where the users can find relevant publications (i.e. for WHO and CDC, no internet connection required) and some website links with additional information (this function needs an internet connection).
- •
The “User guide” tab or black tab (this tab is not shown in Figure 1), containing the software user manual.
3. RESULTS
The tool has been tested with the epidemiological data of three outbreaks occurred recently: SARS epidemic in China (2002–2003), plague outbreak in Madagascar (2017), and the EVD outbreak in the DRC (2018). The authors have considered these outbreaks because they had the intention to select pathogens in terms of relevance, and different characteristics as transmission route, type of microorganism (virus, bacteria), and geographical distribution; once the causative agents have been selected, the authors chose the more recent outbreaks. The tool has been tested in two different stages of the epidemic: at the beginning, when there is a lack of data, and during a more advanced stage, when more accurate and detailed data are available. All the data used in these tests have been retrieved from reliable sources [48–55].
3.1. Testing Search Function
Taking into consideration the initial stages of the three outbreaks analysed [48–50], the search function has been tested loading the early data available (Table 2A) in a specific IDS section called “Epidemiological parameters available” (Figure 3). Once loaded the data and clicked on “Search” button, as shown in Figure 3, the highest accuracy ratios obtained have been, respectively, SARS-associated CoV (Figure 3A), Yersinia pestis (Figure 3B), and Ebola virus (Figure 3C). The accuracy ratios are shown in the IDS table called “Possible agent recognized” and they are expressed in percentage (%).
| SARS China (2003) | Plague Madagascar (2017) | EHF Congo (2018) | ||
|---|---|---|---|---|
| (A) | Geographical distribution | China | Madagascar | Democratic Republic of the Congo |
| Signs and symptoms | High fever | Fever, nausea | High fever, haemorrhage | |
| Vector/Other way | // | // | // | |
| Age group | // | All | All | |
| Gender | Male, female | Male, female | Male, female | |
| Transmission routes | Person-to-person | // | Body fluids | |
| Transmission routes more information | Droplets, contact | Flea bites | // | |
| Reservoir | Human | Rodents | // | |
| (B) | CFR (%) | 0.17 (17) | 0.09 (9) | 0.54 (54) |
| Transmission rate (day−1) | 0.75 | 0.45 | 0.2 | |
| Incubation rate (day−1) | 0.083 | 0.26 | 0.17 | |
| Recovery rate (day−1) | 0.125 | 0.26 | 0.1 | |
| Infectious mortality rate (day−1) | 0.006 | 0.34 | 0.133 | |
Epidemiological parameters and other significant data of the three agents. (A) Early epidemiological parameters available for the three outbreak tested [48–50]. (B) The specific epidemiological parameters available, based on mathematical modelling of the three infectious diseases considered [51–55]. A 95% confidence interval for all the detailed numeric parameters has been considered
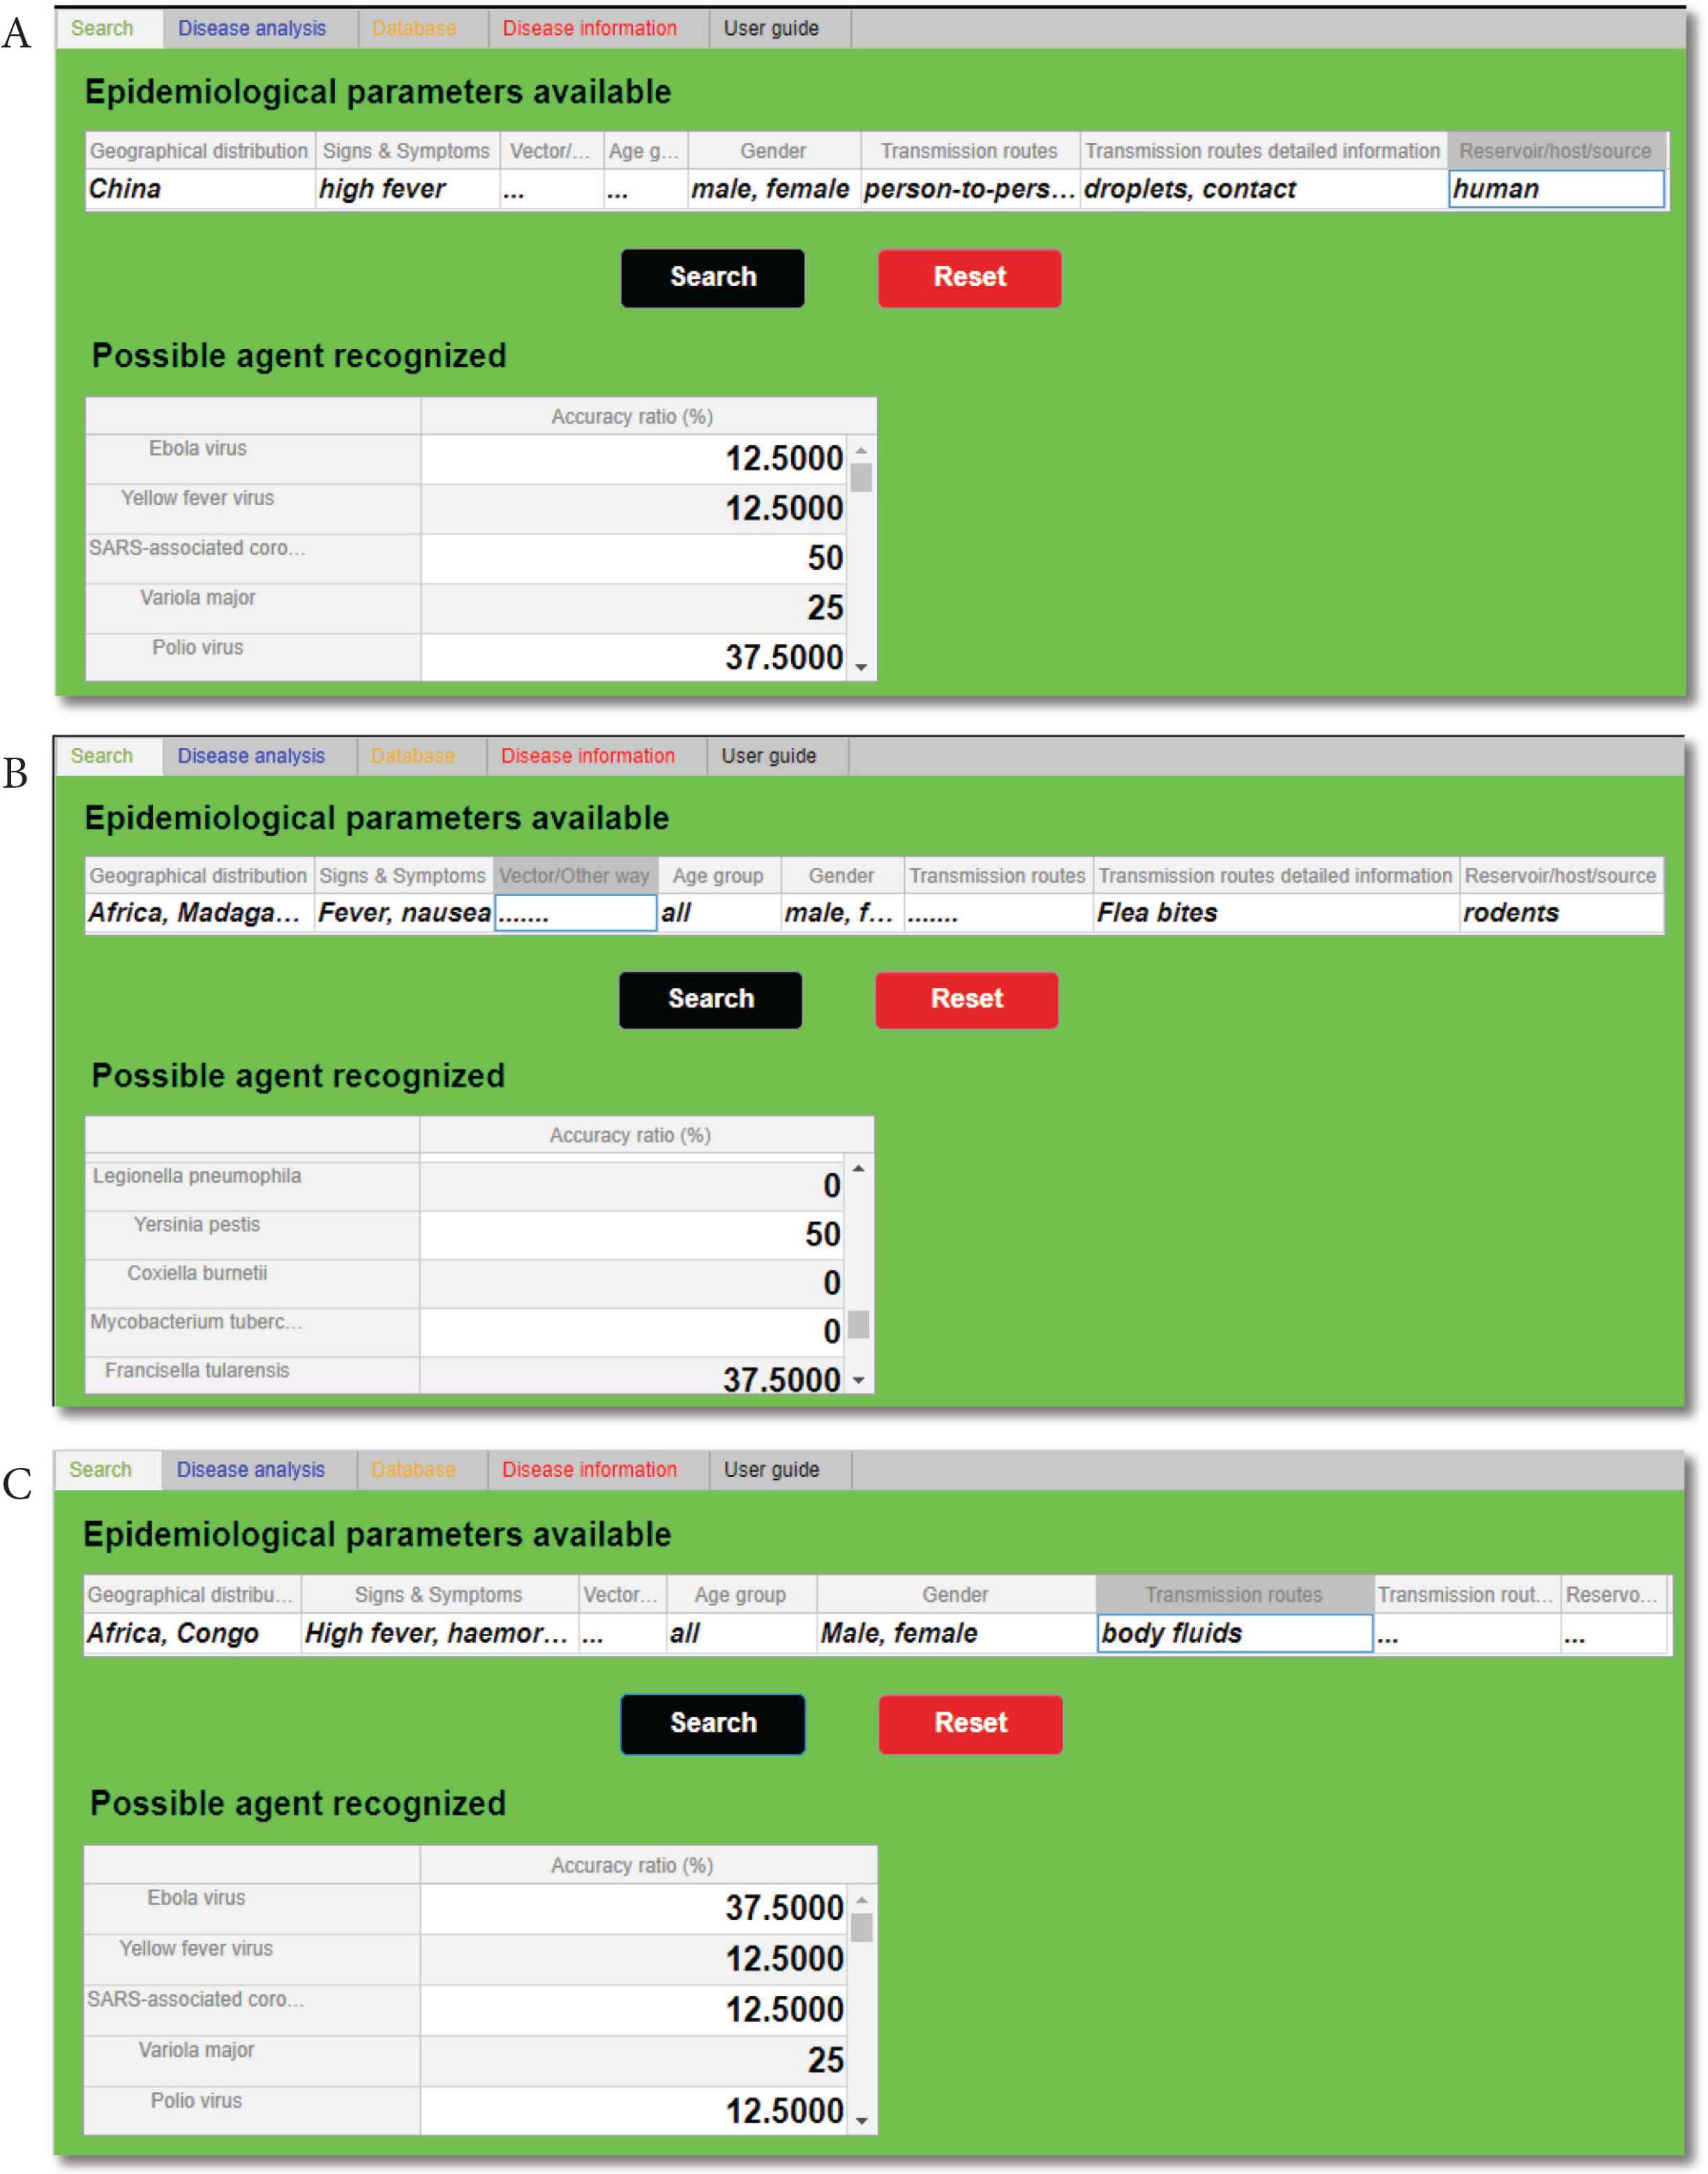
Outputs of the “Search” tab. In section “Possible agent recognized”, after the initial epidemiological parameters have been filled in, is possible to identify each time the highest accuracy ratio (%): SARS-associated coronavirus (A), Yersinia pestis (B), and Ebola virus (C).
It is important to underline that the search function has recognized all of the three agents analysed: it has discerned the more probable agents within the others. In fact, the tool was able to identify SARS-associated CoV and Yersinia pestis with an accuracy of 50%, and Ebola virus with an accuracy of 37.5% (Figure 4). It is essential to clarify that, as also shown in Table 2A, the data available at the beginning of these three outbreaks were incomplete, and the presence of these deficiencies has affected the accuracy ratios.
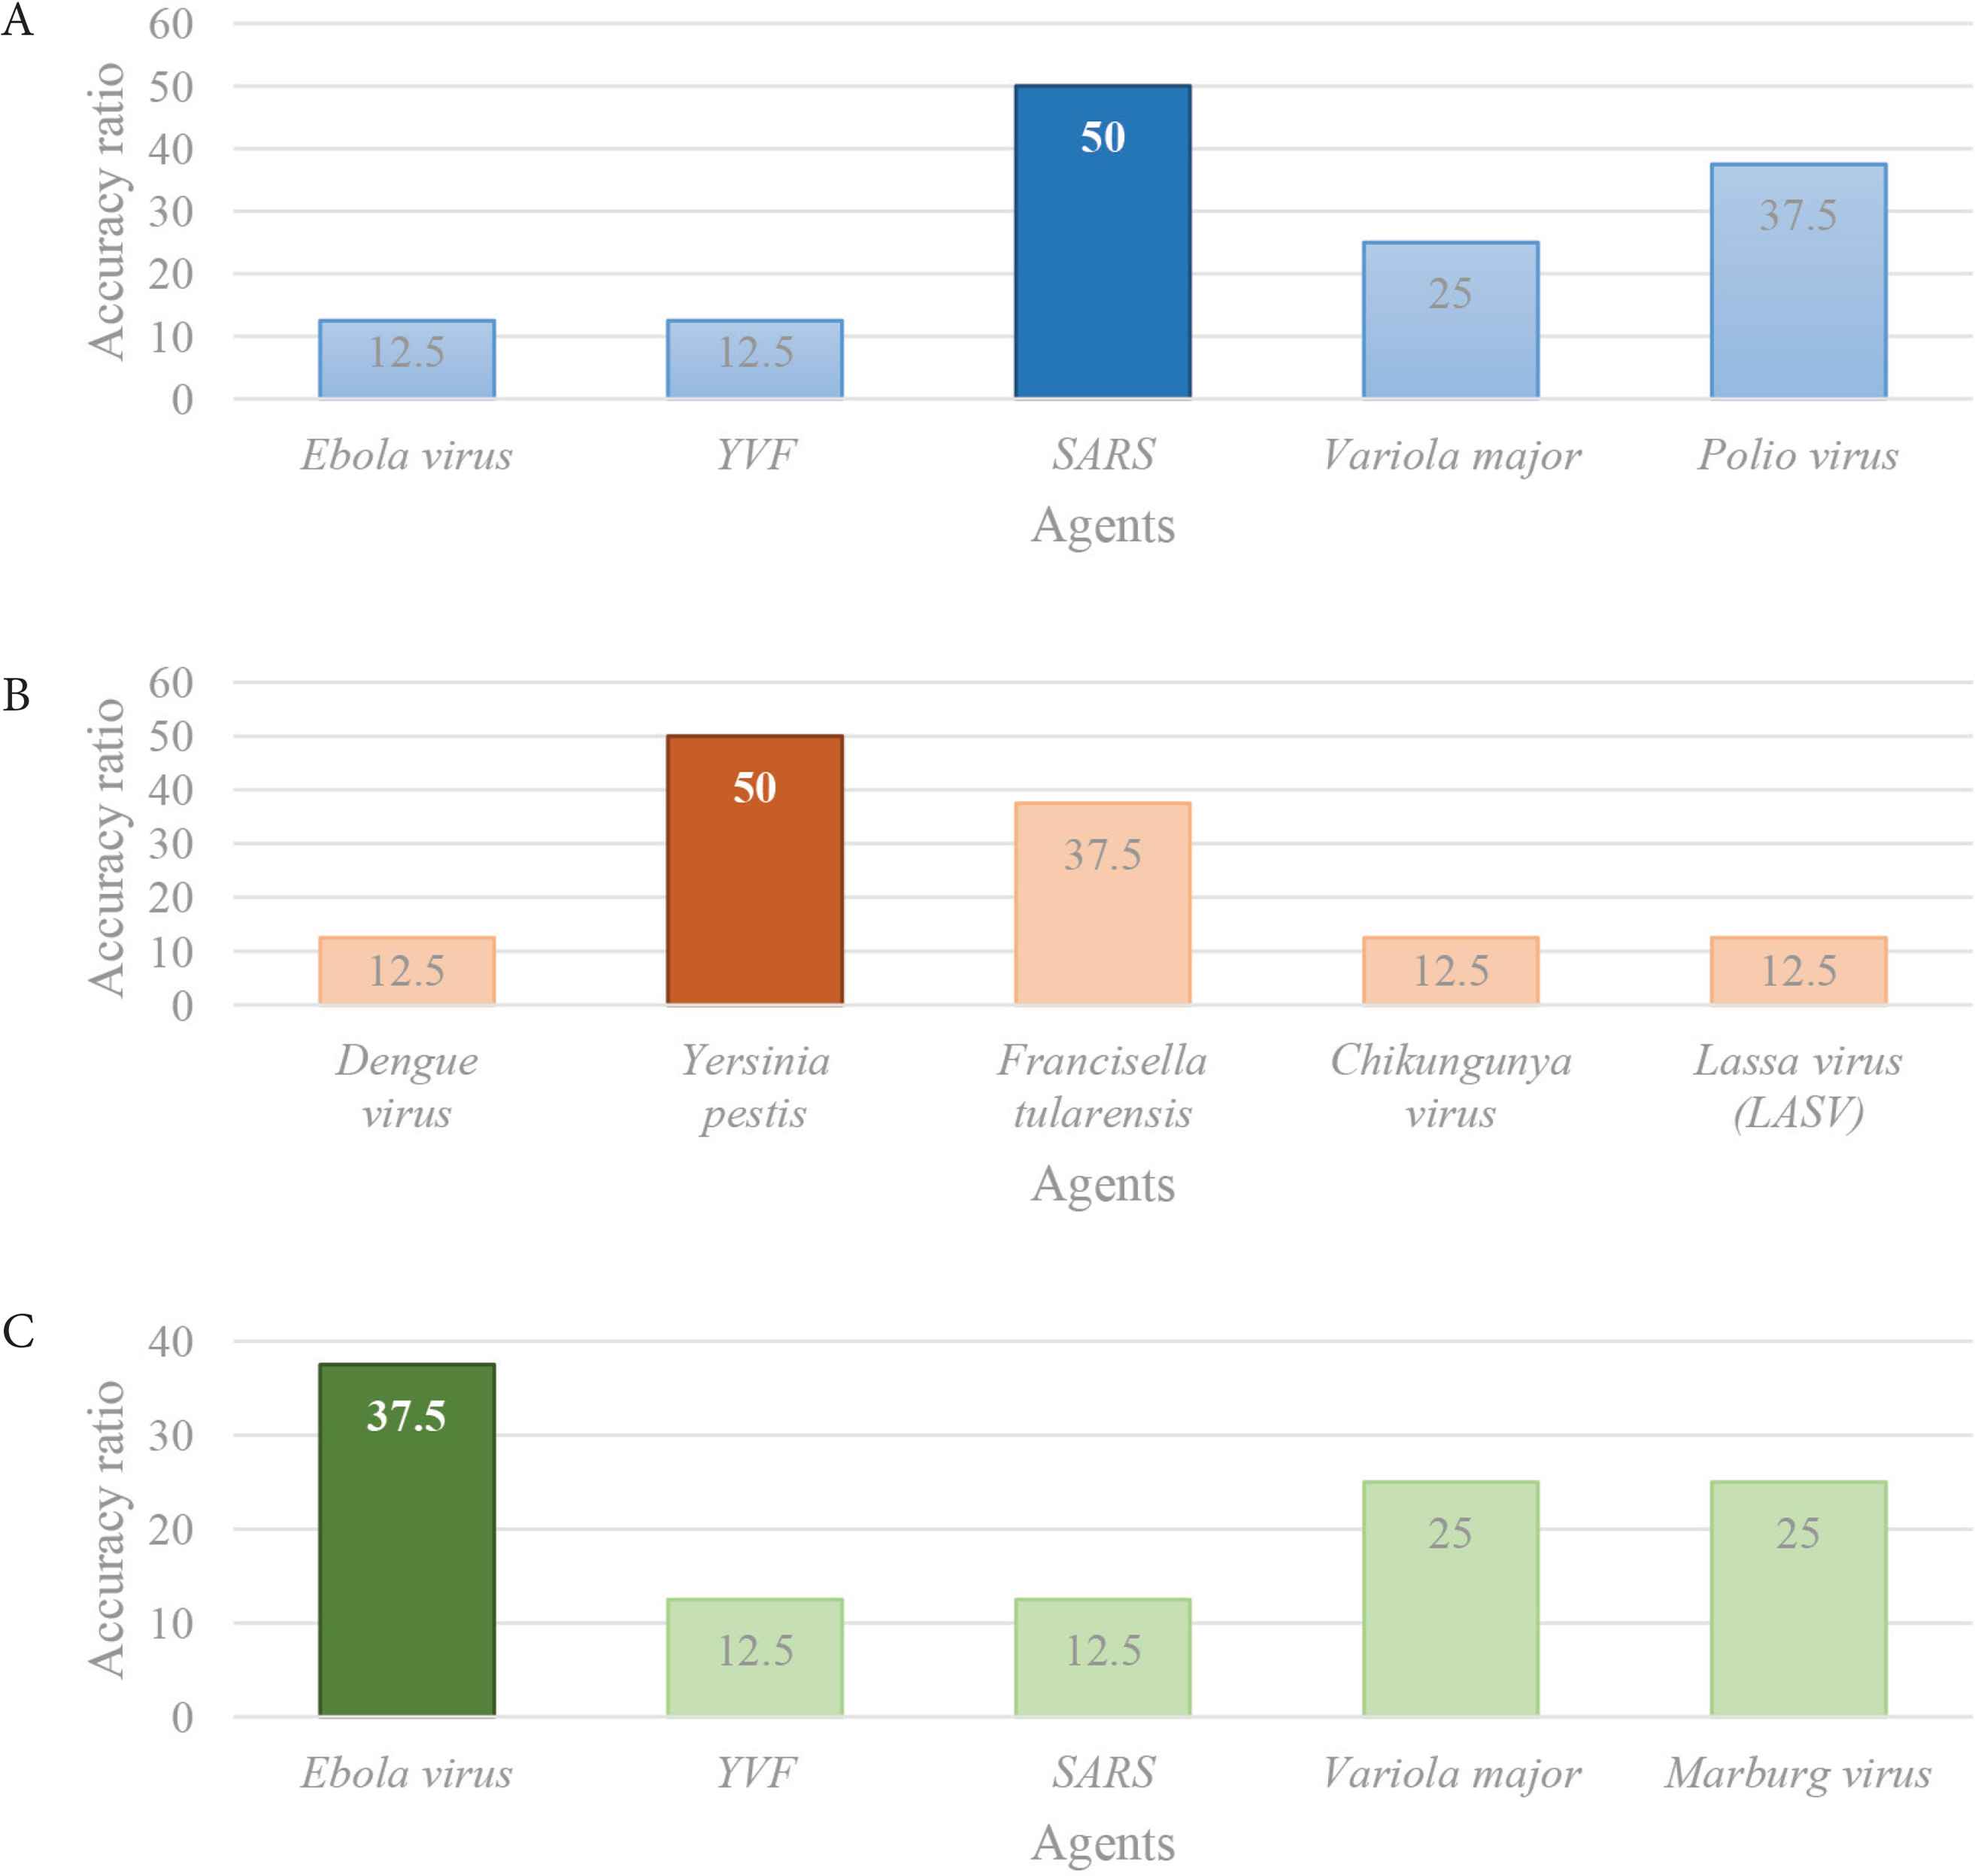
Schematic representation of the comparison of the highest accuracy ratios. It is obtained comparing the IDS outcomes of the three outbreaks analysed and it distinguishes the more probable agents within the others: (A) the more probable agent is SARS (blue), (B) the more probable agent is Y. pestis (orange), and (C) the more probable agent is Ebola virus.
3.2. Testing Disease Analysis Function
Once identified the more probable agent(s) and the related disease(s) and detailed epidemiological data are available, it is possible to proceed with further analysis. In particular, using the disease analysis function (“Disease analysis” tab), it has been possible to identify if the disease recognised, behave, and spread with the same dynamic of the equivalent disease loaded in the database. As a result, the detailed epidemiological parameters available, based on the mathematical modelling of the three infectious diseases considered (Table 2B) [51–55], have been compared with the disease parameters of the database (Figure 5). In particular, Figure 5A shows the comparison between SARS disease data from the database (red spots) and the data come from the real epidemic occurred in China in 2003 (blue spots). The same in Figure 5B and 5C, where the comparison is, respectively, from database diseases and plague epidemic (2017) and EVD outbreak (2018).
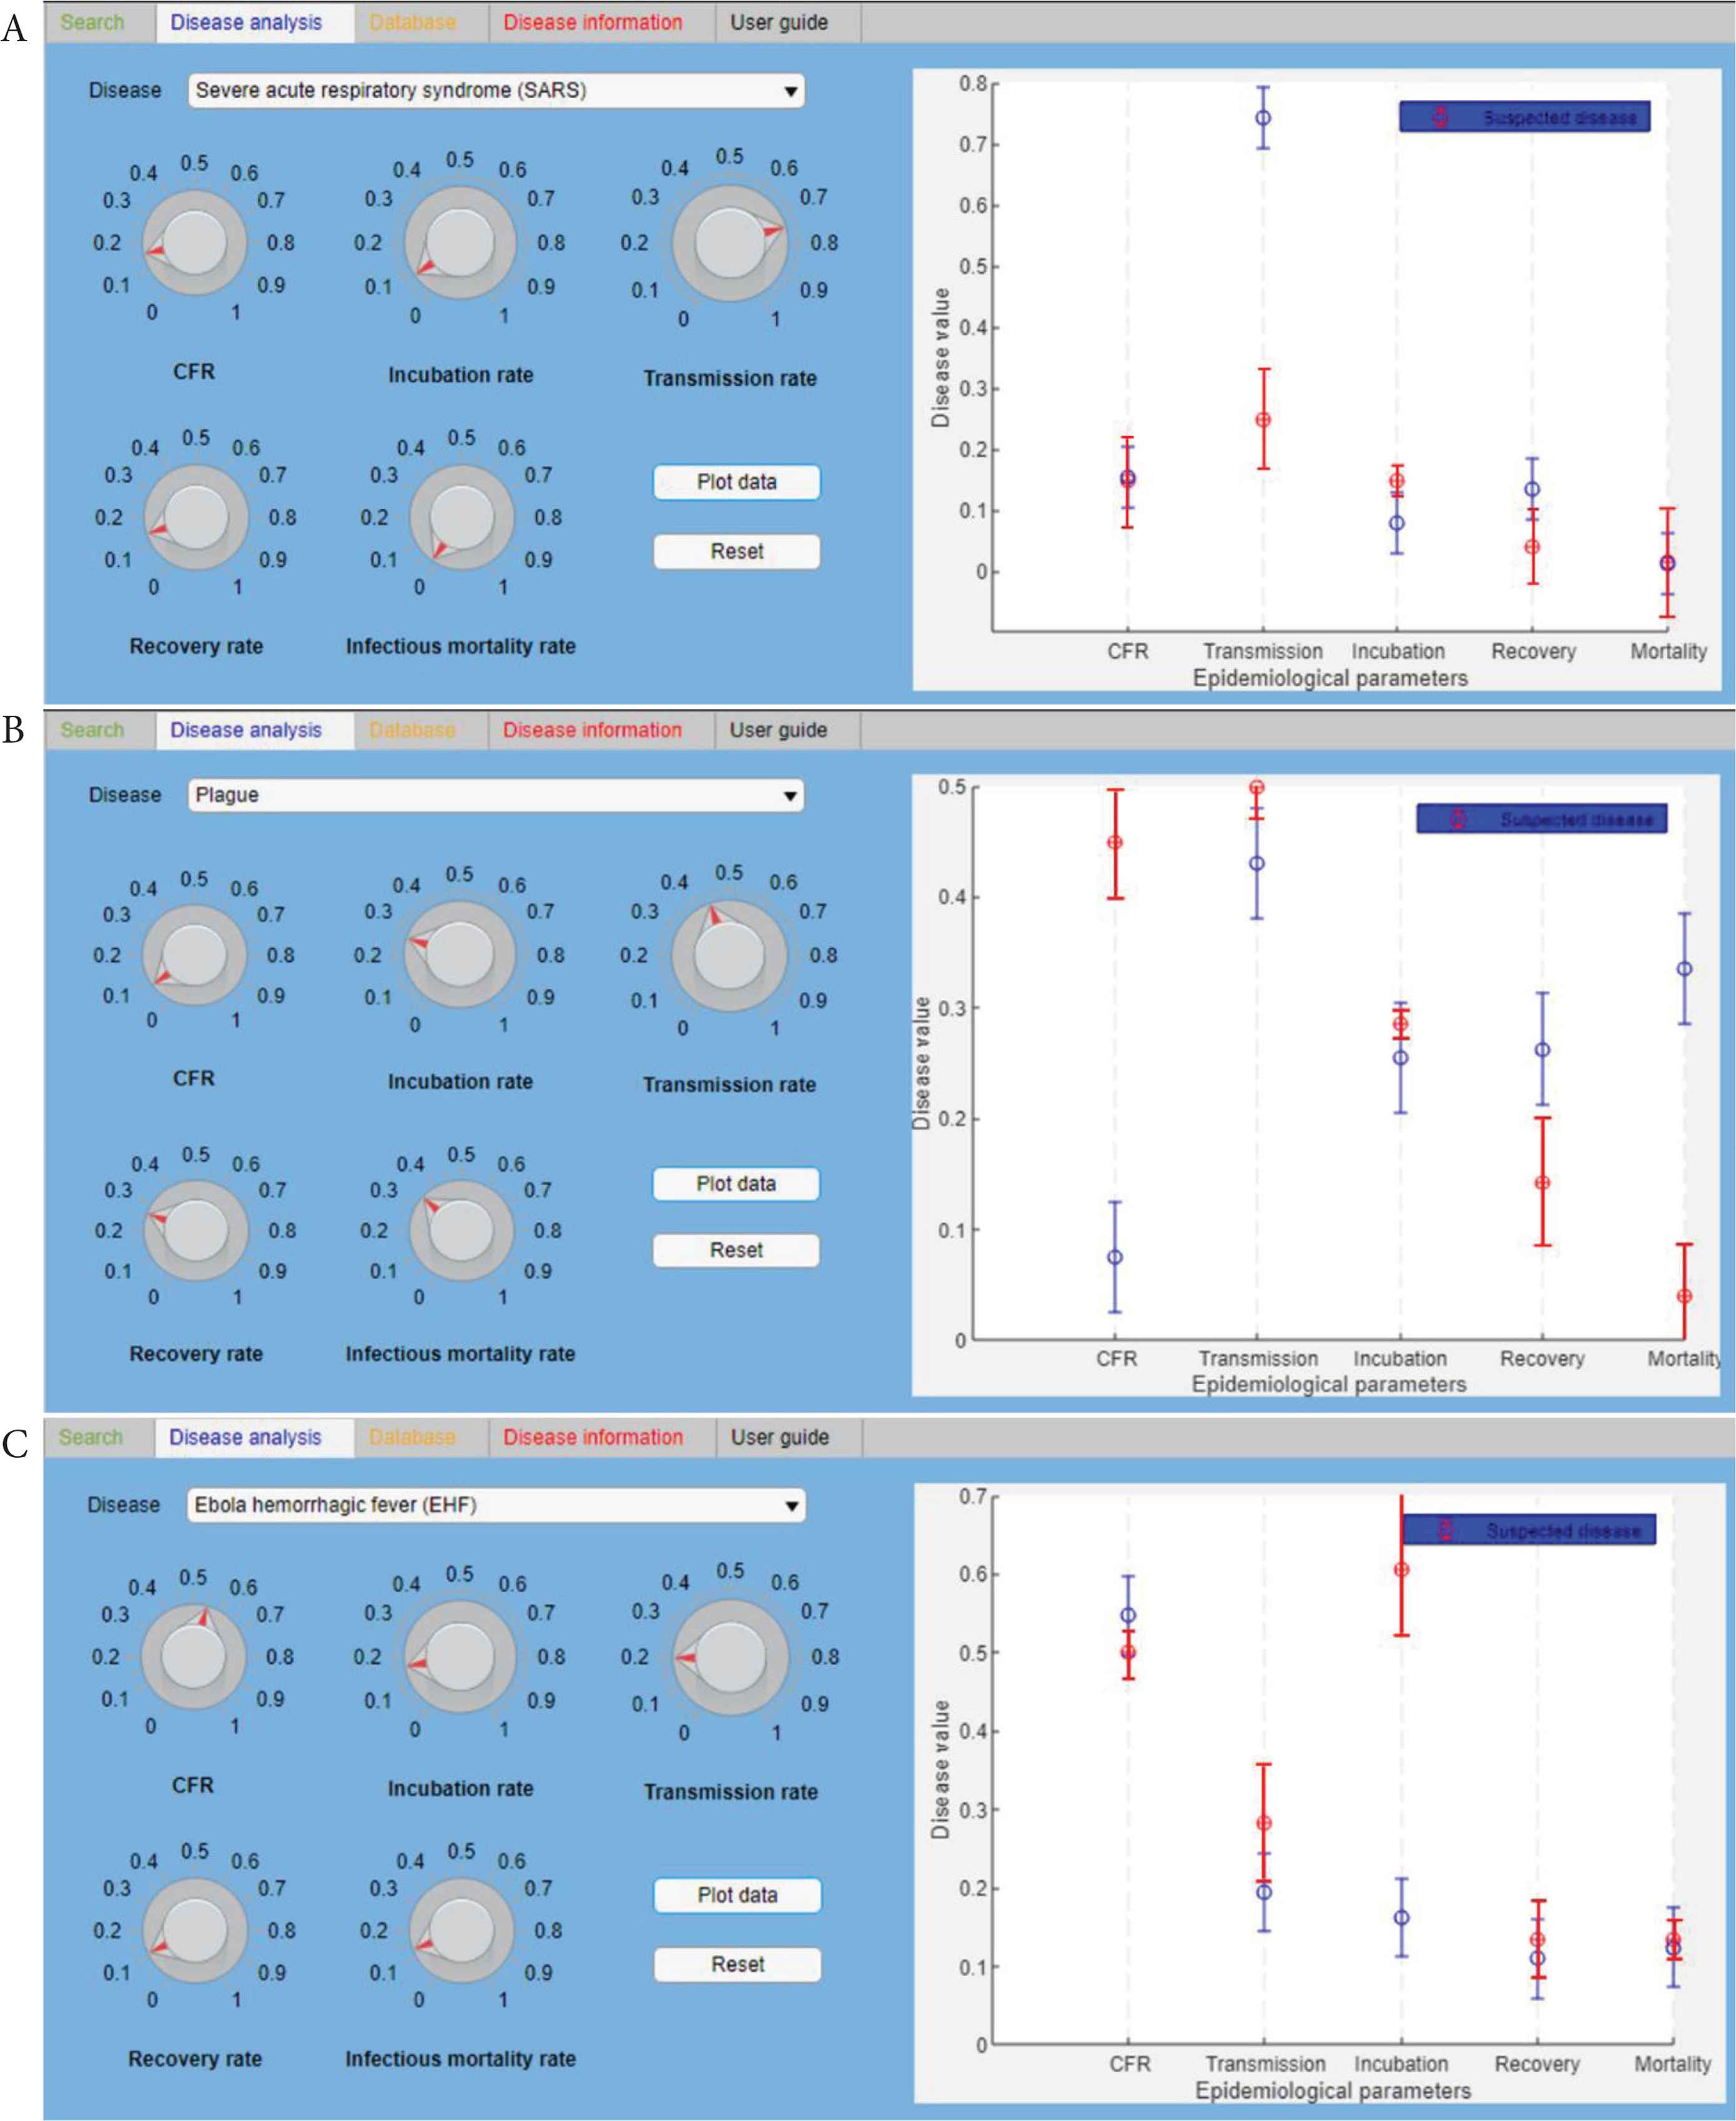
The “Disease analysis” tab. It shows the comparison between the database (red spots) and the disease data (blue spots), respectively, of SARS (A), Plague (B), and EVD (C). The fixed standard deviation (SD) of blue spots is 0.05 (5%).
The disease analysis function seems to have some little variance between the data of the database and the three diseases. In Figure 6, these variations have been graphically summarized. In particular, the scheme represents the correspondence for each of the five epidemiological parameters (CFR, transmission rate, incubation rate, recovery rate, and mortality rate) between the data from the database and the real cases considered in Table 2B (SARS in blue, Plague in red, and EVD in green). Three different conformity values have been assigned: 1 means that there is a 95 ± 5% correspondence between the database and the real case; 0.5 means that the correspondence is 50 ± 5%; 0 means that there is not a correspondence between data. A schematic representation is shown in Figure 6.
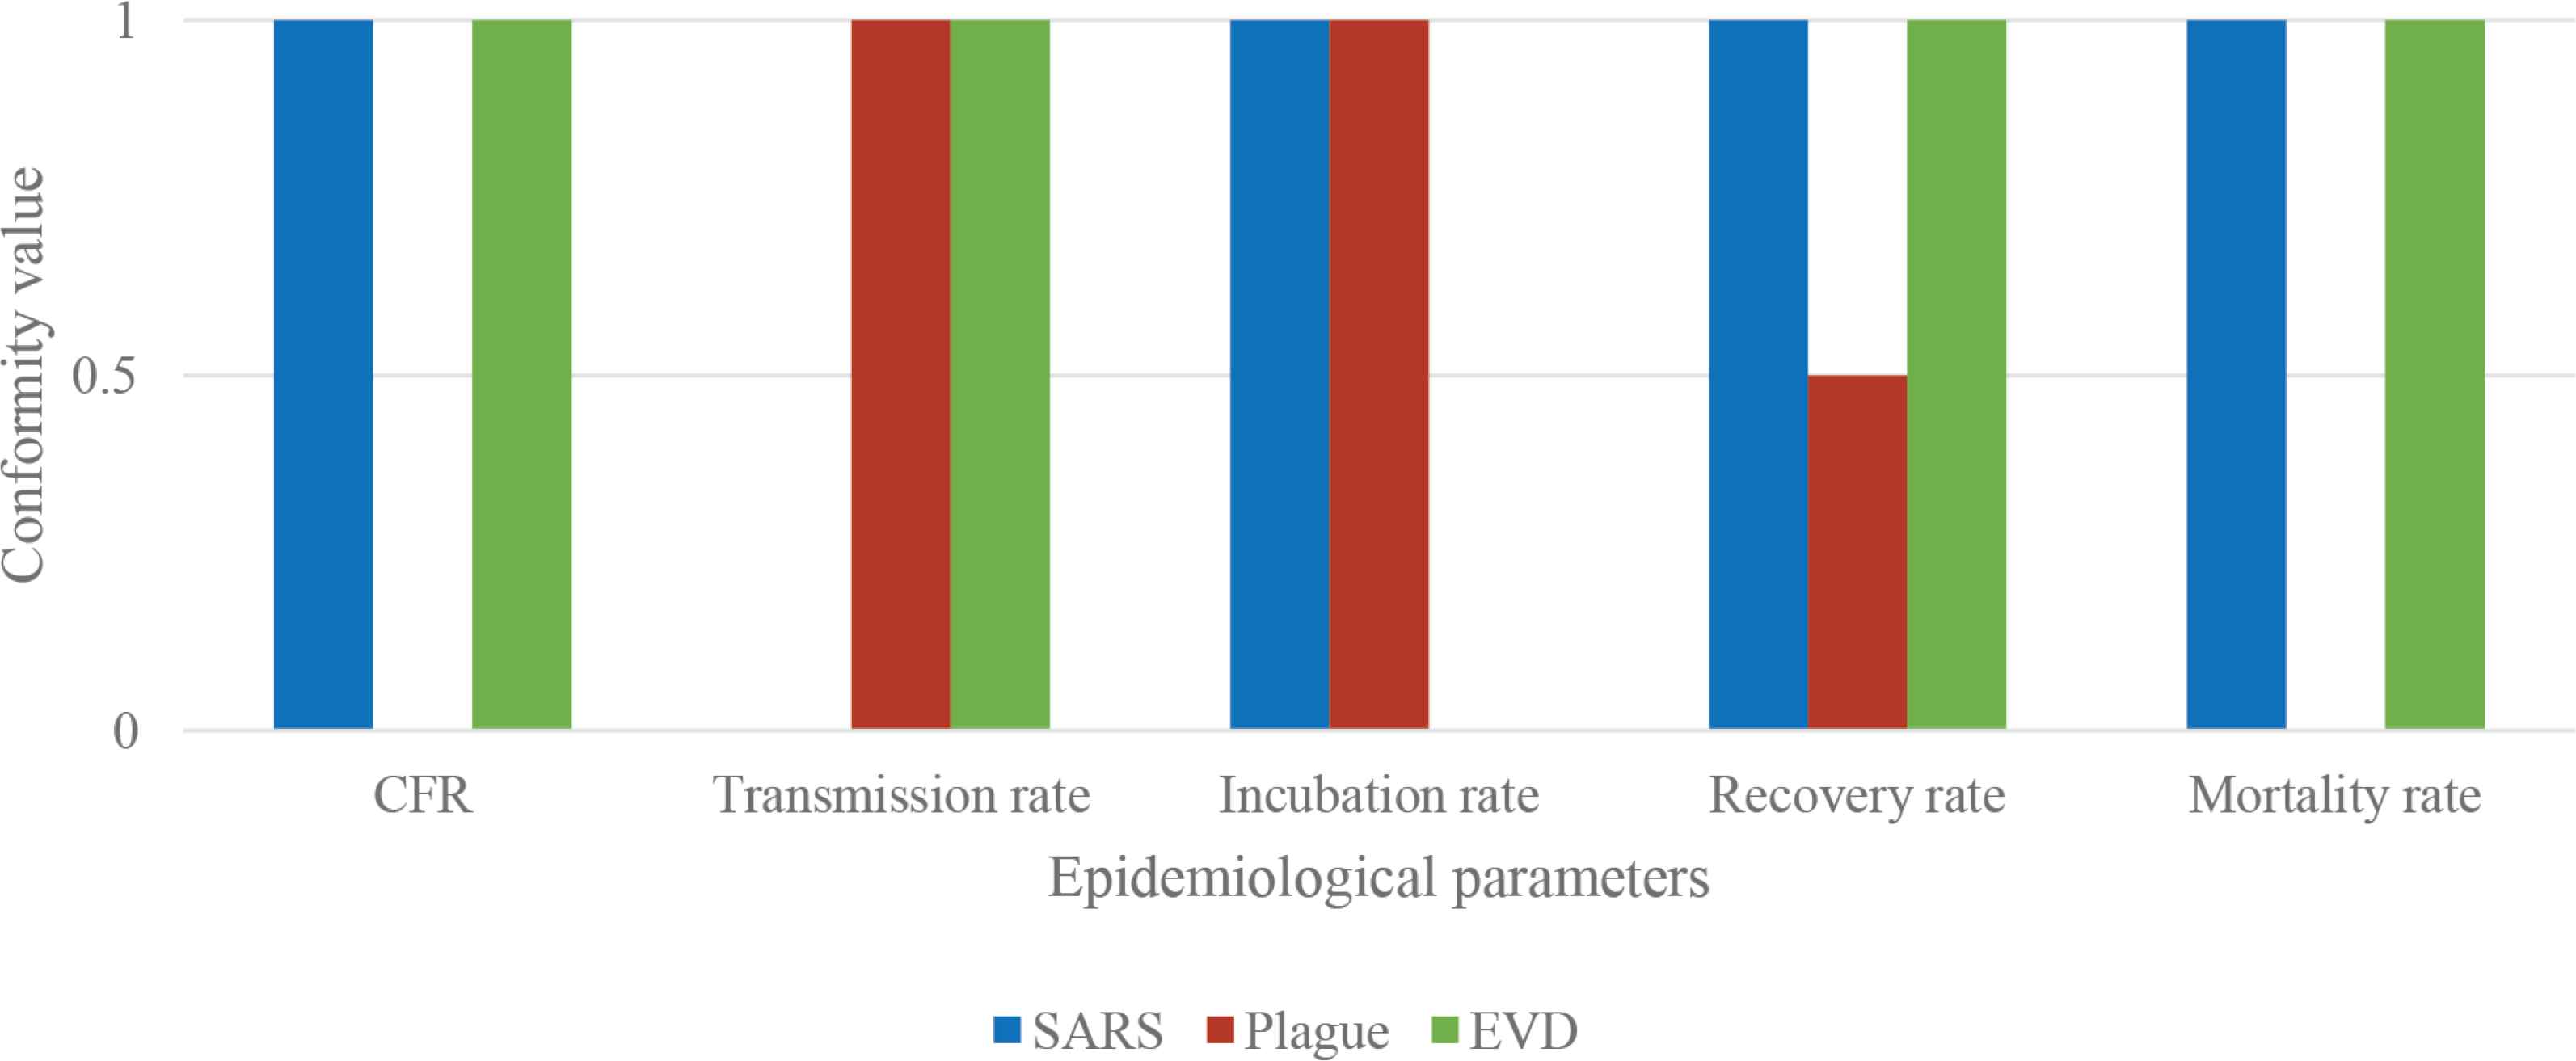
Parameters correspondence. Schematic representation of the correspondence for each of the five parameters (CFR, transmission rate, incubation rate, recovery rate, and mortality rate) between the data from the database and the real cases considered (SARS in blue, Plague in red, and EVD in green).
The accuracy ratio, that represents in this case the overall correspondence for each disease considered, is calculated as follows:
Consequently, the accuracy ratio is 80% for SARS and EVD, and 50% for Plague.
4. DISCUSSION
According to the results of these preliminary tests, the overall outcomes provided by the software are promising. The tool was stressed adequately testing three recent and relevant outbreaks of infectious diseases. In particular, the first step has been to test the capacities of the “Search” tab (green tab): the outcomes reveal that the IDS prototype has been able to identify all of the three agents and differentiate them with the rest of the agents loaded in the database (Figure 4).
The second and last step has been to test the “Disease analysis” tab (blue tab): the results show a reasonable correspondence between the database datasets and the three real cases considered. This lack of complete correspondence can be due to many reasons. It could be due to the difficulties to merge in the database all the data available in the scientific literature and consequently to find the best values that can represent uniquely the dynamics of a specific disease in a population. As known, the dynamics of a disease can change deeply only, for instance, taking into account the disease spread in two different populations that live in a diverse geographical region [56].
Nowadays, there are important limitations of the current set of tools used in forecasting outbreaks and highlight existing and emerging technologies that have the potential to significantly enhance forecasting capabilities are substantial. The focus on forecasting for outbreak management, specifically the capacity to predict short term (i.e., days to weeks) trends of disease activity or incidence (i.e., the number and location of new cases) in an ongoing outbreak [11,57].
The aim of this project is to insert in this lack of capability and technology a tool such as this first IDS prototype that has revealed itself a useful software to early identify a possible epidemic or outbreak at this level of developing as well. To do this, the IDS takes advantage of the off-line database that represents a pivotal characteristic for working without an internet connection. For this reason and taking into account the outcomes of this study, this first prototype needs, before developing the beta version of IDS, to improve the dependability of the database gathering in it more pathogens, and enhancing and increasing the epidemiological parameters available for each agent in order to increase the precision and sensibility of the agent identification.
5. CONCLUSION
This study had the intention to introduce and develop an infectious disease prediction tool working with an off line database built with specific epidemiological parameters of a set of 35 infectious diseases of high consequences. The analytical results show that the prototype of IDS software can perform this kind of investigation. The future perspective about this software regards the developing of that tool as a useful and user-friendly predictive tool appropriate for first responders, health care workers, and public health decision makers to help them in predicting, assessing and contrasting outbreaks. Furthermore, the intention is also to enhance the database reliability, crowding it with more pathogens (also rare agents) and extending the epidemiological parameters to permit to the software a better identification process. Then, the last intent is to create a standalone desktop app to run the application without passing or retrieving any arguments to or from MATLAB®. This standalone application will run on the most common operative systems (Windows, Linux®, and Mac) and it does not require a licensed copy of MATLAB®.
CONFLICTS OF INTEREST
The authors declare they have no conflicts of interest.
AUTHORS’ CONTRIBUTION
FB study conceptualization and writing (review & editing) the manuscript, FB and OC data curation, formal analysis and writing (original draft), PG funding acquisition and project administration, AM and PG supervised the project, FB and OC formal analysis and writing (original draft) the manuscript.
FUNDING
This research received no specific grant from any funding agency, commercial or not-for-profit sector.
ANNEXURE
Annex 1 List of the 35 pathogens and relative diseases
| Agent | Disease |
|---|---|
| Ebola virus | Ebola Hemorrhagic Fever (EHF) |
| Yellow fever virus | Yellow fever |
| SARS-associated Coronavirus (SARS-CoV) | Severe acute respiratory syndrome (SARS) |
| Variola major | Smallpox |
| Polio virus | Poliomyelitis |
| Marburg virus | Viral Hemorrhagic Fever (VHF) |
| Nipah virus | Nipah virus infection |
| Hendra virus | Hendra virus infection |
| Zika virus | Zika virus infection |
| Lassa Virus (LASV) | Lassa Hemorrhagic Fever (LHF) |
| Rift valley virus | Rift Valley Fever (RVF) |
| Dengue virus | Dengue fever |
| West nile virus | West Nile Disease (WND) |
| Middle East Respiratory Syndrome Coronavirus (MERS-CoV) | Middle East Respiratory Syndrome (MERS) |
| Avian (bird) influenza (flu) type A virus | Influenza |
| Epstein–Barr virus (EBV) | Infectious mononucleosis |
| Lymphocytic Choriomeningitis Virus (LCMV) | Lymphocytic choriomeningitis virus infection |
| Chikungunya virus | Chikungunya fever |
| Eastern Equine Encephalitis Virus (EEEV) | Eastern Equine Encephalitis (EEE) |
| Western Equine Encephalitis Virus (WEEV) | Western Equine Encephalitis (WEE) |
| Venezuelan Equine Encephalitis Virus (VEEV) | Venezuelan Equine Encephalitis or Encephalomyelitis (VEE) |
| Hepatitis A virus (HAV) | Hepatitis A, liver disease |
| Hepatitis B virus (HBV) | Hepatitis B, liver disease |
| Hepatitis C virus (HCV) | Hepatitis C, liver disease |
| Varicella-zoster virus (VZV) | Chickenpox or varicella |
| Legionella pneumophila | Legionellosis, Pontiac fever |
| Yersinia pestis | Plague |
| Coxiella burnetii | Q fever |
| Mycobacterium tuberculosis | Tuberculosis (TB) |
| Francisella tularensis | Tularemia |
| Mycobacterium leprae | Leprosy, Hansen’s disease |
| Salmonella Typhi | Typhi fever |
| Leptospira spp | Leptospirosis |
| Listeria monocytogenes | Listeriosis |
| Neisseria meningitidis | Bacterial meningitis |
Footnotes
REFERENCES
Cite this article
TY  - JOUR
AU  - F. Baldassi
AU  - O. Cenciarelli
AU  - A. Malizia
AU  - P. Gaudio
PY  - 2020
DA  - 2020/07/21
TI  - First Prototype of the Infectious Diseases Seeker (IDS) Software for Prompt Identification of Infectious Diseases
JO  - Journal of Epidemiology and Global Health
SP  - 367
EP  - 377
VL  - 10
IS  - 4
SN  - 2210-6014
UR  - https://doi.org/10.2991/jegh.k.200714.001
DO  - 10.2991/jegh.k.200714.001
ID  - Baldassi2020
ER  -