
Double Burden of Malnutrition in the Asia-Pacific Region—A Systematic Review and Meta-analysis
- DOI
- 10.2991/jegh.k.191117.002How to use a DOI?
- Keywords
- Double burden; Asia-Pacific; malnutrition; undernutrition; overnutrition
- Abstract
Background: Double Burden of Malnutrition (DBM)—the coexistence of undernutrition along with overnutrition—is a significant public health issue in the Asia-Pacific region. The scope of the DBM in this region is largely unknown. This review aims to determine the prevalence of under- and overnutrition as major DBM components and to investigate whether there has been a shift from under- to overnutrition in the Asia-Pacific region.
Methods: Online databases including PubMed and Web of Science were searched for original studies on DBM prevalence in the Asia-Pacific region; particularly, those published from January 2008 to December 2018 were screened for eligibility. We collected data on indicators of under- and overnutrition on the population level and adapted the ratio of prevalence of overweight/obesity versus prevalence of underweight as the main outcome indicator. Pooled prevalence estimates of DBM and the ratio of overnutrition versus undernutrition were generated using R (3.4.0).
Results: In total, 33 studies were included in this review. Pooled analysis demonstrated that DBM was generally presented among countries/areas in the Asia-Pacific region except in high-income countries (HICs). Overall, the prevalence of undernutrition was 8.8% (95% CI 7.3–10.6%) while overnutrition among the same population reached 23.0% (95% CI 20.3–26.0%). Countries in the Oceania region or HICs reported low level of undernutrition (less than 3%). All subgroup analysis (geolocation, income level, sex, age) reported pooled prevalence of overweight/obesity as more than 18%. Overall, the whole region and all subgroups were more likely to experience a higher prevalence of overnutrition than undernutrition, except that low- and lower-middle-income countries (L-MICs) had similar prevalence for over- and undernutrition.
Conclusion: DBM in the Asia-Pacific region is alarmingly high and is titled toward overnutrition. As a result, future interventions/policy targeting to maintain a healthy weight for the population should not just focus on prevention and treatment toward one direction.
- Copyright
- © 2019 Atlantis Press International B.V.
- Open Access
- This is an open access article distributed under the CC BY-NC 4.0 license (http://creativecommons.org/licenses/by-nc/4.0/).
1. INTRODUCTION
Malnutrition is universal and has various forms. Excess and deficit, generally, are the two directions of malnutrition. Double Burden of Malnutrition (DBM) means co-occurring burdens of under- and overnutrition, characterized by the coexistence of undernourishment along with overweight, obesity, or diet-related Noncommunicable Diseases (NCDs). This coexistence of double burden has been recognized as a global trend [1]. In 2018, 2.01 billion adults were overweight and obese globally. By contrast, 150.8 million children were stunted. Meanwhile, 50.5 and 38.3 million children were wasted and overweight, respectively. Furthermore, DBM is also an important point for intervention and action to achieve the target of ending all forms of malnutrition. To tackle the issue of DBM properly, it is necessary to understand the scope of DBM.
Asia-Pacific region with the largest population worldwide is a place where the DBM issue should be prioritized. Countries in this region accounted for most of the global burden of stunting [2]. At the same time, overweight and obesity prevalence in the area is also rising, with China, India, Pakistan, and Indonesia taking four places of the top 10 countries with the highest populations of obesity in the world [3]. As a result, the economic and medical consequences of DBM in the Asia-Pacific countries are of great significance. It has been reported that malnutrition and infant stunting have resulted in losses in marked gross national product for Asian countries [4]. Simultaneously, the negative impact of the increasing prevalence of obesity is also rising [5]. Urbanization, poorly managed diet and lifestyle, obesity, and related noncommunicable chronic diseases have escalated with increased risks of many adverse health outcomes, including serious cardiometabolic diseases and certain types of cancers [6]. Reducing the DBM is fundamental to managing health outcomes in the Asia-Pacific region.
Nevertheless, to our knowledge, the scope of DBM in the Asia-Pacific region has not yet been systematically synthesized. Some studies have looked at the epidemiological transition from infectious diseases to NCDs in mega cities or in developing countries [7,8]. However, we did not find any research that systematically reviewed the DBM issue in the Asia-Pacific region.
Therefore, this study aimed to document the prevalence of under- and overnutrition prevailing in all population groups in the Asia-Pacific region, with further investigation into whether there has been a shift from underweight to overweight in the region. Regarding the measures of DBM through literature review, we observed that the most common indicator for undernutrition is underweight (low age- and gender-specific body mass index), which is a common and objective measure for both children and adults. Some researchers also used the term “thinness” to describe undernutrition in children, however, which is of less objective criteria. Other indicators include stunting and wasting, which are specific for children. For overnutrition, the most common indicator is overweight and obesity. In some cases, central obesity was also used. With these defined outcome indicators, this study aims to offer insight into the pertinent stakeholders regarding the trend and magnitude of different forms of malnutrition existing in the Asia-Pacific region.
2. MATERIALS AND METHODS
2.1. Search Strategy
We searched peer-reviewed literature from PubMed and Web of Science, utilizing a focused title, topics, abstract, and keyword search in each database using a combination of medical subject headings and text terms. The search terms used were:
[(double burden of malnutrition) OR (dual burden of malnutrition) OR (nutrition transition) OR underweight OR undernutrition OR overweight OR obesity OR (micronutrient deficiency)] AND prevalence AND (Asia OR Pacific OR Oceania)
The search returned 886 results in PubMed and 834 results in Web of Science. After removing 732 duplicates and adding 11 additional studies identified through a snowball method by cross-checking the references of articles retrieved, 999 papers were included in the initial title and abstract screening for relevance. To get the most recent findings of the past decade, the literature published from January 1, 2008, to December 31, 2018, was screened for suitability.
Two authors independently screened and evaluated the eligibility of the papers. When the title and abstract of each study contained insufficient information to determine its appropriateness for inclusion, the full manuscript was reviewed. If the two authors had discrepancy on the inclusion, a third author was involved in evaluation. Finally, 33 studies were included in the systematic review, and 31 of them with appropriate data were included in the meta-analysis. The overall quality of the studies was assessed using a validated risk of bias tool explicitly for prevalent study [10]. The flowchart of the literature search process was shown in Figure 1. The countries/areas where the studies were conducted were stratified geographically (Asia and Oceania) and economically [high-income countries/areas (HICs), upper-middle-income countries (U-MICs), and low- and lower-middle-income countries (L-MICs)] according to the World Bank criteria for the 2020 fiscal year [11].
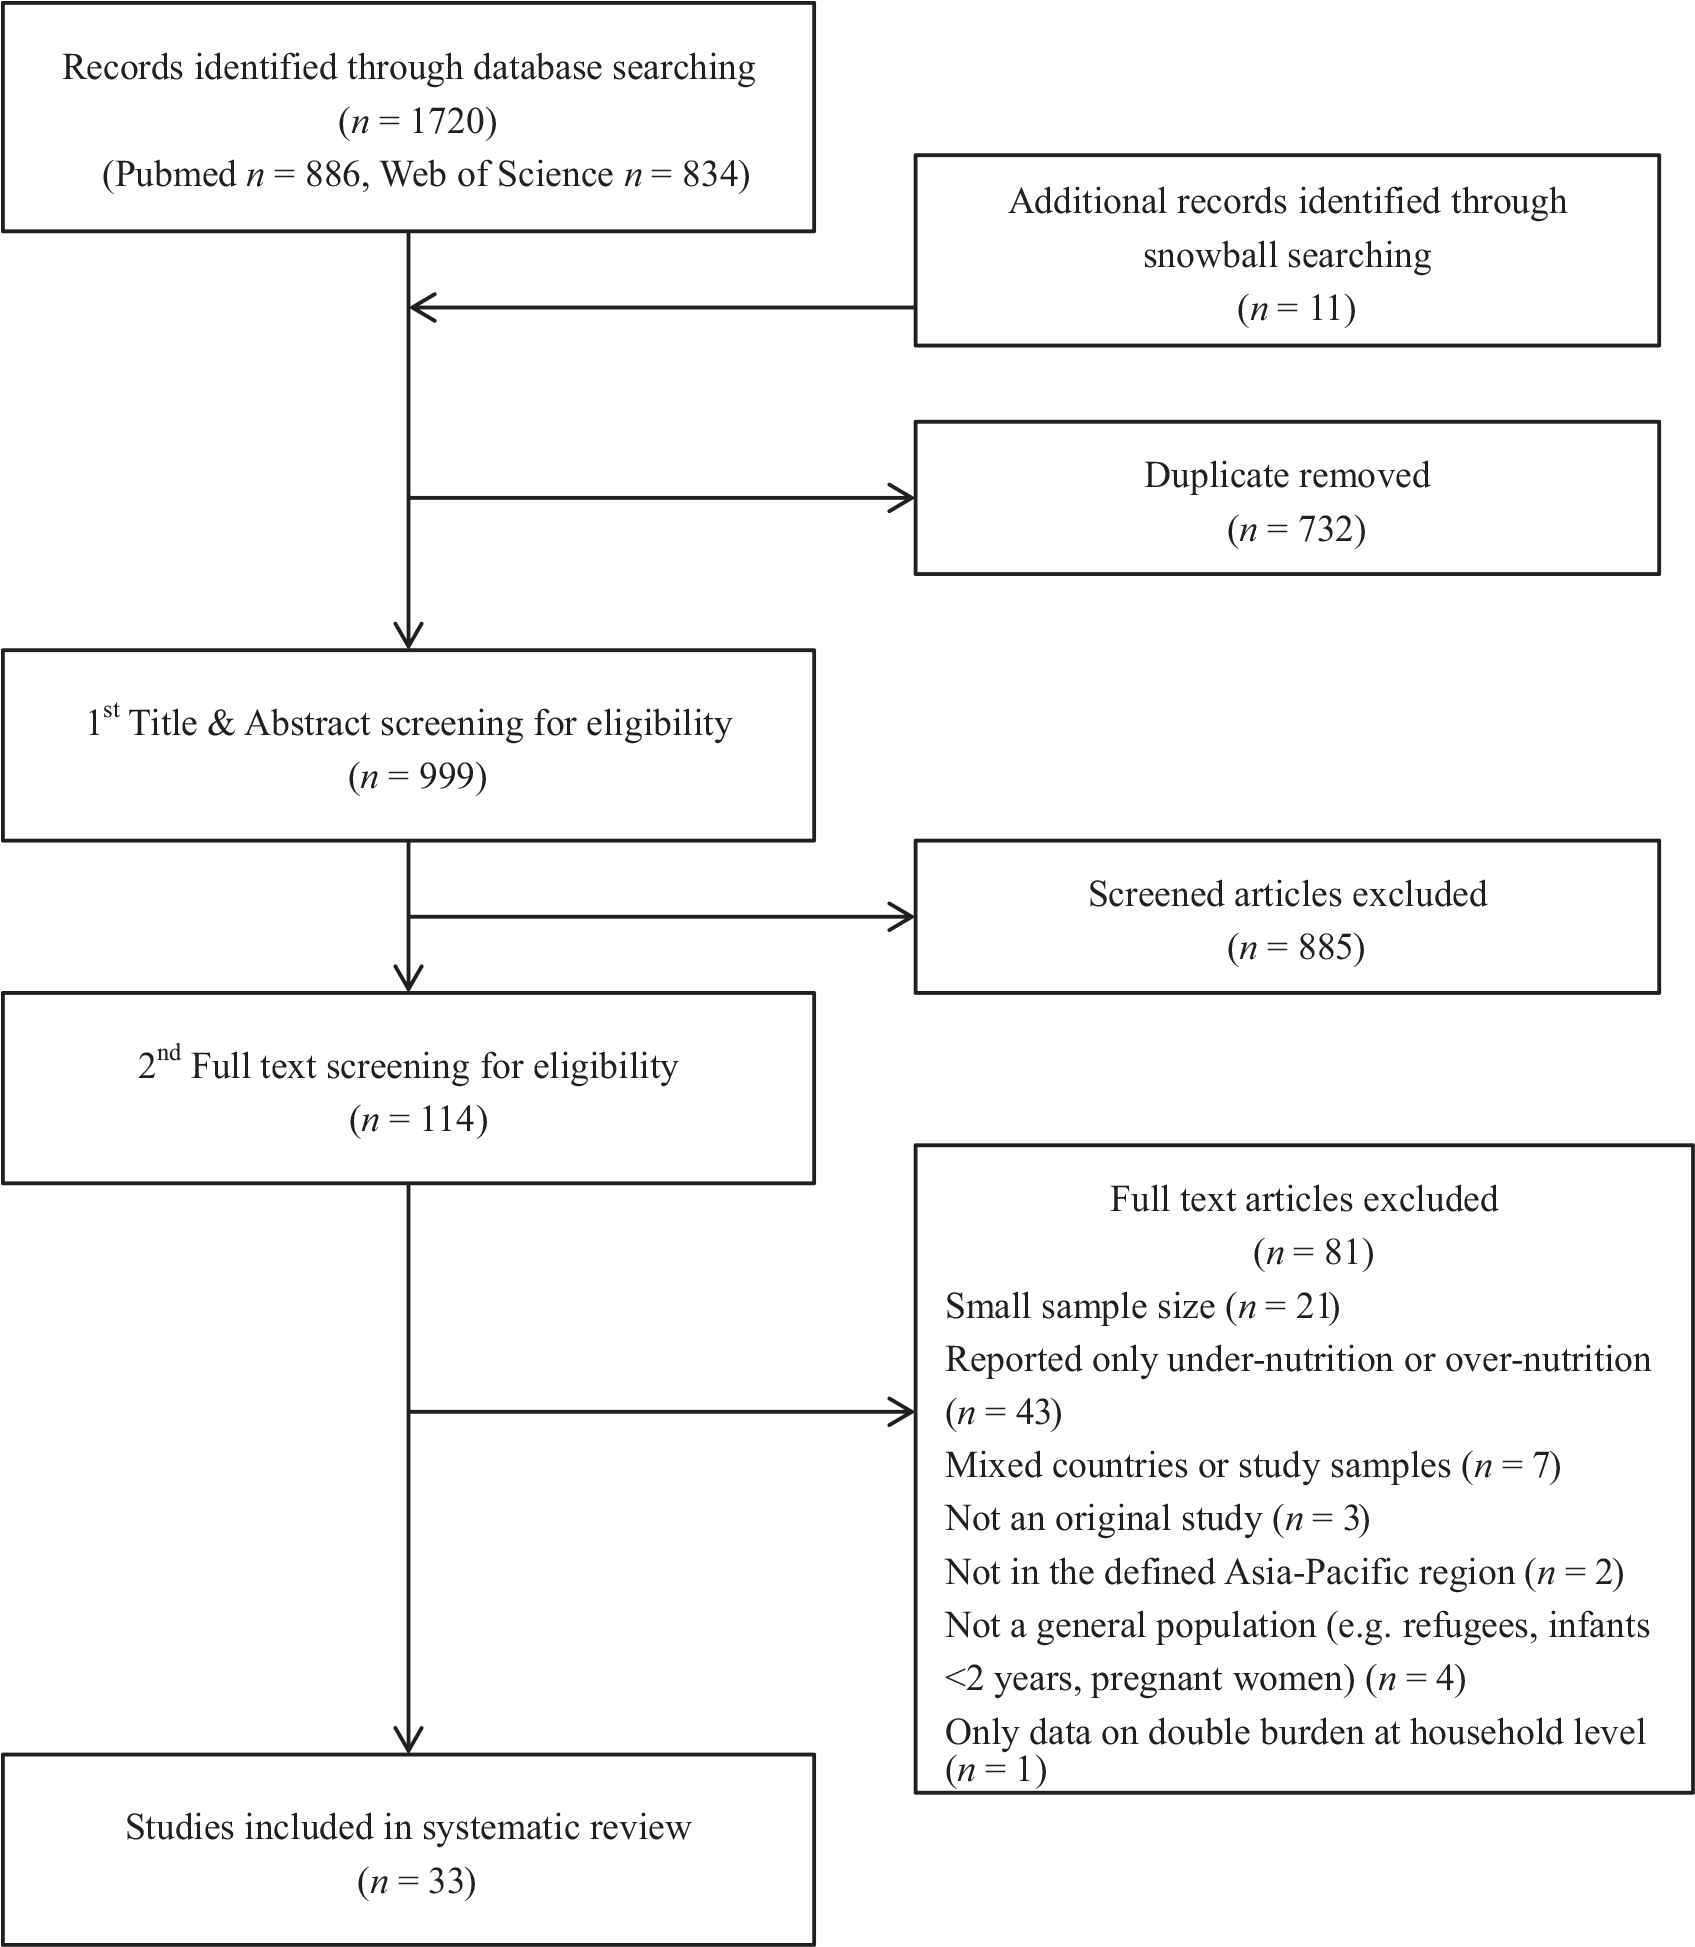
Flowchart of literature search of studies on double burden of malnutrition in Asia-Pacific region.
2.2. Inclusion/Exclusion Criteria
The inclusive criteria for the review included (1) published in English from January 1, 2008, to December 31, 2018; (2) studies conducted in the Asia-Pacific region defined geographically, including East Asia and Pacific and South Asia defined by World Bank [11]; (3) original study; (4) in the general population; (5) reported both prevalence of under- and overnutrition of the same population at the same time point; (6) provided data for individual country or population; and (7) the sample size > 1000.
The exclusive criteria for the studies included (1) studies not conducted in the Asia-Pacific region; (2) not an original study (e.g., reviews, meta-analysis); (3) population lack generalizability (e.g., refugees, pregnant women, infants under 2 years old only, indigenous population); (4) no precise reporting on either under- or overnutrition; (5) mixed countries or populations; (6) the sample size ≤ 1000; and (7) only reported data on the prevalence of double burden at household level but not at individual level.
2.3. Quality Assessment of the Included Studies
All the included studies were evaluated by a validated tool for assessing risk of bias in prevalence studies [10], including altogether 10 items in terms of both external and internal validity. If the study fits the item of the criteria, one point was appointed to the study, otherwise zero point was appointed. The studies with a total of eight points or above were evaluated as high quality, otherwise as low quality.
2.4. Data Extraction
Data extraction was performed according to the preferred reporting items for systematic reviews and meta-analyses (PRISMA) guidelines by two of the authors independently. Disagreements were solved through discussion. Data extracted included the authors, publication year, country/area the study was conducted, study setting, prevalence of under- and overnutrition, and criteria used for the evaluation of nutritional status. The authors decided to use the prevalence of overweight/obesity and the prevalence of underweight as the primary outcomes, since 93.9% (31/33) of included studies fitted the description, despite different criteria used for weight categorization. The overnutrition/undernutrition ratio was also calculated to indicate the direction of DBM. Age and gender-specific prevalence of both underweight and overweight/obesity was extracted for meta-analysis. If a study described the results of multiple years, the results from the most recent year were extracted to ensure that each study was properly weighted in the meta-analysis.
2.5. Analysis Strategy
To assess the scope of DBM, the prevalence of under- and overnutrition was calculated based on the population information from the included studies. Scatter plot was adapted to display the prevalence of undernutrition against overweight/obesity from studies. To better attribute the double-burden estimates, population information was further categorized by age (young children <5 years old, children and adolescents 5–18 years old, and adults 18+ years old), sex (female, male, and mixed), region (Asia, Oceania), and country income status (HICs, U-MICs, and L-MICs) according to World Bank ranking for the 2020 fiscal year [11] because these factors are previously recognized determinants for DBM on population level [9,12].
When findings from more than three studies were grouped under a single subcategory, a meta-analysis was conducted to combine the information in accordance with the Meta-analysis of Observational Studies in Epidemiology guidelines. The comparison of variables was set as between prevalence of undernutrition versus the prevalence of overweight/obesity. Both fixed- (Mantel–Haenszel) and random-effect (DerSimonian–Laird) models were conducted. For each subcategory, if both the fixed- and random-effect models were significant, the pooled prevalence for under- or overnutrition from the random-effect model was used to explain the scope of DBM. The likelihood of being more under- or overnutrition was calculated as the prevalence of overweight/obesity versus undernutrition ratio. Heterogeneity was reported as I2. Meta-analyses of DBM on population level is expected to have high heterogeneity due to variances in settings, measurement error types, and reporting time. In our study, all relevant information satisfied the criteria were selected into this meta-analysis, despite variance. Sensitivity analysis was not performed due to the risk of biasing the pooled prevalence through removal of studies representing all geographical areas.
All statistical analysis was performed using R (R3.4.0, R Core Team 2017, Vienna, Austria, https://www.R-project.org/). Meta-analysis was achieved using functions “meta,” “metarate,” “forest,” and “model” from R packages “meta” and “metafor”. All codes and data for meta-analysis models and forest plots were uploaded online on GitHub open source (website veiled for the blind review process).
3. RESULTS
3.1. Search Results and Included Studies
The 33 included studies (Figure 1) reported data from 19 countries/areas in the Asia-Pacific region. The majority studies were conducted in Asia (n = 26) and the rest were in Oceania (n = 7). The Asian countries/regions involved include China (4), India (3), South Korea (3), Cambodia (3), Indonesia (2), Thailand (2), Nepal (2), Malaysia (2), Bangladesh (1), Bhutan (1), Pakistan (1), Singapore (1), and Taiwan (1). The Oceania countries involved include Australia (2), New Zealand (1), Palau (1), New Caledonian (1), Micronesia (1), and Fiji (1). Accordingly, 10 studies reported findings from HICs [Australia (2), New Zealand (1), Palau (1), New Caledonia (1), Taiwan (1), South Korea (3), and Singapore (1)], nine studies from U-MICs [China (4), Malaysia (2), Thailand (2), and Fiji (1)], and the rest 14 studies were conducted in L-MICs [Bangladesh (1), Bhutan (1), Cambodia (3), India (3), Indonesia (2), Micronesia (1), Pakistan (1), and Nepal (2)]. Two studies (from Indonesia and Nepal), which were not included in the meta-analysis, were indicated in Table 1 with explanations.
| References# | Country/area | Study setting | Overall study subjects | Undernutrition (%) | OWB (%) | Classification of weight status | OWB/UW ratio |
|---|---|---|---|---|---|---|---|
| Asia, children and adolescents (9 studies) | |||||||
| Horiuchi et al., 2018 [S1] | Cambodia | National survey 2014/2015 | N = 2020 M, F: 6–17 years |
Stunted, thinness: 33.2, 15.0 Rural: 36.4, 16.1 Urban: 20.4, 10.4 |
OWB: 3.1 Rural: 2.3 Urban: 6.4 |
WHO 2007 for children | Rural: 0.14 Urban: 0.62 |
| Kang et al., 2018 [S2] | Bhutan | National Nutrition Survey Bhutan 2015 | N = 1506 M, F: 0–59 months |
Pedal edema 1.7 Wasting (M, F) 2.6, 2.6 Stunting (M, F) 17.4, 24.8 UW (M, F) 5.5, 9.1 |
OW (M, F) 3.4, 1.9 | WHO 2006/2007 for children | M: 0.62 F: 0.21 |
| Chaudhury et al., 2017 [S3] | India | West Bengal school students survey 2013–2016 | N = 9306 M, F: 8–18 years |
UW 8–12 years: 8.72 13–18 years: 9.30 |
OW, OB 8–12 years: 17–89, 14.06 13–18 years: 17.30, 9.37 |
Indian growth reference, CDC criteria using age-specific BMI percentiles | 8–12 years: 3.66 13–18 years: 2.69 |
| Partap et al., 2017 [S4] | Malaysia | Survey 2013 to 2014 | N = 6414 M, F: 6–18 years |
UW: 4.6 (M: 5.5; F: 4.3) 6–9 years: 7.2 10–14 years: 4.9 15–18 years: 4.6 |
OW, OB: 31.4, 13.1 M: 34.1, 17.1 F: 28.7, 11.4 6–9 years: 33.4, 18.3 10–14 years: 36.2, 16.1 15–18 years: 24.0, 8.7 |
WHO 2006/2007 for children | WHO: 9.7 (M: 11.1; F: 9.3) 6–9 years: 4.4 10–14 years: 7.9 15–18 years: 3.2 |
| Zhang et al., 2016 [S5] | China, rural | China Health and Nutrition Survey (CHNS) 1991–2009 | N = 11,630 M, F <18 years |
UW (M, F) 56.33, 43.67 | OWB (M, F) 47.07, 52.93 | Chinese growth reference UW (WAZ <−2), OWB (BMIZ >1) based on Chinese urban children |
M: 0.84 F: 1.21 |
| Greffeuille et al., 2016 [S6] | Cambodia | Cambodia Demographic Health Survey (CDHS) 2014 | N = 3549 M, F <5 years |
UW (M, F) 23.3, 25.1 | OWB (M, F) 8.3, 6.5 | WHO growth reference UW (weight for age z <−2) OWB (BMI for age z >2) |
M: 0.36 F: 0.26 |
| Zhang et al., 2015 [S7] | China, Shandong | National Surveys on Chinese Students’ Constitution and Health | N = 42,348 M, F: 7–18 years |
Thinness 7–12 years, 13–18 years M: 8.72, 10.88 F: 14.90, 15.25 |
OW, OB 7–12 years M: 18.71, 8.26 F: 13.13, 3.02 13–18 years M: 13.87, 4.50 F: 8.17, 1.19 |
IOTF | 7–12 years M: 3.09; F: 1.08 13–18 years M: 1.69; F: 0.62 |
| Piernas et al., 2015 [S8] | China | CHNS 2009–2011 | N = 1191 in 2009 N = 1648 in 2011 |
UW, stunting, 2011 2–6 years: 18.9, 4.2 7–12 years: 21.4, 0.4 |
OW, OB, 2011 2–6 years: 10.1, 12.4 7–12 years: 12.6, 6.3 |
WHO 2006/2007 for children | 2–6 years: 1.19 7–12 years: 0.88 |
| Sandjaja et al., 2013 [S9]# | Indonesia | SEANUTS study in Indonesia | N = 7211 M, F: 0.5–12 years |
UW (rural, urban): 28.9, 19.2 | OWB (rural, urban): 3.2, 5.6 | WHO 2006/2007 for children | Rural: 0.11 Urban: 0.29 |
| Asia, adults (15 studies) | |||||||
| Khan et al., 2017 [S10] | Pakistan | Survey among adults on obesity prevalence | N = 1321 M, F ≥ 18 years |
UW (WHO, WHO Asia): 17.7, 17.7 | OW, OB WHO: 16.9, 4.8 WHO Asia: 15.3, 21.7 |
WHO, WHO Asia | WHO: 1.23 WHO Asia: 2.09 |
| Pell et al., 2016 [S11] | Malaysia | The South East Asia Community Observatory (SEACO) in Segamat District, Johor 2013–2014 | N = 5319 M, F: 16–35 years |
UW (M, F): 12.9, 13.9 | OW, OB M: 21.0, 11.1 F: 18.7, 15.4 |
WHO | M: 2.49 F: 2.45 |
| Subhaluksuksakorn et al., 2016 [S12] | Thailand | First year college students survey 2015 | N = 3279 M, F: 17–21 years |
UW (M, F): 16.37, 23.98 | OW, OB M: 21.0, 11.1 F: 18.7, 15.4 |
WHO Asia | M: 2.02 F: 1.06 |
| Greffeuille et al., 2016 [S13] | Cambodia | CDHS 2014 | N = 11,479 F: 15–49 years |
UW <20 years: 27.3 20–34 years: 13.7 35–49 years: 7.9 |
OWB <20 years: 3.6 20–34 years: 14.7 35–49 years: 30.6 |
WHO Asia | <20 years: 0.13 20–34 years: 1.07 35–49 years: 3.87 |
| Seo et al., 2016 [S14] | Korea | The Korean National Health and Nutrition Examination Survey (KNHANES) 2013 | N = 3257 M, F ≥ 30 years |
UW 3.4 | OW, OB: 24.0, 30.8 | WHO Asia | 16.1 |
| Xu et al., 2015 [S15] | China, Shaanxi | 5th National Health Service Survey of Shaanxi Province 2013 | N = 37,902 M, F: 25–64 years |
UW (M, F): 7.2, 10.9 | OW, OB M: 15.02, 1.03 F: 13.30, 1.05 |
WHO | M: 2.22 F: 1.31 |
| Sengupta et al., 2015 [S16] | India | National Family Health Surveys (NFHS-2 and NFHS-3) 1998–99 and 2005–06 | NFHS-2: N = 89,199 NFHS-3: N = 93,724 F: 15–49 years (ever-married) |
UW (NFHS-2, NFHS-3): 38.8, 32.2 | OW, OB NFHS-2: 13.7, 4.8 NFHS-3: 17.0, 7.1 |
WHO Asia | NFHS-2: 0.48 NFHS-3: 0.75 |
| Kamal et al., 2015 [S17] | Bangladesh | Bangladesh Demographic and Health Survey (BDHS) 2011 | N = 16,273 F: 15–49 years (ever-married) |
UW (mildly, moderately, severely): 14.4, 6.0, 3.8 | OB, OW: 2.9, 13.5 | WHO | 0.68 |
| Gaur et al., 2013 [S18] | India | NFHS of India, 2005–2006 | N = 19,488 F: 15–49 years (ever-married) |
UW (slum, non-slum): 23, 17 | OW (slum, non-slum): 24, 31 | WHO | Slum: 1.04 Non-slum: 1.82 |
| Banks et al., 2011 [S19] | Thailand | Survey 2005–2006 | N = 74,981 M, F: 20–50 years |
UW 14.4 | OW, OB: 15.0, 15.6 | WHO Asia | 2.13 |
| Khang et al., 2010 [S20] | Korea | KNHANE 1998, 2001, 2005, and 2007 | N = 22,801 M, F ≥ 20 years |
UW 1998, 2001, 2005, 2007 M: 4.8, 3.3, 3.5, 2.8 F: 5.5, 6.2, 5.8, 6.7 |
OWB 1998, 2001, 2005, 2007 M: 34.1, 45.5, 51.0, 52.8 F: 39.9, 42.5, 42.7, 42.5 |
WHO | 1998, 2001, 2005, 2007 M: 7.10, 13.79, 14.57, 18.86 F: 7.25, 6.85, 7.36, 6.34 |
| Lim et al., 2018 [S21] | Korea | KNHANES | N = 5326 M, F: 19–39 years |
UW (M, F): 3.2, 14.0 | OB (M, F): 6.6, 4.3 COB (M, F): 21.1, 11.5 |
WHO | M: 2.06 F: 0.31 |
| Agho et al., 2018 [S22] | Nepal | Nepal Demographic Health Survey (NDHS) 2016 | N = 14,857 M, F ≥ 15 years |
UW (M, F): 13, 14 | OWB (M, F): 17, 22 | WHO | M: 1.31 F: 1.57 |
| Wu et al., 2008 [S23] | Taiwan | Tainan Survey 2008 | N = 1437 M, F ≥ 20 years |
UW 5.1 | OW, OB: 21.8, 32.2 | WHO Asia | 10.59 |
| Ostbye et al., 2013 [S24] | Singapore | The Social Isolation, Health, and Lifestyles Survey (SIHLS) 2009 | N = 4371 M, F ≥ 60 years |
UW 60–69 years, 70–79 years, ≥80 years M: 4.7, 9.1, 12.0 F: 6.0, 6.8, 12.4 |
OW, OB 60–69 years M: 16.2, 4.9 F: 22.6, 10.2 70–79 years M: 14.6, 4.1 F: 22.1, 10.0 ≥80 years M: 12.5, 4.9 F: 13.6, 6.2 |
WHO Asia | 60–69 years, 70–79 years, ≥80 years M: 4.48, 2.04, 1.43 F: 5.46, 4.75, 1.60 |
| Asia, mixed children and adults (2 studies) | |||||||
| Vaezghasemi et al., 2014 [S25] | Indonesia | Indonesian Family Life Survey (IFLS4) 2007–2008 | N = 38,273 M, F ≥ 2 years |
UW (rural, urban): 20, 18 | OW (rural, urban): 17, 25 | IOTF for children WHO for adults | Rural: 0.85 Urban: 1.39 |
| Stewart et al., 2013 [S26]$ | Nepal, rural | Nepal Nutrition Intervention Project–Sarlahi NNIPS-1 (1989–1991) NNIPS-2 (1992–1997) |
NNIPS-1: N = 3340 M, F: 15–23 years NNIPS-2: N = 1389 M, F: 9–13 years |
Stunted (NNIPS1, NNIPS2): 41.2, 56.1 | OW, OB NNIPS1: 4.9, 1.0 NNIPS2: 1.0, 0.4 |
BMI-z > 0.42 or WC > 90 cm for male and 80 cm for female adults WHO 2007 for children | Only data for stunting. Obesity–underweight ratio was not calculated |
| Oceania, children and adolescents (6 studies) | |||||||
| Abraham et al., 2018 [S27] | Micronesia | School children survey 2015–2016 | N = 2386 M, F: 12–18 years |
UW (M, F): 3.2, 0.7 | OW (M, F): 10.5, 23.8 OB (M, F): 9.3, 10.8 |
CDC criteria using age-specific BMI percentiles | M: 6.2 F: 49.4 |
| Tubert-Jeannin et al., 2018 [S28] | New Caledonian | National survey on oral health and stature-weight status 2011–2012 | N = 3138 M, F: 6, 9, 12 years |
UW (6, 9, 12 years): 1.8, 1.6, 1.8 | OW (6, 9, 12 years): 10.8, 18.1, 22.2 OB (6, 9, 12 years): 7.8, 11.4, 20.5 |
WHO 2007 for children | 6 years: 10.3 9 years: 18.4 12 years: 23.7 |
| O’Dea et al., 2014 [S29] | Australia | National surveys of school students 2006 and 2012 | N = 8550 M, F: 6–18 years |
UW (M, F, 2006): 3.8, 5.0 (M, F, 2012): 4.6, 6.0 |
OW (M, F, 2006): 17.7, 18.9 (M, F, 2012): 18.5, 18.7 OB (M, F, 2006): 7.5, 5.8 (M, F, 2012): 7.1, 5.6 |
IOTF | 2006, M, F: 6.63, 4.94 2012, M, F: 5.57, 4.05 |
| Wate et al., 2013 [S30] | Fiji | The Pacific Obesity Prevention In Communities (OPIC) Project | N = 6871 M, F: 13–18 years |
UW (M, F): 11.4, 5.44 | OW, OB M: 13.9, 5.7 F: 21.0, 6.8 |
WHO | M: 1.71 F: 1.78 |
| Achat et al., 2014 [S31] | Australia, western Sydney | A cross-sectional population-based survey, 2007 | N = 2341 M, F: school year 4 and 7 (mean age: 9 and 12 years) |
UW School year 4 (M, F): 1.8, 0 School year 7 (M, F): 0.2, 1.3 |
OW, OB School year 4 M: 19.2, 6.4 F: 20.8, 7.3 School year 7 M: 19.6, 6.5 F: 18.1, 4.6 |
IOTF | School year 4 M: 14.2; F: UW% = 0 School year 7 M: 130.5; F:17.5 |
| Utter et al., 2010 [S32] | New Zealand | National survey of the health and well-being of New Zealand secondary school students | N = 9107 M, F: 13–17 years |
UW IOTF, WHO M: 2.0, 0.5 F: 3.4, 0.3 |
OW, OB IOTF M: 23.3, 10.8 F: 24.7, 9.5 WHO M: 25.9, 14.6 F: 26.0, 12.1 |
IOTF, WHO 2007 for children | IOTF, WHO M: 17.1, 81.0 F: 10.1, 127.0 |
| Oceania, adults (1 studies) | |||||||
| Watson et al., 2015 [S33] | Palau | Nationwide survey | N = 2184 M, F: 25–64 years |
UW (M, F): 0.9, 1.5 | OW, OB M: 35.1, 40.3 F: 30.6, 45.3 |
WHO | M: 83.8 F: 50.6 |
Full citations of included studies are listed in supplementary reference list.
Not included in meta-analysis because the numerators and denominators for the prevalence were not provided in this study.
Not included in meta-analysis because stunting was used as indicator of under nutrition, thus making it uncomparable with other studies using underweight.
M, male; F, female; UW, underweight; OW, overweight; OB, obesity; OWB, overweight and obesity; COB, central obesity; WC, waist circumference; WHO, World Health Organization; IOTF, International Obesity Task Force; CDC, Center of Diseases Control; Classification of under- and overnutrition: WHO 2007 for children: stunting (HAZ <−2 SD), thinness (BAZ <−2 SD), OWB (BAZ >1 SDs) for children aged 5–19 years by WHO reference 2007. WHO 2006: UW (BMI for age <2 SD); OW (BMI for age >1 SD); OB (BMI for age >2 SD) for children aged <5 years by WHO Child Growth Standards. CDC: underweight (BMI <5th percentile); overweight (≥85th and <95th percentile); obesity (≥95th percentile). IOTF: corresponding to BMI classification of underweight (BMI <18.5 kg/m2), overweight (BMI 25–29.9 kg/m2), and obesity (BMI ≥30 kg/m2) at age 18 years in the IOTF sex-age-specific BMI cutoffs. WHO: underweight (BMI <18.5 kg/m2); overweight (BMI 25.0–29.9 kg/m2); obesity (BMI ≥30 kg/m2); central obesity: WC ≥90 cm in men and ≥85 cm in women. WHO Asia: underweight (BMI <18.5 kg/m2); normal weight (BMI 18.5–23.0 kg/m2); overweight (BMI 23.0–25.0 kg/m2); obese (BMI >25 kg/m2); central obesity: WC ≥90 cm for males and 80 cm for females).
Main characteristics of the 33 studies included regarding double burden of malnutrition in Asia-Pacific region
The meta-analysis consists of 31 studies with a total population sample size of 467,086. The largest population included by country was India (n = 122,518, 26.2% of total sample), followed by China (n = 93,528, 20.0%), Indonesia (n = 38,273, 8.2%), and South Korea (n = 31,384, 6.7%). Main characteristics and findings of the included studies are summarized in Table 1.
3.2. Study Quality
Study quality was assessed against the 10-item tool [10]. Overall, most studies (29 studies, 87.9%) were rated as having high quality (score ≥8), and four studies (12.1%) were rated as having low quality (score <8). In general, the studies had high scores in the evaluation of internal validity (data collection, clarity of definition, consistency, and reporting), but relatively low scores in external validity (national representative and nonresponse bias). Details were listed in Table S1.
3.3. The Scope of the DBM in the Asia-Pacific Region
Figure 2 demonstrated the reported prevalence of undernutrition against overnutrition by countries, while Table 2 outlined the pooled prevalence of under- and overnutrition in the Asia-Pacific region relative to population samples in the study. Detailed cross-tab information about number of publications, year of publication, year of data, and total number of populations for age, sex, and geolocation subgroups is available in Table S2. Overall, the coexistence of under- and overnutrition was substantial (Figure 2). Among the population with age more than 5 years, most of the countries had the prevalence of under- and overnutrition around or above 10% at the same time. Figures 3 and 4 demonstrated the pooled prevalence of undernutrition/overnutrition in the area from information from all the included studies. The overall pooled prevalence of undernutrition was as high as 8.8% (95% CI 7.3–10.6%; Figure 3 and Table 2), while overnutrition among the same population reached 23.0% (95% CI 20.3–26.0%; Figure 4 and Table 2).
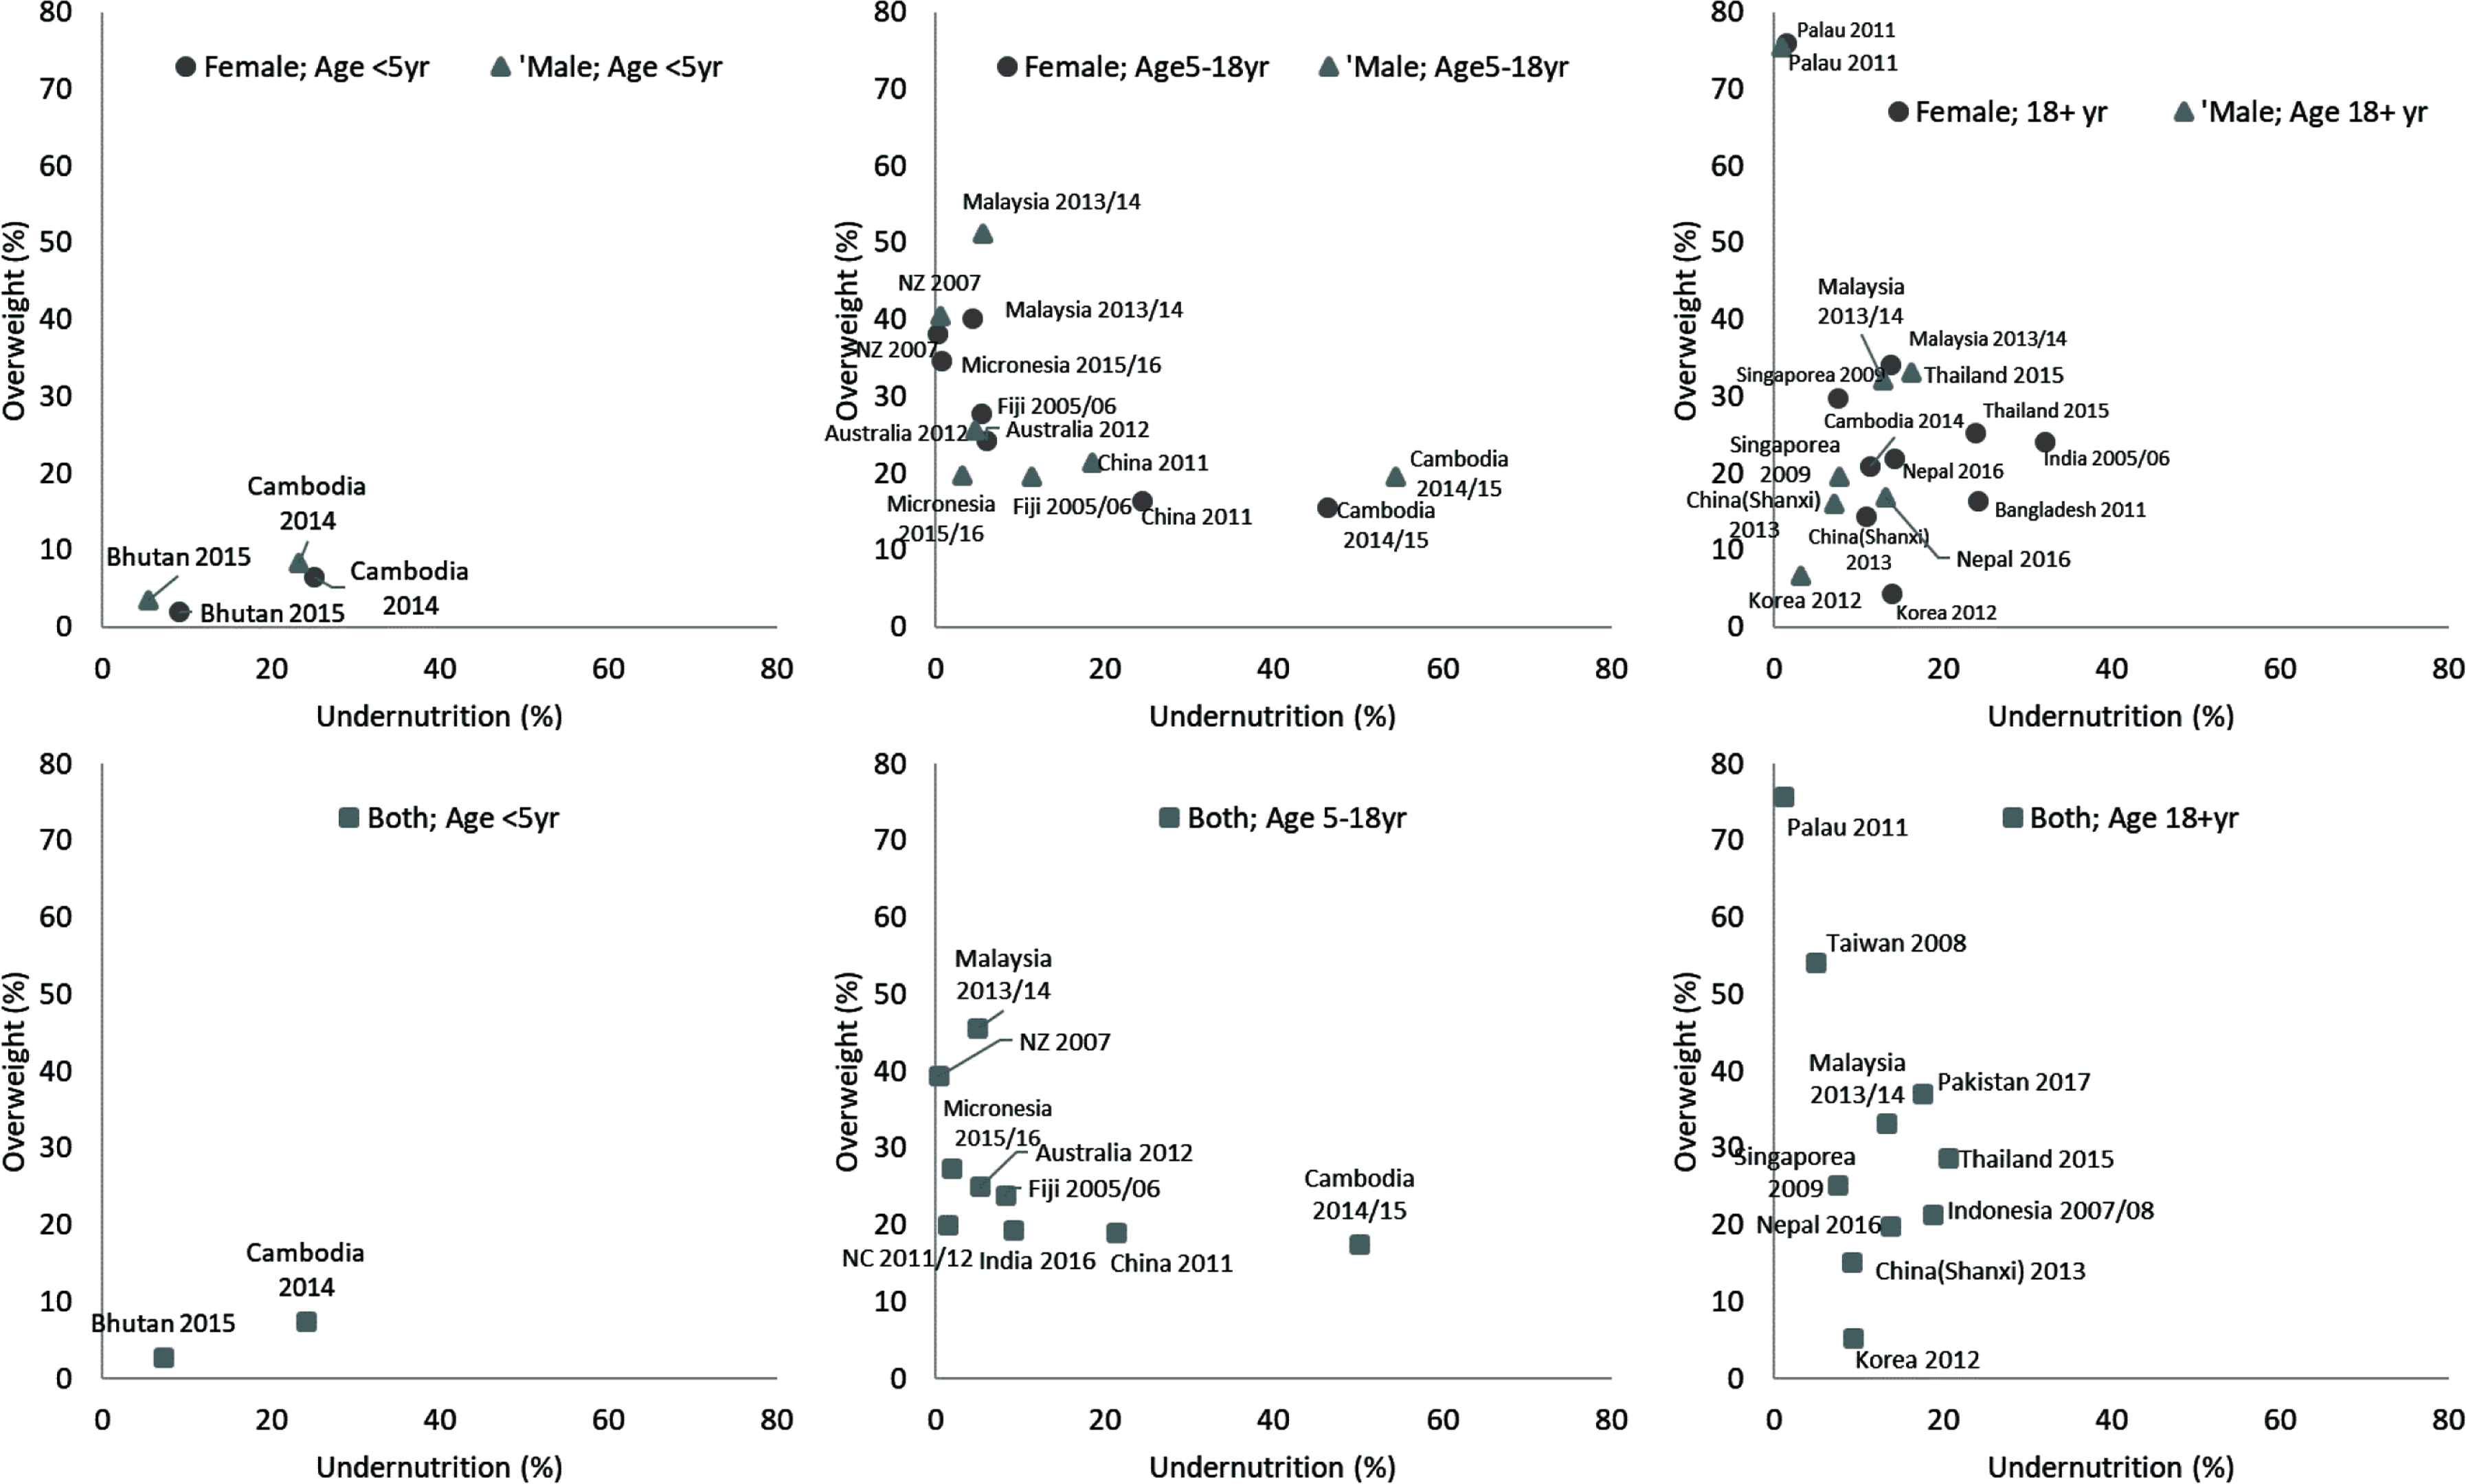
Double burden of undernutrition and overweight/obesity in different countries, separated by age (<5 years old, 5–18 years old, and 18+ years old, by columns) and sex (female indicated as round marker, male indicated as triangle marker, top row). Both: combined reports of both male and female. Only the newest reports of the country were displayed. NC: New Caledonia, NZ: New Zealand.
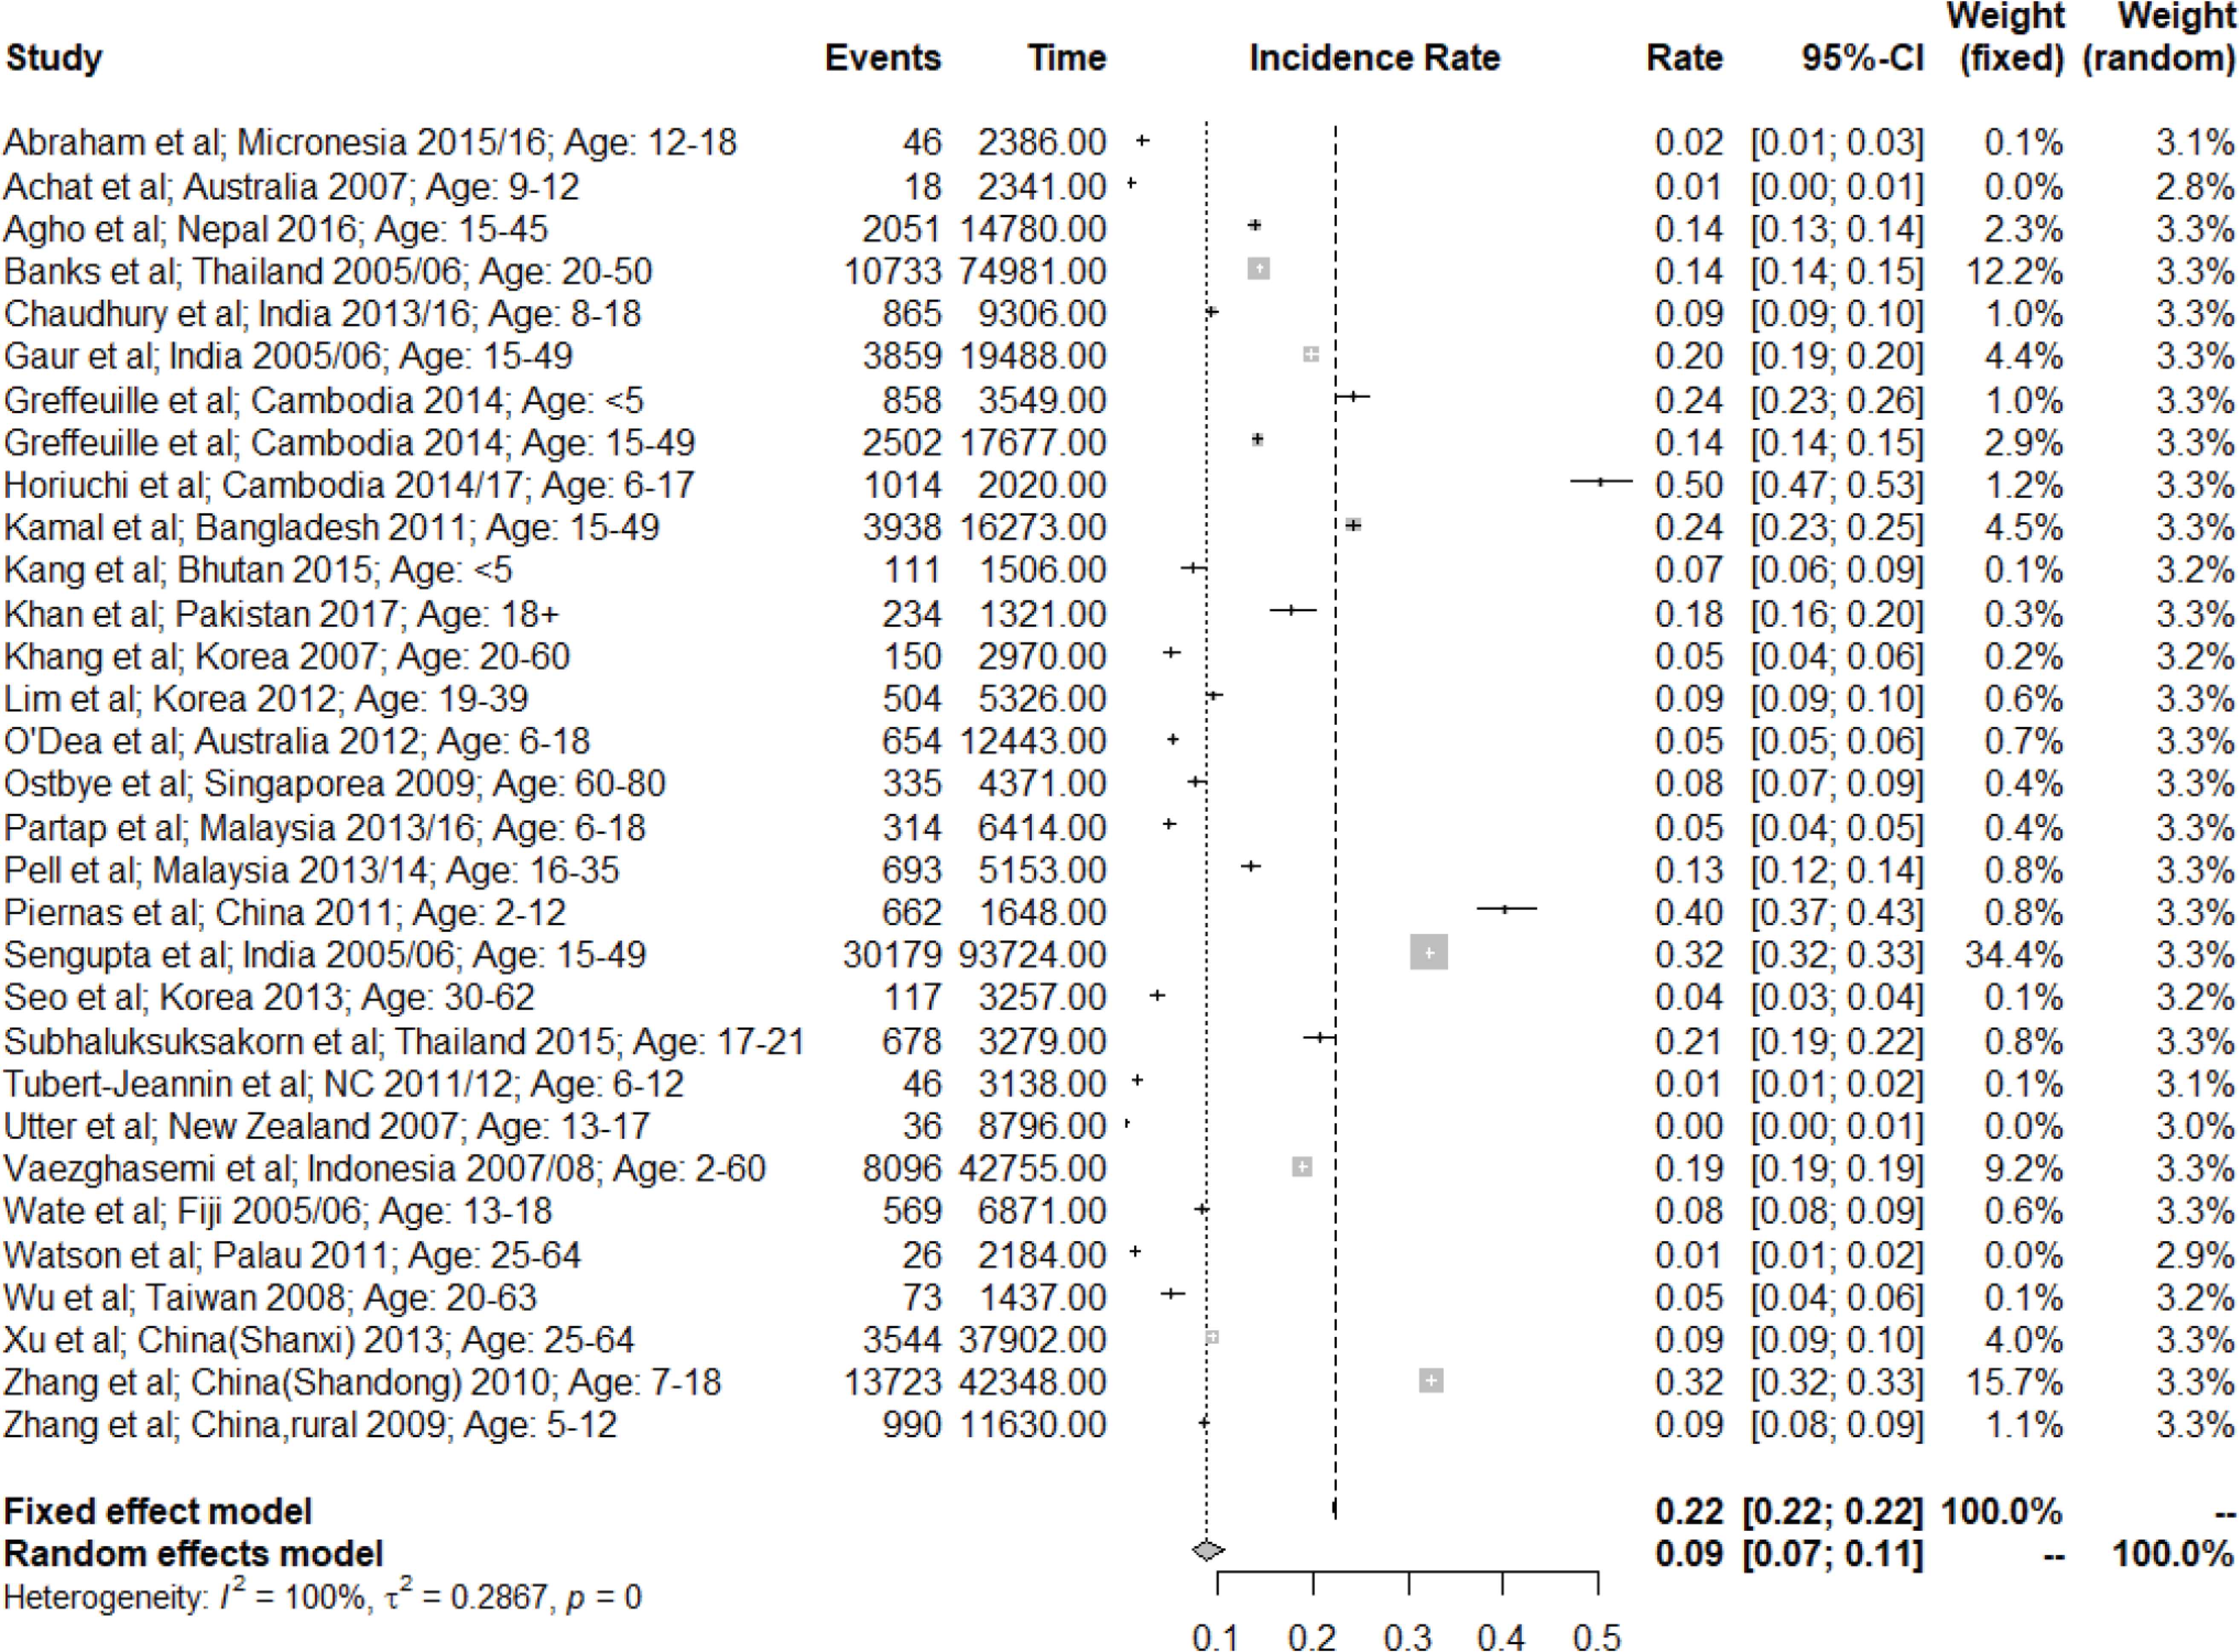
Overall undernutrition prevalence from pooled analysis. NC: New Caledonia; Events: Underweight (N); Time: Total (N); Dense dash line: Incidence rate from random model; Loose dash line: Incidence rate from fixed model.
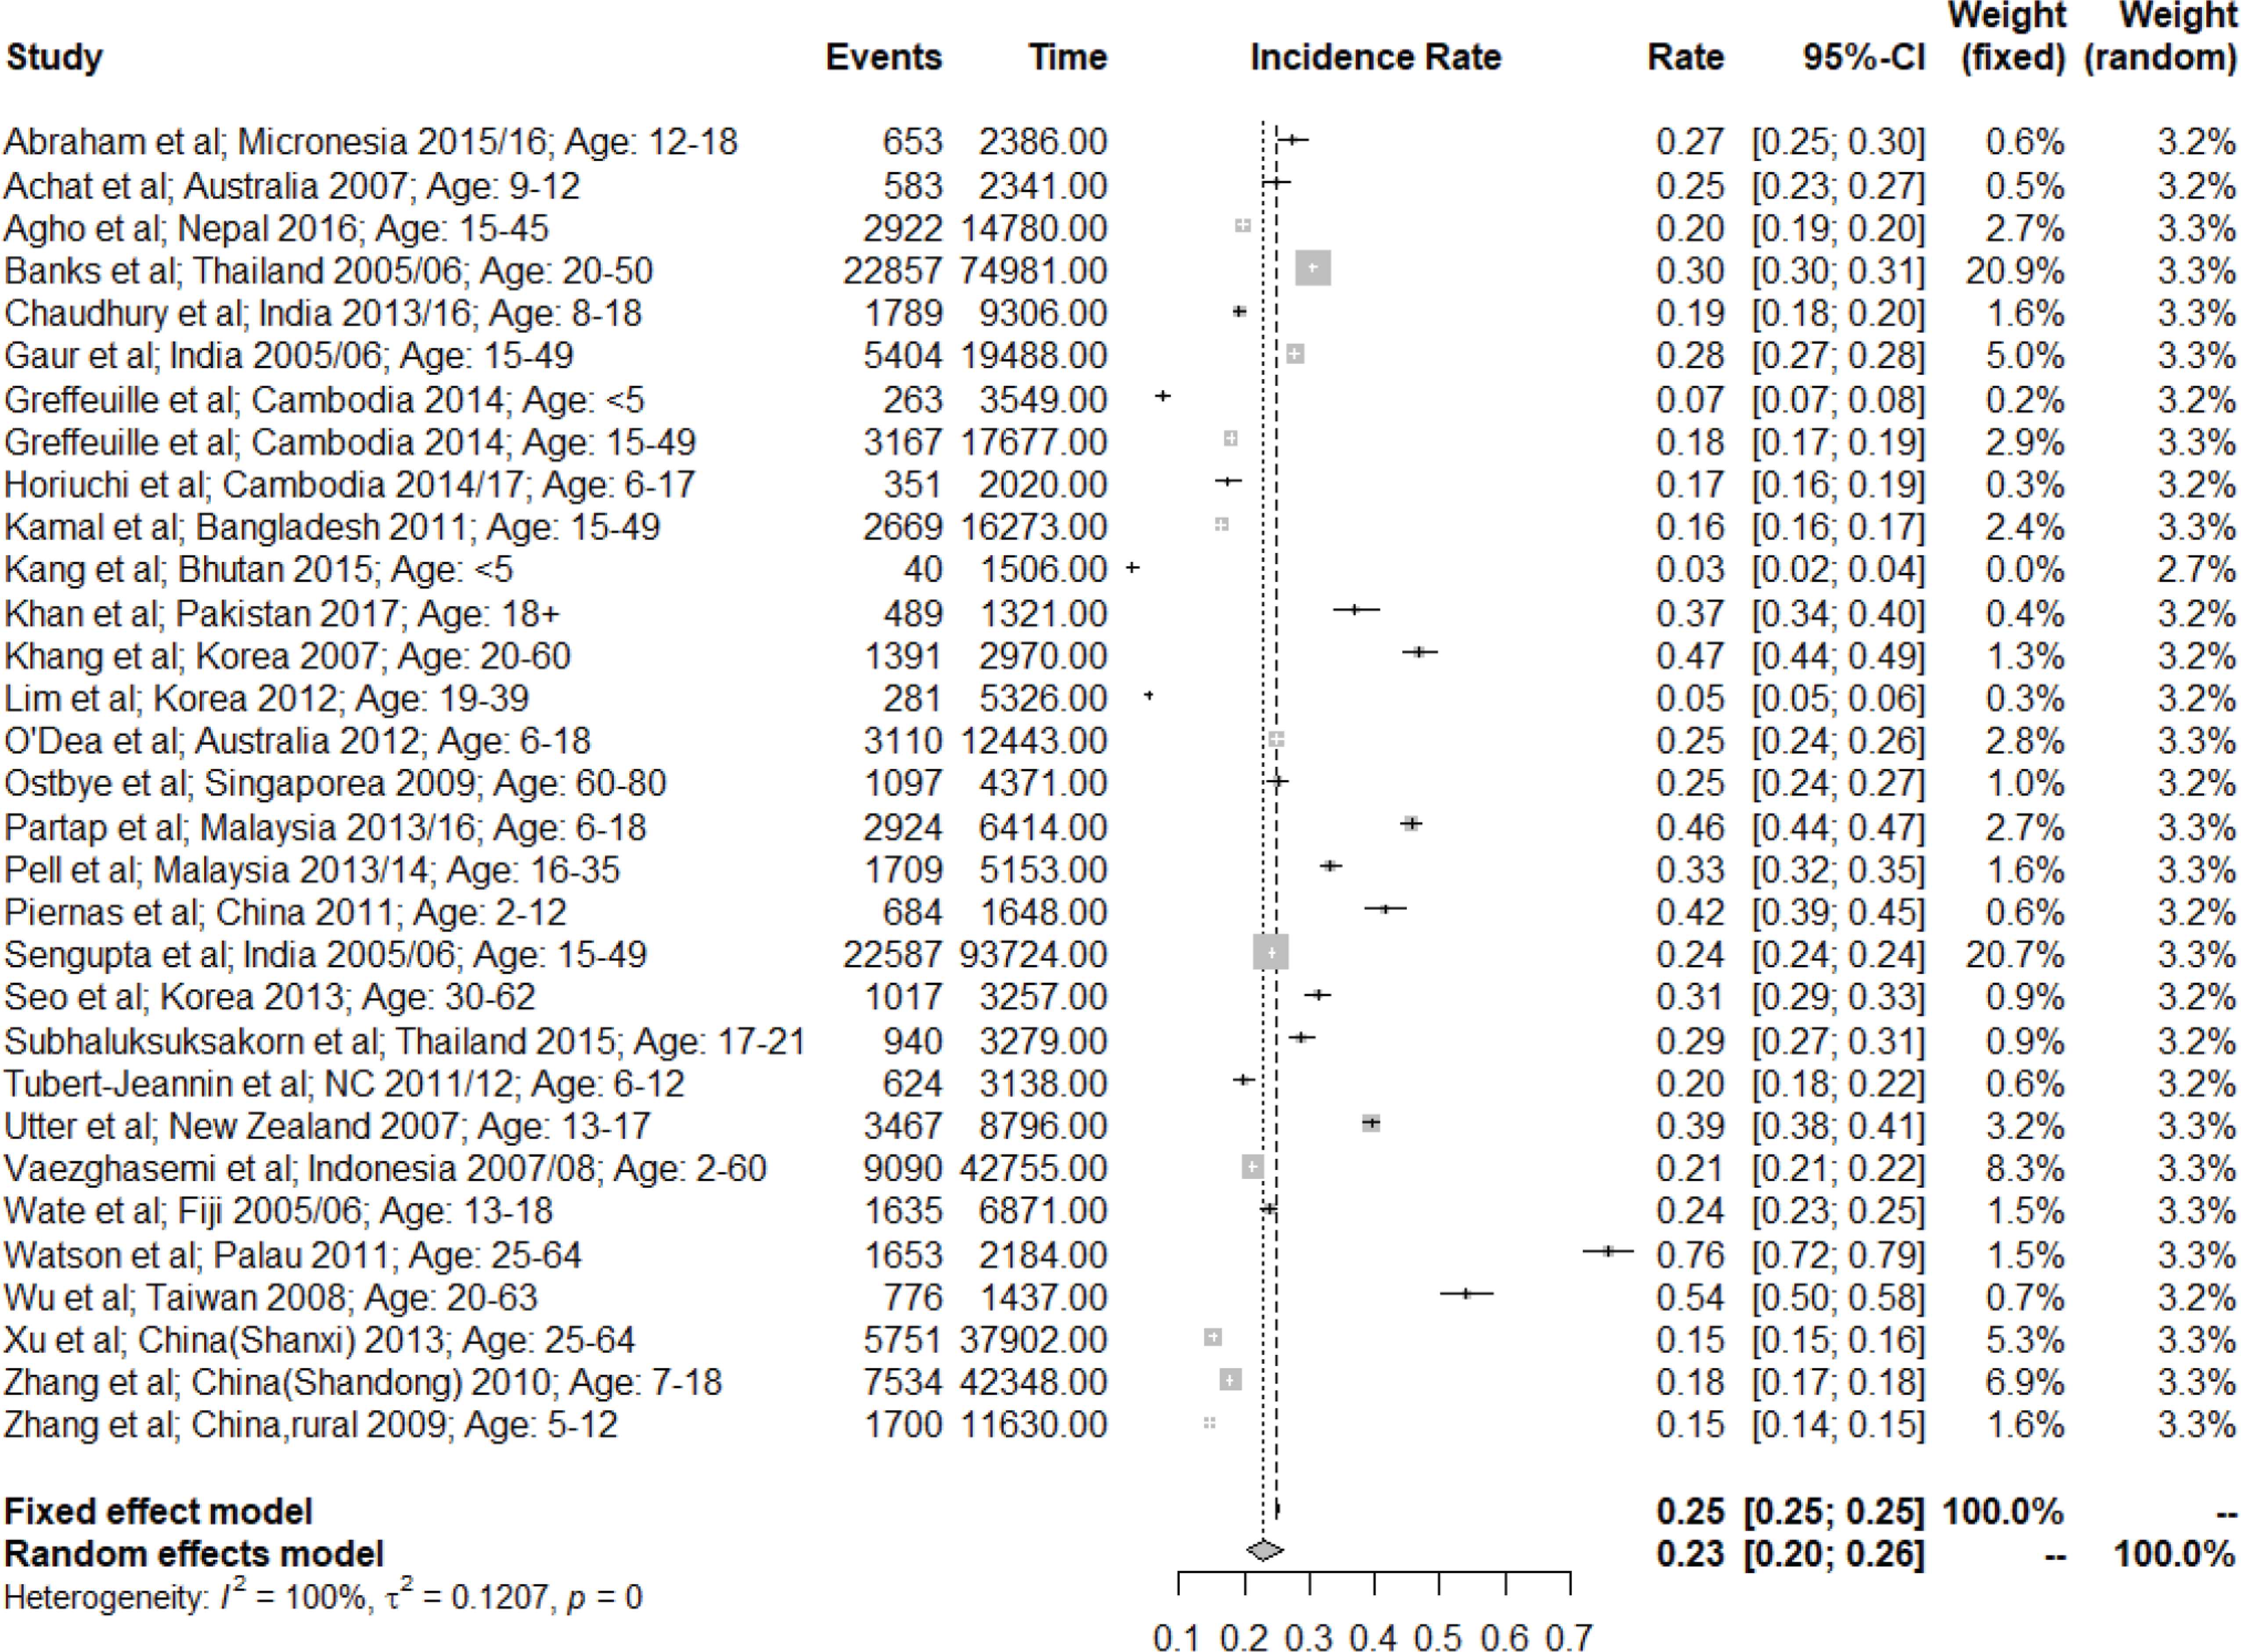
Overall overweight/obesity prevalence from pooled analysis. NC: New Caledonia; Events: Underweight (N); Time: Total (N); Dense dash line: Incidence rate from random model; Loose dash line: Incidence rate from fixed model.
| No. of studies | Total sample size | Undernutrition | I2(%) | Overweight/obesity | I2(%) | |||
|---|---|---|---|---|---|---|---|---|
| Prevalence (%) | 95% CI | Prevalence (%) | 95% CI | |||||
| 5–18 years old | ||||||||
| Female | 10 | 44,632 | 5.7 | 3.4–9.3 | 99.5 | 20.0 | 14.2–28.2 | 99.6 |
| Male | 9 | 42,869 | 6.3 | 2.9–14.0 | 99.8 | 25.9 | 20.2–33.1 | 99.3 |
| Mixed gender | 12 | 108,569 | 5.4 | 3.1–9.6 | 99.9 | 23.2 | 18.5–29.1 | 99.7 |
| 18+ years old | ||||||||
| Female | 6 | 42,486 | 8.4 | 6.9–10.2 | 96.6 | 22.4 | 13.3–37.9 | 99.8 |
| Male | 5 | 24,938 | 3.7 | 2.4–5.8 | 96.5 | 24.2 | 11.4–51.7 | 99.8 |
| Mixed gender | 9 | 133,749 | 6.7 | 5.2–8.7 | 99.3 | 28.8 | 20.4–40.8 | 99.8 |
| Area | ||||||||
| Asia | 24 | 423,115 | 13.5 | 11.1–16.5 | 99.9 | 21.2 | 18.6–24.2 | 99.7 |
| Oceania | 7 | 38,159 | 1.8 | 0.9–3.3 | 99.0 | 30.4 | 21.8–42.5 | 99.7 |
| Income | ||||||||
| L-MICs | 12 | 224,785 | 15.6 | 12.3–19.8 | 99.8 | 18.0 | 15.9–20.3 | 99.3 |
| U-MICs | 9 | 190,226 | 13.7 | 9.1–20.6 | 99.9 | 25.8 | 19.9–33.5 | 99.8 |
| HICs | 10 | 46,263 | 2.8 | 1.8–4.2 | 98.6 | 28.8 | 21.0–39.5 | 99.7 |
| Overall | 31 | 461,274 | 8.8 | 7.3–10.6 | 99.9 | 23.0 | 20.3–26.0 | 99.7 |
Results from random-effect model. All models were significant with p-value < 0.01. L-MICs, Low- and lower-middle-income countries, U-MICs, upper-middle-income countries, HICs, high-income countries.
The pooled prevalence of undernutrition and overweight/obesity in the Asia and Pacific region according to the population information from the included studies
Of young children less than 5 years old, there were only two studies reported findings from Cambodia and Bhutan and hence were not included in the subgroup pooled analysis. Subcategory pooled analyses indicated that the prevalence of undernutrition was higher than 3% among most categories except countries in Oceania (1.8%) or HICs (2.8%). In contrast, the prevalence of overnutrition was higher than 20% among all subcategories except L-MICs (18.0%). Reports from L-MICs (combined sex and age categories) had the highest prevalence of undernutrition (15.6%, 95% CI 12.3–19.8%), whereas Oceania countries reported the highest prevalence of overnutrition (30.4%, 95 CI 21.8–42.5%).
3.4. Overnutrition versus Undernutrition Ratio
Overall, the likelihood of being overnutrition was three times more than being undernourished in Asia-Pacific region (Table 3 and Figure S1). Oceania countries reported the highest likelihood of being overnutrition (odds ratio 27.1, 95% CI 10.8–67.9). Higher income countries reported larger overnutrition versus undernutrition ratio, while LMICs had similar chance of being overnutrition as well as undernutrition. Children and adolescents more than 5 years old were five times more likely being overnutrition than undernutrition, whereas among adults, the chance increased to 6.6 times.
| No. of studies | Overnutrition versus undernutrition | I2(%) | ||
|---|---|---|---|---|
| Odds ratio | 95% CI | |||
| 5–18 years old | ||||
| Female | 10 | 4.2 | 1.5–11.9 | 99.7 |
| Male | 9 | 4.7 | 1.2–18.12 | 99.9 |
| Mixed gender | 12 | 5.0 | 2.1–11.9 | 99.9 |
| 18+ years old | ||||
| Female | 6 | 4.3 | 2.1–9.0 | 99.6 |
| Male | 5 | 11.0 | 4.0–30.5 | 99.1 |
| Mixed gender | 9 | 6.6 | 4.1–10.6 | 99.6 |
| Area | ||||
| Asia | 24 | 1.7 | 1.3–2.4 | 99.9 |
| Oceania | 7 | 27.1 | 10.8–67.9 | 99.4 |
| Income | ||||
| L-MICs | 12 | 0.9^ | 0.9–0.9 | 99.7 |
| 12 | 1.1# | 0.8–1.5 | 99.7 | |
| U-MICs | 9 | 2.2 | 1.2–4.1 | 99.9 |
| HICs | 10 | 16.5 | 6.7–40.8 | 99.6 |
| Overall | 31 | 3.2 | 2.3–4.3 | 99.9 |
Results from random-effect model. All models were significant with p-value < 0.01, except L-MICs.
Results from fixed-effect model, p-value = 0.01.
Results from random-effect model, p-value > 0.05.
L-MICs, Low- and lower-middle-income countries; U-MICs, upper-middle-income countries; HICs, high-income countries.
Meta-analysis of subcategories of papers—overnutrition versus undernutrition ratio
4. DISCUSSION
Our systematic review summarized the scope of DBM in the Asia-Pacific region. It is observed that the DBM is prevalent among countries/areas in this region. The pooled prevalence of undernutrition was as high as 8.8% (95% CI 7.3–10.6%) while overnutrition among the same population reached 23.0% (95% CI 20.3–26.0%). In Oceania countries or HICs, low level of undernutrition to be less than 3% was reported, while all geographical and all income-level countries/areas and all age and sex subgroups reported pooled prevalence of overnutrition as more than 18%. Overall, all country groups and all age subgroups were more likely to experience a higher prevalence of overnutrition than undernutrition, except that L-MICs had similar chances for over- and undernutrition.
The findings of the review revealed coexistence of under- and overnutrition in Asia-Pacific region, with higher prevalence of overweight/obesity than that of underweight (Table 2). This common existence of DBM was in line with a previous investigation assessing the global DBM [9]. However, more overweight and obesity was shown in our study, compared to earlier findings that the majority of (55%) L-MICs had a lower prevalence of obesity than undernutrition [9]. This is reconciled by the inclusion of more recent publications in our analysis and the overall secular trends of increased overweight/obesity and decreased undernutrition worldwide.
According to the World Health Organization, worldwide overweight and obesity has nearly tripled since 1975, accounting for 39% of global adult population [13]. On the other hand, Food and Agriculture Organization (FAO) data also revealed an overall decrease in the prevalence of undernourishment globally, from 14.8% in 2000 to 10.9% in 2017 [14]. Min’s study also showed a 5.2 times increase of the obesity–undernutrition ratios using the year 2000 as the cutoff year [9]. Our findings suggested the secular trends of malnutrition in Asia-Pacific region followed the global pattern.
Regional differences have been shown in the magnitude of DBM. Countries/areas in the Oceania had a much higher overnutrition–undernutrition ratio than those in Asia (Table 3). In the Oceania region, the two most populated countries, that is, Australia and New Zealand, had a prevalence of undernourishment as low as below 2.5% even in the year 2000, while the prevalence for Southeast Asia was 21.9% [14], showing the much lower burden of undernutrition in this area. Regarding the burden from overnutrition in the Oceania, a systematic review on the global prevalence of overweight and obesity showed that Oceania pacific islands were revealed to have particularly high rates of overweight and obesity [3]. Consequently, a high over- and undernutrition ratio was revealed in the Oceania. Despite the general high over- and undernutrition ratio in the Pacific islands, the coexistence of under- and overnutrition was not rare in this region, which distinguishes them from the HICs with little burden of undernutrition [15]. For example, as reported by a previous study of adolescents in Fiji, the prevalence of combined overweight and obesity was 19.6% and 27.8% in boys and girls, while the prevalence of underweight was also as high as 11.4% and 5.4% in boys and girls, respectively [16]. Another study conducted in Pacific islands also suggested the dual burden of malnutrition [17].
The secular trend of undernutrition reduction and overweight/obesity increase in Asian countries [18,19], followed by rapid dietary and lifestyle transition, is leading the direction of dual burden toward overnutrition increase and diet-related NCDs, despite the present over- and undernutrition ratio in Asia is lower than that in Oceania. The simultaneous epidemiological transition from infectious diseases to the chronic disease, together with the nutrition transition, calls on more efforts on the policy initiatives and lifestyle changes [20]. In addition to the nutrition transition, other nutritional factors, for example, the nutrition status of the first 1000 days of life, and the nutrition status of adolescents and women at reproductive age [21], were also important determinants of the dual burden. The suboptimal nutritional status at these pivotal life events may originate from more societal and cultural rather than economic determinants [21] and further could generate a special pattern of dual burden—thin children and obese adults [22], which could be explained by the theory of developmental origins and health and disease [23]. Those thin children were also more likely to be overweight and obese when they enter adulthoods through epigenetic modification [24]. This dual burden of malnutrition at the household level [22,25], despite not included in this systematic review, needs to be intervened to break the vicious cycle through life course nutrition.
The role of economic development status on the scope of dual burden was suggested by the differences among HICs, U-MICs, and L-MICs in this study. The pooled prevalence of undernutrition monotonically decreased among country groups with increased income levels (L-MICs 15.6%, U-MICs 13.7%, and HICs 2.8%), while the pooled prevalence of overnutrition among groups was more similar (L-MICs 18.0%, U-MICs 25.8%, and HICs 28.8%), particularly between U-MICs and HICs. These results suggest the potential challenges in tackling the DBM in this region. Despite the largest hunger reduction occurred in the Asia-Pacific region over the years [26], the dramatically increased obesity is also alarming. Over the past decades, there has been no report on reducing the obesity prevalence. Evidence has shown a slowdown of obesity increase rate in some developed countries, which provided some hope for future challenges [3]. In contrast, the obesity rate is increasing in developing countries [27]. With the world’s largest population in the Asia-Pacific countries, the disease burden from obesity and related NCDs could be a serious public health challenge, which requires attentions from stakeholders.
This study also has limitations. First, it only included peer-reviewed literature, which reported both undernutrition and overweight/obesity that may have narrowed the scope of studies on population nutritional status. However, this restriction guarantees that numbers for both prevalences were comparable. Second, stratification by social economic determinants at individual level was not applied in the meta-analysis, since the variables indicating such factors were not consistent across studies (e.g., rural and urban, slum and non-slum, and education). In addition, the studies were conducted at different time points, which means that this meta-analysis was not a pure “cross-sectional” study at a time point, but a study across a certain time span. This limitation is unavoidable in the systematic review of prevalence studies [9].
In conclusion, DBM in the Asia-Pacific region is alarmingly high and is tilted toward obesity. The significant coexisting of both undernutrition and overweight/obesity suggests that future interventions/policy targeting to maintain a healthy population weight should not just focus on prevention and treatment toward one direction.
CONFLICTS OF INTEREST
The authors declare no conflicts of interest.
AUTHORS’ CONTRIBUTION
ZS, PW and JR initiated the concepts PW, YM, YH and BL collected and analyzed data. ZS conducted pooled analysis and meta-analysis tests. All authors were involved in writing the paper and had final approval of the submitted versions.
SUPPLEMENTARY MATERIALS
Supplementary data related to this article can be found at
Footnotes
Data availability statement: All codes and data for meta-analysis models and forest plots were uploaded online on GitHub opensource (https://github.com/sabrinaboasui/DoubleBurdenMalnutritionSR).
REFERENCES
Cite this article
TY  - JOUR
AU  - Wen Peng
AU  - Yuhan Mu
AU  - Yang Hu
AU  - Bin Li
AU  - Jayanthi Raman
AU  - Zhixian Sui
PY  - 2019
DA  - 2019/12/04
TI  - Double Burden of Malnutrition in the Asia-Pacific Region—A Systematic Review and Meta-analysis
JO  - Journal of Epidemiology and Global Health
SP  - 16
EP  - 27
VL  - 10
IS  - 1
SN  - 2210-6014
UR  - https://doi.org/10.2991/jegh.k.191117.002
DO  - 10.2991/jegh.k.191117.002
ID  - Peng2019
ER  -