
Predictors of Intentions to Make Healthier Eating Choices among Midwestern Truck Drivers
- DOI
- 10.2991/jegh.k.191029.001How to use a DOI?
- Keywords
- Theory of planned behavior; truck drivers; eating decisions; health behaviors
- Abstract
Truck drivers constitute a highly vulnerable population with very limited opportunities for healthy foods and healthy eating choices. This cross-sectional study assessed the utility of the Theory of Planned Behavior (TPB) in understanding and predicting healthy eating intention among Midwestern truck drivers in the United States. Participants were recruited through online trucker forums and advertisements at truck stops. Each participant completed an anonymous, web-based questionnaire that measured attitude, subjective norms, and perceived behavioral control. One hundred and forty-six truck drivers responded, with the average Body Mass Index (BMI) 32.7 and working as a truck driver for 10.3 years. Hierarchical multiple regression analysis assessed the predictive value of individual TPB constructs and the model. The predictive model containing the TPB constructs explained 18% of the variance in healthy eating intention, with attitude and subjective norm making significant and unique contributions. With the variance explained, the findings minimally supported the utility of TPB in understanding and predicting healthy eating intention among the truck drivers. These findings should be interpreted in view of the study limitations; the small sample size and being a self-report study. Notwithstanding, the findings highlight the importance of attitude and subjective norms in understanding and predicting healthy eating intention among Midwestern truck drivers in the United States.
- Copyright
- © 2019 Atlantis Press International B.V.
- Open Access
- This is an open access article distributed under the CC BY-NC 4.0 license (http://creativecommons.org/licenses/by-nc/4.0/).
1. INTRODUCTION
The prevalence of obesity was 39.8% and affected about 93.3 million of US adults in 2015–2016 [1]. In truck drivers, this proportion is significantly higher. In a nationwide survey, 69% of truck drivers are obese [2]. Long-haul truck drivers have a higher risk of becoming obese compared to adults in any other occupation in the US [3]. Common comorbidities of obesity are more prevalent in truck drivers than the general population [2]. These can include high blood pressure, high triglycerides, type 2 diabetes, osteoarthritis, sleep apnea, and early death [4]. In addition, greater lengths of employment in this industry increase their risk for developing obesity and a multitude of other comorbidities [2]. Life expectancy for truckers is 16 years less than the average population, and they are 11 times more likely to die on the job than the average worker [5].
A meta-analytical study of eight interventions aimed at improving truck drivers’ health reported that the majority of the study participants were Caucasian males, with mean ages between 38.4 and 48.4 years [6]. The American Trucking Association (ATA) reported the median age of truckers was 49 in 2016 [7]. The ATA further reported just 6% of US truck drivers were female in 2016 and 38.7% were minorities [7]. Two further studies reflected these demographic characteristics and added that most truck drivers are married [6,8].
The workplaces of truck drivers are obesogenic and offer few opportunities for physical activity [9]. The workforce of the US includes almost two million truck drivers [10]. Truck drivers tend to work irregular shifts, and are generally itinerant, often spending several nights each week away from home. Ninety percent of long-haul truckers spend 17 days or more on the road each month [8]. Truckers experience very limited opportunities for healthy food and healthy eating choices [9]. Furthermore, large-vehicle parking restrictions limit where drivers can shop for food [11]. Owing to these and other restrictions, such as food availability and work schedules, truck drivers normally buy food at rest stops, where there are many high-fat/high-calorie choices and not many fruit, vegetables, or whole grains [5,11]. Truckers tend to eat snacks while driving to maximize driving time in lieu of stopping for a meal [11]. Lifestyle changes including eating healthier can lead to a reduction in obesity. The consequences of not addressing obesity in this group can lead to higher health care costs, higher rates of comorbidities, lower overall health, lost wages, and earlier deaths. However, this occupational group has received limited attention in health research.
1.1. Theoretical Framework
The Theory of Planned Behavior (TPB) posits that intention is the best predictor of, and a direct antecedent to, the performance of health-related behaviors [12]. According to the TPB, intention to perform a behavior is informed by three constructs: the individuals’ attitude (A) toward performing the behavior; their Subjective Norms (SN) of the behavior—what the individual thinks people who are important to them believe about performing the behavior; and the individuals’ perceived behavioral control—the extent to which the individual believes they have control over their ability to perform the behavior [12]. Each construct is underpinned by the individuals’ beliefs: Attitude by behavioral beliefs, beliefs about outcomes from performing the behavior; subjective norms by normative beliefs, beliefs of important referent individuals about performing the behavior, weighted by the person’s motivation to comply with their referents; and perceived behavioral control by control beliefs, taking into account facilitators and barriers to performing the behavior [12,13].
The TPB has been shown to explain a large proportion of the variance in behavioral intention, and to predict different behaviors, including health behaviors [12]. However, some recent criticisms of the TPB allege that its utility may be limited in predicting behaviors. For instance, it is believed the TPB does not consider emotions as an influence for behaviors, assuming that all behaviors are rational [14]. Findings from studies testing TPB constructs have been used to develop effective behavior change interventions [12]. In addition, a meta-analysis of over 200 studies that utilized TPB showed the theory was effective in predicting those behaviors that were entirely under volitional control, especially eating behaviors [15].
Previous research using the TPB to predict eating behaviors has shown attitude as the most predictive construct, with perceived behavioral control as the second most influential construct [13,16–18]. Study findings that have utilized theoretical frameworks, such as social cognitive theory to predict fruit and vegetable consumption in Australian truck drivers have reported attitude and self-efficacy as significant predictors of dietary intentions and behaviors [19]. The TPB, when applied in other situations, such as in the prediction of HIV testing, also showed attitude as the best predictor of intention, with perceived behavioral control as the second most influential construct [14].
To the best of the authors’ knowledge, there is no study that has utilized the TPB in understanding and predicting healthy eating intention among American truck drivers. In studying American truck drivers, Whitfield-Jacobson noted truckers reported wanting more healthy options, yet tended to eat fewer than three servings of fruits or vegetables each day, with >10% not eating any servings [11]. It is currently unknown whether this disparity is due to lack of easy access to healthy foods, negative perceptions of healthy eating, or an absence of desire to eat healthier. This study assessed the utility of TPB in understanding and predicting healthy eating intention among Midwestern truck drivers. Other theoretical frameworks, such as social cognitive theory, theory of reasoned action, and health belief model, have been utilized to predict healthy eating behavior. The choice of the TPB was borne out of its utility to explain a large proportion of the variance in behavioral intention and to predict different behaviors, including health behaviors [12]. Further, the theory has been effective in predicting behaviors that were entirely under volitional control, especially eating behaviors.
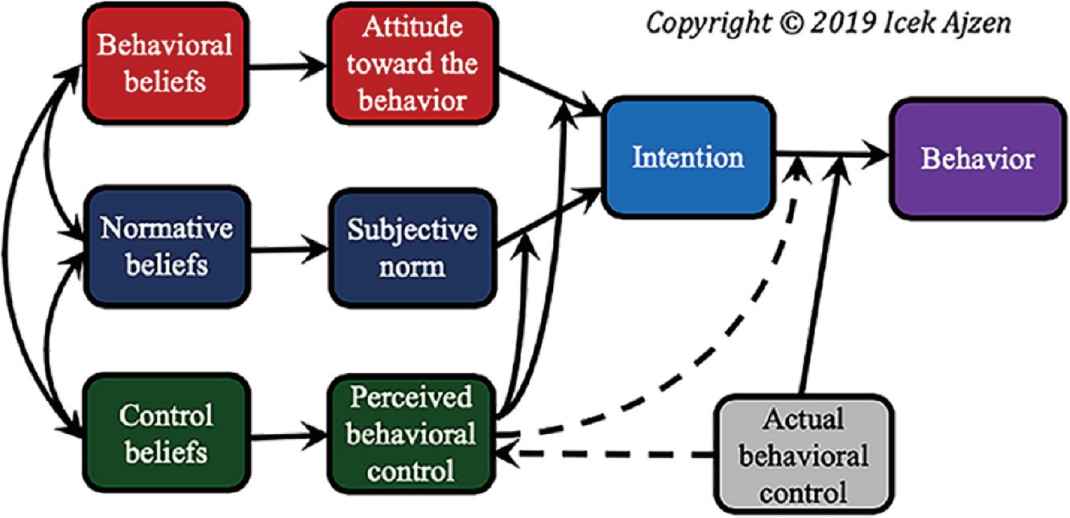
Schematic overview of theory of planned behavior. Source: https://people.umass.edu/aizen/tpb.diag.html.
2. MATERIALS AND METHODS
2.1. Study Design and Participants
This study was cross-sectional. Participants were aged 18 years or older, drove a truck as primary means of employment, and operated primarily in the Midwestern states of Illinois, Indiana, Iowa, Kansas, Michigan, Minnesota, Missouri, Nebraska, North Dakota, Ohio, South Dakota, and Wisconsin. This study used a structured quantitative online survey that assessed factors associated with healthy eating intentions of truck drivers. The survey also assessed the operating location (Midwestern or other areas) of the truck drivers. Drivers that do not drive mostly in the Midwest were excluded from the study. The survey was made available online through Qualtrics (Provo, UT and Seattle, WA, USA, 2017). Participants received $5 gift cards as incentives for completing the survey. The Institutional Review Board at Indiana State University approved this project. Participants signed informed consent electronically before beginning the survey.
2.2. Data Collection Procedures
Truckers were recruited online and offline. An advertisement and internet survey link were placed on online forums and pages truckers were likely to access. These included trucking-oriented forums (such as The Trucker’s Report and Trucking Forums), trucking-oriented Facebook groups (such as Freight Brokers & Truck Drivers and Truck Drivers USA), and trucking-oriented Reddit groups (such as Truckers and CB Radio). Participants were also recruited by posting advertisements at selected truck stops located on or near an interstate highway in Terre Haute, Indiana. The advertisement featured both a link to the survey and a QR code that directed the participant to the survey.
2.3. Instrumentation
The instrument used was created and validated by Vayro and Hamilton [13] following the steps for instrument construction and validation as listed by Epton et al. [20], which is similar to the recommendations for eliciting TPB-based beliefs [13]. However, 6-point Likert Scale was used for the measurement in order not to present the participants with a neutral or ambivalent answer choice.
2.4. Variables and Measurement
2.4.1. Demographics
The survey featured demographic questions (age, sex, height, weight, educational attainment, race/ethnicity, years employed as a truck driver, and operating locations).
2.4.2. Intention
It was measured by one question, “I intend to eat the recommended amount of fruits and vegetables each day”. The question was scored on a 6-point Likert scale from (1) Not at All to (6) Very Much, with higher scores indicative of greater intention to eat healthier.
Attitude, subjective norms, and perceived behavioral control were measured indirectly by asking groups of questions targeting the specific beliefs underlying each construct. The most commonly cited beliefs determined by Vayro and Hamilton were adopted as referents for the questions that assessed subjective norms [13].
2.4.3. Attitude
It was measured by eight questions. Examples include, “How likely is it that you would lose weight as a result of you make healthier food choices each day?”, “How likely is it that your energy levels would improve as a result of you making healthier food choices each day?”
2.4.4. Subjective norms
They were measured by seven questions. Examples include “How likely is it that your employer believes you should make healthier food choices each day?”, “How likely is it that your parents believe you should make healthier food choices each day?”
2.4.5. Perceived behavioral control
It was measured by eight questions. Examples include “How likely is it that a lack of time or the cost of food would prevent you from making healthier food choices each day?” Each of these questions were rated using a Likert scale from (1) extremely unlikely to (6) extremely likely. The products of each construct were added together to create a composite score.
2.5. Statistical Analysis
The study data were analyzed using the Statistical Package for Social Sciences (SPSS version 24, Inc. Chicago, IL, USA). Descriptive statistics were calculated to characterize the study population. The target sample size is 392, based on a population size >25,000, with a confidence interval at 5% and confidence interval at 95%, and a proportion of 0.05. Hierarchical multiple regression analysis was conducted to predict healthy eating intention from the TPB constructs (attitude, subjective norms, and perceived behavioral control).
3. RESULTS
3.1. Characteristics of Study Participants and Statistics for Cognitive Variables
Study participants ranged in age from 18 to 68 years. More than 84% of respondents were overweight or obese, where obesity is defined BMI ≥30, and overweight is defined as BMI between 25 and 30. The range for BMI was 18.01–70.14 with a mean of 32.7. The sample population spent an average of 19.5 nights on the road each month. Table 1 shows the characteristics of the study population.
| Variables | Frequency (N) | Percentage (%) | |
| Gender | |||
| Male | 101 | 76.5 | |
| Female | 31 | 23.5 | |
| Ethnicity | |||
| White/Caucasian | 119 | 90.2 | |
| Black/African American | 4 | 3.0 | |
| American Indian/Alaska Native | 5 | 3.8 | |
| Asian | 1 | 0.8 | |
| Native Hawaiian/Pacific Islander | 1 | 0.8 | |
| Other | 2 | 1.5 | |
| Education level | |||
| High school degree | 36 | 27.7 | |
| Trade certificate | 18 | 13.8 | |
| Some college | 43 | 33.1 | |
| 2-Year degree | 12 | 9.2 | |
| 4-Year degree or higher | 21 | 16.2 | |
| BMI class | |||
| Underweight | 2 | 1.5 | |
| Normal | 18 | 13.8 | |
| Overweight | 43 | 33.1 | |
| Obese | 67 | 51.5 | |
| N | Mean | Standard error | |
| Age | 132 | 41.5 | 1.05 |
| BMI | 130 | 32.7 | 0.76 |
| Number of years working as a truck driver | 131 | 10.3 | 0.94 |
| Average number of nights on road per month | 135 | 19.5 | 0.81 |
Characteristics of the study participants
Table 2 presents the descriptive statistics for the TPB constructs. Participants demonstrated favorable attitude toward healthy eating intention as depicted in the mean score. Similarly, the mean scores for subjective norms and perceived behavioral control are relatively high. Indicating that participants’ perception of their ability to eat healthier and the influence of significant others on their eating decisions are very strong. The Cronbach’s alpha scores for attitude (Cronbach’s α = 0.72), subjective norms (Cronbach’s α = 0.85), and perceived behavioral control (Cronbach’s α = 0.82) are also presented in Table 2. Thus, the analysis demonstrated that the combined measures used in this study exhibit relatively high reliability.
| Constructs | Number of items (N) | Range | Mean | Standard error | Cronbach’s α | |
|---|---|---|---|---|---|---|
| Minimum | Maximum | |||||
| Attitude | 8 (123) | 12 | 48 | 42.64 | 1.09 | 0.72 |
| Subjective norms | 7 (102) | 7 | 42 | 29.94 | 0.81 | 0.85 |
| Perceived behavioral control | 8 (144) | 8 | 48 | 37.03 | 0.69 | 0.82 |
Note: Not all participants provided answers to each question, leading to disparate sample sizes.
Descriptive statistics and Cronbach’s α score for the composite scores for TPB constructs
3.2. Correlations between Behavioral Intention, TPB Constructs and Other Key Variables
Table 3 shows the correlation between healthy eating intention, TPB constructs, and other key variables. The behavioral intention was significantly associated with attitude (r = 0.39), subjective norms (r = 0.38), perceived behavioral control (r = 0.23), BMI (r = 0.20), and number of nights spent on the road (r = 0.22).
| I | Age | BMI | A | SN | PBC | NN | Sex | |
|---|---|---|---|---|---|---|---|---|
| I | 1.0 | 0.12 | 0.20* | 0.39* | 0.38* | 0.23* | 0.22* | 0.14 |
| Age | 1.0 | 0.05 | 0.07 | −0.06 | −0.08 | 0.03 | 0.08 | |
| BMI | 1.0 | 0.05 | 0.34* | 0.17 | 0.21* | 0.09 | ||
| A | 1.0 | 0.28* | 0.47* | 0.15 | 0.15 | |||
| SN | 1.0 | 0.15 | 0.14 | 0.09 | ||||
| PBC | 1.0 | 0.15 | 0.16 | |||||
| NN | 1.0 | 0.15 | ||||||
| Sex | 1.0 |
Significant at 0.05. I, intention; A, attitude; SN, subjective norms; PBC, perceived behavioral control; NN, number of nights spent on the road/away from home.
Correlation matrix between key variables
3.3. Prediction of Healthy Eating Intention from TPB Constructs
Table 4 presents the results of the hierarchical multiple regression analysis. The demographic variables (BMI and number of nights on the road) significantly associated with intention were added in the first step accounting for 5% of the explained variance in intention. Attitude and subjective norms were added in the second step, accounting for 18% of the explained variance. Addition of perceived behavioral control in the last step did not increase the explained variance. In the final regression model, healthy eating intention was significantly predicted by attitude (β = 0.30) and subjective norms (β = 0.27).
| Variables | Model 1 | Model 2 | Model 3 | ||||||
|---|---|---|---|---|---|---|---|---|---|
| B | SEB | β | B | SEB | β | B | SEB | β | |
| BMI | 0.02 | 0.01 | 0.12 | 0.01 | 0.01 | 0.03 | 0.00 | 0.01 | 0.02 |
| NN | 0.03 | 0.02 | 0.22* | 0.02 | 0.01 | 0.15 | 0.02 | 0.01 | 0.15 |
| A | 0.06 | 0.02 | 0.31* | 0.06 | 0.02 | 0.30* | |||
| SN | 0.04 | 0.02 | 0.27* | 0.04 | 0.02 | 0.27* | |||
| PBC | 0.01 | 0.02 | 0.04 | ||||||
| R2 | 0.05 | 0.23 | 0.23 | ||||||
| F for change in R2 | 3.47* | 12.2* | 0.16 | ||||||
P < 0.05. SN, subjective norms; PBC, perceived behavioral control; NN, number of nights spent on the road/away from home; B, Beta; SEB, Standard Error of Beta.
Summary of hierarchical regression analysis for variables predicting healthy eating intention (N = 94)
4. DISCUSSION
The population of Midwestern truck drivers sampled in this study was demographically similar to those described in other studies [5,6,11,21,22]. In this study, the mean age was 41.5 years. A previous systematic review reported mean age range between 38.4 and 48.4 years [6]. The study results revealed high prevalence (84.6%) of overweight and obesity in the study population. This finding compares favorably with previous studies that have reported high prevalence (between 83.4 and 89.1% in their study populations) [5,11,21,23]. This result supports the need for intervention programs aimed at reducing the prevalence of overweight/obesity among truck drivers.
The TPB constructs minimally (18%) explained the variance in healthy eating intention among Midwestern truck drivers. This is in contrast to a similar study that reported a relatively higher (32%) explained variance among Australian truck drivers [13]. Further, in a meta-analysis study that assessed the utility of TPB in predicting healthy eating behavior, the results showed TPB predicted 44.3% in healthy eating intention [15]. However, none of the studies had truck drivers as their study population.
Individually, attitude, subjective norms, and perceived behavioral control were all significant predictors of truck drivers’ healthy eating intentions. Attitude was the most influential construct in healthy eating intention of the truck drivers followed by subjective norms. This result is similar to other studies that predicted healthy eating intention [13,15–18]. This result indicates that the idea of personal benefit is a stronger motivation to eat healthier than what others may think of them for eating healthier or changes to their environments that would be more conducive to healthier eating. This is in contrast to previous studies, which found perceived behavioral control to be more important than subjective norms [13,16–18].
In the final model, subjective norm was a significant predictor. The approval of their wives/partners or doctors was the most important normative influence on healthy eating intention of the truck drivers. This observation compares favorably with the findings of Vayro et al. [13]. The average scores for wives’/partners’ and doctors’ approval were 4.73 and 5.25, respectively (Table 5), indicating that future interventions should consider the involvement of these important referent individuals in developing intervention programs aimed at improving healthy eating among truck drivers.
| Mean (SEM) | N | Range | ||
|---|---|---|---|---|
| Minimum | Maximum | |||
| Wife/partner | 4.73 (0.14) | 113 | 1 | 6 |
| Parents | 4.24 (0.17) | 111 | 1 | 6 |
| Children | 3.82 (0.17) | 112 | 1 | 6 |
| Other family members | 4.09 (0.15) | 111 | 1 | 6 |
| Friends | 3.99 (0.15) | 115 | 1 | 6 |
| Doctor | 5.25 (0.11) | 118 | 1 | 6 |
| Employer | 4.16 (0.15) | 116 | 1 | 6 |
Note: Not all participants gave responses for each referent group.
Mean scores and standard error of the mean (SEM) for normative referents
4.1. Limitations
Like any other empirical research, this study is limited. First, the study was cross-sectional. Consequently, the actual behavior was not assessed. Second, the sample size was relatively small like other studies conducted among truck drivers. Therefore, the study findings cannot be generalized to truck drivers operating in the US. Third, the study also relied on self-reported heights and weights to determine BMI. Researchers were unable to ascertain if heights and weights were truthfully reported. These limitations must be considered in interpreting the findings of this study.
5. CONCLUSION
This study findings minimally supported the utility of TPB in understanding and predicting healthy eating intention among the truck drivers. The low variance explained in this study could be associated with the construct measurements and relatively small sample size. However, this study can be strengthened by increasing the sample size and by improving the construct measurements. Overall, the findings provide formative research to inform future interventions aimed at improving healthy eating among truck drivers.
CONFLICTS OF INTEREST
The authors declare they have no conflicts financial, professional, or personal interests that might have influenced the performance or presentation of the work described in this manuscript.
AUTHOR CONTRIBUTIONS
W-J.J.Y., O.A. and A.M.C. conceptualized the study, and contributed in data curation and methodology. W-J.J.Y. and A.M.C. contributed in funding acquisition. W-J.J.Y. and O.A. contributed in project administration and supervision. W-J.J.Y., O.A. and A.M.C. were responsible for writing (original draft) the manuscript. W-J.J.Y. and O.A. edited and reviewed the manuscript.
FUNDING
This study was funded by the
Footnotes
REFERENCES
Cite this article
TY  - JOUR
AU  - Wan-Ju Jennifer Yen
AU  - Olabode Ayodele
AU  - Adrienne McCarthy
PY  - 2019
DA  - 2019/11/08
TI  - Predictors of Intentions to Make Healthier Eating Choices among Midwestern Truck Drivers
JO  - Journal of Epidemiology and Global Health
SP  - 309
EP  - 314
VL  - 9
IS  - 4
SN  - 2210-6014
UR  - https://doi.org/10.2991/jegh.k.191029.001
DO  - 10.2991/jegh.k.191029.001
ID  - Yen2019
ER  -