
Analyzing seasonality of tuberculosis across Indian states and union territories
- DOI
- 10.1016/j.jegh.2015.02.004How to use a DOI?
- Keywords
- Tuberculosis; Seasonality; Poisson regression; Smear positive cases; Temperature
- Abstract
A significant seasonal variation in tuberculosis (TB) is observed in north India during 2006–2011, particularly in states like Himachal Pradesh, Haryana and Rajasthan. To quantify the seasonal variation, we measure average amplitude (peak to trough distance) across seasons in smear positive cases of TB and observe that it is maximum for Himachal Pradesh (40.01%) and minimum for Maharashtra (3.87%). In north India, smear positive cases peak in second quarter (April–June) and reach a trough in fourth quarter (October–December), however low seasonal variation is observed in southern region of the country. The significant correlations as 0.64 (p-value < 0.001), 0.54 (p-value < 0.01) and 0.42 (p-value < 0.05) are observed between minimum temperature and seasonality of TB at lag-1 in north, central and northeast India respectively. However, in south India, this correlation is not significant.
- Copyright
- © 2015 Ministry of Health, Saudi Arabia. Published by Elsevier Ltd.
- Open Access
- This is an open access article under the CC BY-NC-ND license (http://creativecommons.org/licenses/by-nc-nd/4.0/).
1. Introduction
India accounts for 26% of global cases of TB incidences. In 2012, 2.2 million TB cases were estimated in India [1]. Besides the full implementation of Revised National Tuberculosis Program (RNTCP) in 2006, TB still continues to be a leading cause of mortality and economic burden. High prevalence of HIV/AIDS, poverty, diabetes, malnutrition, poor ventilation, lack of awareness and education are some major causes for the vulnerable situation of TB in India.
Seasonal variation in any disease is defined as periodic occurrence in the reported cases with calendar time. TB, in general, is not known as having seasonal patterns like cholera, malaria, measles, chickenpox, rotavirus and diphtheria. However, various studies exhibit the seasonal behavior of TB in different regions of the globe [2,3]. Schaaf et al. [4] analyzed the seasonality of TB in South Africa during the period from 1983 to 1993 and observed high TB incidence in late winter to early spring. Studies conducted in UK, Hong Kong, Spain and Japan identified summer as peak season of TB notification [5–8]. Mabaera et al. [9] assessed the seasonality of tuberculosis of four countries, namely, Moldova, Mongolia, Uganda and Zimbabwe for the period 1999–2003. Akhtar et al. [10] reported that TB detection peaked in spring season among migrant workers in Kuwait during the period 1997–2006. Cao et al. [11] observed the seasonal pattern in TB data of China for the period 2005–2011 and reported that TB incidence was highest in March–June and lowest in January–February. Li et al. [12] reported the peak to be winter and trough to be autumn season in TB data of China for the period 2005–2012. Willis et al. [13] studied the seasonality of TB of US data for the period 1993–2008.
In the context of India, Thorpe et al. [14] assessed the seasonal patterns in TB for the period 1996–2001 and reported that the behavior of TB is seasonal in northern region of the country with peak occurring in second quarter and trough in fourth quarter of the year; however seasonality was not observed in south India. Recently, Kumar et al. [15] observed a seasonal pattern and declining trend in the TB data of Delhi for the period 2007–2012.
There are several techniques to assess the seasonality in epidemiological data. Liu et al. [16] and Bowong et al. [17] studied the seasonal behavior of TB data with the help of a deterministic model, by taking transmission coefficient of TB as a sinusoidal function. Li et al. [12] and Kumar et al. [15] performed time series analysis to exhibit the seasonal pattern in TB data of China. Cao et al. [11] used a hybrid model, a combination of SARIMA and generalized regression neural network model to examine the seasonality in TB data of China. Christiansen et al. [18] described three widely used techniques to analyze the seasonal effects in the epidemiological data, namely comparison of discrete time periods, geometrical models and generalized linear models (GLMs). Out of these three techniques, GLMs are a class of statistical models that allows studying the seasonality efficiently because of their capability of fitting the data to different underlying mathematical functions [19]. In general, log linear Poisson regression model serves the purpose of underlying function [20]. Christensen et al. demonstrated through simulations that Poisson regression models provide more accurate estimation of seasonal variation as compared to geometrical models [21]. We, therefore, employ Poisson regression model to estimate the seasonal amplitude in TB data of India.
2. Method
To estimate seasonal amplitude, we use a generalized linear model with a log link function and Poisson distribution. Poisson regression model is a standard approach to model arrivals in queue. Our data represent the number of incidents of an event over a fixed period of time. We, therefore, use Poisson regression to model the observed data.
We have quarterly data of TB smear positive reported cases represented by nt, t = 1,2,3, . . . , 24 with each nt corresponding to quarter t has a Poisson distribution with parameter λt.
A Poisson mean denotes the non negative expected count and for this purpose a log-link function is used. To estimate the seasonality in data, we model log of mean of observed data as a sinusoidal function [20]. The Eq. (1) will become
θt is the frequency parameter and
Define α as,
The peak to trough difference can be defined as a measure of seasonal variation, which exhibits a comparison between the highest and the lowest value, given as following
So from Eqs. (4) and (5), we can estimate peak to trough distance as given below
3. Data
In RNTCP, notification data of TB is received in the form of monthly reports at sub-district level and quarterly reports from sub-district level to district/state level. Paper based reports are used up to district level and from district level, data are transferred electronically to state and center level. We use quarterly reported data of 34 Indian states and union territories (UT’s) published by Central TB Division, Directorate General of Health Services, Ministry of Health and Family Welfare, Government of India during the period 2006–2011 [22]. Data contains annualized total case detection rate of smear positive, smear negative and extra pulmonary cases. A TB infected individual who can transmit the infection is said to be smear positive. A patient of TB in other than lungs is said to be an extra pulmonary case of TB. Data of temperature is obtained from the website http://www.wunderground.com/ [23].
4. Results and Discussion
According to RNTCP report, the annualized total case detection rate includes smear positive, new sputum smear positive, new smear negative, new extra-pulmonary and smear positive retreatment cases. The annual total case detection rate for the period 2006–2011 is found to be 288 per 100,000 populations in Delhi as compared to 117 per 100,000 populations in Karnataka. In Delhi, a significant variation in annualized total case detection rate is observed with consistent peak in second quarter and trough in fourth quarter, however no such pattern is observed in Karnataka as shown in Fig. 1 .
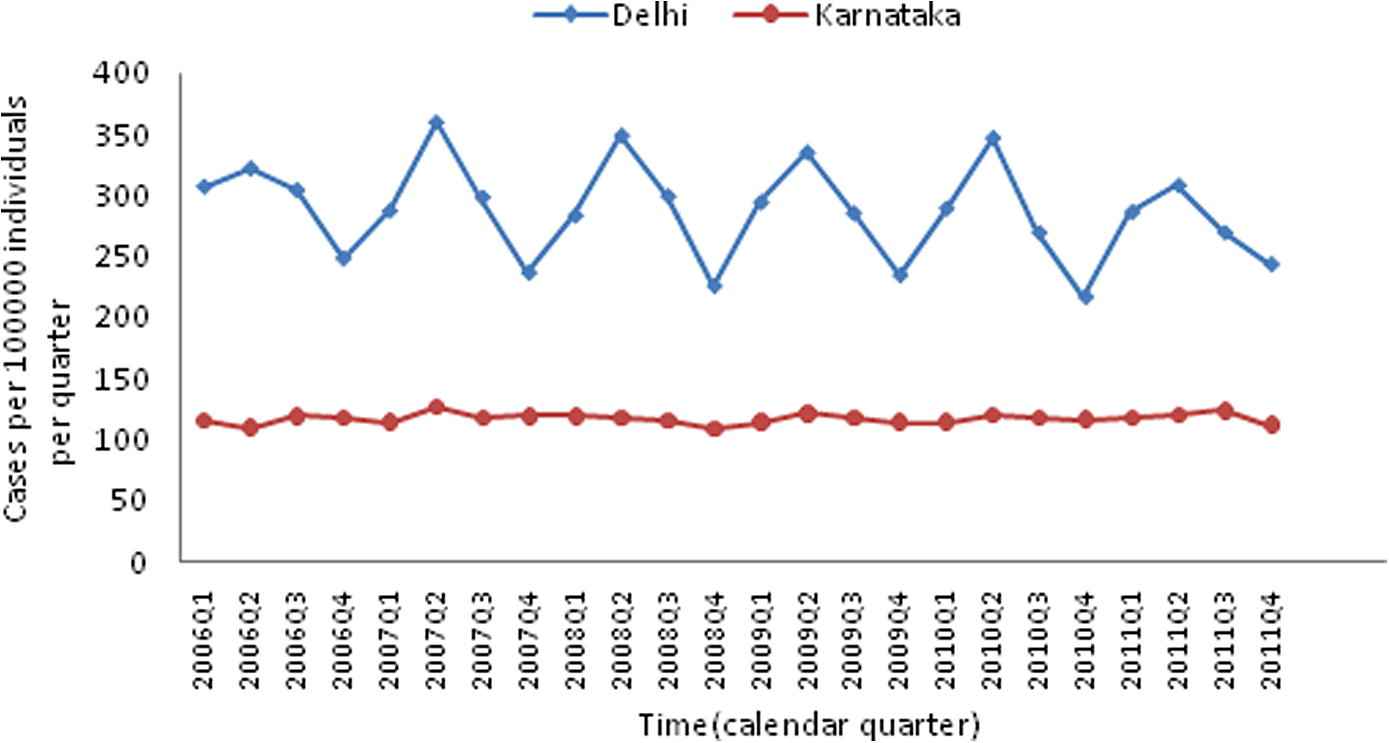
Annualized total case detection rate of tuberculosis of Delhi (Northern State) and Karnataka (Southern State), 2006–2011.
The quarterly averaged annualized total case detection rate is observed to be higher in northern region of the country as compared to the southern region during 2006–2011 as shown in Table 1 . Although case detection rate of TB is relatively lower in southern states; this region contributes significantly in national incidence of tuberculosis. It was reported that children of north India are at a higher risk as compared to south India [24]. A survey shows that nearly 50% TB cases reported to private sector were missed by notification system [25]. Treatment in private sector may be one of the reasons of low detection rate of TB in south India. These findings support the high detection rate of TB in north India. The time period from primary infection to detectable TB may be 3–4 months [26]. Delay in diagnosis of TB increases the risk of transmission. In north India, due to low temperature in winter this delay is caused, which seems a plausible reason for large number of TB cases reported in second quarter.
| Northern states | Annual total case detection rate per 1,00,000 | Southern states | Annual total case detection rate per 1,00,000 |
|---|---|---|---|
| Arunachal Pradesh | 205 | Andhra Pradesh | 136 |
| Chandigarh | 221 | Goa | 124 |
| Delhi | 288 | Karnataka | 117 |
| Himachal Pradesh | 207 | Kerala | 75 |
| Meghalaya | 182 | Maharashtra | 128 |
| Mizoram | 233 | Orissa | 123 |
| Sikkim | 269 | Tamil Nadu | 126 |
Annual case detection rate in northern and southern Indian states during 2006–2011.
We also analyze the number of suspects examined per 100,000 populations per quarter during 2006–2011. The number of suspects in Delhi is found to be higher as compared to Karnataka, however no quarterly variation is observed in Delhi and Karnataka as shown in Fig. 2. This implies, seasonality is not due to patients examined, but is derived due to other factors [14].
4.1. Seasonality of tuberculosis
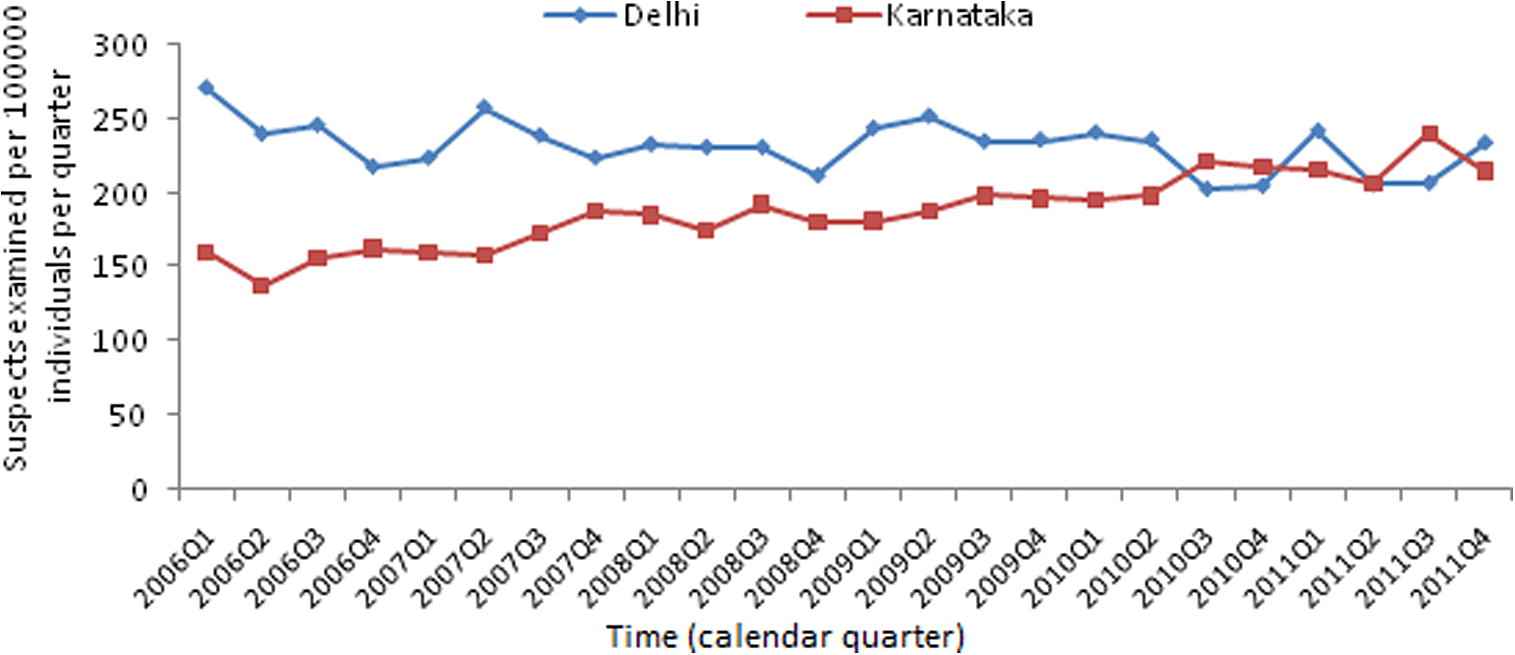
Suspects examined per 100,000 populations for two Indian states, Delhi (northern state) and Karnataka (southern state).
The similar kind of seasonal variation is observed in smear positive cases in northern and southern region of India. To quantify the seasonality shown in Fig. 1, we implement Poisson regression model in R version 2.15.2 [27] by using Peak2Trough package [28]. We calculate amplitude of seasonal variation with 95% confidence interval in number of smear positive cases of TB reported quarterly for the period 2006–2011. The results are listed in Table 2 .
| S. No. | States & UT’s | Seasonal Amplitude (in %) | 95% CI |
|---|---|---|---|
| 1. | Andaman & Nicobar | 8.73 | 2.31–19.20 |
| 3. | Arunachal Pradesh | 29.74 | 28.47–37.48 |
| 4. | Assam | 28.66 | 20.95–31.24 |
| 5. | Bihar | 18.65 | 8.62–28.60 |
| 6. | Chandigarh | 31.15 | 23.39–39.77 |
| 7. | Chhattisgarh | 17.14 | 12.69–20.47 |
| 8. | D & N Haveli | 10.16 | 4.59–19.70 |
| 9. | Daman & Diu | 25.07 | 13.95–34.75 |
| 10. | Delhi | 30.13 | 14.22–34.75 |
| 11. | Goa | 8.56 | 6.72–12.14 |
| 12. | Gujarat | 17.27 | 12.69–20.99 |
| 13. | Haryana | 39.40 | 20.89–41.17 |
| 14. | Himachal Pradesh | 40.01 | 39.11–42.02 |
| 15. | Jammu & Kashmir | 20.32 | 2.46–31.26 |
| 16. | Jharkhand | 21.45 | 16.33–25.37 |
| 17. | Karnataka | 7.63 | 1.56–11.47 |
| 18. | Kerala | 9.41 | 4.86–14.35 |
| 19. | Madhya Pradesh | 24.80 | 19.38–30.73 |
| 20. | Maharashtra | 3.87 | 0.84–5.82 |
| 21. | Manipur | 34.71 | 26.21–39.26 |
| 22. | Meghalaya | 23.01 | 16.54–30.67 |
| 23. | Mizoram | 20.80 | 12.75–36.42 |
| 24. | Nagaland | 22.96 | 10.72–35.71 |
| 25. | Orissa | 18.65 | 14.04–21.08 |
| 26. | Pondicherry | 9.31 | 2.60–21.85 |
| 27. | Punjab | 33.40 | 26.91–35.85 |
| 28. | Rajasthan | 38.68 | 27.57–40.86 |
| 29. | Sikkim | 33.48 | 27.98–41.82 |
| 30. | Tamil Nadu | 10.99 | 8.85–12.18 |
| 31. | Tripura | 15.46 | 11.79–20.75 |
| 32. | Uttar Pradesh | 22.52 | 17.31–28.57 |
| 33. | Uttaranchal | 38.17 | 34.83–42.59 |
| 34. | West Bengal | 23.77 | 20.02–25.61 |
Amplitude of seasonal variation in quarterly reported smear positive cases of TB in Indian states (2006–2011).
In northern region of India, significant seasonal variation is observed in number of smear positive cases. The highest peak to trough distance is found to be 40.01% (95% CI 39.11–42.02) in Himachal Pradesh. In Haryana and Rajasthan peak to trough distance in smear positive TB cases is observed to be 39.4% (20.89–41.17) and 38.68% (27.57–40.86) respectively. Lowest peak to trough distance is found to be 3.87% (0.84–5.82) in Maharashtra. In Andhra Pradesh and Karnataka peak to trough distance is observed to be 5.84% (1.10–9.50) and 7.63% (1.56%–11.47%). The Lakshadweep is not included due to the lack of data. The plots of exponential linear predictor are shown for Himachal Pradesh and Maharashtra in Fig. 3(a) and Fig. 3(b) respectively.
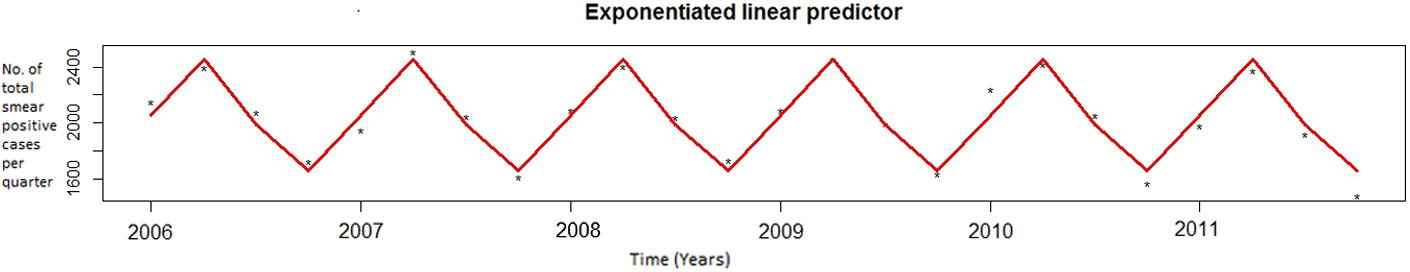
(a) Fitted model for quarterly reported TB data of Himachal Pradesh.
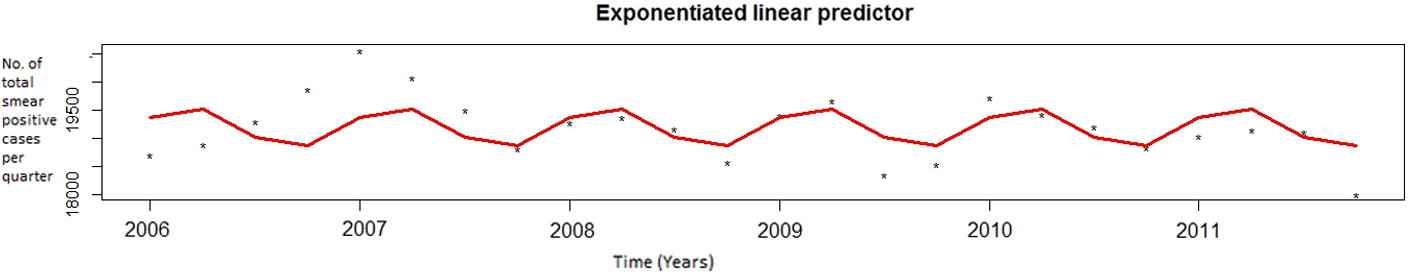
(b) Fitted model for quarterly reported TB data of Maharashtra.
Highest seasonal variation is observed among the north and north east region of the country, whereas very low seasonality is seen in south India and coastal region of the country. Central India exhibits a moderate seasonality as shown in Fig. 4. The amplitude of seasonality on regional basis is shown in Fig. 5. The bar plot exhibits the highest seasonal amplitude in northern region whereas lowest in southern region.
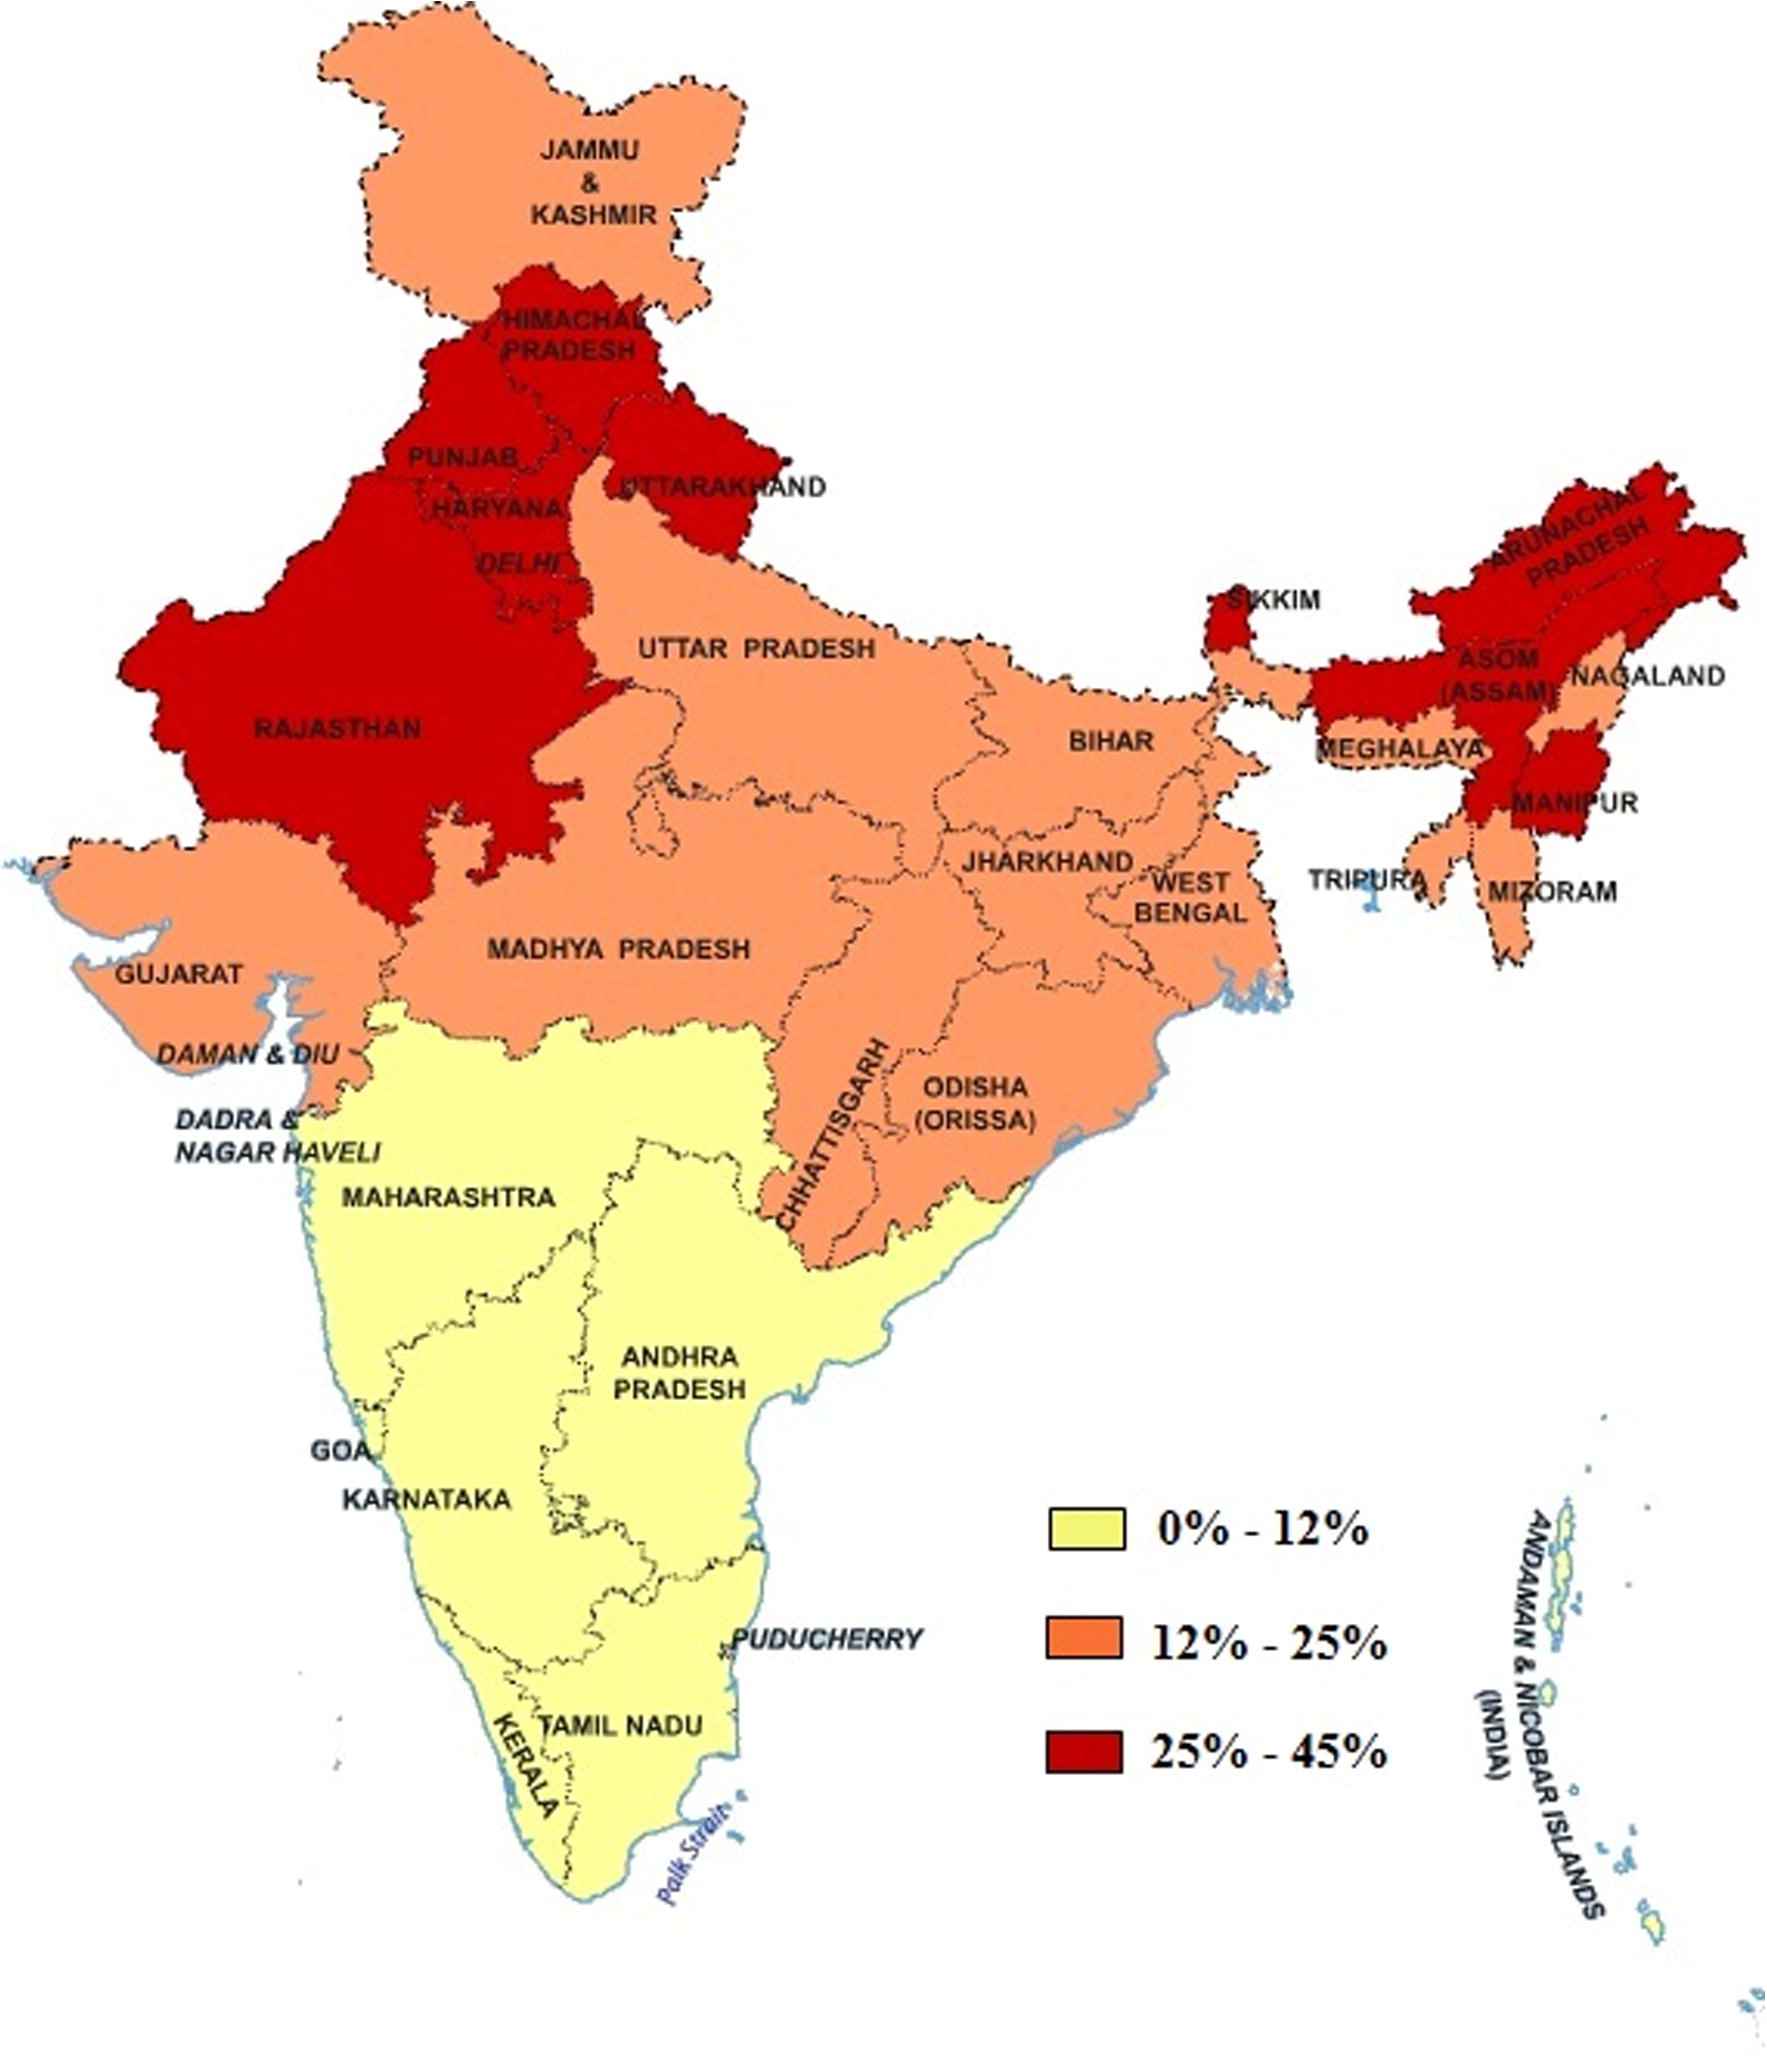
Seasonal amplitude in quarterly reported number of smear positive cases in Indian states & UT’s.
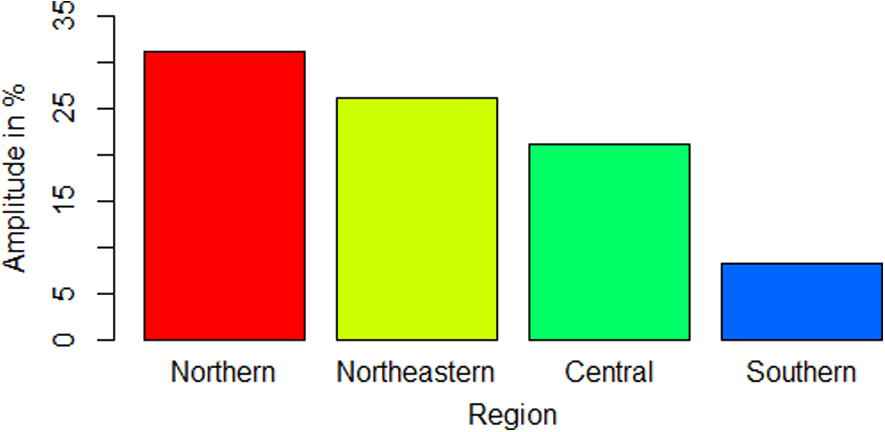
Region wise comparison of seasonal amplitude in quarterly reported number of smear positive cases of TB.
Certainly, the TB notifications have different peaks among various regions of the world. The actual reasons behind the seasonality are still unknown. Various studies have postulated the association of seasonality in TB with deficiency of vitamin D, sunshine duration, temperature, increased indoor activity and co-infection with other seasonal diseases [26,29–32]. Co-infection with other seasonal diseases like influenza, cough, fever and viral infection increase the risk of TB [24]. However such diseases do not contribute directly to TB cases, but they affect immune system and increases the susceptibility to TB. In winter, generally, cough and fever are considered to be common symptoms of viral upper respiratory infection, which lead to large undiagnosed TB cases at early stage. It is observed that lower temperature in winter season may promote the susceptibility to respiratory infection [26,33]. The aspect of vitamin D in the seasonality of TB can be explained through increased risk of activation of latent TB due to lower level of vitamin D in winter. The fundamental source of vitamin D is ultraviolet solar radiations. States in northern region like Himachal Pradesh, Punjab, Uttaranchal, Manipur, Sikkim and Assam experience low sunshine duration during winter as compared to southern states like Tamil Nadu, Karnataka, Kerala and Andhra Pradesh [34]. In northern region, seasonality in levels of vitamin D is also observed during winter [35]. Also, winters in northern region are more harsh with snowfall in Himalayas. It leads to increased time spent in indoor activities and poorly ventilated houses. Therefore, probability of transmission of TB is higher in winter as compared to summer.
Therefore, to check the statistical association of temperature data with smear positive cases, Spearman rank correlation between temperature (maximum, minimum and mean) and number of smear positive cases for north, central, northeast and south region of India at quarter lag is calculated (Table 3). Minimum temperature and number of smear positive cases from 2006 to 2011 for north, central, northeast and south India are plotted and shown in Fig. 6–9. In Fig. 6–8 minimum temperature shows seasonal variation with smear positive cases in north, central and northeast India. However for south India does not show strong seasonal variation with smear positive cases. A strong correlation between temperature and number of smear positive cases at lag 0 is observed in almost all regions of India. Similar kind of association is also observed in some regions of Taiwan [26].
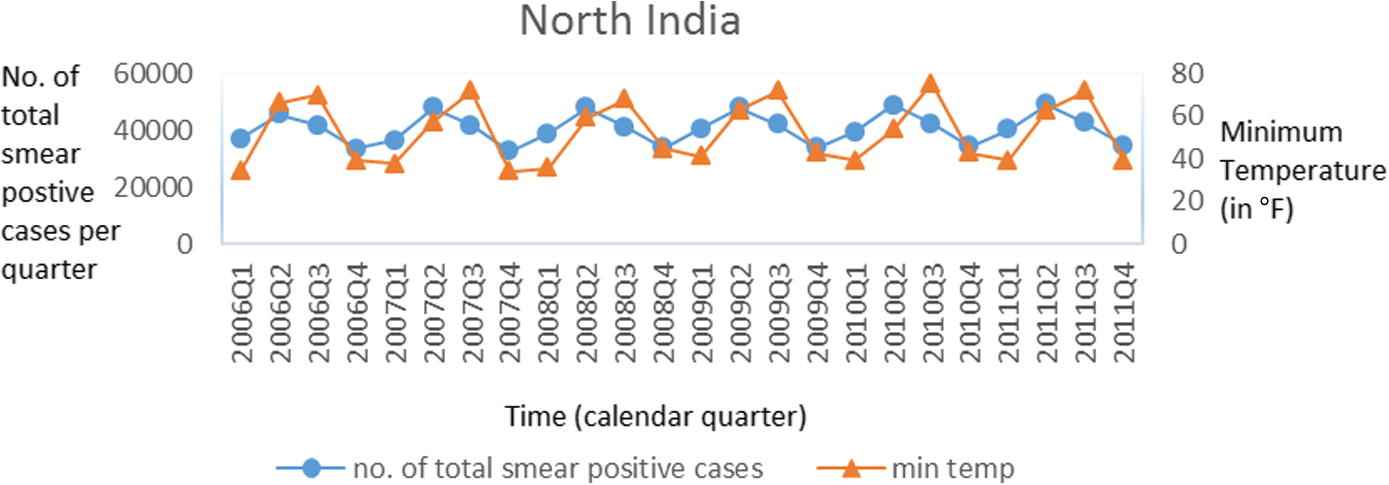
Number of smear positive cases and temperature in north India.
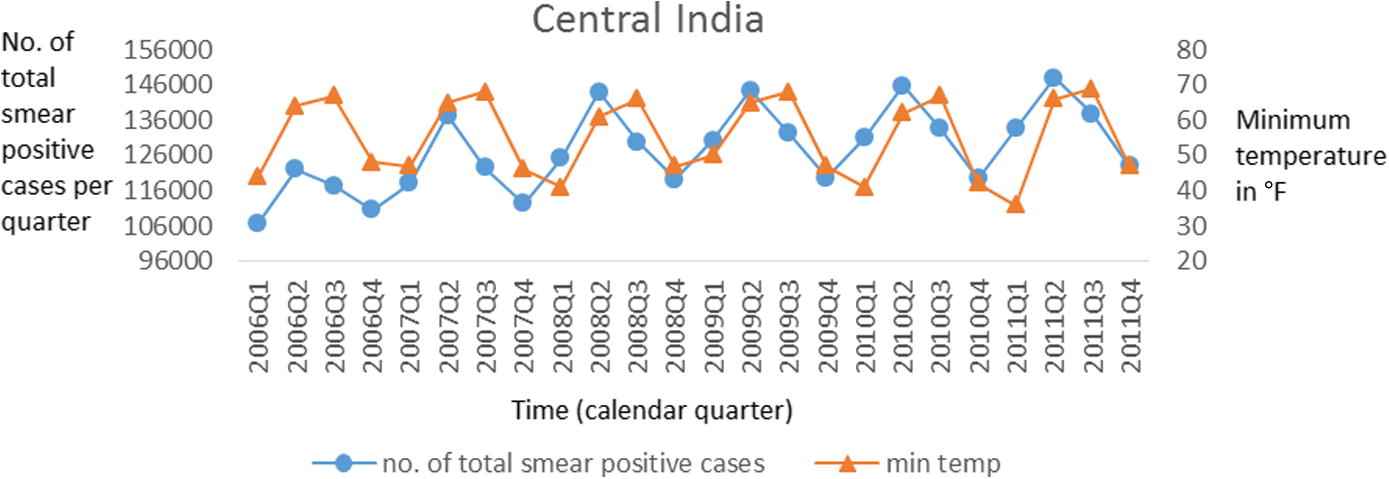
Number of smear positive cases and temperature in central India.
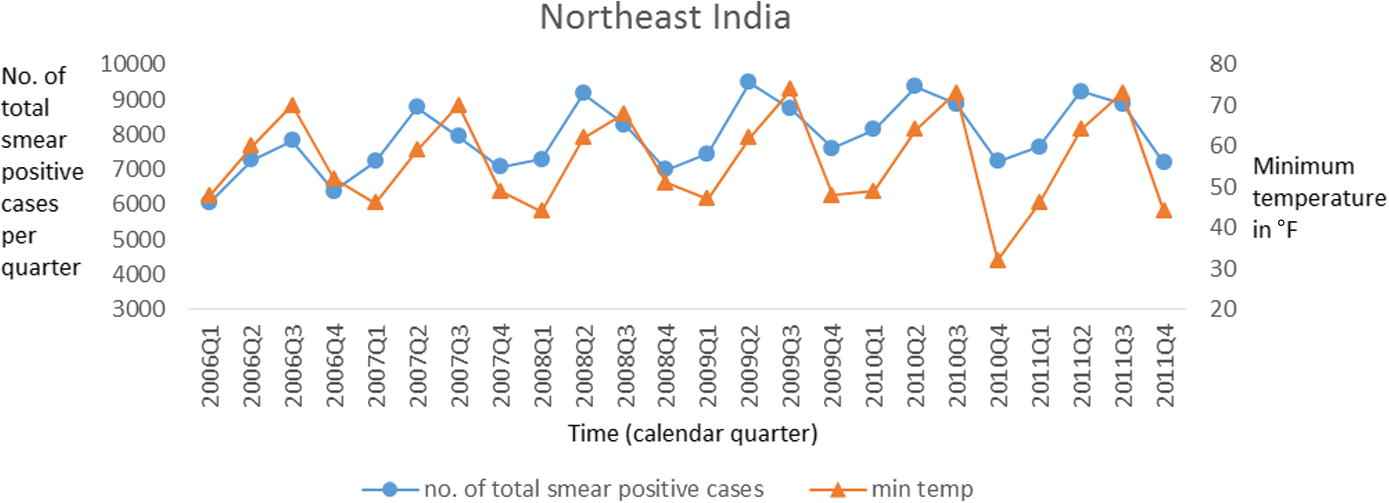
Number of smear positive cases and temperature in northeast India.
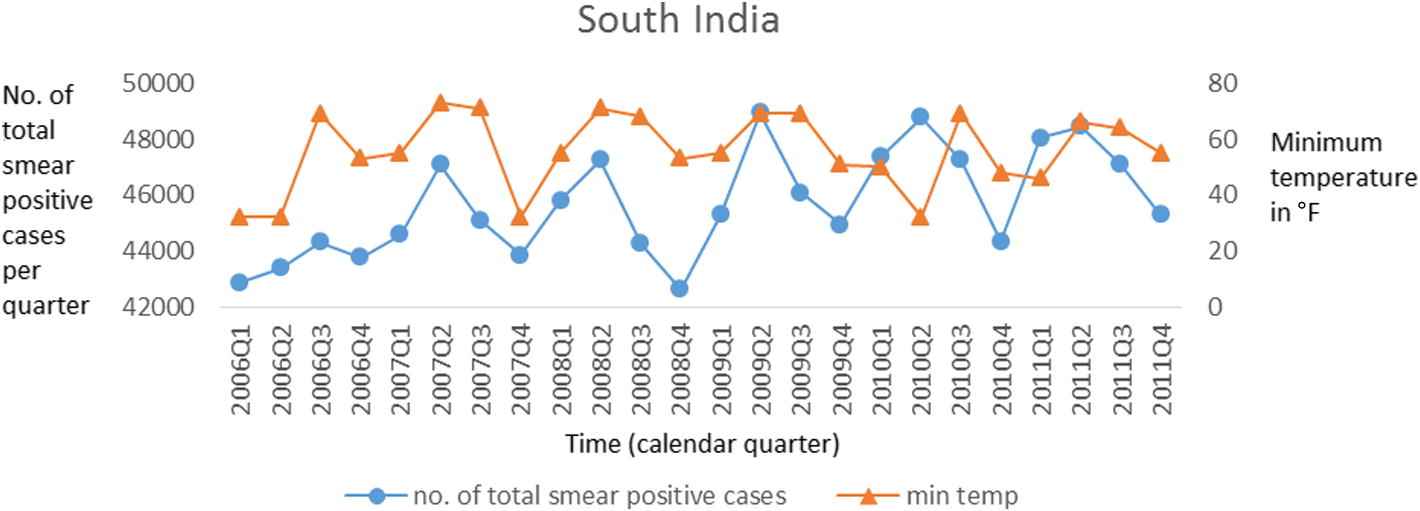
Number of smear positive cases and temperature in south India.
| Time Lag (Quarterly) | Maximum Temperature | Minimum Temperature | Mean Temperature |
|---|---|---|---|
| North Region | |||
| 0 | 0.7*** | 0.66*** | 0.74*** |
| 1 | −0.1 | 0.64*** | 0.34 |
| North-East Region | |||
| 0 | 0.54*** | 0.64*** | 0.65*** |
| 1 | −0.14 | 0.42* | 0.56* |
| Central Region | |||
| 0 | 0.43* | 0.37 | 0.61** |
| 1 | −0.55* | 0.54* | 0.33 |
| South Region | |||
| 0 | 0.67** | 0.16 | 0.51* |
| 1 | −0.12 | 0.33 | 0.34 |
p < 0.05.
p < 0.005.
p < 0.001.
Spearman’s rank correlation coefficient of number of smear positive cases and temperature (°F) at different time lags in north, north-east, central and south regions of India.
We further investigate the quarterly lag relationship of temperature on number of smear positive cases. At lag-1, correlation between minimum temperature and number of smear positive cases is found to be 0.64 (p-value < 0.001), 0.42 (p-value < 0.05), 0.54 (p-value < 0.01) and 0.33 (p-value < 0.15) in north, northeast, central and south region respectively. These findings show that the strong and significant relation of minimum temperature and the number of smear positive cases in north, northeast and central region. This may be explained through time interval between primary infection of TB or re-activation of latent TB and observable stage of TB. However, relationship of minimum temperature and number of smear positive cases in south region of India is very weak and insignificant. Low variation in temperature and high levels of minimum temperature as compared to north region may be the reasons behind the weak correlation in south region.
5. Conclusion
This paper examines the seasonal variations in TB cases in 34 Indian states and union territories. We found that the detection rates and smear positive cases in north India are seasonal, with peaks occurring during the second quarter. We examined the relationship between minimum temperature and tuberculosis cases, and found that the low levels of temperature in winter is associated with high numbers of TB cases in the summer with a lag of one season.
The patterns we observed in north India are similar to the findings of Thorpe et al. [14]. Geographical conditions and seasonal variations in solar radiation are the possible reasons behind the seasonality of TB. The seasonality of TB shed light on understanding the transmission dynamics of TB more precisely and identifying the risk factors associated with it. Analysis of seasonality can assist health agencies in developing TB control programs according to the behavior of the pathogen in different states, which results in efficient and effective utilization of resources. In a high burden country like India, screening of smear-positive cases is an important factor in order to control TB due to transmission. Advanced diagnostic techniques may help in early detection, particularly in winter season, to lower the burden of TB in second quarter. Mobile vans should be used for early case detection and treatment to decrease the TB transmission significantly [36]. In this way, health agencies can use the resources more efficiently.
People should be aware of advantages of outdoor activity in sunlight and importance of appropriate ventilation conditions. Researchers have suggested intake of vitamin D supplement and non-vegetarian diet to avoid the activation of latent TB [31,37]. People should be encouraged to maintain good health dietary habits with rich intake of vitamin D. Public awareness program must encourage the people for the early diagnose of tuberculosis in the presence of its symptoms.
Conflict of interest
We have no conflict of interest to declare.
Acknowledgment
The authors are grateful to India-UK Advanced Technology Centre (IUATC) project for financial support.
References
Cite this article
TY  - JOUR
AU  - Pankaj Narula
AU  - Praveer Sihota
AU  - Sarita Azad
AU  - Pietro Lio
PY  - 2015
DA  - 2015/03/18
TI  - Analyzing seasonality of tuberculosis across Indian states and union territories
JO  - Journal of Epidemiology and Global Health
SP  - 337
EP  - 346
VL  - 5
IS  - 4
SN  - 2210-6014
UR  - https://doi.org/10.1016/j.jegh.2015.02.004
DO  - 10.1016/j.jegh.2015.02.004
ID  - Narula2015
ER  -