
On the reliability of self-reported health: Evidence from Albanian data☆
- DOI
- 10.1016/j.jegh.2012.04.003How to use a DOI?
- Keywords
- Self-reported health; Random effects ordered Probit; Albania
- Abstract
This paper investigates the reliability of self-assessed measures of health using panel data collected in Albania by the World Bank in 2002, 2003 and 2004 through the Living Standard Measurement Study project. As the survey includes questions on a self-assessed measure of health and on more objective health problems, both types of information are combined with a view to understanding how respondents change their answers to the self-reported measures over time. Estimates from random effects ordered Probit models show that differences in self-reported subjective health between individuals are much more marked than those over time, suggesting a strong state dependence in subjective health status. The empirical analysis also reveals respondent consistency, from both a subjective and an objective viewpoint. Self-reported health is much more influenced by permanent shocks than by more transitory illness or injury.
- Copyright
- © 2012 Ministry of Health, Saudi Arabia. Published by Elsevier Ltd.
- Open Access
- This is an open access article under the CC BY-NC-ND license (http://creativecommons.org/licenses/by-nc-nd/4.0/)
1. Introduction
Many empirical studies rely on self-assessed measures to investigate overall individual health in populations. Ordered answers to simple questions like “how is your health in general?” or “in general, would you say that your health is excellent, very good, good, fair or poor?” are known to be good predictors of mortality, morbidity or use of medical care, as shown in McCallum et al. [21], Idler and Kasl [16] or Appels et al. [2]. Using ordered models, Wagstaff and van Doorslaer [25] explain how to construct a continuous single health index from the categorical self-assessed variable, this index being strongly correlated with other health outcomes [13].
The self-reported measures of health status offer a number of potential advantages. In particular, self-assessed indicators are very easy to implement and are widely collected in almost all countries. At the same time, self-reported measures face three critical limitations. The first problem lies in the measurement of health inequalities. The categorical nature of self-assessed health status excludes the use of traditional distributional analysis tools. Simple methods based on an assignment of numerical values to the different categories of health require an adequate scale, but a difficulty here is that the evaluation of health inequality has to be independent of the choice of scale.1
A second difficulty is that different populations may use different threshold levels when being asked to assess their health. This is the so-called reporting heterogeneity problem investigated in Kerkhofs and Lindeboom [18], Shmueli [23] and Lindeboom and Van Doorslaer [20]. For a given true health status, individuals are likely to use different reference points depending on their demographic and socio-economic characteristics.2 A last issue concerns the reliability of the responses given. The question here is whether or not there is major measurement error when individuals have to self-assess their own level of health.
Since self-reported measures are empirically strong predictors of objective health measures, it could be argued a priori that measurement error remains minor. However, there are very few studies on this issue. An exception is the contribution of Crossley and Kennedy [11], who provide evidence on measurement errors in self-reported health using data from the Australian National Health Survey. This survey, conducted from January 1995 to January 1996, is based on a sample of some 23,800 households. A random sub-sample of respondents was asked twice about their self-reported health, before and after giving answers to additional health-related questions. The most striking result was that a total of 28% of respondents changed their response. A possible interpretation is that measurement error is substantial, but it may also be that respondents had learned something about their health status between the first and second rounds of self-assessed questions (both interpretations may be viewed as complementary).
The introduction of longitudinal aspects into empirical analysis may help to unearth the relevance of health self-assessment, as emphasized in the different contributions of Bourne [3–6] and Bourne et al. [7]. With panel data, a comparison of self-assessed health at two different waves and the use of more objective shocks in health during the periods indicate whether or not respondents revise their health status in the appropriate direction. If the self-reported measure is subject to significant changes not related to true shocks, this would suggest that the reliability of the ordered subjective outcome remains weak.
To date, little is known about the dynamics of self-assessed health. Contoyannis et al. [9,10], Halliday [15] and Jones et al. [17] are recent exceptions. For instance, Contoyannis et al. [9] investigated persistence in self-assessments of health outcomes using eight waves of the British Household Panel Survey (1991–1998). Drawing on dynamic ordered models, these authors attempt to quantify the relative contribution of state dependence in explaining the dynamics of health. Their results indicate that self-assessed health is characterized by strong state dependence, suggesting that short-term public policy aimed at improving health may have long-term benefits.3
A difficulty remains when interpreting the role of state dependence: does it mean that true health outcomes are very persistent over time at the individual level? Or does it mean that some respondents are, for instance, highly optimistic and claim at each wave that they are in very good health, even though they experience health problems during the overall period? This paper studies changes in self-reported health status over time and proposes an empirical analysis using longitudinal data collected in Albania by the World Bank in 2002–2004. As the survey includes questions on the usual self-assessed measure of health and on more objective health problems, both types of information are combined so as to better understand whether respondents give consistent answers to the self-reported measures over time.
The use of longitudinal data allows further exploration of the following three issues. First, this research is the first analysis of the dynamics of self-reported health in a developing country. With respect to the case of developed countries [9,15], state dependence in health may be less pronounced in a poor country where people are much more sensitive to economic conditions. Secondly, the revision process of the self-assessed measures of health over time is analyzed as a function of more objective health indicators and seeks to establish whether or not respondents’ decisions are consistent. Thirdly, when respondents indicate whether their health status has improved or worsened during the previous year, a comparison between this information with their two measures of self-reported health over the same period is done.
2. Materials and methods
2.1. The LSMS Albanian data
This empirical study of self-reported health uses data collected in Albania in 2002–2004 through the LSMS project (Living Standard Measurement Study). The aim of the project is to improve the quality of household survey data for policy needs, and it provides a core tool for measuring poverty in many developing countries [14]. Following the collapse of communism, Albania has recently implemented important reforms oriented toward a market economy [24]. Although the GDP has been increasing since 2000 (5% per year on average between 2000 and 2005), Albania still remains a poor country. GDP per inhabitant is low (2400 US dollars in 2003) and one in four Albanians lives below the poverty line. The Human Development Index (HDI) (0.784) is below the average HDI of Eastern Europe (0.802), while unemployment (17% in 2004) and inflation (2.3% in 2004) remain high [26].4 Thus, Albania is characterized by pronounced poverty and lack of job opportunities. At the same time, the proximity of neighboring countries with better economic performances (like Italy and Greece) offers some opportunities. Albania is now the largest emigration country in Europe (as a portion of the population) and its emigrants play an important part in supporting the Albanian economy [12].5
The present study draws on the Albanian LSMS longitudinal data, using three waves (2002, 2003, and 2004). This survey was conducted by the Albanian Institute of Statistics, with the assistance of the World Bank. The first wave includes a nationally representative sample of Albanian households and is representative of both urban and rural areas. Information in 2002 was collected through the use of four questionnaires: a household questionnaire, a diary recording household consumption, a community questionnaire and a price questionnaire. In the following waves, the focus was solely on the household questionnaire, with questions about composition of the household, accommodation, education, health, labor, emigration, fertility, social assistance, consumption and anthropometrics, among other considerations.
The size of the Albanian samples is respectively 1782 households in 2002 (7973 individuals); 2155 households in 2003 (8110 individuals); and 1797 households in 2004 (8025 individuals). In what follows the changes in self-reported health over time are analyzed. The sample is constructed in the following way. In each household, all members aged 16 and above in 2002 are selected. Then these individuals are followed over the three waves and only persons with information in 2002, 2003 and 2004 are kept. The panel being balanced, it is not necessary to account for the issue of survivorship bias, i.e., selective attrition related to poor health [9]. Finally, the panel dataset comprises 12,360 observations over the 2002–2004 period, meaning that it concerns 4120 individuals per year.
The following is a brief description of the questions used regarding health measurement. The focus is on two questions. The first one concerns the standard self-reported subjective health indicator: “How would you rate your health condition? Very good, good, average, poor, very poor”? The second indicator bears on changes in health over time: “Compared with health one year ago, would you say that your health now is? Much better, somewhat better, about the same, somewhat worse, much worse”? On the other hand, the survey includes a number of more objective health indicators. For example, whether each individual has suffered from a chronic illness or disability lasting more than 3 months or had any illness or injury during the last 4 weeks.6
As data are longitudinal, it is possible to study changes in self-reported health by comparing answers for successive years. This comparison will reveal the persistence of the health outcome over time. By combining the different questions, it is also possible to study whether respondents adequately revise their subjective health outcome when they experience negative health experiences like illness or disability. Finally, two different measures of health evolution over time are used. One consists in comparing the self-reported outcome in t and t−1, the other is the retrospective question in t on evolution since last year.
2.2. A random effects ordered Probit specification
Self-reported health is measured with an ordered categorical indicator (H) so that H = 1 when health is “poor” or “very poor”, H = 2 when health is “average”, H = 3 when health is “good” and H = 4 when health is “very good”. A continuous latent variable H * for the health outcome is assumed to exist, with H ⩽ μ1 when H = 1, μ1 < H * ⩽ μ2 when H = 2, μ2 < H * ⩽ μ3 when H = 3, and μ3 < H * when H = 4. The threshold level μ1 is normalized to 0.The latent indicator is expected to depend on a set of individual characteristics X, a vector of coefficients β and a residual. As there is repeated information over time for each individual in the survey, it is possible to account for an unobserved individual effect in the following way:
The contribution to the likelihood function for an individual i observed during T periods is:
One of the interests of the research is to measure the persistence of health status over time. As there are only three waves with the Albanian panel, it is not possible to estimate a dynamic ordered model as in Contoyannis et al. [9] and Halliday [15]. A variance decomposition allowing to estimate the between and within components of both the explained and unexplained variances following the method described in Picard and Wolff [22] may be realized. While the between component is related to the difference among individuals, the within component of the variance reveals inequalities in self-reported health over time. The decomposition of the variance is done in the following way.
For each respondent, the random effects ordered model is estimated, as well as the linear fitted value of the latent variable given by
This decomposition method provides an accurate measure of the weight of the explained and unexplained components of the latent measure of health. A large within component simply indicates that the health outcome varies strongly over time.
3. Results
3.1. The pattern of self-reported health in Albania
Answers given to the self-reported measure of health are reported in Table 1 for the three waves. Very similar patterns are found in 2002, 2003 and 2004. About 10% of the respondents claim that their health condition is either “poor” or “very poor”, while 20% of them indicate “average” health. The bulk of individuals rate their health condition as either “good” (between 41% and 43%) or “very good” (between 26% and 28%).
| Self-reported health | 2002 (%) | 2003 (%) | 2004 (%) |
|---|---|---|---|
| All (N = 12360) | |||
| Poor | 10.9 | 10.6 | 9.9 |
| Average | 20.5 | 19.3 | 21.0 |
| Good | 42.5 | 43.2 | 41.3 |
| Very good | 26.1 | 26.9 | 27.8 |
| Men (N = 6231) | |||
| Poor | 8.0 | 8.7 | 8.6 |
| Average | 19.0 | 16.8 | 18.3 |
| Good | 44.7 | 44.7 | 42.6 |
| Very good | 28.2 | 29.9 | 30.6 |
| Women (N = 6129) | |||
| Poor | 13.8 | 12.6 | 11.2 |
| Average | 21.9 | 22.0 | 23.7 |
| Good | 40.2 | 41.6 | 40.1 |
| Very good | 24.0 | 23.8 | 25.0 |
Source: Albanian LSMS 2002–2003–2004.
Descriptive statistics on self-reported health.
The pattern of self-reported health is somewhat different when working respectively on the male and female subsamples. As shown in Table 1, women are more likely than men to claim that their health condition is “poor” or “average”. When adding these two categories, the corresponding proportion is equal to 27% for men in 2002, while it is more than 35% for women. At the same time, women are less likely to indicate “very good” health—the gap between men and women being on average equal to 5 percentage points. Gender differences in self-reported health may arise from differences in the observable characteristics of men and women.
In Table A of the Appendix, descriptive statistics related to the main covariates introduced into the multivariate analysis are presented. On average, the proportion of women under 25 is higher than that of young men. This particular pattern is essentially due to the fact that health is analyzed at the family level. Co-residence is itself an endogenous process, young men being more likely to leave the parental home, for instance. The proportion of married men is also higher, and women are less likely to reach advanced levels of education in that country [22]. As expected, there are fewer differences for religion and income variables, in terms of either current level of food consumption or position on an income ladder. These characteristics are all expected to strongly influence the pattern of self-reported health.
One of the most influential explanatory variables is undoubtedly age, older people being more likely to be in bad health. As shown in Fig. 1, at less than 2% the proportion of men under 25 claiming that their health is “very poor” or “poor” is extremely low. The same health outcome is reported by around 30% of older men (65 and above), and older women are even more likely to self-assess their health as poor (43%). Differences in health by gender are also observed in the older categories. While young women and men (under 25) equally indicate “very good” health—55% and 56% respectively—the gap then widens considerably with age. This outcome is quoted by 46% of men as opposed to 39% of women in the 25–34 age group, and even 36% as opposed to 22% for the 35–44 age group.
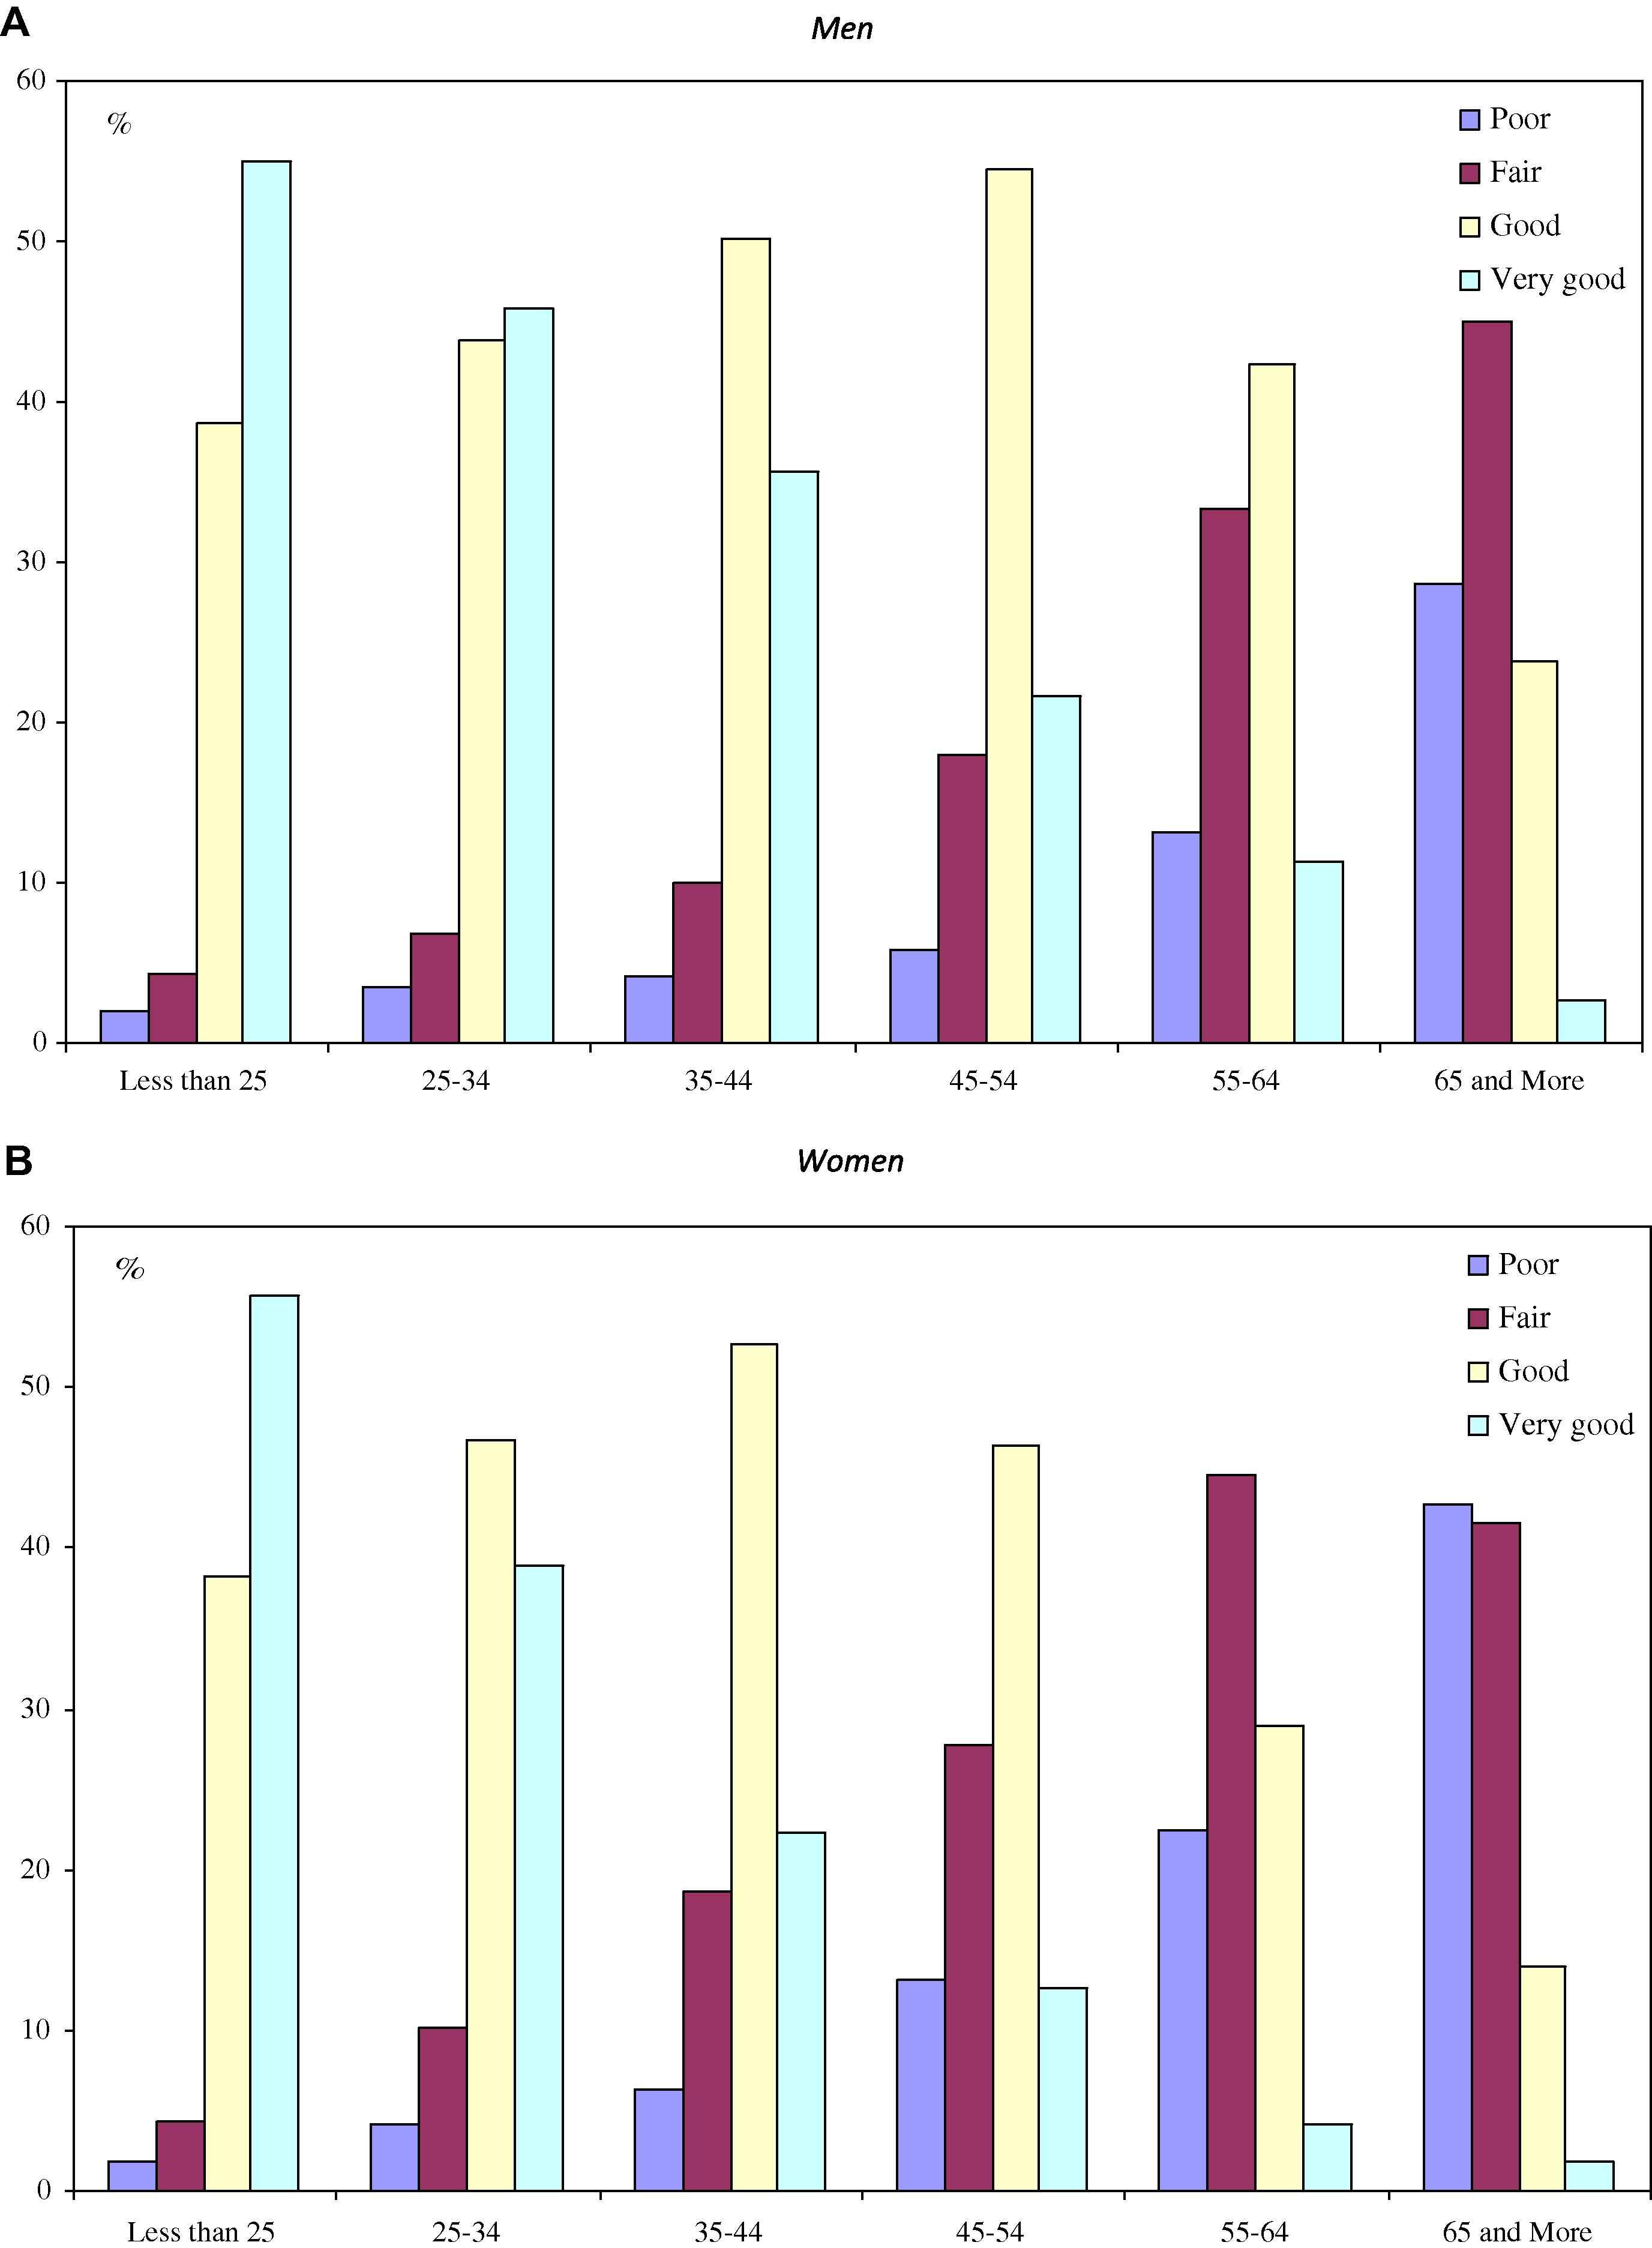
Self-assessed health status, by age and gender. (A) Men. (B) Women. Source: Albanian LSMS 2002–2003–2004.
That a similar profile of self-assessed health is found for the three waves does not necessarily imply that health remains constant at the individual level. Consider, for instance, the case of the “very good” health outcome. With a kind of permanent health status, around one-quarter of the pooled sample (individuals with three-year observation) should report “very good” health status. In fact, this prediction is not borne out by the LSMS data since only 11% of the individuals (455 respondents among 4120) rate their health condition as “very good” over the 2002–2004 period. Similarly, the proportion of respondents who always indicate “good health” is 15.7%.8
To further assess the importance of state dependence, the pattern of self-reported health in wave t (either 2003 or 2004) is described in Table 2 as a function of self-reported health in wave t−1 (respectively 2002 and 2003). As women and men face different health conditions, the transition matrices of self-assessed health are calculated by gender. The main results are as follows.
| Self-reported health in wave t−1 | Self-reported health in wave t | All | |||
|---|---|---|---|---|---|
| Poor | Fair | Good | Very good | ||
| (A) Men | |||||
| Poor | 4.4 | 2.5 | 1.1 | 0.3 | 8.4 |
| Fair | 2.4 | 7.2 | 6.6 | 1.7 | 17.9 |
| Good | 1.5 | 6.6 | 26.2 | 10.4 | 44.7 |
| Very good | 0.2 | 1.2 | 9.7 | 17.9 | 29.1 |
| All | 8.6 | 17.5 | 43.6 | 30.3 | 100.0 |
| (B) Women | |||||
| Poor | 7.0 | 4.2 | 1.8 | 0.3 | 13.2 |
| Fair | 3.3 | 10.2 | 7.2 | 1.3 | 21.9 |
| Good | 1.4 | 7.4 | 23.6 | 8.4 | 40.9 |
| Very good | 0.2 | 1.1 | 8.3 | 14.3 | 23.9 |
| All | 11.9 | 22.9 | 40.9 | 24.4 | 100.0 |
Source: Albanian LSMS 2002–2003–2004.
Transition matrices of self-reported health.
First, there is considerable evidence of state dependence both for women and men. More than one half of individuals give the same answer in waves t−1 and t, respectively 55.7% for men and 55.2% for women. Secondly, the measures of state dependence are higher at the top than at the bottom of the health ladder. Among men, 61.6% of those who are in “very good” health in t were also in “very good” health in t−1. This proportion is 58.5% for the “good” outcome, but only 53.3% for the “poor/very poor” outcome and as low as 40.3% for the “average” status. Thirdly, changes in self-assessed health most often remain limited. Among the men who are in “very good” health in t, around 95% were either in “good” (33.6%) or “very good” (61.6%) health in t−1.
3.2. Retrospective changes in self-assessed health
As to self-reported changes in health condition over time, respondents in the survey have to assess whether their health is now “better”, “about the same” or “worse” compared with the previous year. This information is helpful in establishing how persistent health status is in Albania. As shown in Fig. 2, most respondents claim that their health condition is about the same in t and t−1. Among the male population, the corresponding proportion is equal to 65.9% in 2002, 80.2% in 2003 and 77.1% in 2004.9
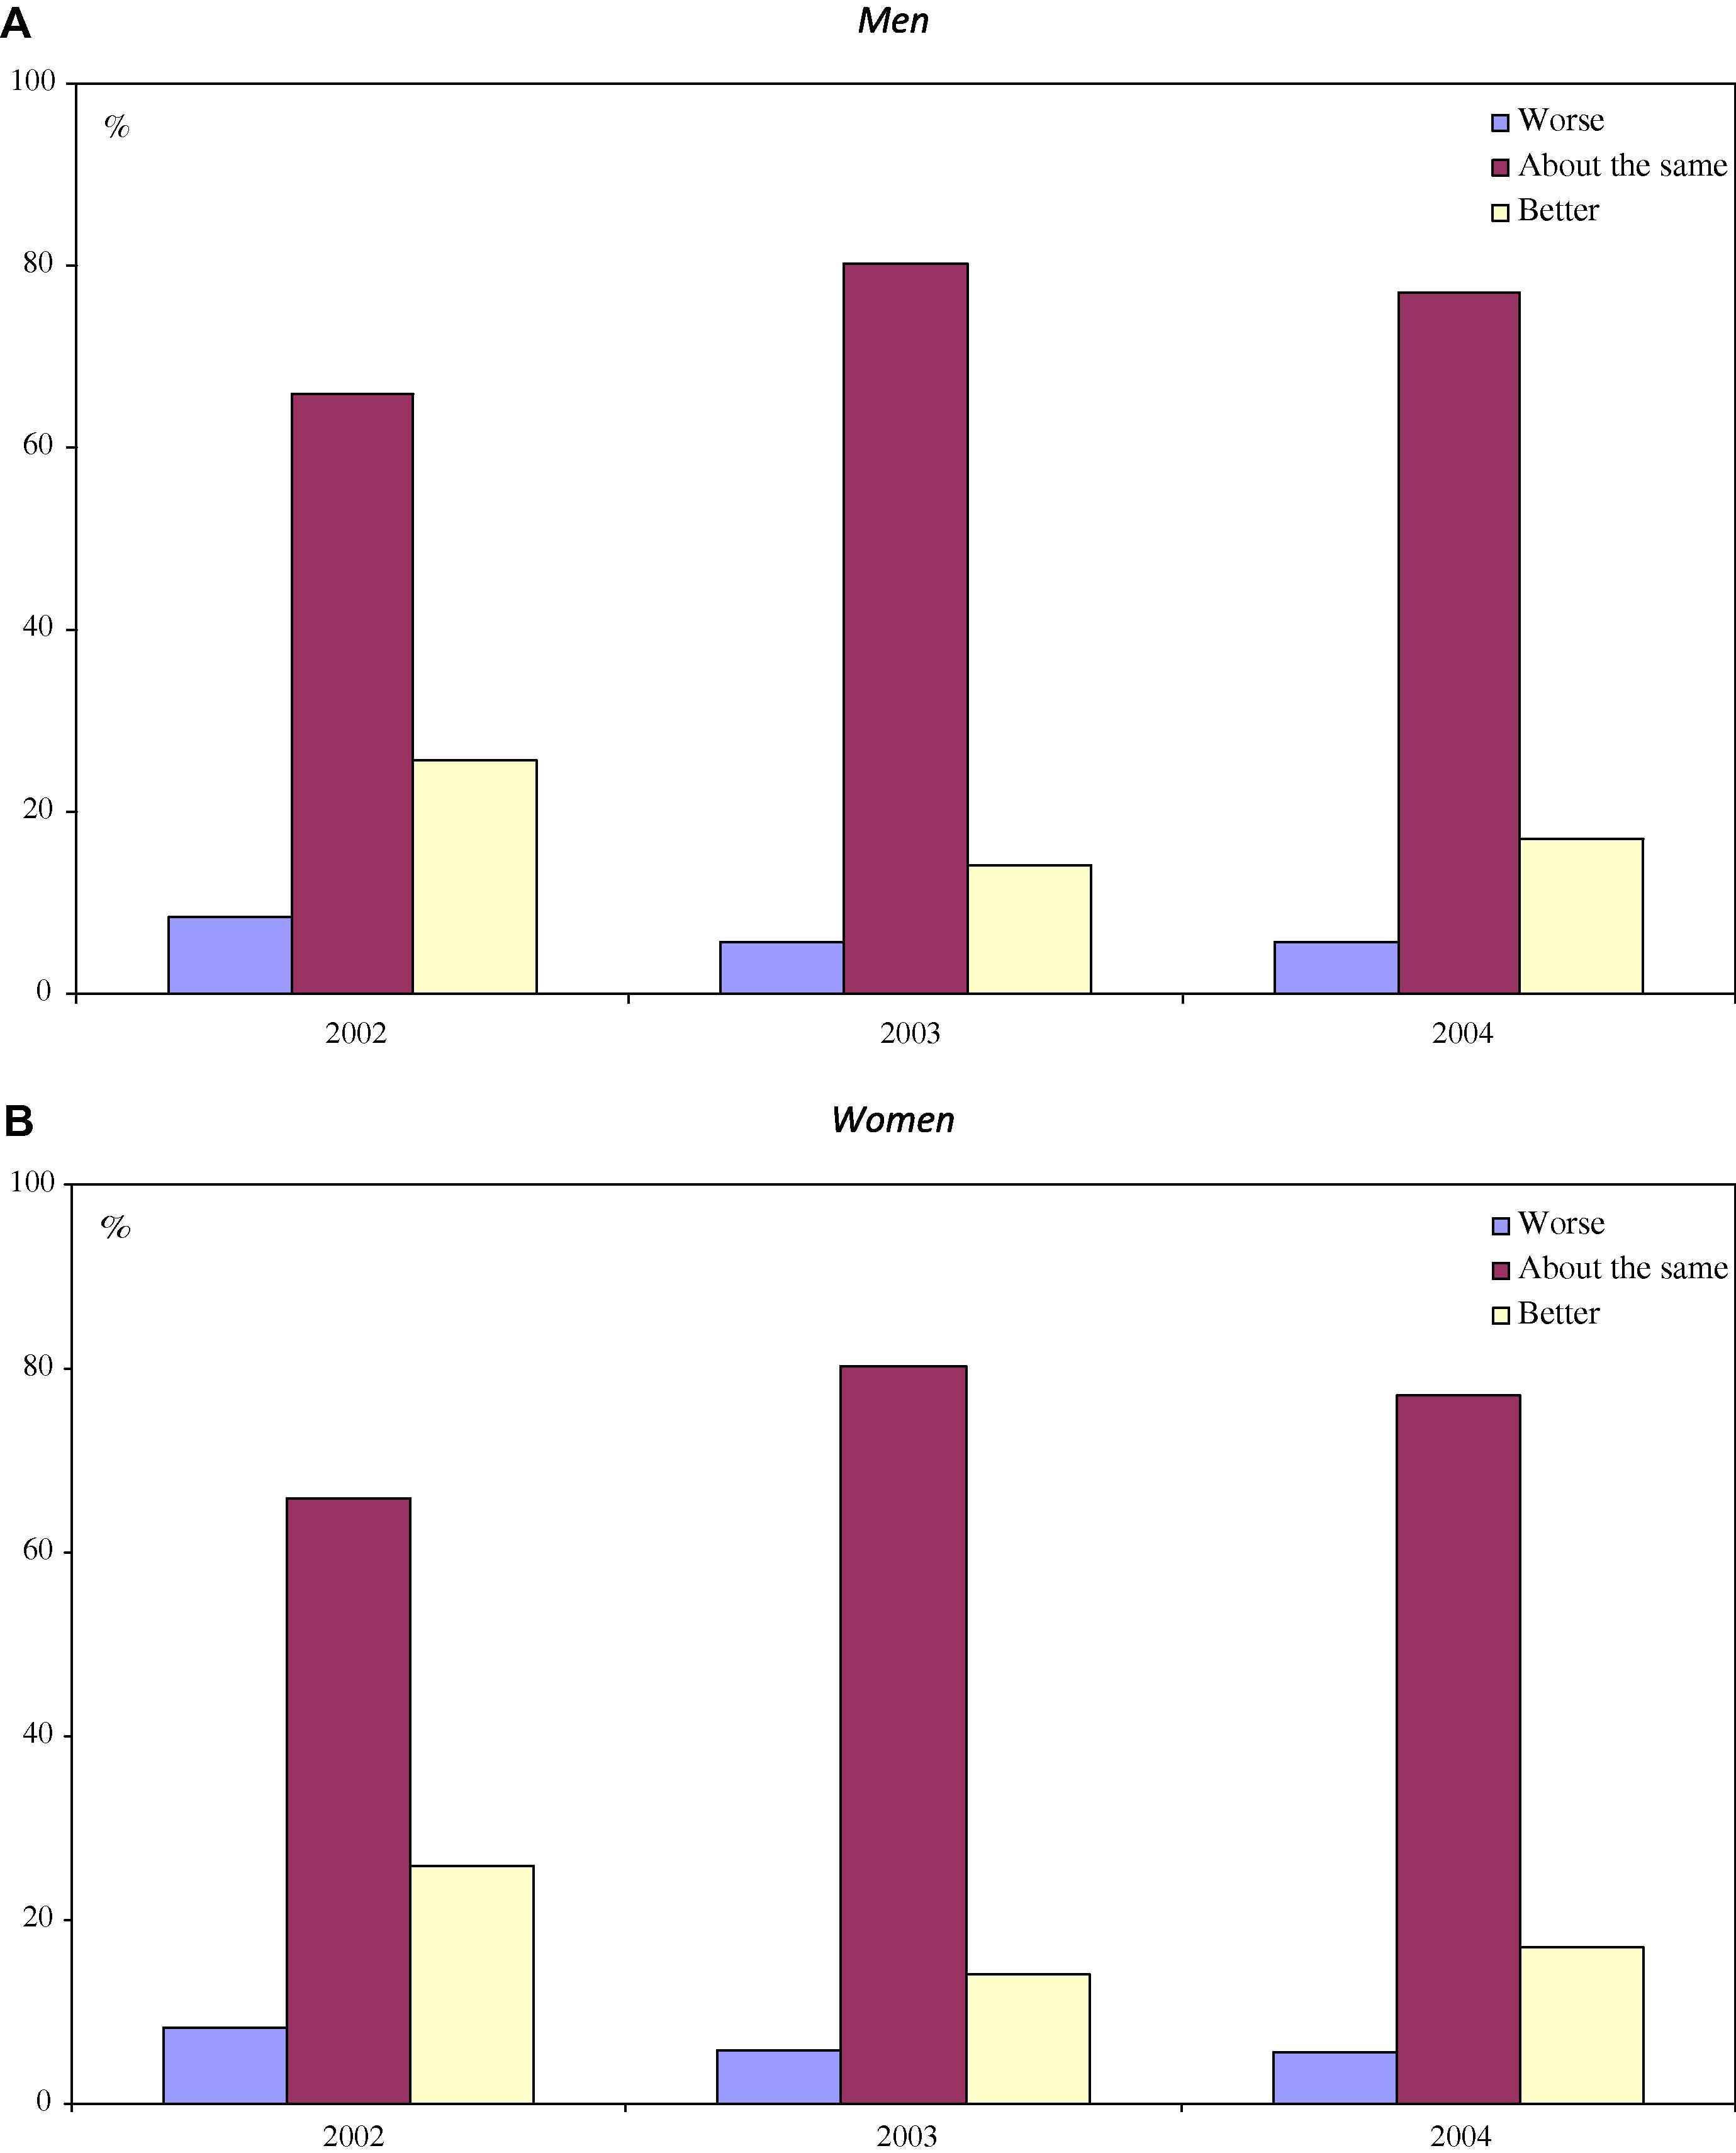
Self-assessment of change in health since last year, by gender. (A) Men. (B) Women. Source: Albanian LSMS 2002–2003–2004.
Individuals in Albania are more likely to report that their health is better now than it was 1 year ago. The ratio of the “better health” outcome over the “worse health” outcome amounts to around 3 for men, but it is much lower among women, being situated between 1.6 in 2003 and 2 in 2002. On average, respondents have a much more positive feeling about the change in their health condition. One possible explanation could be the use of a balanced panel, so that people whose health deteriorates markedly over successive years are less likely to be included in the selected sample. At the same time, it may be that respondents are reluctant to admit that their health status is declining and hence might be tempted to overstate their true health condition.
The differences observed across the different waves are very striking. In 2002, people are much more likely to report that their health status has changed since the previous year. Interestingly, 2002 is the first wave of the survey and it may be that respondents have more difficulty in answering the questions related to the health situation 1 year ago. In 2003 and 2004, the situation is different, as respondents have provided detailed information on their health condition, respectively in the 2002 and 2003 waves. Following the extensive discussion in Crossley and Kennedy [11], one interpretation is that in the last two waves respondents have learned more about their own health status and are thus in a better position to self-assess their changes in health since the previous year.
The longitudinal dimension of the data allows for further investigation of the changes in health over time. Specifically, the objective is to determine whether or not answers regarding changes in health since the previous year are consistent with information on health status at the different waves. Imagine, for instance, that a respondent indicates good health both in 2002 and 2003: if the interviewee’s subjective answers are consistent, then she should claim that in 2003, as compared with 2002, her health is “about the same”; but if she reports “average” health in 2004, then she should explain at that time that her health condition has worsened since 2003. Results of the comparison are in Table 3.
| Comparison of self-reported health between t and t−1 | Compared with health 1 year ago | Number of observations | ||
|---|---|---|---|---|
| Worse health | Same health | Better health | ||
| (A) Men | ||||
| Health in t worse than health in t−1 | 2.6 | 16.5 | 2.6 | 902 |
| Health in t same as health in t−1 | 2.7 | 44.0 | 9.1 | 2315 |
| Health in t better than health in t−1 | 0.5 | 18.2 | 4.0 | 937 |
| Number of observations | 239 | 3267 | 648 | 4154 |
| (B) Women | ||||
| Health in t worse than health in t−1 | 3.2 | 15.9 | 2.6 | 887 |
| Health in t same as health in t−1 | 4.8 | 42.2 | 8.1 | 2254 |
| Health in t better than health in t−1 | 0.7 | 18.4 | 4.1 | 945 |
| Number of observations | 354 | 3126 | 606 | 4086 |
Source: Albanian LSMS 2002–2003–2004.
Measures of change in health status over time.
Clearly, the various measures of change in self-reported health over time differ. When using the retrospective information, respondents most often indicate that their health condition has remained about the same since the previous year, respectively 78.7% for men and 76.5% for women when pooling the 2003 and 2004 waves.10 However, by comparing their self-reported health respectively in t and t−1, it appears that only 55.9% of men and 55.2% of women have indeed chosen the same outcome at both waves. In fact, among the male group, 21% of respondents have reported lower health status in t than in t−1, while 23.1% have reported better health in t. This casts some doubt on the consistency of the retrospective and contemporaneous self-assessed measures of health.
At the same time, this discrepancy may be due to the inaccuracy of the definition of the median category, i.e., “same health” since last year. Answers are, indeed, much more consistent when respondents claim that their health has either worsened or improved during the last twelve months. Among men who report that their health has worsened since last year, 45.6% have indeed indicated poorer health status in t with respect to t−1, while only 8% have reported better health in t. Turning to the case of better health since the previous year, similar findings are obtained: 25.3% of the male respondents indicate better health status in t than in t−1, and 58.3% report the same outcome, but there is still a significant proportion of men who report a poorer health status (16.3%).11
There exist more objective indicators of health in the survey making it is possible to further study whether individuals revise their subjective status in a way consistent with objective changes in health. If, for instance, a person reports a chronic illness in t, but not in t−1, then she should be more likely to claim that her health has worsened since last year. In Table 4, the relationships between self-reported changes in health and the following health problems are analyzed: chronic illness or disability lasting more than 3 months, illness or injury during the last 4 weeks, and hospital stays over the last 12 months.
| Objective problems | Change in self-reported health | Frequency (%) | ||
|---|---|---|---|---|
| Health in t worse than health in t−1 | Same health in t and t−1 | Health in t better than health in t−1 | ||
| (A) Men | ||||
| Chronic illness or disability longer than 3 months | ||||
| No in t−1, no in t | 18.8 | 60.5 | 20.8 | 73.3 |
| Yes in t−1, yes in t | 19.2 | 59.8 | 21.0 | 13.8 |
| No in t−1, yes in t | 72.5 | 23.1 | 4.4 | 7.1 |
| Yes in t−1, no in t | 3.3 | 26.3 | 70.4 | 5.9 |
| Illness or injury during the last 4 weeks | ||||
| No in t−1, no in t | 20.9 | 57.7 | 21.4 | 85.1 |
| Yes in t−1, yes in t | 14.1 | 64.1 | 21.9 | 1.5 |
| No in t−1, yes in t | 48.1 | 39.7 | 12.2 | 5.7 |
| Yes in t−1, no in t | 13.2 | 43.7 | 43.1 | 7.7 |
| Hospital stay in the last 12 months | ||||
| No in t−1, no in t | 21.2 | 56.3 | 22.5 | 93.7 |
| Yes in t−1, yes in t | 14.3 | 57.1 | 28.6 | 0.7 |
| No in t−1, yes in t | 47.7 | 42.2 | 10.2 | 3.1 |
| Yes in t−1, no in t | 12.5 | 49.0 | 38.5 | 2.5 |
| (B) Women | ||||
| Chronic illness or disability longer than 3 months | ||||
| No in t−1, no in t | 19.4 | 59.6 | 21.1 | 64.6 |
| Yes in t−1, yes in t | 16.9 | 61.6 | 21.5 | 19.4 |
| No in t−1, yes in t | 65.0 | 30.0 | 5.0 | 8.7 |
| Yes in t−1, no in t | 3.4 | 29.3 | 67.3 | 7.3 |
| Illness or injury during the last 4 weeks | ||||
| No in t−1, no in t | 21.4 | 57.2 | 21.4 | 77.3 |
| Yes in t−1, yes in t | 15.8 | 57.2 | 27.0 | 3.7 |
| No in t−1, yes in t | 35.7 | 51.4 | 12.9 | 8.9 |
| Yes in t−1, no in t | 13.8 | 42.5 | 43.7 | 10.1 |
| Hospital stay in the last 12 months | ||||
| No in t−1, no in t | 21.5 | 56.1 | 22.4 | 90.6 |
| Yes in t−1, yes in t | 14.3 | 66.7 | 19.1 | 1.0 |
| No in t−1, yes in t | 33.0 | 50.3 | 16.8 | 4.2 |
| Yes in t−1, no in t | 16.6 | 36.7 | 46.8 | 4.1 |
Source: Albanian LSMS 2002–2003–2004.
Measures of subjective and objective changes in health.
Chronic illness or disability lasting more than 3 months was the initial focus: 73.3% of the male respondents reported no problems in either t−1 or t, while 13.8% reported such illness in both years. Now, 7.1% had no disability in t−1, but were ill in t. For this subsample, 72.5% report self-rated health worse in t than in t−1 (the proportion is 65% among women). Conversely, among those who were ill in t−1, but not in t, most (70.4%) indicate better health in t than in t−1 (67.3% among women). These findings suggest that the self-reported measure of health is rather reliable, as respondents seem to revise their health outcome in the appropriate way. If they experience a disability or chronic illness, then they most often argue that their health has worsened at the next wave.
Results from Table 4 also show that the self-reported measure is much less sensitive to more transitory shocks or stays in hospitals. Consider the case of illness or injury during the previous 4 weeks. Among those who reported such illness in t, but did not in t−1, only 48.1% of men and 35.7% of women have a self-rated measure lower in t than in t−1. In such a situation, women are in fact more likely to have the same health outcome at both waves (51.4%). Similar findings hold when people were ill or injured in t−1, but are no longer in t. About 43% report a higher outcome in t, but 43% also have the same self-reported health in both years.12 This suggests that the self-assessed measure of health depends much more on permanent shocks (chronic illness, disability) than on transitory events (illness, injury).
3.3. Determinants of self-reported health
When estimating the ordered Probit model, the following covariates are introduced into the regression: gender, age, marital status, number of children (by age groups), level of education, religion, urban/rural status, and household resources. As there is not an accurate measure of income over the 3 years, two following indicators are used: current level of family expenditure for food and other basic necessities like clothing and housing (either more than adequate, just adequate, or less than adequate); and position on a 10-step-ladder, with the poorest people at the bottom and the richest at the top.13
As shown in column 1 of Table 5, a first finding is that the self-reported health outcome depends on gender. At the 1% level, self-assessed health is lower for women than for men. This could be owing to the fact that women are more frequently involved in disagreeable domestic tasks. When estimating gender-specific regressions, it appears that as they grow older, individuals are more likely to report poor health status. Moreover, the deterioration in self-reported health is not regular over time. People seem to suffer from a more severe decrease in their subjective health when they reach 65 and to a lesser extent at 55.
| Explanatory variables | All | Men | Women | |||
|---|---|---|---|---|---|---|
| (1) | (2) | (3) | (4) | (5) | (6) | |
| Female | −0.346*** (9.28) | −0.355*** (9.66) | ||||
| Age (ref: less than 25) | ||||||
| 25–34 | −0.349*** (4.55) | −0.315*** (4.16) | −0.295*** (2.70) | −0.251** (2.31) | −0.381*** (3.53) | −0.354*** (3.32) |
| 35–44 | −0.795*** (9.52) | −0.780*** (9.44) | −0.663*** (5.52) | −0.635*** (5.35) | −0.910*** (7.73) | −0.899*** (7.74) |
| 45–54 | −1.172*** (13.36) | −1.173*** (13.52) | −1.038*** (8.34) | −1.036*** (8.41) | −1.275*** (10.30) | −1.275*** (10.44) |
| 55–64 | −1.737*** (18.48) | −1.732*** (18.65) | −1.660*** (12.46) | −1.632*** (12.39) | −1.793*** (13.51) | −1.807*** (13.79) |
| 65 and above | −2.347*** (22.91) | −2.352*** (23.22) | −2.392*** (16.92) | −2.388*** (17.06) | −2.258*** (15.05) | −2.269*** (15.32) |
| Single | 0.412*** (5.57) | 0.423*** (5.79) | 0.272*** (2.63) | 0.288*** (2.82) | 0.540*** (5.07) | 0.549*** (5.23) |
| Divorced or widowed | −0.212*** (2.67) | −0.177** (2.25) | −0.316* (1.83) | −0.252 (1.47) | −0.182** (1.98) | −0.154* (1.70) |
| Number of children 0–4 | 0.022 (0.71) | 0.025 (0.81) | 0.002 (0.05) | 0.006 (0.14) | 0.028 (0.63) | 0.031 (0.69) |
| Number of children 5–11 | 0.081*** (3.55) | 0.093*** (4.12) | 0.068** (2.09) | 0.082** (2.55) | 0.075** (2.28) | 0.085*** (2.63) |
| Number of children 12–18 | 0.017 (0.84) | 0.028 (1.43) | −0.024 (0.85) | −0.006 (0.23) | 0.048* (1.65) | 0.053* (1.85) |
| Diploma (ref: none) | ||||||
| Primary 8 years | 0.522*** (8.98) | 0.494*** (8.64) | 0.427*** (5.24) | 0.397*** (4.95) | 0.616*** (7.36) | 0.588*** (7.14) |
| Vocational | 0.700*** (9.67) | 0.619*** (8.66) | 0.591*** (6.09) | 0.510*** (5.32) | 0.782*** (7.10) | 0.695*** (6.40) |
| Secondary | 0.882*** (11.95) | 0.813*** (11.15) | 0.765*** (7.50) | 0.690*** (6.85) | 0.971*** (8.98) | 0.903*** (8.47) |
| University | 0.911*** (10.47) | 0.796*** (9.23) | 0.752*** (6.62) | 0.633*** (5.63) | 1.053*** (7.56) | 0.935*** (6.77) |
| Muslim | −0.122*** (2.76) | −0.132*** (3.05) | −0.082 (1.30) | −0.092 (1.47) | −0.151** (2.47) | −0.162*** (2.70) |
| Urban | 0.264*** (6.67) | 0.225*** (5.79) | 0.250*** (4.54) | 0.212*** (3.92) | 0.289*** (5.08) | 0.250*** (4.48) |
| Expenditures (ref: more than adequate) | ||||||
| Just adequate | −0.490*** (6.69) | −0.490*** (4.85) | −0.488*** (4.61) | |||
| Less than adequate | −0.793*** (10.50) | −0.783*** (7.51) | −0.803*** (7.35) | |||
| Income ladder | 0.155*** (17.13) | 0.161*** (12.70) | 0.149*** (11.59) | |||
| Decomposition of variance | ||||||
| Explained between | 1.047 (35.7%) | 1.071 (36.7%) | 0.860 (31.6%) | 0.893 (32.8%) | 1.200 (38.9%) | 1.213 (39.7%) |
| Within | 0.024 (0.8%) | 0.028 (1.0%) | 0.024 (0.9%) | 0.029 (1.1%) | 0.024 (0.8%) | 0.027 (0.9%) |
| Unexplained between | 0.860 (29.3%) | 0.819 (28.1%) | 0.841 (30.9%) | 0.803 (29.5%) | 0.859 (27.9%) | 0.814 (26.7%) |
| Within | 1.000 (34.1%) | 1.000 (34.3%) | 1.000 (36.7%) | 1.000 (36.7%) | 1.000 (32.4%) | 1.000 (32.7%) |
| Observations | 12360 | 12360 | 6231 | 6231 | 6129 | 6129 |
| Log likelihood | −12473.2 | −12419.9 | −6239.8 | −6204.7 | −6215.1 | −6195.9 |
Source: Albanian LSMS 2002–2003–2004. Random effects ordered Probit models, estimated by a maximum likelihood method. Absolute values of t-statistics are in parentheses. Significance levels are respectively 1% (***), 5% (**) and 10% (*).
Random effects estimates of self-reported health.
Marital status also influences health outcomes. Single respondents have on average better subjective health status than married ones, while the effect is reversed for divorced or widowed respondents, who are more likely to be in poor health. These results may arise from the fact that age and marital status are strongly correlated in the sample, as most of the head of the household’s children living in the household are single. A striking result is that the number of children aged between 5 and 11 years positively affects self-assessed health. An explanation could be that those children are most often enrolled in primary school. Since the corresponding investment in human capital remains low, other individuals could benefit from more time and financial resources within the household.
Turning to education, it appears that more highly educated individuals have on average better outcomes for self-assessed health. On the one hand, better-educated people are also more knowledgeable about health, while on the other hand, education is strongly related to permanent income, meaning that it will pick up part of the resources effect. However, the influence of education is not linear. Health is notably improved when household members have had at least 8 years of primary schooling, but differences between vocational secondary training and graduate or postgraduate studies are not really significant.
When the head of the household indicates that the current level of expenditure for food and basic necessities is not adequate, then the health outcome is markedly reduced (column 1). In column 2, there is evidence of a positive relationship between the dependent variable and the position on the income ladder, meaning that richer individuals are more likely to be in better health. Finally, two interesting results are that individuals living in urban areas declare on average better health status than those living in rural areas and that self-assessed health outcome is worse for non-Muslim individuals.
As shown in columns (3), (4), (5) and (6) of Table 5, there are certain gender differences in the effects of individual characteristics. Women who are single, divorced or widowed are much more likely to be in poor health, while the effect of divorce or widowhood is hardly significant among men. While household resources influence the self-reported health of men and women to the same extent, it appears that the improving effect of education on health is more pronounced for women (especially those holding a secondary or university diploma). Finally, Muslim women are more likely to significantly report worse health.
For the various regressions, a decomposition of the explained and unexplained variance was realized to indicate the weights of the between and within components in Table 5; 36.5% of the total variance is explained. However, much of the explained variance is due to differences between individuals (the variance component amounts to 35.7%), while the within variance is very low (0.8%). As far as the unobserved variance is considered, it appears that the between and within components of the variances are of similar orders of magnitude, respectively 29.3% and 34.1%.
4. Discussion
Conclusions from the decomposition are twofold. First, differences in self-reported subjective health between individuals are much more marked than those over time. The within variance is approximately equal to one-third of the total variance, which is evidence of a strong state dependence in health in Albania. Variability in health essentially stems from differences in health among individuals in that country. Secondly, the selected characteristics introduced into the regression do not really explain the changes in the self-assessed measure of health over time. The decomposition was also separately performed for men and women. The weight of the explained variance is slightly lower among men, about 33% instead of 40%, but for both men and women the within component remains extremely low (1%). At the same time, the within unexplained component is slightly higher than the between unexplained component (see Table 5).
In order to better understand this phenomenon, the determinants of health evolution since the previous year were investigated. In particular, the objective is to determine whether answers given by individuals to this retrospective question are consistent both with their changes in self-reported health and with the more objective health problems that they report. As most respondents claim that their health has not changed (73.8%), the “much worse” and “somewhat worse” outcomes are grouped (8.1%), as well as the “somewhat better” and “much better” answers (18.2%). An ordered indicator is then built, equal to −1 when health is worse, 0 when health has not changed, and 1 when health is better. Since there is repeated information for all individuals, random effects ordered Probit models are again estimated.
The various estimates presented in Table 6 are on the whole coherent with those of Table 5. Women are more likely than men to report that their subjective health has deteriorated since the previous year. Health evolution is negatively correlated with age, this negative effect being considerable at over age 65. Divorced or widowed individuals also report more often a worsened health evolution compared with married people, while there is no significant difference between single and married individuals. Health evolution is correlated with the number of children aged between 5 and 11 years, and especially with the number of children between 12 and 18 years. Better economic conditions also positively affect health evolution, as shown by the positive coefficients of the various educational dummies and the position on the income ladder. Finally, health evolution is slightly better for people living in an urban area and for Muslim individuals.
| Explanatory variables | All | Men | Women | ||||
|---|---|---|---|---|---|---|---|
| (1) | (2) | (3) | (4) | (5) | (6) | (7) | |
| Female | −0.134*** (4.64) | −0.130*** (3.37) | −0.099*** (2.71) | ||||
| Age (ref : less than 25) | |||||||
| 25–34 | −0.191*** (3.05) | −0.190** (2.27) | −0.154* (1.92) | −0.279** (2.18) | −0.250** (2.06) | −0.102 (0.90) | −0.057 (0.53) |
| 35–44 | −0.397*** (5.86) | −0.352*** (3.83) | −0.284*** (3.23) | −0.345** (2.45) | −0.306** (2.29) | −0.326*** (2.64) | −0.232** (1.97) |
| 45 – 54 | −0.566*** (7.93) | −0.514*** (5.32) | −0.416*** (4.51) | −0.541*** (3.71) | −0.490*** (3.52) | −0.466*** (3.60) | −0.331*** (2.67) |
| 55 – 64 | −0.708*** (9.29) | −0.635*** (6.15) | −0.502*** (5.04) | −0.734*** (4.71) | −0.643*** (4.29) | −0.544*** (3.93) | −0.375*** (2.80) |
| 65 and above | −1.057*** (12.80) | −1.032*** (9.26) | −0.828*** (7.65) | −1.111*** (6.77) | −0.958*** (6.02) | −0.981*** (6.34) | −0.730*** (4.86) |
| Single | 0.080 (1.35) | 0.236*** (2.95) | 0.232*** (3.04) | 0.148 (1.23) | 0.127 (1.11) | 0.315*** (2.92) | 0.324*** (3.16) |
| Divorced or widowed | −0.161** (2.47) | −0.130 (1.50) | −0.102 (1.24) | −0.328 (1.60) | −0.290 (1.49) | −0.042 (0.44) | −0.023 (0.26) |
| Number of children 0–4 | 0.025 (0.95) | 0.075** (2.04) | 0.059* (1.66) | 0.041 (0.77) | 0.017 (0.32) | 0.108** (2.08) | 0.098** (1.98) |
| Number of children 5–11 | 0.045** (2.36) | 0.079*** (3.02) | 0.065*** (2.60) | 0.070* (1.75) | 0.055 (1.43) | 0.072** (2.01) | 0.060* (1.75) |
| Number of children 12–18 | 0.052*** (3.10) | 0.069*** (3.02) | 0.059*** (2.71) | 0.049 (1.39) | 0.044 (1.31) | 0.082*** (2.61) | 0.069** (2.29) |
| Diploma (ref: None) | |||||||
| Primary 8 | 0.236*** (5.17) | 0.225*** (3.66) | 0.183*** (3.14) | 0.193** (2.09) | 0.165* (1.88) | 0.235*** (2.82) | 0.190** (2.40) |
| Vocational | 0.281*** (4.94) | 0.255*** (3.34) | 0.193*** (2.65) | 0.174 (1.59) | 0.128 (1.23) | 0.308*** (2.80) | 0.244** (2.33) |
| Secondary | 0.331*** (5.74) | 0.384*** (4.96) | 0.298*** (4.05) | 0.276** (2.42) | 0.222** (2.05) | 0.446*** (4.15) | 0.343*** (3.35) |
| University | 0.322*** (4.69) | 0.348*** (3.80) | 0.251*** (2.88) | 0.322** (2.52) | 0.251** (2.07) | 0.297** (2.13) | 0.177 (1.33) |
| Muslim | 0.066* (1.94) | 0.012 (0.26) | −0.004 (0.09) | −0.004 (0.06) | −0.026 (0.40) | 0.027 (0.46) | 0.019 (0.34) |
| Urban | 0.053* (1.75) | 0.103** (2.55) | 0.090** (2.33) | 0.112* (1.86) | 0.100* (1.75) | 0.100* (1.80) | 0.082 (1.55) |
| Income ladder | 0.041*** (5.00) | 0.058*** (5.04) | 0.053*** (4.73) | 0.065*** (3.81) | 0.061*** (3.68) | 0.053*** (3.38) | 0.047*** (3.09) |
| Self-reported health in t worse than in t−1 | −0.302*** (6.96) | −0.387*** (5.97) | −0.236*** (4.02) | ||||
| Self−reported health in t better than in t−1 | 0.266*** (6.30) | 0.211*** (3.39) | 0.310*** (5.38) | ||||
| Chronic illness or disability longer than 3 months in t−1 | −0.346*** (7.52) | −0.326*** (4.60) | −0.360*** (5.97) | ||||
| Illness or injury during the last 4 weeks in t−1 | −0.058 (1.11) | 0.034 (0.40) | −0.118* (1.79) | ||||
| Observations | 12360 | 8240 | 8240 | 4154 | 4154 | 4086 | 4086 |
| Log likelihood | −8441.5 | −5037.1 | −5074.8 | −2435.7 | −2460.5 | −2587.6 | −2601.4 |
Source: Albanian LSMS 2002–2003–2004. Random effects ordered Probit models, estimated by a maximum likelihood method. Absolute values of t-statistics are in parentheses. Significance levels are respectively 1% (***), 5% (**) and 10% (*).
Random effects estimates of health evolution since last year.
Table 6 also assesses the robustness of the various measures of health available in the Albanian questionnaire. In order to establish whether or not answers regarding health evolution are consistent with self-reported health answers, two dummies are constructed, indicating a self-reported health worse in t than in t−1 and a self-reported health better in t than in t−1. The first dummy variable is expected to be negatively correlated with health evolution, while the correlation should be positive in the second case. The results reported in column (2) of Table 6 are consistent with some expectations.14 Individuals whose self-reported health outcome is lower in t than in t−1 more often claim that their health has deteriorated since last year, while those with a better self-reported health outcome in t than in t−1 more often claim that their health has improved since last year.
Another result in favor of the reliability of the dependent variable is that health evolution strongly depends on negative health shocks. In column (3) of Table 6, two additional regressors are introduced, related to more objective health problems present in t−1, i.e., existence of chronic illness or disability longer than 3 months and illness or injury during the last 4 weeks. The estimates show that health evolution is worse when respondents suffer from a chronic illness or disability, while the impact of illness or injury is of much lower magnitude and not significant at the conventional level. A possible interpretation is that the subjective measure of health evolution is influenced by more permanent health shocks than by more transitory illness or injury.
Columns (4), (5), (6) and (7) of Table 6 report estimates from gender-specific regressions: first, the negative effect of age on health evolution is less important for women than for men, especially at older ages. Secondly, both men and women have an appreciation of their health evolution that is consistent with answers given to self-reported health. Nevertheless, it appears that men who have a self-reported outcome in t worse than in t−1 have a proportionally higher tendency to claim that their health has deteriorated since the previous year. Thirdly, chronic illness and disability have a negative influence both for men and women, although illness or injury is negatively correlated with health evolution only for women at the 10% level.
5. Conclusion
While it is well known that self-reported measures of health status are strong predictors of true health, there is little empirical evidence on the dynamics of self-assessed health. Following Crossley and Kennedy [11], this paper explores the reliability of this indicator using longitudinal data collected in Albania in 2002, 2003 and 2004.
In particular, a focus is done on how respondents revise their answers to self-reported measures over time and how subjective measures of self-assessed health and health evolution are sensitive to more objective health shocks. The results indicate that the self-reported measure of health and its improvement over time are positively correlated with education, income and living in an urban area. Men self-report better health outcomes and better health evolution than women, but there are few gender differences in the impact of individual characteristics. There is also little variation over time in health status in Albania. Overall, the results show that respondents provide reliable information on their own health status and how it changes over time in Albania.
Appendix
Please refer Table A.
| Characteristics | Male | Female | All | |||
|---|---|---|---|---|---|---|
| Mean | s.d. | Mean | s.d. | Mean | s.d. | |
| Female | 0.000 | (0.000) | 1.000 | (0.000) | 0.496 | (0.500) |
| Age | ||||||
| Less than 25 | 0.150 | (0.357) | 0.171 | (0.377) | 0.161 | (0.367) |
| 25–34 | 0.144 | (0.352) | 0.163 | (0.369) | 0.154 | (0.361) |
| 35–44 | 0.234 | (0.424) | 0.231 | (0.422) | 0.233 | (0.423) |
| 45–54 | 0.201 | (0.401) | 0.190 | (0.393) | 0.196 | (0.397) |
| 55–64 | 0.145 | (0.352) | 0.141 | (0.348) | 0.143 | (0.350) |
| 65 and above | 0.124 | (0.330) | 0.103 | (0.305) | 0.114 | (0.318) |
| Single | 0.197 | (0.397) | 0.200 | (0.400) | 0.198 | (0.399) |
| Married | 0.784 | (0.411) | 0.710 | (0.454) | 0.747 | (0.434) |
| Divorced or widowed | 0.019 | (0.136) | 0.090 | (0.287) | 0.054 | (0.227) |
| Number of children 0–4 | 0.295 | (0.577) | 0.244 | (0.524) | 0.270 | (0.552) |
| Number of children 5–11 | 0.531 | (0.792) | 0.531 | (0.792) | 0.531 | (0.792) |
| Number of children 12–18 | 0.711 | (0.911) | 0.759 | (0.950) | 0.735 | (0.931) |
| Education | ||||||
| None | 0.155 | (0.362) | 0.198 | (0.398) | 0.176 | (0.381) |
| Primary | 0.441 | (0.497) | 0.486 | (0.500) | 0.463 | (0.499) |
| Secondary | 0.151 | (0.358) | 0.145 | (0.352) | 0.148 | (0.355) |
| Vocational | 0.161 | (0.368) | 0.114 | (0.317) | 0.138 | (0.345) |
| University | 0.093 | (0.290) | 0.057 | (0.233) | 0.075 | (0.264) |
| Muslim | 0.787 | (0.410) | 0.757 | (0.429) | 0.772 | (0.420) |
| Urban | 0.501 | (0.500) | 0.492 | (0.500) | 0.497 | (0.500) |
| Expenditures | ||||||
| More than adequate | 0.042 | (0.200) | 0.036 | (0.187) | 0.039 | (0.194) |
| Just adequate | 0.557 | (0.497) | 0.554 | (0.497) | 0.555 | (0.497) |
| Less than adequate | 0.401 | (0.490) | 0.410 | (0.492) | 0.406 | (0.491) |
| Income ladder | 4.074 | (1.677) | 4.022 | (1.659) | 4.048 | (1.668) |
| Number of observations | 6231 | 6129 | 12360 | |||
Source: Albanian LSMS 2002–2003–2004.
Description of the male and female pooled subsamples.
Footnotes
We would like to thank two anonymous reviewers and seminar participants at the Journées de Microéconomie Appliquée (Université de la Réunion, Saint-Denis) for their very helpful comments and suggestions on a previous draft. Any remaining errors are ours.
URLs: http://flseg.icl-lille.fr/, http://www.istc.fr, http://ngvaillant.e-monsite.com/ (N. Vaillant), http://www.sc-eco.univ-nantes.fr/~fcwolff (F.-C. Wolff).
Allison and Foster [1] propose a median-based approach with a partial inequality ordering which indicates any increase in inequality when the data are qualitative.
The detailed analysis of Lindeboom and van Doorslaer [20] points out that reporting heterogeneity may arise either from cut-point shift (all thresholds are shifted in parallel) or index shift (the thresholds are shifted in a dissimilar way).
Their results also indicate that heterogeneity accounts for about 30 percent of the unexplained variation in health and that selective attrition from the panel at each wave is expected to be strongly health-related (especially at older ages). Nevertheless, the survivorship bias does not affect the estimates of state dependence and socioeconomic status.
For further information on the economic situation in Albania, see http://www.worldbank.org.al.
A large proportion of migrants’ earnings is transferred back home [19]. According to the World Bank, remittances amount to 15% of Albania’s GDP.
These health indicators are still self-reported, but they are much more objective in the sense that they correspond to physical problems and not an overall health status that may be difficult to self-assess. In that sense, these indicators should not be subject to measurement errors.
The different threshold levels are supposed to be constant across individuals.
Similar calculations respectively for the “average” and “poor/very poor” status lead to proportions which are respectively equal to 4.3% and to 3.7%. However, the proportion of individuals indicating an “average” health condition is about twice as high. This suggests that people in poor health are much more likely to stay in poor health (perhaps owing to permanent disabilities), while the “average” category represents a much more changeable situation.
Very similar results are found for women, the proportions being respectively 66.3% in 2002, 78.2% in 2003 and 74.8% in 2004.
By definition, the 2002 wave cannot be used since there is only one measure of change in health, this information being given by the retrospective question.
As shown in Table 3, there is no significant difference by gender when comparing the two measures of changes in health over time.
Findings are very similar when considering hospital stays over the preceding 12 months.
As these two indicators of resources are highly correlated, two regressions for each subsample are estimated.
As the dataset includes information on self-reported health in 2002, 2003 and 2004, data from 2002 are excluded from the sample when studying health evolution. In 2003, it is possible to study the determinants of health evolution since 2002 and account for changes in self-reported health between 2002 and 2003. In 2002, there is by definition no information on self-reported health in 2001.
References
Cite this article
TY  - JOUR
AU  - Nicolas Vaillant
AU  - François-Charles Wolff
PY  - 2012
DA  - 2012/06/15
TI  - On the reliability of self-reported health: Evidence from Albanian data☆
JO  - Journal of Epidemiology and Global Health
SP  - 83
EP  - 98
VL  - 2
IS  - 2
SN  - 2210-6014
UR  - https://doi.org/10.1016/j.jegh.2012.04.003
DO  - 10.1016/j.jegh.2012.04.003
ID  - Vaillant2012
ER  -