
Ecological correlations of dietary food intake and mental health disorders
- DOI
- 10.1016/j.jegh.2016.12.001How to use a DOI?
- Keywords
- Omega-3 fatty acids; Sugar; Mental health; Epidemiology
- Abstract
This paper examines the ecological association of dietary food intake with mental health outcomes on the group level across countries. Published data from the World Mental Health Survey were used to compare lifetime prevalence of four categories of mental health disorders (anxiety disorders, mood disorders, impulse control disorders, and substance use disorders) with a country’s fish/seafood and sugar/sweetener supply quantity using the Spearman rank correlation. Data were compared for 17 countries across the world. Sugar and sweetener supply quantity was significantly and positively associated with anxiety disorders (rho = 0.75, p = 0.001), mood disorders (rho = 0.75, p = 0.001), impulse control disorders (rho = 0.78, p = 0.001), and substance use disorders (rho = 0.68, p = 0.007). Fish and seafood supply quantity had no significant association with any mental health disorders. Mental health disorders represent a significant health problem around the world. Public health measures aimed at improving the quality and availability of a nation’s food supply could have a significant positive impact on mental health. Further randomized studies are needed to further validate the study findings.
- Copyright
- © 2016 Ministry of Health, Saudi Arabia. Published by Elsevier Ltd.
- Open Access
- This is an open access article under the CC BY-NC-ND license (http://creativecommons.org/licenses/by-nc-nd/4.0/).
1. Introduction
Total expenditure on health as a percentage of a nation’s gross domestic product from 2000 to 2011 has greatly increased [1]. The greatest single contributor to public health expenditure is expected to come from mental illness. At an estimated 16.3 trillion US dollars in 2010 worldwide, mental illness will cost more than cardiovascular disease, and also more than cancer, diabetes, and chronic respiratory diseases combined [2]. Therefore, focusing public health attention on methods of enhancing mental health is of critical importance. Diet plays a role in virtually every major disease category [3–6], including mental health [7–12]. While dietary interventions on mental illness could be simple, cost-effective public health measures, their implementation is still limited by a lack of research indicating the context and populations in which these interventions might be most effective [10–12].
The external validity of studies monitoring the effect of various dietary interventions on contextual populations is only as great as the sample is representative. Although many studies, including those cited throughout this paper, describe various means through which diet can improve mental health in a given country, the results and conclusions of these studies cannot be rigorously applied to other countries. Examples of ecological effects that may indirectly impact mental health can include different cultural, political, and economic environments, among other factors. Only a global study can provide the contextual rigor needed to drive public health policy across the globe. This paper therefore examines two elements of the diet that may have an impact on mental health: one considered beneficial (fish/seafood), and one considered detrimental (sugars/sweeteners).
Fish and seafood is the major source of two of the three omega-3 fatty acids, or n-3 polyunsaturated fatty acids (PUFAs), in human physiology [13]. PUFAs, particularly n-3 PUFAs, play a critical role in maintaining brain function. When compared to rats fed on a control base diet, rats supplemented with the n-3 PUFA of 10% cod liver oil for 20 days showed an increase in cortex levels of serotonin and dopamine, the two most targeted neurotransmitters for psychiatric illnesses [14]. Clinical evidence supports the use of PUFAs in treating depression. A meta-analysis of randomized controlled trials in humans suggests that a diet including omega-3 fatty acids is beneficial for treating depressive symptoms [15]. However, the evidence for studies assessing the impact of PUFA supplementation on other mental health disorders is weak [16].
The impact of sugar on mental functioning is varied. Sugar is a key factor in mental functioning insofar as it is the almost exclusive energy source of the brain, and as such can improve short-term cognition [17,18]. However, chronic sugar consumption appears to produce opposite effects on cognition. Although rodent experiments have limited external validity for human studies, a systematic review of rodent studies showed that chronic sugar consumption led to cognitive impairments. Many of these studies used sugar levels that approximate the typical human consumption of about 5–20% of energy from added sugars [19]. In human studies, while sugar supplementation can improve children’s cognitive scores in areas where breakfast sugar intake is inadequate [20], a review found that the Western diet, characterized by excessive saturated fats and refined sugars, is associated with poorer brain function [21].
Besides cognition, mental health is adversely affected by excessive chronic sugar intake. While diabetes mellitus has been longitudinally associated with major depressive disorder (MDD) and generalized anxiety disorder (GAD) [22,23], these psychiatric conditions may predate the onset of insulin resistance, which is the hallmark of diabetes. The impact of sugar on mental health may be more directly mediated through reward pathways of the brain than through strictly metabolic functioning [24–27]. Four studies of soft drinks found an association of increased consumption with increased mental health burden, two of which focused on adolescents [28,29], one on young adults [30], and one on the general adult population [31]. Furthermore, Australian adolescents consuming a “Western” diet were found to have higher rates of ADHD than those on a “healthy” diet [32].
This study has two aims. We investigate whether there is any association between fish/seafood consumption and mental health, particularly mood disorders, on the group level across countries. We also investigate whether there is any association between sugar/sweetener consumption and mental health on the group level across countries.
2. Materials and methods
2.1. Study design
This was a secondary data analysis comparing public domain data on food supply with published data on mental health disorder epidemiology.
2.2. Food supply quantity
As data on national-level food consumption is very challenging to collect, apparent food consumption is measured through food supply quantity under the assumptions of supply and demand. Public data for fish/seafood supply and sugar/sweetener supply quantity were extracted from the statistics division of the Food and Agriculture Organization of the United Nations, both of which were located under the Food Balance Sheets domain. Considerations, standardization, and accuracy of the data collection process are discussed on the website of the database [33]. The category titled “Fish, Seafood (2960)” was used to measure fish and seafood supply quantity, and the category titled “Sugar & Sweeteners (2909)” was used to measure the combined sugar and sweetener supply quantity, with both categories measured in units of kg/capita/year. Both categories report aggregate summary statistics of individualized data. Sugar & Sweeteners combines data for fructose, chemically pure; maltose, chemically pure; cane sugar; beet sugar; maple sugar and syrups; sugar crops NES [not elsewhere specified]; sugar (raw centrifugal, non-centrifugal, and refined); molasses; other fructose and syrup; sugar and syrups NES; sugar confectionary; sugar flavored; glucose and dextrose; lactose; isoglucose (which includes sweeteners such as high fructose corn syrup); beverage non-alcoholic; and honey [34]. Fish and Seafood combines data for crustaceans; cephalopods; molluscs, other; demersal fish; freshwater fish; pelagic fish; and marine fish, other [34]. These data were obtained through a questionnaire submitted to each country’s respective national statistical office [35].
Data for each country were selected to match the year in which the World Mental Health Survey was being conducted (see below). If the World Mental Health Survey was conducted in more than one year, the fish/seafood and sugar/sweetener supply was calculated as an average of the numbers found in each year of the survey. Years potentially ranged from 2001 to 2005.
2.3. Mental health disorders
Lifetime prevalence of the mental health disorders of anxiety, mood disorders, substance abuse, and impulse control disorders were obtained for 17 countries from aggregate published data on mental disorder prevalence from 85,052 people. These data were collected using the World Mental Health Survey from 2001 to 2005, and the results for 17 countries were published in a scholarly journal [36]. A more detailed exposition of the methods, results, and comparisons of the data were subsequently published in a book [37].
Anxiety disorders assessed were: agoraphobia without panic disorder, generalized anxiety disorder, panic disorder, post-traumatic stress disorder, separation anxiety disorder, social phobia, and specific phobia. Mood disorders assessed were: dysthymic disorder, major depressive disorder, bipolar disorder I or II, or subthreshold bipolar disorder. Impulse control disorders assessed were: attention-deficit/hyperactivity disorder, conduct disorder, intermittent explosive disorder, and oppositional defiant disorder. Substance use disorders assessed refers to both drug and alcohol abuse, including further assessment of substance dependence.
Most World Mental Health Surveys examined stratified multistage clustered area probability household samples, usually based on census data. Twelve of the 17 surveys were based on nationally representative household samples. One was limited to only some states (Nigeria), two were primarily conducted in urban areas (Mexico and Colombia), and two were localized to only a select number of larger cities (3 in China, and 11 in Japan). Interviews were conducted in two waves: the first wave identified all persons who matched diagnostic criteria for any mental disorder, and the second wave followed-up on these persons, in addition to about 25% of the healthy population surveyed with more focused interviews [38]. Prevalence diagnoses were based on the Composite International Diagnostic Interview (CIDI) Version 3.0, which has moderately good to good agreement with DSM-IV diagnostic criteria [39]. Not every subtype of a mental disorder category was assessed in every country. Only the United States, Mexico, and Colombia assessed all four categories of impulse control disorders; Israel, New Zealand, and South Africa did not have any data on impulse control disorders. The Western European countries did not include bipolar disorders when surveying mood disorders or drug dependence when surveying substance use disorders [36].
2.4. Statistical analysis
Descriptive statistics were calculated for food supply and mental health disorders. Inferential analyses of Spearman correlation were performed to correlate the aggregate fish/seafood and sugar/sweetener variables with the aggregate mental health disorder variables. Significance used a two-tailed p value of p < 0.05. Analyses were done with Stata/SE Version 12.0 [40].
3. Results
3.1. Descriptive statistics
Table 1 reports the mean values for food supply quantity. Fish/seafood had mean values above 20 kg/capita/year while sugar/sweetener almost doubled the amount at greater than 40 kg/capita/year. Table 2 reports the mean values for mental health disorder prevalence. Prevalence ranged from approximately 6–15%. Anxiety disorders had the highest prevalence. Impulse control disorders had the lowest prevalence.
| Variable | Mean | SD |
|---|---|---|
| Sugar/sweetener supply (kg/capita/year) | 41.03 | 17.06 |
| Fish supply (kg/capita/year) | 22.00 | 15.24 |
Note: SD = standard deviation.
Data were obtained from [33].
Descriptive statistics of food supply quantity in each country.
| Variable | Mean number | Mean percentage (%) | SE (%) |
|---|---|---|---|
| Anxiety disorders prevalence | 681.12 | 14.6 | 7.54 |
| Mood disorders prevalence | 691.94 | 12.5 | 5.52 |
| Impulse control disorders prevalence | 136.71 | 6.1 | 6.04 |
| Substance use disorders prevalence | 359.24 | 7.6 | 4.24 |
Note: SE = standard error. Mean number refers to the mean number of respondents studied that had the indicated disorder. Mean percentage refers to the overall mean prevalence of the disorder within the surveyed sample, and the SE expresses the variability of that prevalence.
Data were obtained from [36].
Descriptive statistics of mental health disorder prevalence in each country.
3.2. Food supply quantity
Table 3 reports the sugar/sweetener supply quantity. China had the lowest supply quantity. The United States had the highest supply quantity. Both China and Nigeria had mean supply quantity below 11 kg/capita/year. All the other 15 countries had mean supply quantity above 30 kg/capita/year. Table 4 reports the fish/seafood supply quantity. Colombia had the lowest supply quantity below 6 kg/capita/year. Japan had the highest supply quantity at slightly above 66 kg/capita/year.
| Country | 2001 | 2002 | 2003 | 2004 | 2005 | Mean | SD |
|---|---|---|---|---|---|---|---|
| Belgium | 57.18 | 54.36 | – | – | – | 55.77 | 1.99 |
| China, mainland | – | 5.74 | 6.34 | – | – | 6.04 | 0.42 |
| Colombia | – | – | 63.24 | – | – | 63.24 | – |
| France | 40.75 | 41.33 | – | – | – | 41.04 | 0.41 |
| Germany | – | 45.15 | 48.38 | – | – | 46.77 | 2.28 |
| Israel | – | 44.24 | 39.22 | 27.37 | – | 36.94 | 8.66 |
| Italy | 32.01 | 31.32 | – | – | – | 31.67 | 0.49 |
| Japan | – | 29.77 | 30.04 | – | – | 29.91 | 0.19 |
| Lebanon | – | 37.26 | 37.94 | – | – | 37.60 | 0.48 |
| Mexico | 49.87 | 50.14 | – | – | – | 50.01 | 0.19 |
| Netherlands | – | 46.13 | 47.91 | – | – | 47.02 | 1.26 |
| New Zealand | – | – | – | 60.06 | 61.44 | 60.75 | 0.98 |
| Nigeria | – | 10.65 | 10.39 | – | – | 10.52 | 0.18 |
| South Africa | – | – | 31.85 | 30.74 | – | 31.30 | 0.78 |
| Spain | 34.23 | 33.84 | – | – | – | 34.04 | 0.28 |
| Ukraine | – | 44.65 | – | – | – | 44.65 | – |
| United States | – | 70.59 | 70.04 | – | – | 70.32 | 0.39 |
Note: SD = standard deviation.
The data in the columns ranked by year derive directly from the United Nations’ Food and Agriculture Organization database [33]. The means expressed are the average quantity of sugar/sweetener supply across all years shown in the table which contained data.
Sugar/sweetener supply quantity (kg/capita/year) in each country.
| Country | 2001 | 2002 | 2003 | 2004 | 2005 | Mean | SD |
|---|---|---|---|---|---|---|---|
| Belgium | 22.23 | 21.67 | – | – | – | 21.95 | 0.40 |
| China, mainland | – | 24.66 | 25.02 | – | – | 24.84 | 0.25 |
| Colombia | – | – | 5.48 | – | – | 5.48 | – |
| France | 33.79 | 34.19 | – | – | – | 33.99 | 0.28 |
| Germany | – | 13.81 | 14.04 | – | – | 13.93 | 0.16 |
| Israel | – | 21.16 | 22.21 | 23.35 | – | 22.24 | 1.10 |
| Italy | 24.42 | 23.55 | – | – | – | 23.99 | 0.62 |
| Japan | – | 67.72 | 65.54 | – | – | 66.63 | 1.54 |
| Lebanon | – | 7.96 | 8.13 | – | – | 8.05 | 0.12 |
| Mexico | 9.71 | 10.26 | – | – | – | 9.99 | 0.39 |
| Netherlands | – | 19.95 | 18.90 | – | – | 19.43 | 0.74 |
| New Zealand | – | – | – | 26.48 | 27.09 | 26.79 | 0.43 |
| Nigeria | – | 8.89 | 9.31 | – | – | 9.10 | 0.30 |
| South Africa | – | – | 7.06 | 9.84 | – | 8.45 | 1.97 |
| Spain | 43.01 | 42.40 | – | – | – | 42.71 | 0.43 |
| Ukraine | – | 13.11 | – | – | – | 13.11 | – |
| United States | – | 22.66 | 23.97 | – | – | 23.32 | 0.93 |
Note: SD = standard deviation.
The data in the columns ranked by year derive directly from the United Nations’ Food and Agriculture Organization database [33]. The means expressed are the average quantity of fish/seafood across all years shown in the table which contained data.
Fish/seafood supply quantity (kg/capita/year) in each country.
3.3. Correlation results
Table 5 shows that sugar/sweetener supply quantity was positively and statistically significantly correlated with all four mental health disorder prevalence values. Anxiety disorders (p = 0.001), mood disorders (p = 0.001), and impulse control disorders (p = 0.001) each had strong positive correlations with sugar/sweetener supply quantity. Substance use disorders (p = 0.007) had a moderately strong correlation with sugar supply quantity. While the correlations were quite similar in magnitude, impulse control disorders had the highest magnitude of correlation with sugar/sweetener supply quantity. Fish/seafood supply quantity was not significantly correlated with any of the four mental health disorder prevalence values. Figs. 1 and 2 show the associated scatter plots.
| Food supply | Anxiety disorders | Mood disorders | Impulse control disorders | Substance use disorders | ||||
|---|---|---|---|---|---|---|---|---|
| rho | p value | rho | p value | rho | p value | rho | p value | |
| Fish/seafood | −0.24 | 0.348 | 0.09 | 0.719 | −0.27 | 0.358 | −0.24 | 0.363 |
| Sugar/sweetener | 0.75 | 0.001 | 0.75 | 0.001 | 0.78 | 0.001 | 0.63 | 0.007 |
Correlation of food supply quantity with mental health disorder prevalence.
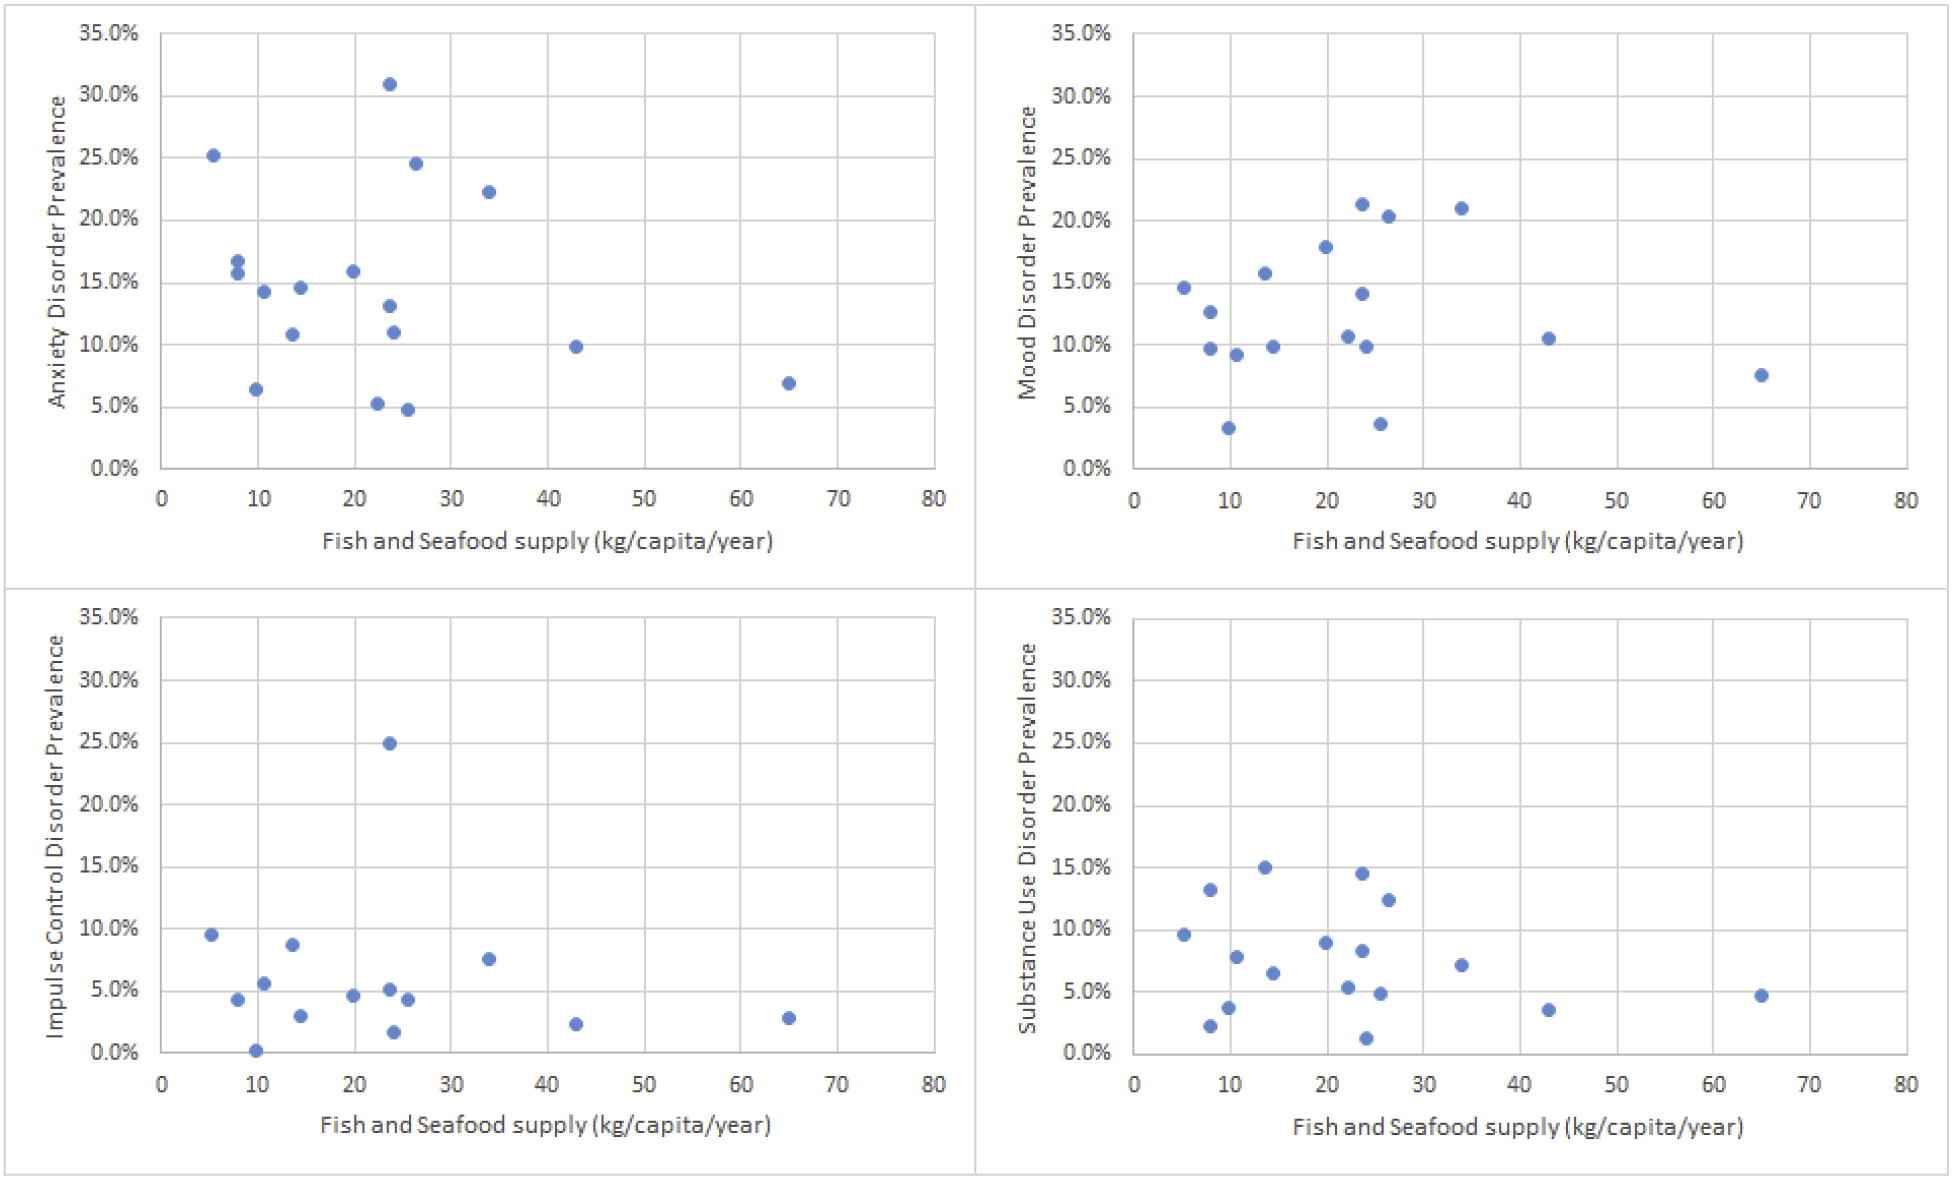
Scatter plots of mental health disorders with fish and seafood supply.
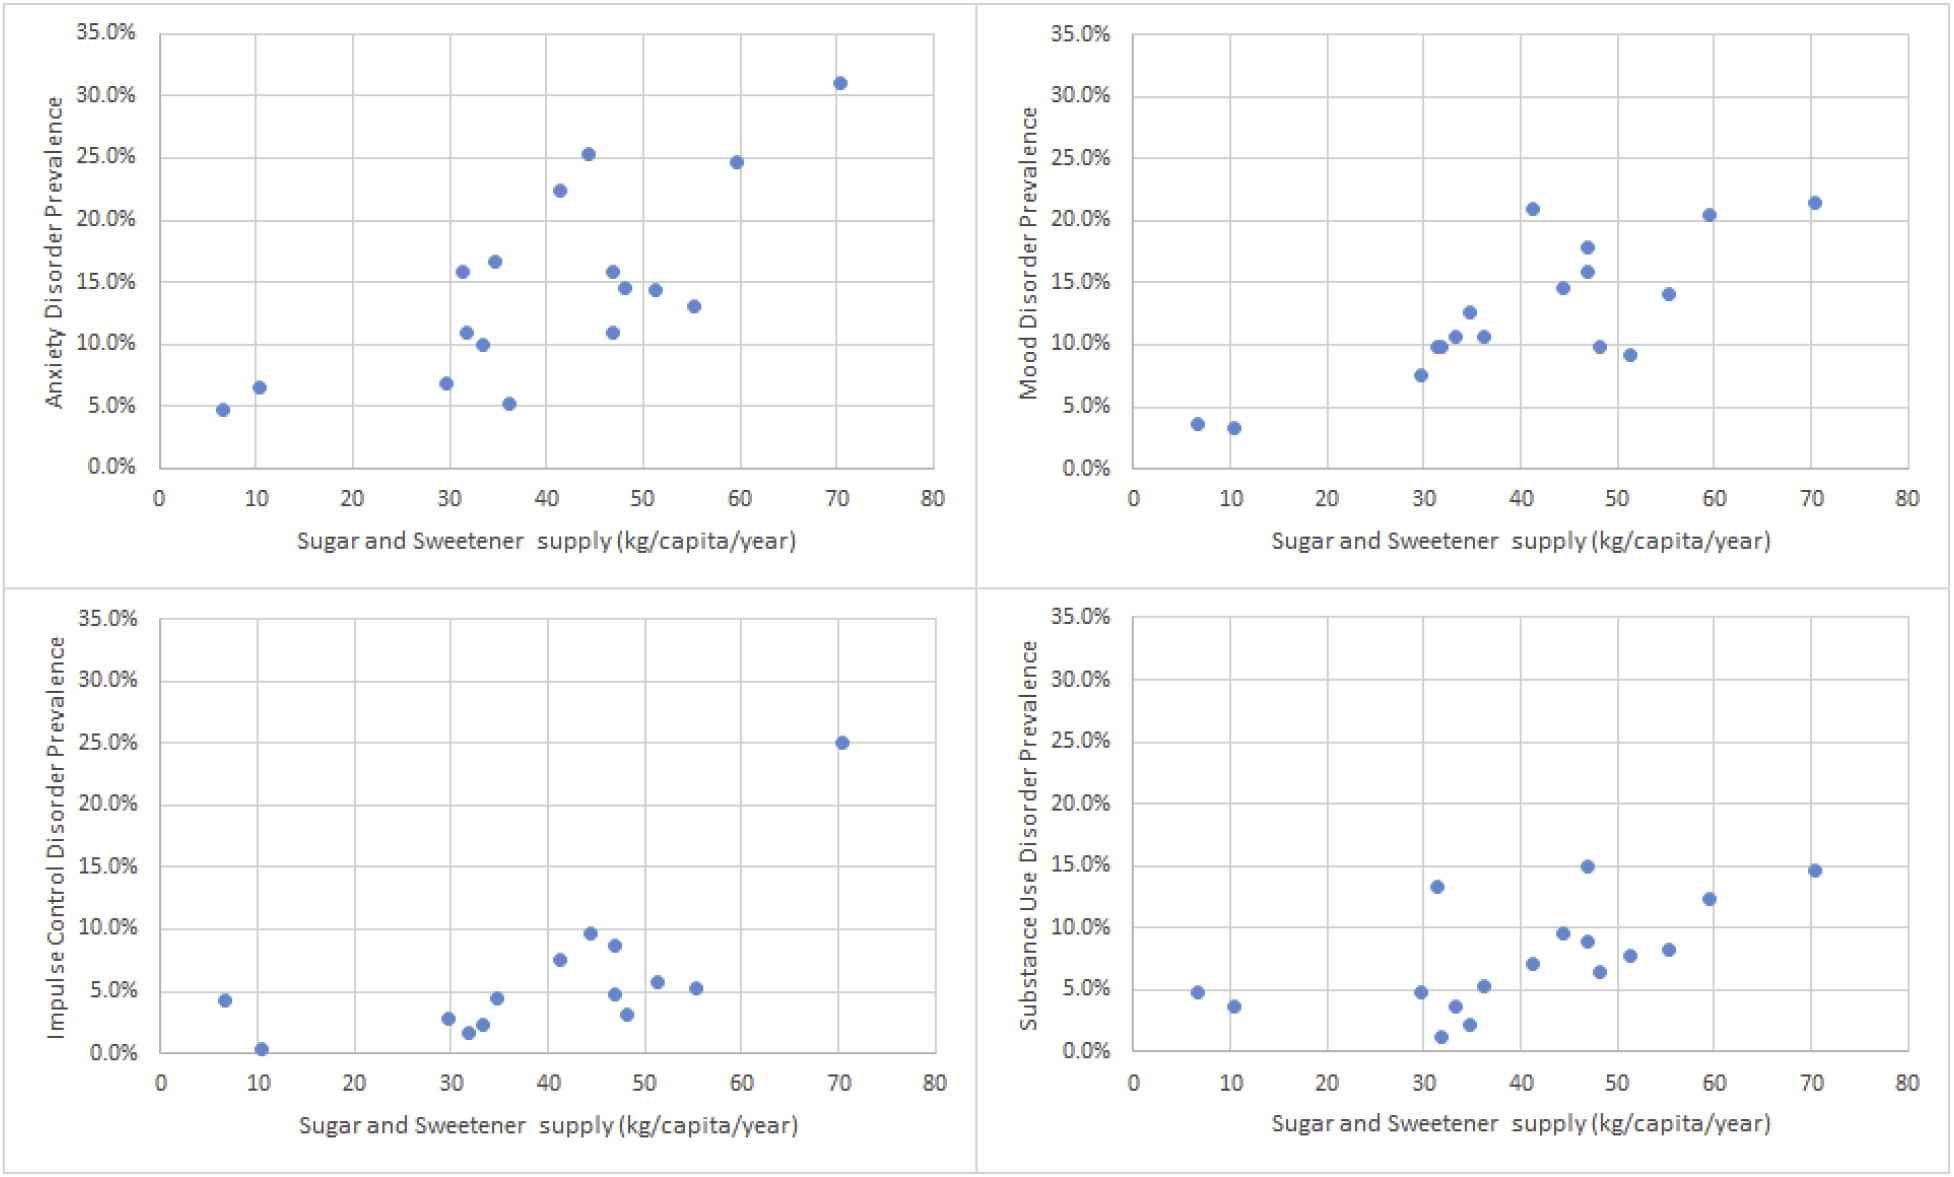
Scatter plots of mental health disorders with sugar and sweetener supply.
4. Discussion
Our ecological study examined the association between four categories of mental health disorders and two components of nutrition. We found that sugar/sweetener supply quantity was significantly positively correlated with all mental health disorder prevalence values. Fish/seafood supply quantity was not associated with any mental health disorder prevalence values.
Sugar/sweetener supply quantity was significantly associated with all four mental disorder prevalence values. The close association of sugar with the brain reward system suggests that distortions in the dopaminergic and opioid transmission pathways [26] may play a role in developing mental disorders. However, we caution that this relationship between sugar and mental health may not be as direct as our study suggests. Other explanations beyond sugar causing mental illness are equally valid. While excess sugar intake may be thought to contribute to mental illness, it may be that those with a mental illness tend to consume more rewarding foods to cope [41]. It may also be that a third different variable contributes simultaneously to higher sugar consumption and greater susceptibility to mental illness, such as decreased intake of micronutrients [10]. As only hypotheses can be generated from an ecological analysis such as our study, other studies should more rigorously address possibly relevant third variables.
While much rodent research implicates n-3 PUFAs with mental health, our study showed no significant association of fish/seafood quantity supply with mental health prevalence values. The non-significance of fish/seafood supply with mood disorder prevalence differs from a study suggesting benefits of PUFAs with improved depressive symptoms, a type of mood disorder [15], but is consistent with the literature reporting limited evidence for PUFAs and non-mood mental health disorders [16]. Also, there is the possibility that while our results suggest a lack of association, they may also reflect an imperfection in the measure of fish itself as a marker for PUFA intake. Several reasons may explain this. First, part of the measure of fish included an estimation of fish supply in sectors where official data were incomplete. Second, fish supply quantity likely overestimates fish consumption because any fish that spoils is typically not eaten. Third, while all fish have two of the three types of n-3 PUFAs, the amount varies both with the type of fish and the environment which it lives in [13]. Fourth, fish and seafood as a marker for n-3 PUFAs may also be imperfect, as such oils can be found in other foods besides fish, including fortified dairy or whole foods such as flaxseed or nuts. Finally, it may be that PUFAs only indirectly improve mental health, so any factor that mediates that relationship, such as when PUFAs enhance cardiovascular health and then impact mental health [42], could be distorted when other factors also impact cardiovascular health. Public health measures to improve mental health outcomes by increasing fish/seafood availability may be futile unless further investigations can substantiate such a relationship.
4.1. Limitations
While the assumptions underlying an ecological approach to psychiatric health are myriad [43], a few principles must be understood while interpreting this and similar studies. First, the characteristics and life conditions of any studied population should be representative of the population at large. While the approach to acquiring data was standardized for both independent and dependent variables, the response to that approach may vary from country to country. Methodological differences of note include that only 12 of 17 countries had nationally representative data, and not all subtypes of mental health disorder categories were fully evaluated in certain countries, such as with bipolar disorder in the mood disorders category. Furthermore, in this study, while food resources are available to the entire population, the World Mental Health Surveys were only distributed to adults (minimum 18 years of age, although New Zealand set the minimum age at 16). Finally, and perhaps most importantly, any significant findings associated with an ecological analysis may be due to a direct relationship, an indirect relationship, or a spurious third-variable association. As such, these studies should not be taken as definitive scientific evidence of causality, but should be used to generate ideas for testable hypotheses, or inform policy in large-scale settings where controlled experimentation is impracticable.
4.2. Conclusions
In conclusion, further investigations of diet on mental health are warranted. Randomized controlled trials to validate hypotheses regarding the use of sugars and sweeteners on mental health are needed, as evidenced by the lack of randomized controlled trials guiding this paper’s initial hypotheses of consumption of sugar and sweeteners on mental health. Such future studies would need to consider use of artificial sweeteners, as artificial sweeteners can have similar effects as sugar on the brain’s reward system [44–46]. Additionally, while the World Mental Health Surveys only examined mental health outcomes in adults, adolescents may gain the most from studies implementing a sugar-limited diet. Adolescents have a more malleable response to rewards than the adult population [47,48], and the impact of intervening in young adults would potentially occur over a full lifetime.
Author contributions
Jordan: research idea, data gathering, paper drafting.
Joshua Fogel: statistical analysis, paper drafting.
Benjamin Van Voorhees: research idea, epidemiological approach, paper drafting.
Conflict of interest
The authors declare that they have no conflict of interests.
This research received no specific grant from any funding agency, commercial or not-for-profit sectors.
The manuscript does not contain clinical studies or patient data, and has not required approval from an ethics committee.
Acknowledgements
We thank Daniela DeFrino, PhD, RN for her editorial consultation; and John Paul, BA for his assistance in data collection and organization.
References
Cite this article
TY  - JOUR
AU  - Jordan Hoerr
AU  - Joshua Fogel
AU  - Benjamin Van Voorhees
PY  - 2016
DA  - 2016/12/18
TI  - Ecological correlations of dietary food intake and mental health disorders
JO  - Journal of Epidemiology and Global Health
SP  - 81
EP  - 89
VL  - 7
IS  - 1
SN  - 2210-6014
UR  - https://doi.org/10.1016/j.jegh.2016.12.001
DO  - 10.1016/j.jegh.2016.12.001
ID  - Hoerr2016
ER  -