
Population-attributable fraction of hypertension associated with obesity, abdominal obesity, and the joint effect of both in the Central Provinces of Iran
- DOI
- 10.1016/j.jegh.2016.11.002How to use a DOI?
- Keywords
- Hypertension; Obesity; Odds ratio; Population-attributed fraction; Prevalence
- Abstract
The prevalence of obesity has been increasing in Iran over the past decade. This study aimed to determine the population-attributable fraction (PAF) of hypertension associated with obesity, abdominal obesity, and the joint effect of both in the central provinces of Iran. Prevalence of hypertension was extracted from the Iranian Ministry of Health Non-Communicable Disease Risk Factor InfoBase 2009. Measure of association between obesity and hypertension was extracted from Tehran Lipid and Glucose Study, for males and females, in order to calculate the PAF of hypertension associated with obesity. Age standardization of the reported prevalence of obesity was done using the World Health Organization method. The PAF of hypertension associated with the joint effect of obesity and abdominal obesity in females was highest in Semnan Province: 22.7 [95% confidence interval (CI): 4.2–35.6], followed by Qom 21.09 (95% CI: 3.7–33.1), and Yazd 20.3 (95% CI: 3.5–32.1). In males, the highest PAF was observed in Qom Province 31.07 (95% CI: 16.7–41.1), followed by Semnan 29.6 (95% CI: 15.9–39.3), Qazvin 25.9 (95% CI: 13.7–34.5), Tehran 24.2 (95% CI: 12.7–32.3), and Isfahan 20.4 (95% CI: 3.5–27.4). Prevalence of hypertension is higher in more developed provinces. PAFs suggest that a sizable share of hypertension in these provinces is associated with obesity. It is recommended that health promotion programs focus on obesity in the provinces with a higher share of hypertension due to obesity.
- Copyright
- © 2016 Ministry of Health, Saudi Arabia. Published by Elsevier Ltd.
- Open Access
- This is an open access article under the CC BY-NC-ND license (http://creativecommons.org/licenses/by-nc-nd/4.0/).
1. Introduction
Hypertension is one of the major risk factors for cardiovascular diseases. It affects over one billion of the world’s population and is the main underlying cause of stroke and heart attack [1]. It is estimated that by 2025, the prevalence of hypertension will be increased by 60% to >1.5 billion [2].
The World Health Organization estimates that 600 million people around the world are at risk of major cardiovascular events including myocardial infarction, stroke, and heart failure due to high blood pressure. Furthermore, hypertension counts for 13% of all mortality, which corresponds to 7.1 million deaths/y. It is also responsible for 62% of all strokes and 49% of all myocardial infarctions [1,2].
According to the 2009 National Survey of Non-Communicable Diseases Risk Factors in Iran, around 16% of the population between the ages of 15 years and 64 years are hypertensive [1].
The results of various studies on risk factors for noncommunicable diseases in Iran show that 11% of males and 11.9% of females have high blood pressure >160/95 mmHg, and a recent study indicated that 16.9% of males and 14.7% of females aged >20 years have high blood pressure >140/90 mmHg [1–5].
Age, sex, race, socioeconomic condition, smoking, and obesity are among the most important risk factors of hypertension [4]. There is a strong correlation between body weight and hypertension; as weight increases, the risk of high blood pressure increases by 2–6-fold [5]. For every 10 kg increase in weight, systolic blood pressure increases by 2–3 mmHg [4]. Obesity can predict hypertension in later life [5]. Obesity is a modifiable risk factor of cardiovascular diseases. Several studies have shown that weight loss, even moderate, can reduce systolic hypertension and cardiovascular risk consequently [6–8].
The most prevalent effects of being overweight and obese on health include hypertension, dyslipidemia, and coronary heart disease [9]. In 2005, 937 million adults around the world were overweight, and the number of obese people was 396 million [10]. These numbers were doubled, compared with 20 years ago [11]. For instance, in the Middle East and North Africa, it was stated that >60% of cases of stroke are associated with hypertension [12].
According to the Global Burden of Disease Study 2010 (GBD 2010), the three risk factors that account for the most disease burden in Iran are dietary risks, high blood pressure, and high body mass index (BMI). The leading risk factors for children aged <5 years and adults aged 15–49 years were childhood underweight and at dietary risks, respectively. In 2010, of the burden of disease attributable to 15 leading risk factors in Iran, the second most important risk factor was high blood pressure and the third factor was being overweight and obesity [13]. Various studies in Iran demonstrated that the prevalence of obesity (BMI > 30) in Iran is 14.4% among males and 29.5% for females [1,2]. The prevalence of obesity in Iran is high and is growing rapidly [1]. Little is known about the impact of obesity and abdominal obesity on hypertension in Iran and its provinces. This study, aimed to determine the population-attributable fraction (PAF) of hypertension associated with obesity, abdominal obesity, and the joint effect of them in the central provinces of Iran.
2. Materials and methods
In this study, prevalence of obesity according to age and sex in different Iranian provinces was extracted from the Iranian Ministry of Health Non-Communicable Disease Risk Factor InfoBase in 2009. The national surveillance of risk factors for noncommunicable diseases have become executive since 2004 and have been repeated five times at the provincial level (2004, 2006, 2007, 2008, and the most recent in 2009). A World Health Organization method was used for age standardization of the prevalence of hypertension across different provinces [14]. In 2009 survey, 89,404 persons were chosen from the whole province using a systematic approach and multistage cluster sampling method. The appropriateness of the selected cluster distribution with the distribution of the number of households in different areas of the province and the rural and urban populations was sampling specifications. Data collection included three steps as follows: Step 1 (verbal): collection of questionnaire-based information about demographics and health behaviors included basic sociodemographics, tobacco use, alcohol consumption, fruit and vegetable consumption, and physical inactivity; Step 2 (physical): collection of information about height, weight, waist circumference, and blood pressure; and Step 3 (biological): collection of biochemical measures including fasting blood sugar and fasting total cholesterol.
Measure of association between obesity and hypertension [odds ratio (OR) adjusted for confounding factors such as age, smoking, and education level] was extracted from the Tehran Lipid and Glucose Study (TLGS), in which 8647 persons aged 20–70 years old (3622 men and 5025 women) were selected by multistage random sampling [15]. The extracted OR was adjusted for confounding factors such as age, smoking and education level. Measure of association of hypertension due to obesity for males (OR = 2.5, 95% CI: 1.8–3.4), and females (OR = 2.8, 95% CI: 1.9–4.2), and measure of association of hypertension due to abdominal obesity for males (OR = 1.5, 95% CI: 1.1–2.0), and females (OR = 1.1, 95% CI: 0.8–1.5) were extracted from the TLGS.
BMI and waist-to-hip ratio are measures for comparing waist circumference to hip circumference. Waist circumference were measured with a meter at the lowest point between the chest and the lower end of the umbilicus and hip circumference were measured at the widest location. If the waist-to-hip ratio is >1 (in male) and 8.0 (in female), the risk is more widely accepted as a risk factor for cardiovascular disease, diabetes, and hypertension [17,18].
Iran consists of 31 provinces. Due to rapid urbanization and industrialization, being overweight and obesity are more common in central Iran compared with the rest of country. Therefore, the central provinces including Tehran, Yazd, Isfahan, Qazvin, Qom, Semnan, and Markazi were included in this study. The following equations were used to calculate the PAF in different central provinces of Iran for obesity and abdominal obesity.
Eq. (1) was used to calculate the impact of obesity and central obesity separately, and Eq. (2) was used to calculate the joint effect. In Eq. (1), P indicates prevalence of hypertension, and OR indicates odds ratio of hypertension associated with obesity, and in Eq. (2), the deduction of parenthesis’ difference is attributable to the population of each of the risk factors of obesity and central obesity [19]. The PAF was calculated based on the percentage obtained from high and low confidence intervals. All calculations were performed using Microsoft Excel (Microsoft Inc., Seattle, WA-USA) spreadsheets:
3. Results
The PAF of hypertension associated with obesity in females was highest in Semnan Province 22.3 (95% CI: 16.5–26.3), followed by Qom 20.9 (95% CI: 15.5–24.6), and Yazd 20.3 (95% CI: 15.06–23.9). In males, the highest PAF was observed in Qom Province 22.5 (95% CI: 16.5–26.5), followed by Semnan 21.5 (95% CI: 15.8–25.5), Qazvin 19.1 (95% CI: 14.1–22.6), Tehran 17.9 (95% CI: 13.2–21.3), and Isfahan 15.4 (95% CI: 11.4–18.3). Almost 35.0% of males’ hypertension in Qom Province, and 37.3% of females’ hypertension in Semnan Province can be attributed to obesity. Table 1 shows age group 55–65 years have the highest PAF associate with obesity. The PAF of hypertension associated with obesity in those aged 55–65 years in males of Isfahan was 7.4% (95% CI: 5.4–8.8) and in females 7.3% (95% CI: 5.4–8.6), and in Tehran for males it was 7.1% (95% CI: 5.1–8.3) and for females it was 7.8% (95% CI: 8.5–9.2), which shows the aging effects of obesity on blood pressure increase (Table 1).
| Province | Sex | Age groups (y) | Age-adjusted prevalence | Percent population-attributable fraction | |
|---|---|---|---|---|---|
| Point estimates of the odds ratio | 95% Confidence interval | ||||
| Isfahan | Male | 35–44 | 5.2 | 3.3 | 2.5–4.02 |
| 45–54 | 7.2 | 4.6 | 3.4–5.5 | ||
| 55–65 | 11.5 | 7.4 | 5.4–8.8 | ||
| Age-adjusted | 24.1 | 15.4 | 11.4–18.3 | ||
| Female | 35–44 | 3.3 | 2 | 1.4–2.3 | |
| 45–54 | 8.1 | 4.8 | 3.6–5.7 | ||
| 55–65 | 12.1 | 7.3 | 5.4–8.6 | ||
| Age-adjusted | 23.6 | 14.1 | 10.5–16.7 | ||
| Tehran | Male | 35–44 | 7.3 | 4.7 | 3.4–5.6 |
| 45–54 | 9.6 | 6.2 | 4.5–7.3 | ||
| 55–65 | 10.9 | 7.02 | 5.1–8.3 | ||
| Age-adjusted | 27.9 | 17.9 | 13.2–21.3 | ||
| Female | 35–44 | 7.05 | 4.2 | 3.1–4.9 | |
| 45–54 | 11.2 | 6.7 | 5.02–7.9 | ||
| 55–65 | 13.1 | 7.8 | 8.5–9.2 | ||
| Age-adjusted | 31.4 | 18.8 | 13.9–22.2 | ||
| Semnan | Male | 35–44 | 6.7 | 4.3 | 3.2–5.1 |
| 45–54 | 13.3 | 8.5 | 6.3–10.1 | ||
| 55–65 | 13.3 | 8.6 | 6.3–10.1 | ||
| Age-adjusted | 33.5 | 21.5 | 15.8–25.5 | ||
| Female | 35–44 | 11.6 | 6.9 | 5.1–8.2 | |
| 45–54 | 11.8 | 7.1 | 5.2–8.3 | ||
| 55–65 | 13.7 | 8.2 | 6.1–9.7 | ||
| Age-adjusted | 37.3 | 22.3 | 16.5–26.3 | ||
| Qazvin | Male | 35–44 | 7.9 | 5.09 | 3.7–6.03 |
| 45–54 | 9.3 | 6.04 | 4.4–7.1 | ||
| 55–65 | 12.4 | 8 | 5.8–9.4 | ||
| Age-adjusted | 29.7 | 19.1 | 14.1–22.6 | ||
| Female | 35–44 | 8.08 | 4.8 | 3.5–5.7 | |
| 45–54 | 10.7 | 6.4 | 4.7–7.5 | ||
| 55–65 | 11.9 | 7.1 | 5.2–8.4 | ||
| Age-adjusted | 30.7 | 18.4 | 13.6–21.6 | ||
| Qom | Male | 35–44 | 9.1 | 5.8 | 4.3–6.9 |
| 45–54 | 12.3 | 7.9 | 5.8–9.4 | ||
| 55–65 | 13.5 | 8.6 | 6.4–10.3 | ||
| Age-adjusted | 35.02 | 22.5 | 16.5–26.6 | ||
| Female | 35–44 | 6.7 | 4.07 | 3.01–4.7 | |
| 45–54 | 15.02 | 9.01 | 6.6–10.6 | ||
| 55–65 | 13.1 | 7.8 | 5.8–9.2 | ||
| Age-adjusted | 34.9 | 20.9 | 15.5–24.6 | ||
| Markazi | Male | 35–44 | 4.3 | 2.8 | 2.08–3.3 |
| 45–54 | 6.3 | 4.09 | 3.03–4.8 | ||
| 55–65 | 8.3 | 5.3 | 3.9–6.3 | ||
| Age-adjusted | 19.1 | 12.3 | 9.07–14.5 | ||
| Female | 35–44 | 5.1 | 3.1 | 2.3–3.6 | |
| 45–54 | 8.7 | 5.2 | 3.8–6.1 | ||
| 55–65 | 11.2 | 6.7 | 4.9–7.9 | ||
| Age-adjusted | 25.1 | 15.09 | 11.1–17.7 | ||
| Yazd | Male | 35–44 | 5.09 | 3.2 | 2.4–3.8 |
| 45–54 | 8.5 | 5.5 | 4.05–6.5 | ||
| 55–65 | 8.2 | 5.2 | 3.8–6.2 | ||
| Age-adjusted | 21.8 | 14.06 | 10.3–16.6 | ||
| Female | 35–44 | 8.7 | 5.2 | 3.8–6.1 | |
| 45–54 | 10.7 | 6.4 | 4.7–7.5 | ||
| 55–65 | 14.4 | 8.6 | 6.4–10.2 | ||
| Age-adjusted | 33.9 | 20.3 | 15.06–23.9 | ||
Hypertension attributable to obesity in central provinces of Iran by sex and age groups, 2009.
The PAF of hypertension associated with abdominal obesity in females was not significant. However, in males, the highest PAF observed in Qom Province was 11.5 (95% CI: 3.1–17.5), followed by Semnan 11.1 (95% CI: 3.0–16.7), Qazvin 9.8 (95% CI: 2.6–14.8), Tehran 9.2 (95% CI: 2.5–13.9), and Isfahan 7.9 (95% CI: 2.5–12.0) (Table 2).
| Province | Sex | Age groups (y) | Age-adjusted prevalence | Percent population-attributable fraction | |
|---|---|---|---|---|---|
| Point estimates of the odds ratio | 95% Confidence interval | ||||
| Isfahan | Male | 35–44 | 5.2 | 1.7 | 2.6–0.4 |
| 45–54 | 7.2 | 2.3 | 3.6–0.6 | ||
| 55–65 | 11.5 | 3.8 | 5.7–1.04 | ||
| Age-adjusted | 24.1 | 7.9 | 12.05–2.1 | ||
| Female | 35–44 | 3.3 | 0.3 | 1.1–0.8 | |
| 45–54 | 8.1 | 0.7 | 2.6–2.03 | ||
| 55–65 | 12.1 | 1.09 | 4.02–3.04 | ||
| Age-adjusted | 23.6 | 2.1 | 7.8–5.9 | ||
| Tehran | Male | 35–44 | 7.3 | 2.4 | 3.6–0.6 |
| 45–54 | 9.6 | 3.1 | 4.8–0.8 | ||
| 55–65 | 10.9 | 3.6 | 5.4–0.9 | ||
| Age-adjusted | 27.9 | 9.2 | 13.9–2.5 | ||
| Female | 35–44 | 7.05 | 0.6 | 2.3–1.7 | |
| 45–54 | 11.2 | 1.01 | 3.7–2.8 | ||
| 55–65 | 13.1 | 1.1 | 4.3–3.2 | ||
| Age-adjusted | 31.4 | 2.8 | 10.3–7.8 | ||
| Semnan | Male | 35–44 | 6.7 | 2.2 | 3.3–0.6 |
| 45–54 | 13.3 | 4.4 | 6.6–1.2 | ||
| 55–65 | 13.3 | 4.4 | 6.6–1.2 | ||
| Age-adjusted | 33.5 | 11.06 | 16.7–3.01 | ||
| Female | 35–44 | 11.6 | 1.04 | 3.8–2.9 | |
| 45–54 | 11.8 | 1.06 | 3.9–2.9 | ||
| 55–65 | 13.7 | 1.2 | 4.5–3.4 | ||
| Age-adjusted | 37.3 | 3.3 | 12.3–9.3 | ||
| Qazvin | Male | 35–44 | 7.9 | 2.6 | 3.9–0.7 |
| 45–54 | 9.3 | 3.1 | 4.6–0.8 | ||
| 55–65 | 12.4 | 4.1 | 6.2–1.1 | ||
| Age-adjusted | 29.7 | 9.8 | 14.8–2.6 | ||
| Female | 35–44 | 8.08 | 0.7 | 2.6–2.02 | |
| 45–54 | 10.7 | 0.9 | 3.5–2.6 | ||
| 55–65 | 11.9 | 1.07 | 3.9–2.9 | ||
| Age-adjusted | 30.7 | 2.7 | 10.1–7.6 | ||
| Qom | Male | 35–44 | 9.1 | 3 | 4.5–0.8 |
| 45–54 | 12.3 | 4.08 | 6.1–1.1 | ||
| 55–65 | 13.5 | 4.4 | 6.7–1.2 | ||
| Age-adjusted | 35.02 | 11.5 | 17.5–3.1 | ||
| Female | 35–44 | 6.7 | 0.6 | 2.2–1.6 | |
| 45–54 | 15.02 | 1.3 | 4.9–3.7 | ||
| 55–65 | 13.1 | 1.1 | 4.3–3.2 | ||
| Age-adjusted | 34.9 | 3.1 | 11.5–8.7 | ||
| Markazi | Male | 35–44 | 4.3 | 1.4 | 2.1–0.3 |
| 45–54 | 6.3 | 2.1 | 3.1–0.5 | ||
| 55–65 | 8.3 | 2.7 | 4.1–0.7 | ||
| Age-adjusted | 19.1 | 6.3 | 9.5–1.7 | ||
| Female | 35–44 | 5.1 | 0.4 | 1.7–1.2 | |
| 45–54 | 8.7 | 0.7 | 2.8–2.1 | ||
| 55–65 | 11.2 | 1.01 | 3.7–2.8 | ||
| Age-adjusted | 25.1 | 2.2 | 8.3–6.2 | ||
| Yazd | Male | 35–44 | 5.09 | 1.6 | 2.5–0.4 |
| 45–54 | 8.5 | 2.8 | 4.2–0.7 | ||
| 55–65 | 8.2 | 2.7 | 4.1–0.7 | ||
| Age-adjusted | 21.8 | 7.2 | 10.9–1.9 | ||
| Female | 35–44 | 8.7 | 0.7 | 2.8–2.1 | |
| 45–54 | 10.7 | 0.9 | 3.5–2.6 | ||
| 55–65 | 14.4 | 1.3 | 4.7–3.6 | ||
| Age-adjusted | 33.9 | 3.05 | 11.1–8.4 | ||
Hypertension attributable to abdominal obesity in central provinces of Iran by sex and age groups, 2009.
The PAF of hypertension associated with the joint effect of both obesity and abdominal obesity in females was not significant. However, in males, the highest PAF was observed in Qom Province 31.07 (95% CI: 16.7–41.1), followed by Semnan 29.6 (95% CI: 15.9–39.3), Qazvin 25.9 (95% CI: 13.7–35.5), Tehran 24.2 (95% CI: 12.7–32.3), and Isfahan 20.4 (95% CI: 3.5–27.4). Those aged 55–65 years had the highest PAF associated with the joint effect of both obesity and abdominal obesity. The PAF of hypertension associated with the joint effect of both obesity and abdominal obesity in the age group 55–65 years in males of Isfahan was 8.2% (95% CI: 3.5–11.5), and in Tehran for males it was 7.6% (95% CI: 3.1–10.7) (Table 3).
| Province | Sex | Age groups (y) | Age-adjusted prevalence | Percent population-attributable fraction | |
|---|---|---|---|---|---|
| Point estimates of the odds ratio | 95% Confidence interval | ||||
| Isfahan | Male | 35–44 | 5.2 | 2.1 | 3.6–0.02 |
| 45–54 | 7.2 | 4.06 | 6.1–1.09 | ||
| 55–65 | 11.5 | 8.2 | 11.5–3.5 | ||
| Age-adjusted | 24.1 | 20.4 | 27.4–3.5 | ||
| Female | 35–44 | 3.3 | 0.6 | 0.4–2.3 | |
| 45–54 | 8.1 | 2.6 | 5.4–1.4 | ||
| 55–65 | 12.1 | 5.4 | 9.6–0.6 | ||
| Age-adjusted | 23.6 | 13.3 | 21.5–1.6 | ||
| Tehran | Male | 35–44 | 7.3 | 4.1 | 6.3–1.1 |
| 45–54 | 9.6 | 6.4 | 9.2–2.4 | ||
| 55–65 | 10.9 | 7.6 | 10.7–3.1 | ||
| Age-adjusted | 27.9 | 24.2 | 32.3–12.7 | ||
| Female | 35–44 | 7.05 | 1.8 | 4.3–1.6 | |
| 45–54 | 11.2 | 4.7 | 8.7–0.8 | ||
| 55–65 | 13.1 | 6.04 | 10.5–0.4 | ||
| Age-adjusted | 31.4 | 18.7 | 29.5–3.1 | ||
| Semnan | Male | 35–44 | 6.7 | 3.6 | 5.5–0.8 |
| 45–54 | 13.3 | 9.9 | 13.8–4.5 | ||
| 55–65 | 13.3 | 10.02 | 13.8–4.5 | ||
| Age-adjusted | 33.5 | 29.6 | 39.3–15.9 | ||
| Female | 35–44 | 11.6 | 5.03 | 9.06–0.7 | |
| 45–54 | 11.8 | 5.1 | 9.2–0.6 | ||
| 55–65 | 13.7 | 6.5 | 11.2–0.3 | ||
| Age-adjusted | 37.3 | 22.7 | 35.6–4.2 | ||
| Qazvin | Male | 35–44 | 7.9 | 4.7 | 6.9–1.4 |
| 45–54 | 9.3 | 6.1 | 8.8–2.2 | ||
| 55–65 | 12.4 | 9.1 | 12.7–4.02 | ||
| Age-adjusted | 29.7 | 25.9 | 34.5–13.7 | ||
| Female | 35–44 | 8.08 | 2.5 | 5.3–1.4 | |
| 45–54 | 10.7 | 4.3 | 8.1–0.9 | ||
| 55–65 | 11.9 | 5.2 | 9.3–0.6 | ||
| Age-adjusted | 30.7 | 18.2 | 28.8–2.9 | ||
| Qom | Male | 35–44 | 9.1 | 5.8 | 8.4–2.1 |
| 45–54 | 12.3 | 9.05 | 12.6–3.9 | ||
| 55–65 | 13.5 | 10.1 | 14.07–4.6 | ||
| Age-adjusted | 35.02 | 31.07 | 41.1–16.7 | ||
| Female | 35–44 | 6.7 | 1.6 | 4.03–1.6 | |
| 45–54 | 15.02 | 7.3 | 12.5–0.07 | ||
| 55–65 | 13.1 | 6.04 | 10.5–0.45 | ||
| Age-adjusted | 34.9 | 21.09 | 33.1–3.7 | ||
| Markazi | Male | 35–44 | 4.3 | 1.2 | 2.5–0.5 |
| 45–54 | 6.3 | 3.2 | 5.04–0.5 | ||
| 55–65 | 8.3 | 5.1 | 7.5–1.7 | ||
| Age-adjusted | 19.1 | 15.6 | 21.1–7.7 | ||
| Female | 35–44 | 5.1 | 0.5 | 2.3–1.9 | |
| 45–54 | 8.7 | 3.02 | 6.03–1.3 | ||
| 55–65 | 11.2 | 4.7 | 8.6–0.8 | ||
| Age-adjusted | 25.1 | 14.3 | 23.06–1.8 | ||
| Yazd | Male | 35–44 | 5.09 | 1.9 | 3.4–0.1 |
| 45–54 | 8.5 | 5.3 | 7.8–1.8 | ||
| 55–65 | 8.2 | 4.9 | 7.3–1.6 | ||
| Age-adjusted | 21.8 | 18.2 | 24.5–9.3 | ||
| Female | 35–44 | 8.7 | 3.01 | 6.02–1.3 | |
| 45–54 | 10.7 | 4.4 | 8.1–0.9 | ||
| 55–65 | 14.4 | 6.9 | 11.9–0.1 | ||
| Age-adjusted | 33.9 | 20.3 | 32.1–3.5 | ||
Hypertension attributable to the joint effect of obesity and abdominal obesity in central provinces of Iran by sex and age groups, 2009.
Fig. 1 shows the PAF of hypertension associated with the joint effect of both obesity and abdominal obesity in males. The results of this study show that Semnan Province has the highest prevalence of high blood pressure in males from the central provinces of Iran (31.1%), of which 35.0% is attributable to the joint effect of obesity and abdominal obesity. Similarly, 29.6% of the total prevalence of hypertension in males from Qom Province (33.5%) can be attributed to the joint effect of both factors of obesity and abdominal obesity.
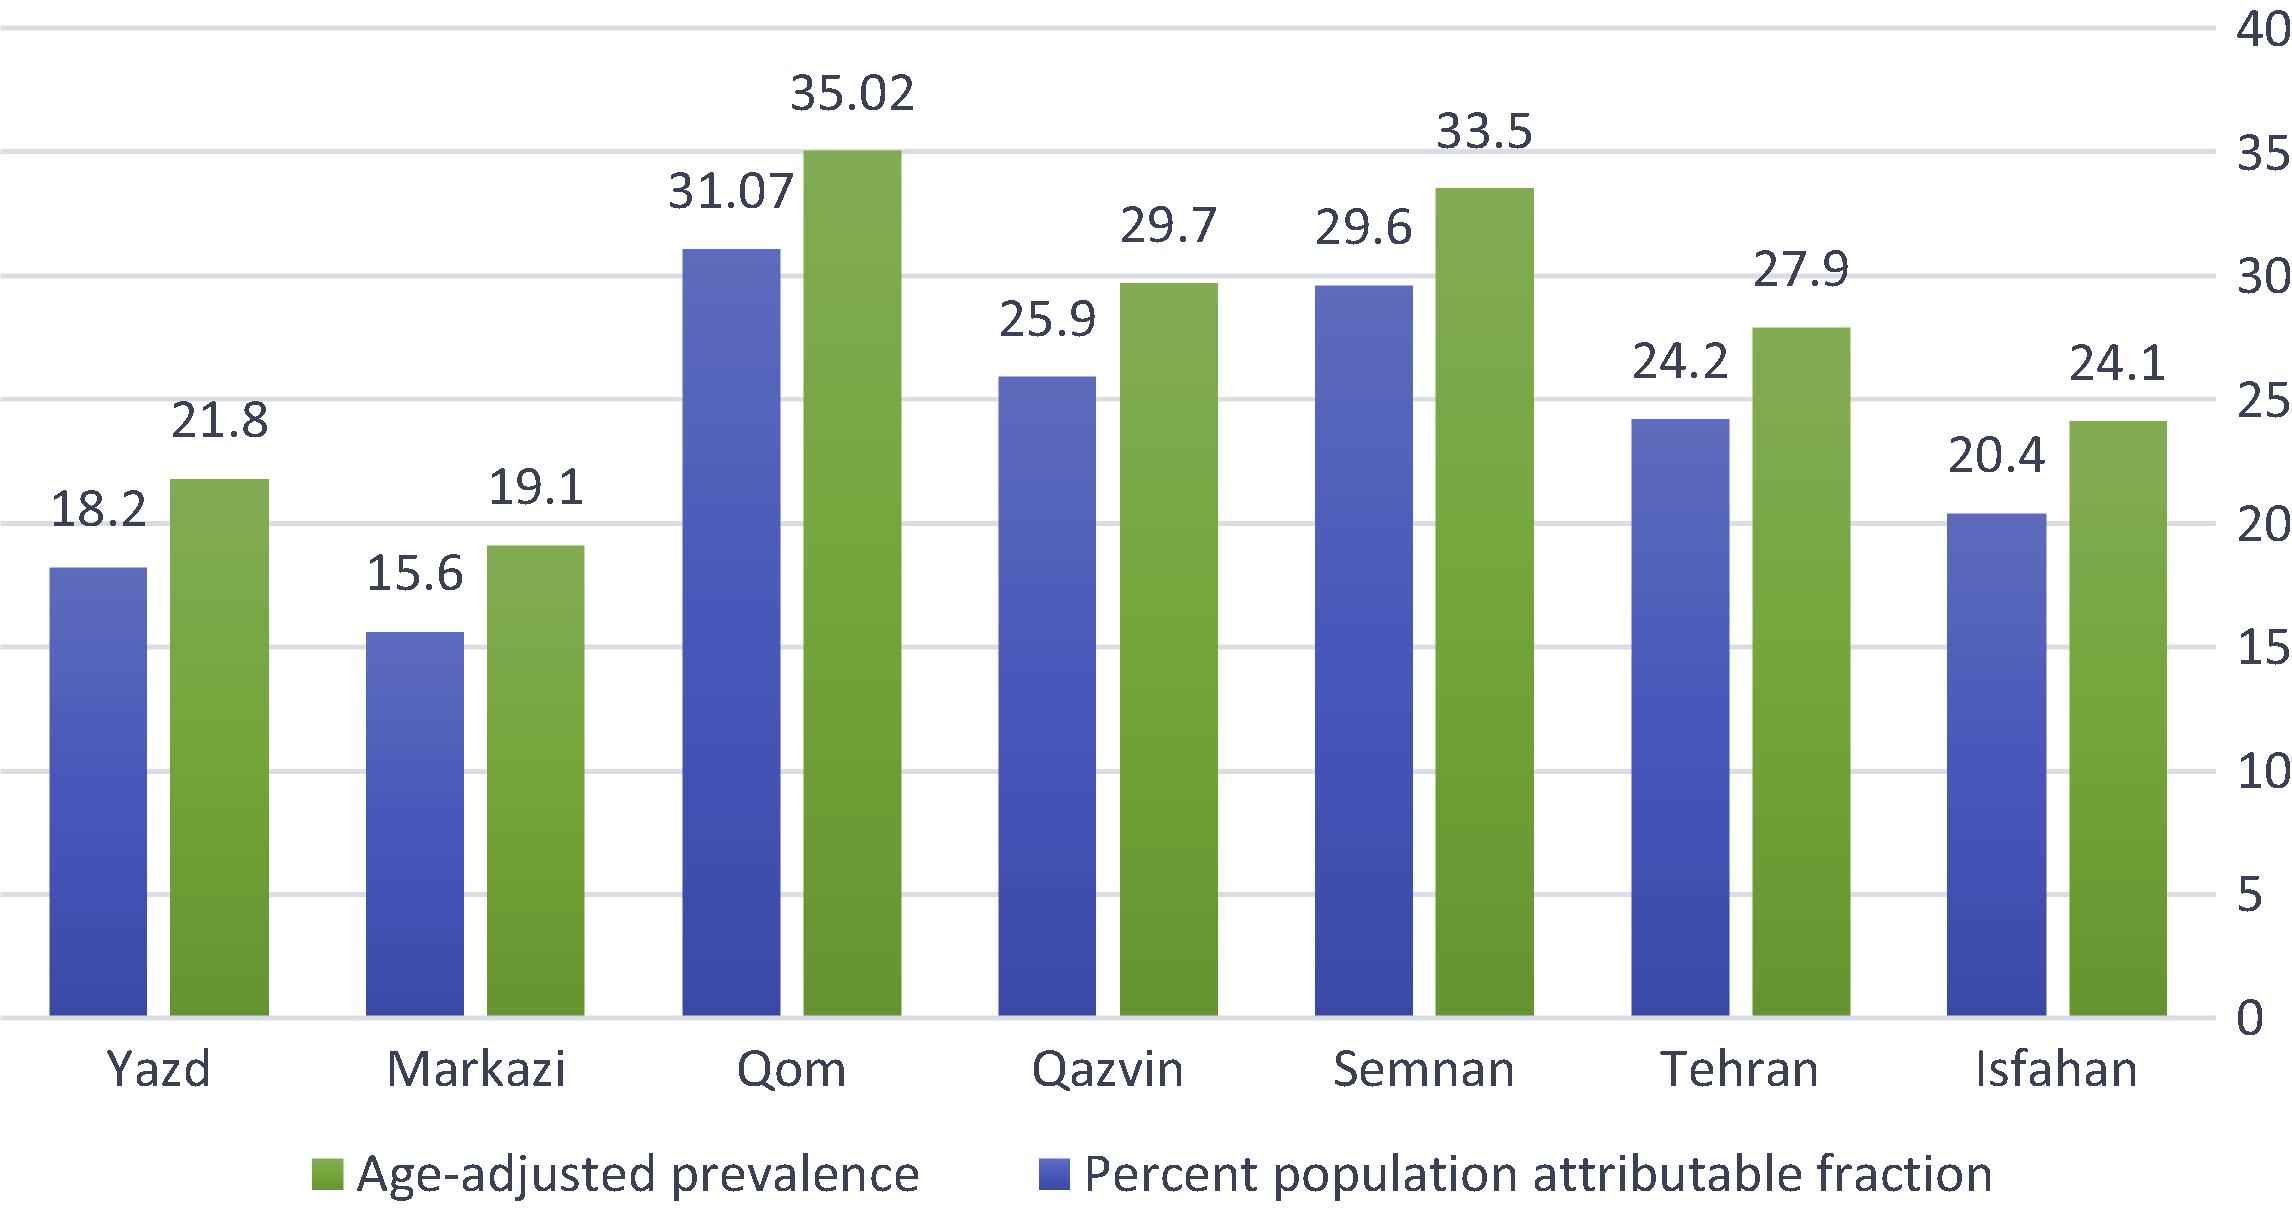
The population-attributable fraction of hypertension and, obesity, and abdominal obesity in males from the central provinces of Iran.
Fig. 2 shows the PAF of hypertension associated with the joint effect of both obesity and abdominal obesity in females. The results of this study show that Semnan Province has the highest prevalence of high blood pressure in females from the central provinces of Iran (22.7%) of which 37.3% can be attributed to the joint effect of obesity and abdominal obesity. Also, 21.1% of the prevalence of hypertension in females from Qom Province (34.9%) is attributable to the joint effect of both factors of obesity and abdominal obesity.
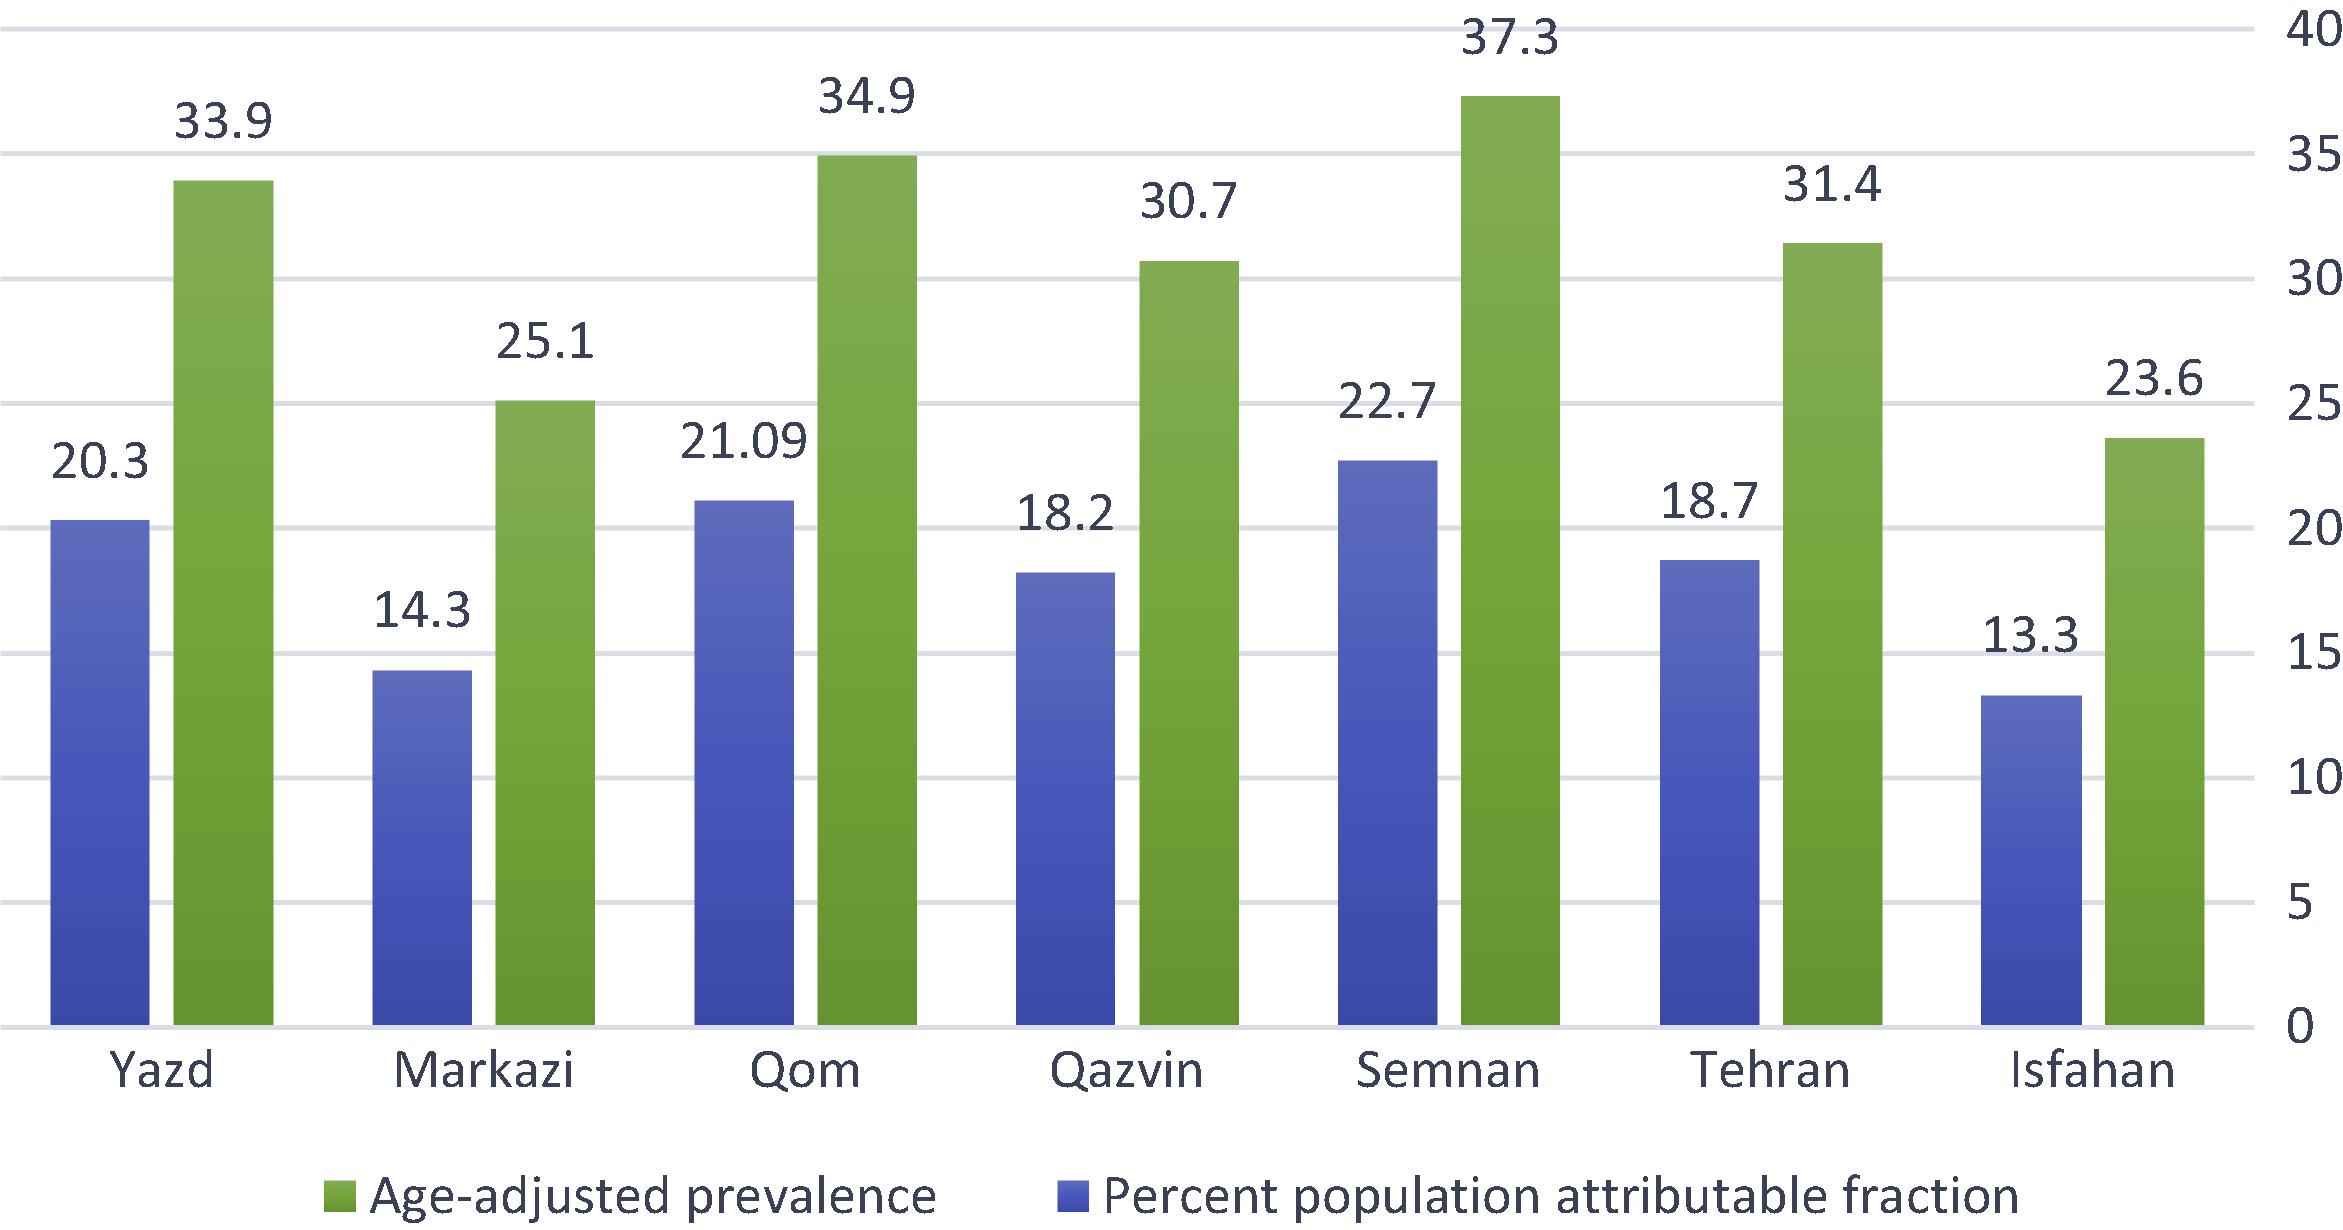
The population-attributable fraction of hypertension and, obesity, and abdominal obesity in females from the central provinces of Iran.
4. Discussion
The PAF of hypertension associated with obesity in females was highest in Semnan Province (22.3%), followed by Qom (20.9%) and Yazd (20.3%). In males, the highest PAF was observed in Qom Province (22.5%), followed by Semnan (21.5%), Qazvin (19.1%), Tehran (17.9%), and Isfahan (15.4%). The PAF of hypertension associated with abdominal obesity in females was not significant. In males, the highest PAF was observed in Qom Province (11.5%), followed by Semnan (11.1%), Qazvin (9.8%), Tehran (9.3%), and Isfahan (7.9%).
The results of study by Khalili et al. [16] showed that the PAF of hypertension associated with diabetes, high total cholesterol, and low-high-density lipoproteins cholesterol was 9.4%, 6.7%, 7.3%, and 6.1% in males and 17%, 16.6%, 12%, and 4.6% in females, respectively.
Mohammadi and Mirzaei [20] showed that in Yazd Province in terms of the PAF of hypertension attributable to obesity in females, the highest rate was 20.3% and among males aged 45–54 years it was 5.5%. Among females in the age group 55–65 years it was 8.6%. In this study, age group 55–65 years have the highest PAF associated with obesity, which suggests the effect of aging on the association of hypertension and obesity.
Martiniuk et al. [21] reported that in 15 countries of the Asia Pacific region, using available data, the prevalence of hypertension ranged from 5% to 47% in males and from 7% to 38% in females. Overall, the fraction of ischemic heart disease attributable to hypertension ranged from 4% to 28% in males and from 8% to 39% in females, respectively. Karami et al. [22] pointed out that the share of diabetes in reducing the burden attributable to cardiovascular diseases in females might be 11.2% of the total burden of cardiovascular diseases among females if the prevalence is reduced to zero, and if it is reduced to 4%, the PAF would be 5.7%. Moreover, if we can reduce the prevalence down to the level recommended by Iranian Ministry of Health and Medical Education, the burden of hypertension attributable to obesity can be reduced to 2.9% of the total burden.
The results of study by Biderafsh et al. [23] showed that every 5-mmHg hypothetical reduction in systolic blood pressure above 140 mmHg can reduce 3.5% of the total burden of stoke. This value may reach 7% if the systolic blood pressure decreases by 10 mmHg. In addition, for every 5-mmHg hypothetical reduction in diastolic blood pressure above 80 mmHg, 4.87% of the total burden of stoke can be avoided. The PIF after a 10-mmHg modification on distribution of diastolic blood pressure was estimated at 9.38%, which represents the deductions attributable to the impact of population and share of the potential impact of the policy to reduce risk factors for noncommunicable diseases. The results of this study show that Semnan Province has the highest prevalence of hypertension in men from the central provinces of Iran; 31.1% prevalence of hypertension can be prevented in the province.
It was reported that there is considerable variability among studies regarding the methods used for PAF calculation and the selection of appropriate counterfactuals is essential. The PAF of obesity reported estimates ranged from 5% to 15% for all-cause mortality, 0.2% to 8% for all-cancer incidence, 7% to 44% for cardiovascular disease incidence, and 3% to 83% for diabetes incidence [24]. This study like other studies [25] showed that obesity remains strongly associated with diabetes, hypercholesterolemia, and hypertension, and there is a strong relationship between BMI and systolic and diastolic blood pressure. In addition, obese males and females have higher odds ratio of affliction to hypertension, hypercholesterolemia, high low-density lipoproteins and low HDL [15].
In a study by Salem and Rezaeyan [26], it was stated that >60% of cases of hypertension are overweight or obese. According to their study, being overweight and obesity play the most important roles in PAF of hypertension [22]. By awareness-increasing and prevention methods, like change in lifestyle and exercise, hypertension can be decreased through weight control programs.
This study has several limitations. The prevalence data are from 2009; however, no recent and reliable data are available. The measure of association (OR) comes from the TLGS study which was done in Tehran only. In general, PAFs for hypertension associated with obesity may be best considered as an indicator of association [24].
In conclusion, the results of this study confirmed the considerable contribution of obesity and abdominal obesity to hypertension and show that prevalence of hypertension is higher in more developed provinces of central Iran. Accordingly, policy makers are strongly recommended to consider and implement preventive strategies on obesity and abdominal obesity as an important priority.
Conflict of interests
All authors declare no conflict of interests.
References
Cite this article
TY  - JOUR
AU  - Masoud Mohammadi
AU  - Masoud Mirzaei
PY  - 2016
DA  - 2016/12/07
TI  - Population-attributable fraction of hypertension associated with obesity, abdominal obesity, and the joint effect of both in the Central Provinces of Iran
JO  - Journal of Epidemiology and Global Health
SP  - 71
EP  - 79
VL  - 7
IS  - 1
SN  - 2210-6014
UR  - https://doi.org/10.1016/j.jegh.2016.11.002
DO  - 10.1016/j.jegh.2016.11.002
ID  - Mohammadi2016
ER  -