
Measuring a hidden population: A novel technique to estimate the population size of women with sexual violence-related pregnancies in South Kivu Province, Democratic Republic of Congo
- DOI
- 10.1016/j.jegh.2016.08.003How to use a DOI?
- Keywords
- Democratic Republic of Congo; Hidden populations, pregnancy; Respondent-driven sampling; Sexual violence; Successive sampling-population size estimation
- Abstract
Successive sampling (SS)–population size estimation (PSE) is a technique used to estimate the sizes of hidden populations using data collected in respondent-driven sampling (RDS) surveys. We assess past estimations and use new data from an RDS survey to calculate a new PSE. In 2012, 852 adult women in South Kivu Province, Democratic Republic of Congo, who self-identified as survivors of sexual violence, resulting in a pregnancy, since the start of the war (in 1996) were sampled using RDS. We used imputed visibility, enrollment order, and prior estimates for PSE using SS-PSE in RDS Analyst. Prior estimates varied between Congolese local experts and researchers. We calculated the PSE of women with a sexual violence-related pregnancy in South Kivu using researchers’ priors to be approximately 17,400. SS–PSE is an effective method for estimating the population sizes of hidden populations, useful for providing evidence for services and resource allocation. SS–PSE is beneficial because population sizes can be calculated after conducting the survey and do not rely on separate studies or additional data (as in network scale-up, multiplier, and capture-recapture methods).
- Copyright
- © 2016 Ministry of Health, Saudi Arabia. Published by Elsevier Ltd.
- Open Access
- This is an open access article under the CC BY-NC-ND license (http://creativecommons.org/licenses/by-nc-nd/4.0/).
1. Introduction
Sexual violence is a predominant feature of the armed conflict and post conflict insecurity in eastern Democratic Republic of Congo (DRC) [1,2]. It is estimated that 40% of the female Congolese population (approximately 38,700,000) has experienced sexual violence and up to 17% of survivors become pregnant as a result of sexual assault, although this varies by region [1]. There are limited data about children born from sexual violence-related pregnancies (SVRPs) in DRC or elsewhere [3], although available evidence suggests that both children born from SVRPs, as well as their mothers, face high levels of stigma and experience considerable life adversities [4,5].
Estimating the size of hidden populations, including women with SVRPs, helps to inform the magnitude of the issue, guide resource allocation, and advocate for public health programs to reach affected populations. However, measuring the size of hidden populations is extremely challenging. Most hidden populations, which often practice or are victims of illegal behaviors and/or face discrimination and stigma, prefer to avoid being identified or counted. Measuring women with SVRP through household surveys would likely result in gross underreporting since affected women may be unwilling to report accurately and may not reside in typical household settings that are amenable to counting. Furthermore, it is impossible to count women with SVRPs through mapping or observation estimation, since the population is not visibly distinguishable. Finally, certain segments of the population may be more hidden or diffuse than others, resulting in their exclusion from population size estimations.
Attempting to estimate the number of women with SVRPs using published data also has limitations. Congolese census data are outdated (1984) [2]. The two most commonly used sources for population data in DRC are: (1) population projections for 2006 calculated by the National Institute of Statistical Sciences (NISS) [6]; and, (2) projected population data from the 2007 Expanded Program on Immunization (EPI) [7]. NISS and EPI estimate the population of South Kivu Province to be 4,281,000 and 4,379,129, respectively, the number of reproductive-aged women in South Kivu to be 943,228 and 964,848, respectively, and the number of women with lifetime experiences of sexual violence to be 120,709 and 123,476, respectively.
Globally, it is estimated that 5–18% of sexual violence survivors aged 12–45 years have an SVRP [8]. However, these estimates are from a variety of contexts in developed and developing countries. Within the African context, 17% of sexual violence survivors in Ethiopia reported a resultant pregnancy [8], consistent with the 17% estimated in DRC [1]. Using 17% as an estimate for the number of women who become pregnant from sexual violence, as well as the NISS and EPI data for the number of women in South Kivu province who have experienced sexual violence, we would estimate that approximately 20,000 women in South Kivu Province had SVRPs. However, this estimate may be inaccurate. First, estimates for the number of women who had experienced sexual violence are outdated. Furthermore, Peterman et al. [2] estimate that in DRC, 1150 women between the ages of 15 years and 29 years, experience sexual violence every day. Even if the daily incidence of sexual violence were much lower than Peterman’s estimate, one could still conclude that the NISS and EPI estimates from 2006 and 2007, respectively, could be low. Additionally, the estimate that 17% of sexual violence survivors in DRC have an SVRP [1] may be inaccurate.
To provide an additional population size estimate than can be extrapolated from the available literature, we estimate the population size using data from a respondent driven sampling (RDS) survey of women with SVRPs in South Kivu Province, DRC. Briefly, RDS is a sampling method used worldwide [9–11] to sample hidden populations whose members are connected through a network of social ties, and for which no sampling frame exists [12–14]. RDS uses participants’ recruitment data and social network sizes to derive estimates about the target population. The recruitment process begins with a convenience sample of population members (seeds), who use a fixed number of coupons to recruit members of their social network. Coupons contain a unique number to manage peer-to-peer recruitment and ensure anonymity. By generating long recruitment chains, biases associated with the initial convenience sample of seeds are removed from the final sample [14,15]. However, biases associated with network structure, preferential recruitment, and visibility may still exist. RDS data are weighted based on each participant’s social network size and other covariates.
The method to estimate population size, successive sampling–population size estimation (SS-PSE) [15,16], uses data already collected in an RDS survey: each participant’s social network size (i.e., the number of people a participant knows who also know them and who fulfill the survey’s eligibility criteria), enrollment date, and the maximum number of coupons used for peer recruitment [17]. Before making the population size estimation, we impute each person’s visibility, which has been shown to produce better SS-PSEs when the self-reported social network size may be unreliable [16,18]. Visibility imputation requires knowledge of each participant’s self-reported network size, enrollment date, and the number of people they were able to recruit into the study.
In this paper we implement the SS-PSE in a population of women with SVRPs in South Kivu Province. We compare our PSE to the one obtained using outdated and possibly problematic background data, while discussing the limitations of both calculations. In addition, we utilize and discuss an important method for enumerating prior information from researchers and Congolese local experts to use in modeling the SS-PSE. Finally, we suggest how to assess the validity of prior information and provide guidance on how to interpret the accuracy of the final estimates.
2. Materials and methods
All code for SS-PSE and network imputation is available through the R programming language (R Core Team, 2012) via the packages RDS and SS-PSE. The methods are implemented for easy use through the open-source software RDS Analyst (Los Angeles, California, USA) found at http://www.hpmrg.org.
We calculated the SS-PSE using data from an October–November 2012 RDS survey of 852 women with SVRPs, in South Kivu Province, DRC. Eligible participants were female, aged ⩾18 years, self-identifying as survivors of sexual violence since the start of the war (in 1996) in Eastern DRC, pregnant as a result of sexual violence, and either raising the child or had aborted the fetus (women who had a spontaneous miscarriage, still birth, or were not raising the child were excluded). Nonrandomly selected initial participants identified through local partner organizations initiated RDS peer-to-peer recruitment. Participants received no more than three coupons to use in recruiting their peers and received a primary incentive, a headscarf (value USD$1), for participation. This study did not offer secondary incentives, usually used in RDS to reimburse participants for recruiting others. Seeds and recruited participants with valid coupons were screened for eligibility, provided verbal consent and social network size data, completed a face-to-face interview, and received up to three coupons to recruit new participants. Social network size data were collected by asking each participant the number of women they know who fulfill the above eligibility criteria and who they had seen in the past 4 weeks. The survey was approved by the institutional review board at the Harvard School of Public Health, a local community advisory board and by the provincial Ministry of Health. Full details of the RDS study design are published elsewhere [5,19].
SS-PSE is a Bayesian method to infer the unknown population size N using data from an RDS study. In Bayesian inference, for a parameter θ, the prior distribution of θ is the distribution before any data are observed, p(θ|α). α is a hyperparameter (a parameter of the prior distribution), used to help define the shape of the prior distribution. The prior distribution is used to incorporate information known about the population before the RDS study, e.g. a range of likely population sizes or population size estimates using other methods, as well as our uncertainty about the parameter. The sampling distribution p(X|θ) is the distribution of the observed data X conditional on its parameters. The outcome of Bayesian inference is the posterior distribution of the parameter after taking into account the observed data:
Instead of a fixed point as a prediction in Frequentist methods, Bayesian inference results in a distribution over possible points. In Frequentist methods, a 95% confidence interval means that with a large number of repeated samples, 95% of the calculated intervals will contain the true value of the parameter (here, the true population size). The parameter is assumed fixed and the confidence interval is random, as it depends on the random sample. In Bayesian methods such as SS-PSE, the bounds are assumed fixed and the parameter random. Bayesian approaches can summarize their uncertainty by giving a range of values on the posterior probability distribution that includes 95% of the probability—this is called a 95% probability interval. Probability intervals capture our current uncertainty in the location of the parameter values and thus can be interpreted as probabilistic statement about the parameter. In contrast, confidence intervals capture the uncertainty about the interval we have obtained (i.e., whether it contains the true value or not). Thus, they cannot be interpreted as a probabilistic statement about the true parameter values.
Specific information for obtaining the prior and posterior distributions using SS-PSE is provided in complete detail in Refs. [17,20], and briefly summarized in Sections 2.1 and 2.2.
2.1. Eliciting prior information
SS-PSE uses prior beliefs about population sizes. Although the true population size is unknown, experts can often provide rough approximations of likely values. Information about the estimated population mode, mean, median, first and third quartiles, minimum, and maximum of the likely population size distribution are best collected from experts with knowledge about the population [18]. These values provide an idea of what the true population size might be and are used as hyperparameters to fit the SS-PSE model assuming the prior on population size follows a β distribution [17,20].
2.2. Statistical background (SS-PSE)
SS-PSE is a Bayesian method where the population size N is treated as an unknown. In this approach, a distribution of likely possible values for N is generated given the observed RDS recruitment chain under assumptions about the RDS sampling process [17,20]. In particular, the sampling model uses assumptions about the sequential nature of data collection, in which individuals with larger networks are more likely to be recruited earlier in the RDS recruitment process [21]. As recruitment progresses, average reported network sizes are assumed to decrease, thereby indicating that a larger proportion of the population has been sampled. This assumption forms the basis of the successive sampling estimator, after which the SS-PSE is named, currently used to analyze RDS data [14,21]. The SS-PSE method relies on a Bayesian model that uses prior knowledge from educated guesses of the population size based on expert beliefs or population size estimates from previous studies in conjunction with observed data from an RDS study to estimate likely population sizes [17,20]. Calculating the inputs through probability distributions over all possible values, population size estimates are presented as a distribution with means, medians, and probability intervals, rather than a point estimate and confidence intervals. Data about individuals’ network sizes and the recruitment order are used to estimate the posterior distribution (i.e., distribution of unobserved or predicted observations based on observed data) for the population size. For more information about the statistics for computing the SS-PSE, see [17].
We calculated the SS-PSE using RDS Analyst (http://www.hpmrg.org) to draw 5000 samples from the posterior distribution for population size. The burn-in period was 5000 iterations (i.e., number of iterations from the beginning of the iteration process that are discarded to remove dependence from the prior values provided) and the thinning interval was 10 (i.e., number of iterations between retained samples to remove dependence between successive iterations). We imputed visibilities from participants’ self-reported network sizes to adjust for the number of recruits each person enrolls in the study, capped at the maximum number of coupons each recruiter could distribute (in this case, 3), and the time they had to recruit (2 weeks in this particular RDS study).
To measure network size, we asked participants a cascade of questions starting with: “How many women who have experienced sexual violence do you know, who also know you, who became pregnant from sexual violence since the beginning of the war in 1996?” Followed by: among those, “how many are currently living and raising a child born from sexual violence OR have aborted a rape-related pregnancy that you have seen in the past 1 month?” Followed by: among those, “how many are aged 18 years or older, and live in South Kivu province?” Because answers to these questions are subject to multiple types of reporting and interviewer biases, which can lead to errors including rounding and systematic misreporting, we impute each person’s visibility. This imputation method smooths network sizes, brings in extreme values, and provides a framework to handle missing or impossible network sizes. The imputation has been shown to result in improved estimates when self-reported network sizes may be inaccurate [16,18].
3. Results
The RDS survey had 18 seeds, six of whom failed to recruit anyone, and attained a maximum of 10 waves (Fig. 1). Data were assessed for biases related to recruitment patterns, homophily, and equilibrium and are published elsewhere [5,19]. Of nine key variables analyzed, six reached equilibrium. However, one variable did not reach homophily and two had approached equilibrium at the time of study termination, indicating the possibility of some seed bias. Three variables had a homophily value above the predefined cut-off of 0.3 indicating the possibility of some nonrandom recruitment [19].
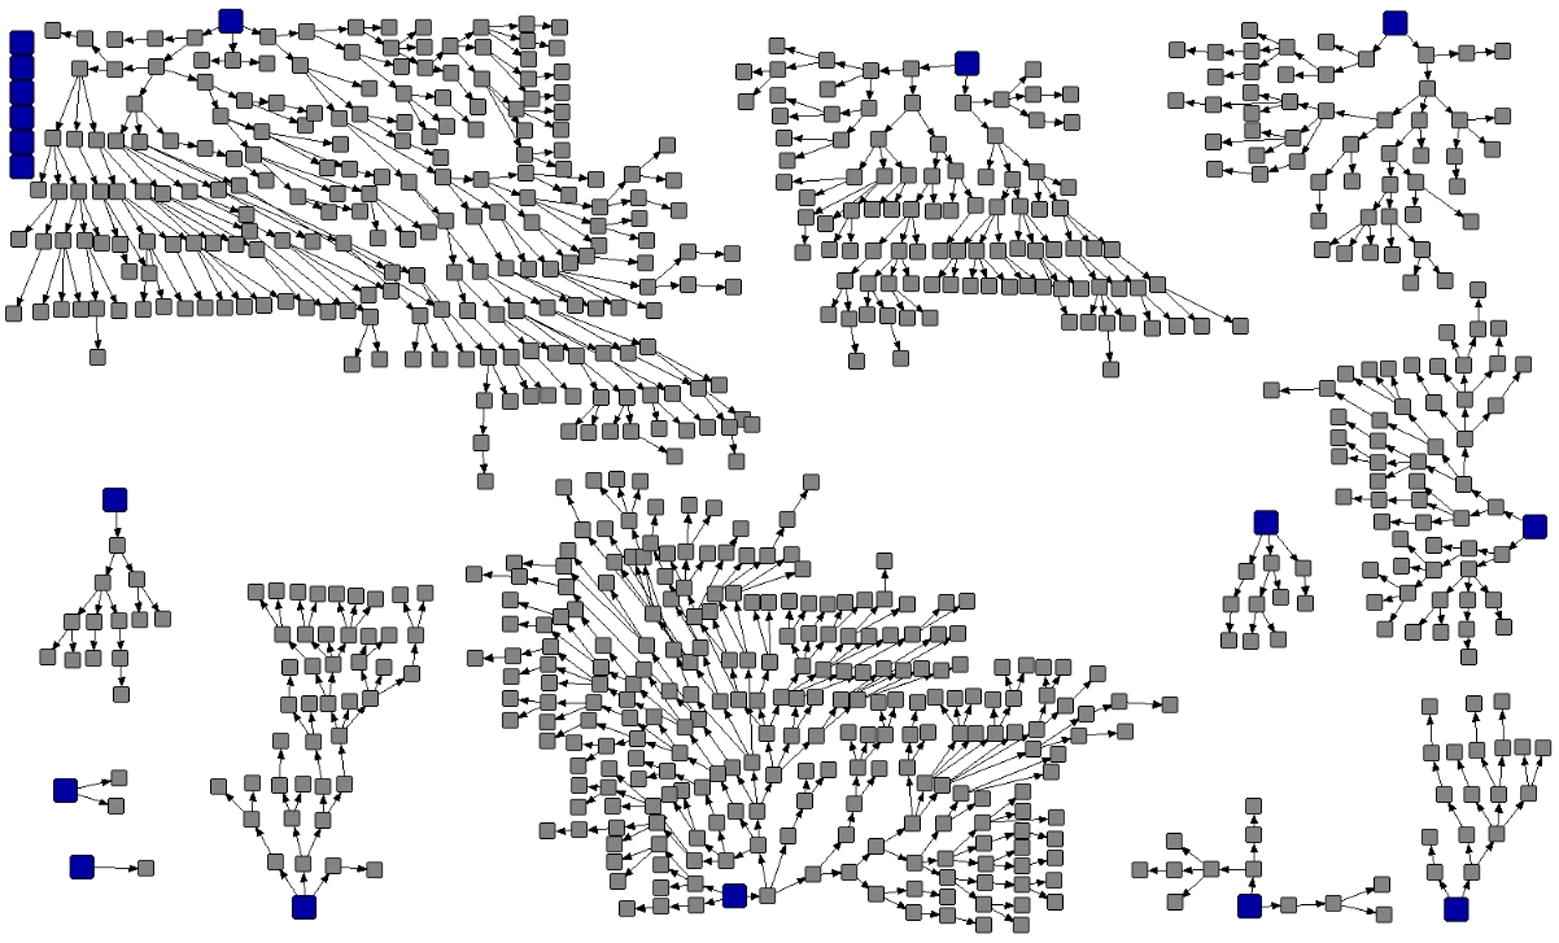
Recruitment graphic of female sexual violence-related pregnancies (n = 852), South Kivu Province, Democratic Republic of Congo, 2012.
For the population size estimation, we elicited prior information about the mode, mean, median, first and third quartiles, minimum, and maximum of the likely population size distribution from 13 expatriate researchers identified as having expertise on sexual violence in DRC. Six of the 13 provided estimates, one responded that she did not feel qualified to provide this information and six researchers did not respond. Additionally, eight Congolese local experts identified as having knowledge about or having worked with survivors of sexual violence were asked the same questions about the likely population size distribution. The questions were originally asked via email, and were translated from English to French by an experienced local translator. Of the initial eight Congolese local experts surveyed, three responded. In September 2015, during a trip to the DRC, one of the coauthors met with one of the Congolese local experts who revised his estimate. In total, nine sources provided prior population size values. Fig. 2 shows the nine expert responses, with population size on the y-axis. The range of each bar shows the reasonably highest and reasonably lowest value for the population size provided by that expert. The median population size provided is indicated by the black-filled circle. Note that one respondent specified the median to be outside the range, and probably did not understand the question. Responses from expatriate researchers differed widely from those of Congolese local experts (combined median: 42,584 vs. 6380, respectively; Fig. 2). No one provided responses for the first and third quartiles.
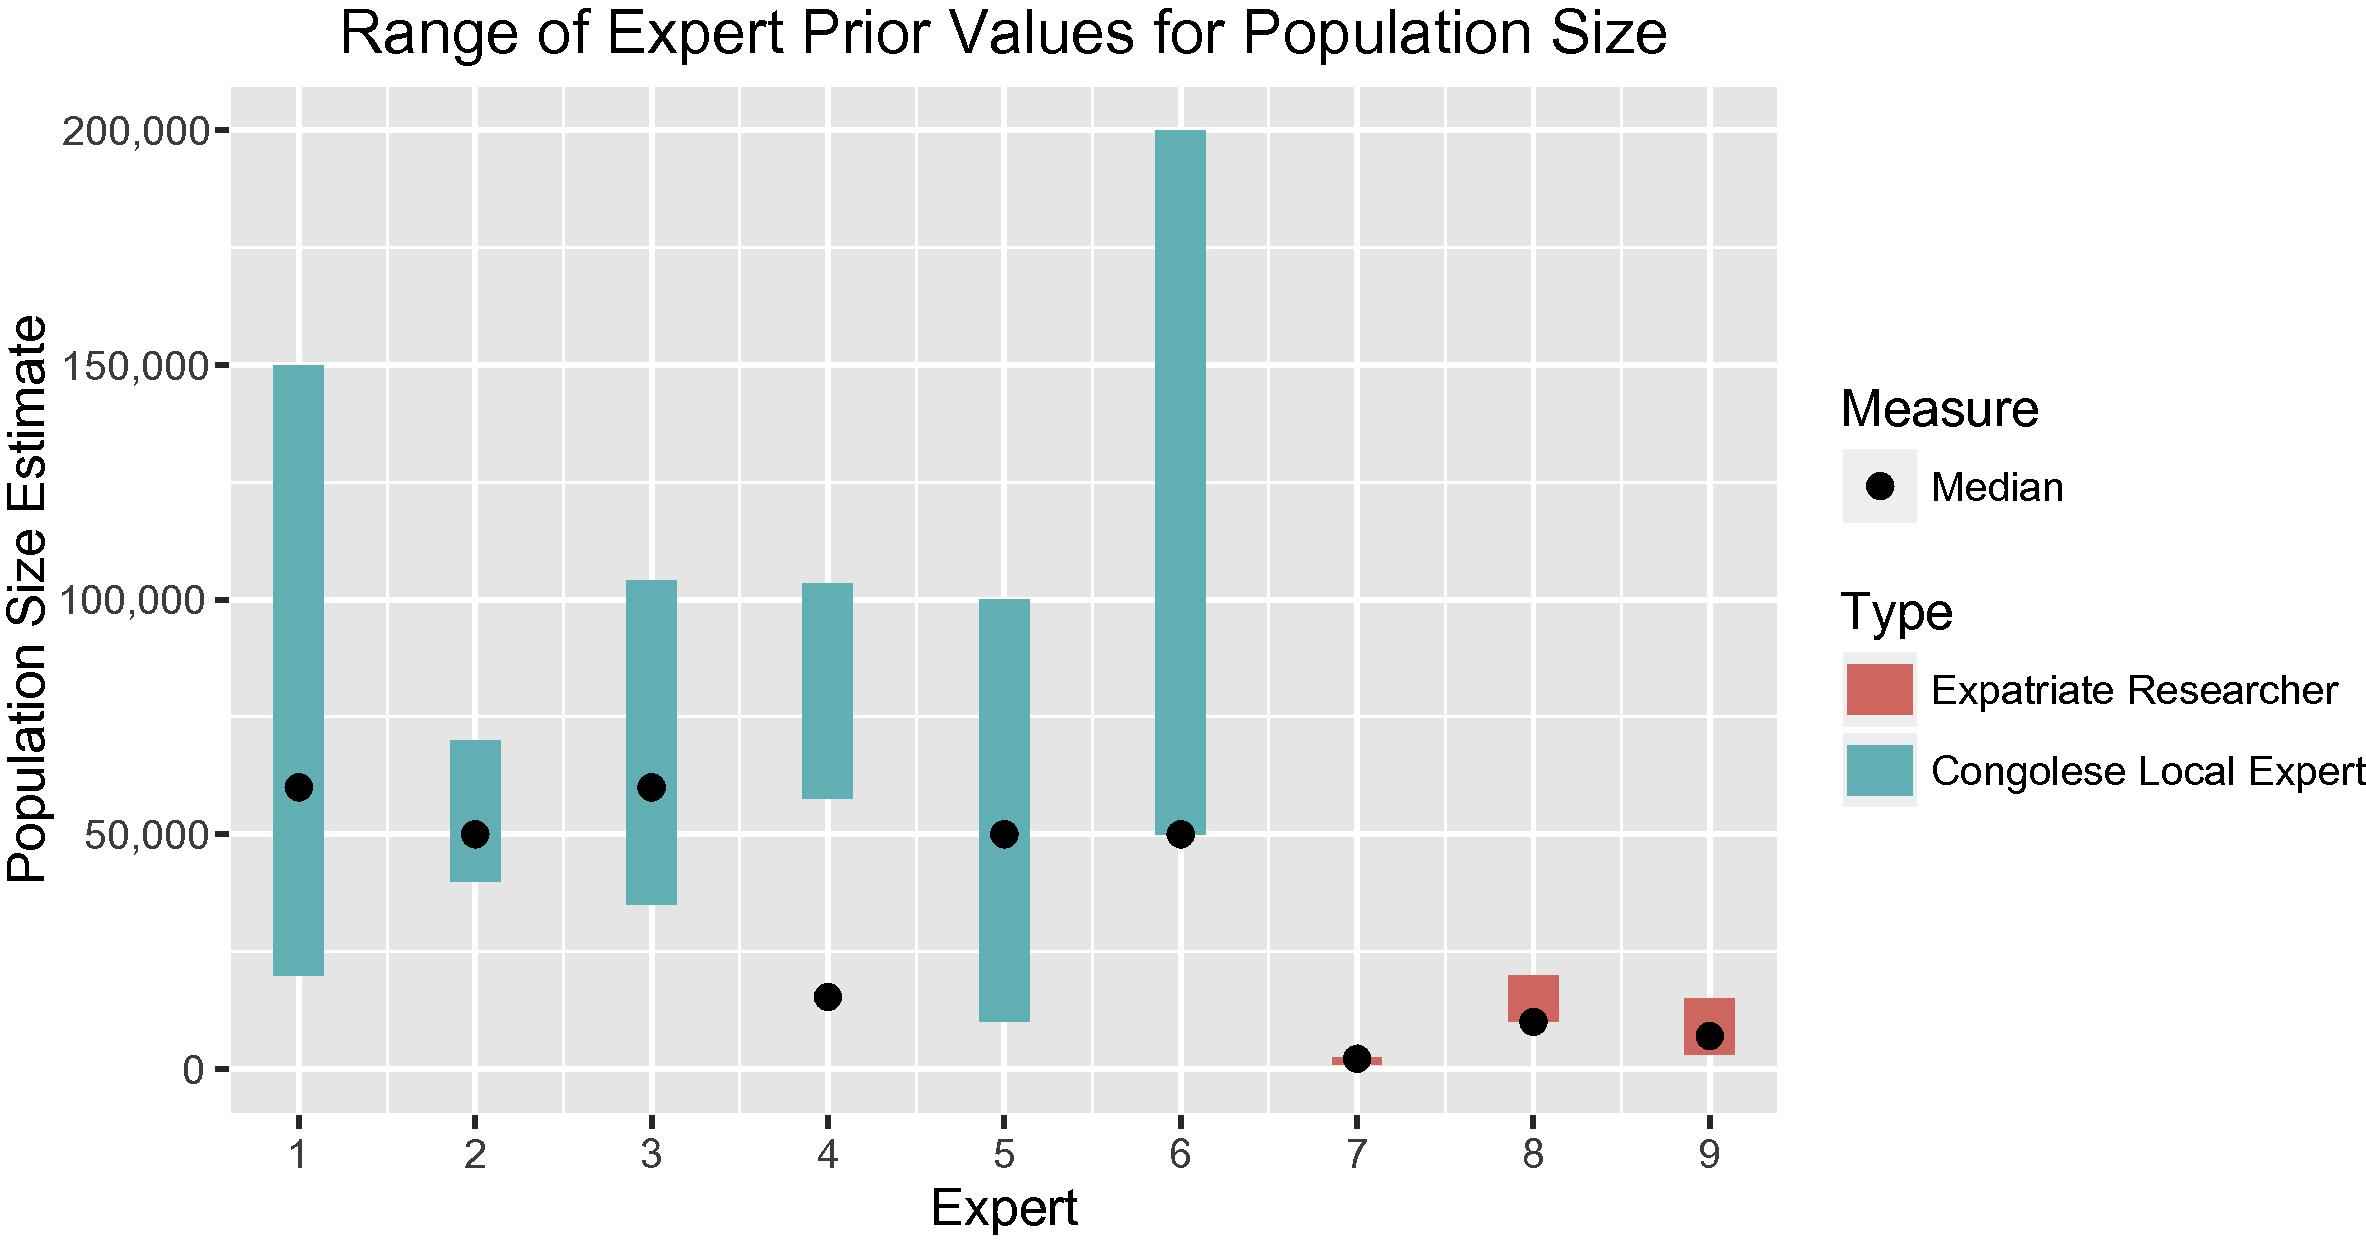
Mean and median expert prior values from researchers and Congolese local experts.
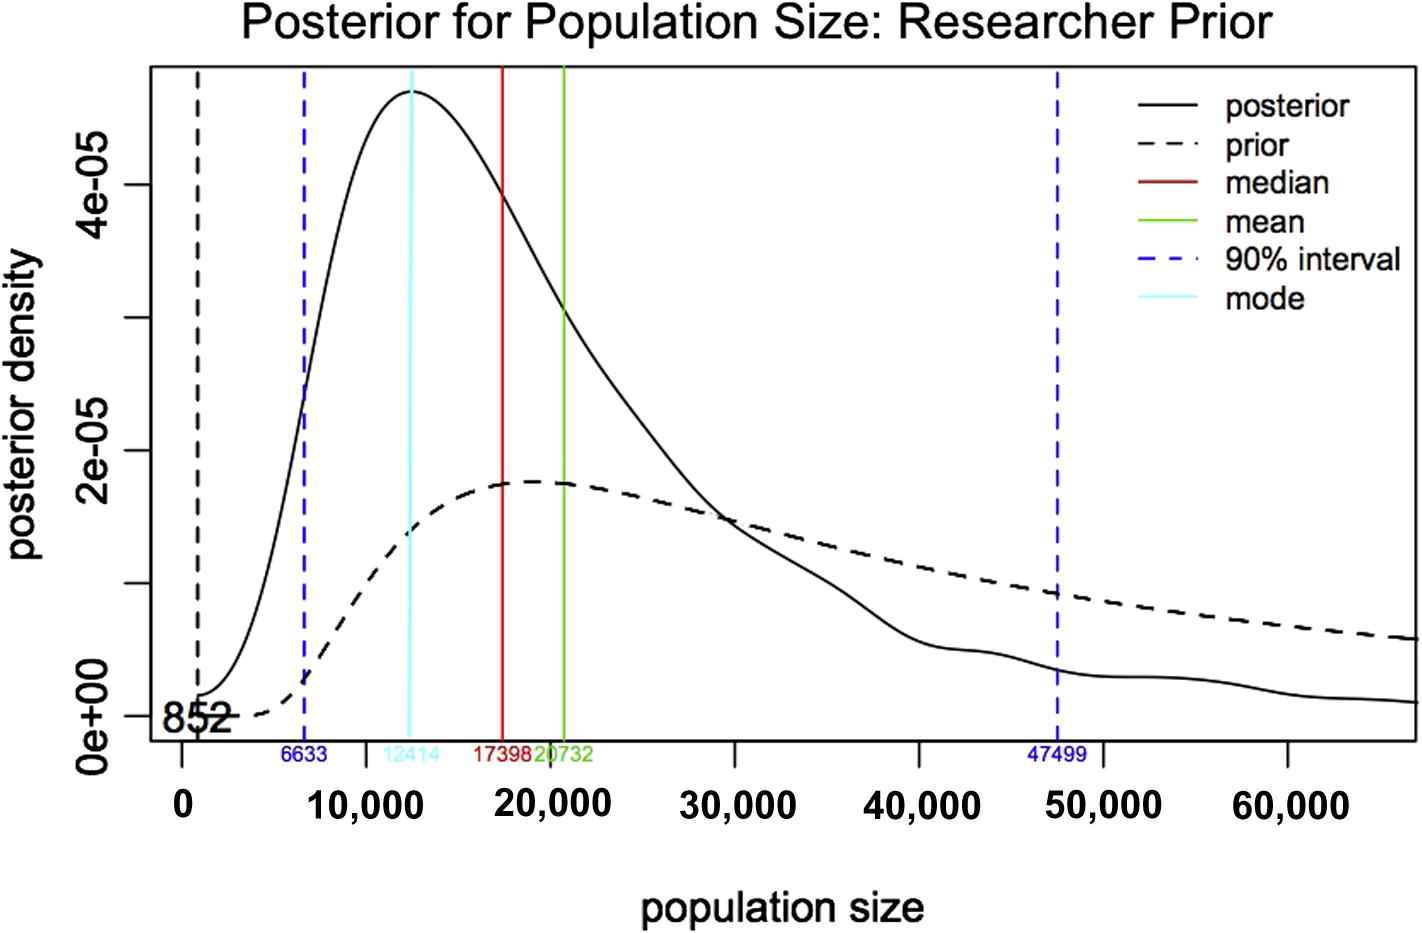
Given the wide disparity in the two groups, we ran two size estimations: one using priors from the researchers and the other using priors from the Congolese local experts. Table 1 displays results for both groups. To assess the reliability of the results and to determine which make most sense, prior and posterior plots were created (Fig. 3). The plot for the researchers shows a good fit [i.e., the prior (bottom line) and posterior (top line) lines have similar shape]; however, the plot for the local experts showed a poor fit. Therefore, we rely on the researcher prior when computing the final population size estimate. Based on SS-PSE using the researcher prior, the final most reasonable PSE for SVRPs in South Kivu Province is 17,398 with a probability interval of 6238 and 56,071.
| Mean | Median | Mode | 25% | 75% | 90% | 5% | 95% | |
|---|---|---|---|---|---|---|---|---|
| Researchers (n = 6) | ||||||||
| Prior | 57,645 | 42,584 | 19,100 | 24,076 | 78,490 | 127,387 | 10,074 | 175,834 |
| Posterior | 20,732 | 17,398 | 12,414 | 11,816 | 26,169 | 37,731 | 6633 | 47,499 |
| Congolese local experts (n = 3) | ||||||||
| Prior | 9842 | 6380 | 2974 | 3722 | 12,228 | 22,631 | 1814 | 38,190 |
| Posterior | 2859 | 2366 | 1633 | 1731 | 3343 | 4759 | 1340 | 6078 |
Results from successive sampling–population size estimation from researchers and Congolese local experts.
Population size estimation of female sexual violence-related pregnancies in South Kivu Province using successive sampling–population size estimation.
4. Discussion
We used the SS-PSE to estimate the population size of women with SVRPs in South Kivu Province, DRC with a final estimate of about 17,400. The upper and lower probability bounds of this estimate are wide, reflecting the uncertainty of the original priors from the researchers. While our original hypothesis was that the estimates based on NISS and EPI data (approximately 20,000 women) were potentially underestimating the number of SVRPs in South Kivu Province, our SS-PSE estimates were slightly lower than those from NISS and EPI data. This could reflect the true population size, an unknown bottleneck in the RDS study (resulting in an unreachable part of the population not included in the sample), or the fact that the study excluded women with SVRPs resulting in stillbirths or not raising their child born from SVRP. Alternatively, it is possible that although participants were asked about their social contacts living in South Kivu province, their social networks, and thus any resulting estimates, may be limited to the areas surrounding Bukavu, the city in which the survey was conducted. Given the relative isolation of some villages, this may underestimate provincial population size.
We tried to provide a real-life scenario of collecting prior information by asking numerous sources with different backgrounds to provide their best guesses of the population size. However, we found two distinct groups of estimates—those of researchers and those of Congolese local experts. Subsequent in-person follow-up conversation lead us to believe that the Congolese local experts may have provided estimates based on the number of women with SVRPs with whom they were professionally or personally in contact. For instance, one respondent who misinterpreted the questions about prior population size stated that she would have to speak with a supervisor before giving out numbers of the women they have seen in their organization. The low numbers reported by local experts may have represented the specific type of work they do. One local expert, for instance, provided logistical support for a survey about SVRPs, the second local expert worked with a local association supporting women affected by disasters and the third was a consultant with an international nongovernmental organization working in South Kivu. The discrepancy between researcher and local expert estimates may also be explained by reports from local experts that conceptualizing the size of a hidden population for an entire region (i.e. the province of South Kivu) was too challenging. In addition, local experts may have been more aware of a 2012 press conference in which a well-known local doctor stated that his hospital had seen more than 40,000 female survivors of rape since 1996 [22]. By contrast, researchers may have been influenced by previously published data on high rates of sexual violence and SVRPs in eastern DRC (i.e., NISS and EPI data), which likely contributed to their higher estimates. Confusion may also have arisen from misunderstandings of city, region, and country level rates; sexual violence versus sexual violence-related pregnancies; and unique cases versus unique women.
This example presents important information about carefully selecting sources for prior information and evaluating their responses before using them to generate an SS-PSE. One suggestion to improve the priors is to have sources meet together to agree upon prior estimates, as was done when producing SS-PSEs for several populations in Morocco [18]. However, this was not possible in the current work, which used e-mail and one face-to-face meeting to solicit prior estimates, saw a moderately poor response rate overall (3/8 Congolese local experts and 7/13 researchers), and required numerous reminder e-mails to get the responses presented here.
However, the variability in our prior estimates provided new information about the sensitivity of the SS-PSE to the priors. The wide variation in prior information demonstrates that population size estimation based solely on knowledge and experiences of persons familiar with the population is subject to numerous unmeasurable biases. In this study, the researchers’ prior median (42,584) was more than six times larger than the local experts’ prior median (6380). Ideally, the SS-PSE method would not be so sensitive to the choice of the prior, and the specific value would only affect the speed of convergence to the stationary distribution. Practically, however, as this example demonstrates, the choice of prior does matter. In fact, the 90% probability intervals barely overlap (Table 1), and the posterior median for each of the two estimates fall outside the probability interval of the other estimate. Therefore, it is important to attempt to reconcile vastly different priors before estimating population sizes using SS-PSE. These differences may be indicative of a misunderstanding of the question, or a representation of a high level of uncertainty about population size within a region, which itself may be of primary interest to researchers.
The vastly different population size estimates produced by the two priors could also reflect the information about population size in the RDS sample. This means that the estimates produced using SS-PSE would be more dependent on the prior and adjusted less by the observed data. One potential reason this RDS study may not contain a lot of information about population size is that most reported personal network sizes were small and similar, making it difficult to detect depletion in the network. Additionally, several of the seeds did not recruit, which may skew results. Finally, the visibility imputation method attempts to adjust self-reported network sizes based on observed recruitment characteristics including the number of people a participant enrolls in the study. However, this outcome may not contain information about the true visibility for this population.
Despite the implementation challenges and potential for biases inherent in the current RDS-related population size estimation techniques, the incorporation of these other techniques would have likely resulted in other size estimations as well as additional priors. The most widely used techniques include the unique object and service multipliers that rely on the overlap of data, one being nonrandom and the other being random (i.e., the RDS survey) [18,23–26]. In addition, the method known as wisdom of the crowds, which asks participants their estimates of the highest, lowest, and most accurate population sizes of their peer group, would have provided additional priors. These techniques do not add much extra cost to a survey and are being widely used in human immunodeficiency/AIDS related public health research [27]. We recommend that RDS surveys use as many different methods as possible in the hope of being able to triangulate all results into a final reasonable estimate. Unfortunately, most population size estimation techniques require the implementation of activities before and during data collection whereas the SS-PSE is the only method that can be implemented after data collection, as in the example presented here.
5. Conclusion
Using a combination of prior researcher estimates and available RDS data, we provide a new estimate of 17,398 for the number of women with SVRPs in South Kivu Province, DRC. The new estimate, which has wide upper and lower probability bounds, was slightly lower than estimates extrapolated from existed NISS and EPI data. This SS-PSE demonstrates the sensitivity of this methodology to prior estimates, suggesting a need for future studies to explore the accuracy of prior estimates before using them in SS-PSE models.
Conflicts of interest
All contributing authors declare no conflicts of interest.
Acknowledgments
The authors would like to acknowledge the women who participated in the study, as well as local study partners: Centre d’Assistance Médico-Psychosociale, Acteurs Dans le Development et Droit a la Sante Pour Tous, and Action pour la Lutte Contre L’Ignorance du SIDA. Daisy Njebenje, Amani Baro, and Ideumbo Kasigwa Helene assisted with translation. We thank colleagues from the Harvard Humanitarian Initiative for their support, as well as Drs Jennifer Scott, Ashley Greiner, Katherine Albutt, Sadia Haider, Gillian Burkhardt, Michael VanRooyen, and Monica Adhiambo Onyango. The Eleanor Miles Shore Foundation [GL Dept ID 01025283], Harvard Humanitarian Initiative, and the National Science Foundation Graduate Research Fellowship under Grant No. DGE-1144087 funded this study.
References
Cite this article
TY  - JOUR
AU  - Lisa G. Johnston
AU  - Katherine R. McLaughlin
AU  - Shada A. Rouhani
AU  - Susan A. Bartels
PY  - 2016
DA  - 2016/09/20
TI  - Measuring a hidden population: A novel technique to estimate the population size of women with sexual violence-related pregnancies in South Kivu Province, Democratic Republic of Congo
JO  - Journal of Epidemiology and Global Health
SP  - 45
EP  - 53
VL  - 7
IS  - 1
SN  - 2210-6014
UR  - https://doi.org/10.1016/j.jegh.2016.08.003
DO  - 10.1016/j.jegh.2016.08.003
ID  - Johnston2016
ER  -