
The prevalence of allergic rhinitis and atopic markers in obstructive sleep apnea
- DOI
- 10.1016/j.jegh.2016.06.001How to use a DOI?
- Keywords
- Allergic rhinitis; Atopic markers; Atopy; Obstructive sleep apnea
- Abstract
Allergic rhinitis (AR) related inflammation might worsen the severity of obstructive sleep apnea (OSA), however, the relationship between the two disorders remains controversial. Our aim was to determine the prevalence of AR and atopic markers in OSA. This cross-sectional study recruited participants with sleep-related complaints referred to a sleep center from February 2013 to June 2014. The diagnosis of OSA was based on the Berlin questionnaire (BQ) followed by confirmatory polysomnography (PSG). The diagnosis of AR was made via focused history and clinical examination and was confirmed by measuring atopic markers. OSA was diagnosed in 97 out of 157 adults attending the sleep clinic (61.8%). There was a high prevalence of AR (52.6%) among OSA individuals. This was not significantly different from the frequency in the non-OSA individuals (p = 0.5). Elevated total immunoglobulin E (IgE; >100 K/μL), eosinophil count, and positive Phadiatop tests were found in individuals with OSA to be 37.1%, 11.3%, and 41.2%, respectively. Individuals without OSA have shown similar percentages. In our cohort, there was no significant difference in frequency of AR and atopy among participants with OSA compared to those without OSA.
- Copyright
- © 2016 Ministry of Health, Saudi Arabia. Published by Elsevier Ltd.
- Open Access
- This is an open access article under the CC BY-NC-ND license (http://creativecommons.org/licenses/by-nc-nd/4.0/).
1. Introduction
Obstructive sleep apnea (OSA) refers to repeated episodes of halted respiration during sleep, despite a continuous effort to breathe [1]. Clinically, OSA is characterized by excessive daytime sleepiness, disruptive snoring, and nocturnal hypoxemia. This condition is a common sleep-breathing disorder affecting approximately 4.0% of males and 2.0% of females of middle age in the developed world [1]. Many studies have shown that OSA is a significant source of morbidity and mortality; it is associated with serious health consequences, mostly afflicting the cardiovascular and cerebrovascular systems [1]. In addition to excessive daytime sleepiness, people with OSA have subsequent decreased functional ability, which could lead to motor vehicle accidents [1].
The mechanism of OSA is not well understood, but is mostly attributed to mechanical upper airway disruption (airway narrowing or collapse), leading to increased airflow resistance. Accordingly, several reports have hypothesized that allergic rhinitis (AR) may influence the occurrence of OSA through inflammatory elements that induce nasal congestion and subsequently nasal obstruction [2]. In addition, the high nasal resistance secondary to nasal obstruction leads to a more negative intraluminal pressure in the lower airways that may promote partial or intermittent collapse of the pharynx, thus increasing the risk of OSA. This hypothesis is strengthened by the beneficial effect of intranasal corticosteroid in OSA and rhinitis [6].
Several studies have proposed a link between AR and OSA. Recently, a Turkish study reported that 23.0% of OSA patients had AR [3], whereas several European studies have revealed variable rates [4]. We also recently reported that approximately half of OSA patients in a pilot study had AR, regardless of the severity of sleep apnea [5]. Furthermore, several clinical trials investigating the effect of treating AR in OSA patients found very promising outcomes. In particular, by reducing levels of inflammatory mediators, AR treatment may improve the severity of OSA, the quality of sleep, and daytime somnolence [6]. These findings illustrate a possible link between OSA and AR, and also suggest a role for allergic inflammatory mediators (e.g., eosinophils) in the development and progression of sleep-disordered breathing. Additionally, other atopic diseases, such as bronchial asthma (BA) and atopic dermatitis, have been implicated in sleep-disordered breathing, mostly among children [7]. This significant finding sheds light on the potential role of allergic sensitization (atopy) in the pathophysiology of OSA.
Individuals with atopy are usually identified based on the presence of allergic diseases such as asthma, AR, allergic conjunctivitis, food allergy, and eczema [8]. Allergic sensitization to allergens is classically confirmed by an in vivo skin-prick test (SPT) or an in vitro assay for specific serum immunoglobulin E (IgE) antibodies [8]. Total IgE and peripheral eosinophils have also been established in the literature as nonspecific markers of atopy; however, their diagnostic value is limited [9].
In addition to a lack of local data, the relationship between AR and OSA remains controversial in the literature. Furthermore, the association between atopy and OSA is not well established in the adult population. Therefore, the present study aimed to determine the prevalence of atopy in general and of AR in particular among adult OSA patients referred to a university-based sleep center. This is a continuation of a previously small pilot study addressing the relation between AR and OSA (5), as it is felt that the subject has not been fully evaluated. Therefore a relatively larger study is needed to address the possible association and hence this study.
2. Materials and methods
In this cross-sectional study, all participants with sleep disorders who were referred to the sleep clinic at King Abdulaziz University Hospital in Jeddah, Saudi Arabia from February 2013 to June 2014 were recruited. Hospital ethics committee approval was obtained, and written informed consent was requested from all participants. The study end points were estimates of the prevalence of atopy and AR among OSA patients.
Individuals who refused to participate or to complete the requirements of the study were excluded. The study was conducted in two stages. In Stage 1, each participant was interviewed and examined by a trained physician. The information collected included demographic data, history of comorbidities, symptoms of atopy and AR, the risk of OSA determined using the Berlin questionnaire (BQ) as a screening tool [10], and the propensity for daytime sleepiness determined using the Epworth sleepiness scale (ESS) [11]. These assessments were followed by a nasal examination to detect local signs of AR. Each participant was then evaluated for atopy by measuring the total serum level of IgE, the total eosinophil count, and the levels of serum IgE antibodies specific to common allergens.
In Stage 2, all participants classified as at high risk for OSA based on the BQ underwent confirmatory overnight polysomnography (PSG). PSG type 1 is considered as the gold standard diagnostic test for OSA [12]. The apnea-hypopnea index (AHI), which is the average number of episodes of apnea and hypopnea per hour of sleep, was also calculated prior to the diagnosis of OSA [13]. Apnea and hypopnea events were defined according to the criteria of the American Academy of Sleep Medicine [14]. More specifically, OSA is said to exist when the AHI is greater than five, coupled with symptoms or signs of disturbed sleep, or when the AHI is ≥15, regardless of symptoms [13]. OSA severity was classified as mild, moderate, or severe based on AHI values of 5, 15, and 30, respectively [14].
2.1. Establishing the diagnosis of atopy
Atopy was evaluated based on the presence of allergic diseases and screening for sensitization to common inhalant allergens, as reflected by specific IgE antibodies in the serum detected using the Phadiatop IgE antibody addition, the elevated total serum level of IgE, and the absolute eosinophil count were measured, and we adopted cutoff values of >100 K/μL and >0.45 K/μL, respectively.
2.2. Establishing the diagnosis of AR
The recent Allergic Rhinitis and its Impact on Asthma (ARIA) guideline states that the diagnosis of AR should mostly be made through a combination of the physician’s clinical judgment and the available diagnostic investigations [2]. In the present study, AR diagnosis was mainly based on three symptoms (sneezing and nasal itch, watery rhinorrhea, and nasal blockade); supportive findings of physical signs, if they existed (indicating active disease); and an increased level of total serum IgE antibody and/or identified sensitization to inhalant allergens based on serum allergen-specific IgE antibody measurements.
2.3. Statistical analysis
The statistical analysis was performed using the software STATA for Macintosh version 13.0 (Stata Corporation, College Station, TX, USA). Descriptive data are presented as the means and standard deviations for continuous variables when normally distributed, and as medians and interquartile ranges when skewed. Categorical variables are presented as counts and percentages. Comparisons of demographics, clinical and laboratory values between the OSA and the non-OSA groups were also performed using Student t test for continuous variables and the Chi-square test followed by the Fisher’s exact test for some categorical variables. A p value of 0.05 was adopted as the level of statistical significance.
3. Results
A total of 177 patients with sleep-related complaints were interviewed and screened for OSA during the study period. Only 157 patients completely filled out their questionnaires and thus were included in the study [i.e., 20 (11.3%) patients were excluded]. In all, 97 patients were identified as suffering from OSA (61.8%), 63.0% (n = 65) of whom were males, with a mean age of 48.9 ± 11.9 years and a mean body mass index (BMI) of 42.5 ± 17.1 kg/m2. The non-OSA group comprised 38.2% (n = 60) of the studied cohort, 55.0% (n = 33) of whom were males, with a mean age of 39.5 ± 14 years and a mean BMI of 29.1 ± 7.1 kg/m2. The final diagnoses of the non-OSA group were as follows: insomnia, 16 cases; narcolepsy, four cases; restless legs syndrome, three cases; habitual snoring, 12 cases; poor sleep hygiene, 24 cases; and severe kyphosis, one case.
Smokers constituted 17.2% (n = 27) of the sample and were slightly more frequent in the non-OSA group compared with the OSA group (20.0%, n = 12 vs. 15.5%, n = 15). Significant differences in age, BMI, and the frequency of ex-smokers were observed between the OSA and the non-OSA groups (Table 1).
| Characteristic | Overall mean ± SD n (%) | Non-OSA mean ± SD n (%) | OSA mean ± SD n (%) | p |
|---|---|---|---|---|
| Patients (No. (%)) | 157 (100.0) | 60 (38.2) | 97 (61.8) | NA |
| Age (y) | 45.3 ± 13.5 | 39.5 ± 14 | 48.9 ± 11.9 | 0.01 |
| Gender: | ||||
| Male | 96 (61.2) | 33 (55.0) | 63 (65.0) | 0.21 |
| Female | 61 (38.9) | 27 (45.0) | 34 (35.1) | |
| Smokers | 27 (17.2) | 12 (20.0) | 15 (15.5) | 0.46 |
| Ex-smokers | 49 (31.2) | 13 (21.7) | 36 (37.1) | 0.04 |
| Snoring: | ||||
| Yes | 122 (77.7) | 34 (56.7) | 88 (90.7) | 0.01 |
| No | 23 (14.7) | 18 (30.0) | 5 (5.2) | |
| Unknown | 12 (7.7) | 8 (13.3) | 4 (4.1) | |
| AHI (median, IQR) | 11.2 (1.7–32.4) | 0.4 (0.0–2.8) | 26.8 (12.4–45.7) | 0.01 |
| % of sleep time with O2 saturation below 90%, median (IQR) | 1.4 (0.0–25.9) | 0 (0–0.5) | 7.6 (0.9–45.5) | 0.01 |
| Weight (kg) | 97 ± 29.2 | 78.3 ± 18.5 | 108.5 ± 28.8 | 0.01 |
| Height (cm) | 164 ± 10.5 | 164 ± 10.3 | 164 ± 10.7 | 0.97 |
| BMI (kg/m2) | 37.4 ± 15.6 | 29.1 ± 7.1 | 42.5 ± 17.1 | 0.01 |
| Neck circumference (inches) | 15.9 ± 2 | 14.8 ± 1.7 | 16.6 ± 1.9 | 0.01 |
| ESS score | 12 ± 6.1 | 10.4 ± 6.1 | 12.9 ± 6 | 0.01 |
| BQ score | ||||
| High risk | 120 (76.4) | 32 (53.3) | 88 (90.7) | 0.01 |
| Low risk | 37 (23.6) | 28 (46.7) | 9 (9.3) | |
| Allergic rhinitis | 86 (54.8) | 35 (58.3) | 51 (52.6) | 0.50 |
| Bronchial asthma | 81 (51.6) | 33 (55.0) | 48 (49.5) | 0.50 |
| Diabetes mellitus | 52 (33.1) | 16 (26.7) | 36 (37.1) | 0.18 |
| Hypertension | 72 (45.9) | 17 (28.3) | 55 (56.7) | 0.01 |
| Stroke | 10 (6.4) | 2 (3.3) | 8 (8.3) | 0.22 |
| IHD | 23 (14.7) | 3 (5.0) | 20 (20.6) | 0.01 |
| GERD | 70 (44.6) | 20 (33.3) | 50 (51.6) | 0.03 |
| COPD | 10 (6.4) | 2 (3.3) | 8 (8.3) | 0.32 |
AHI, apnea-hypopnea index; BMI, body mass index; COPD, chronic obstructive pulmonary disease; CI: Confidence interval; ESS, Epworth Sleepiness Scale; GERD, gastroesophageal reflux disease; IHD, ischemic heart disease; SD, standard deviation.
Demographic data and clinical characteristics of study participants.
The medians of sleep parameters, namely, the AHI and the percentage of sleep time with O2 saturation <90.0%, were significantly higher in the OSA group. However, both groups seemed to be sleepy because their mean ESS scores were >10, although ESS scores and snoring were significantly higher in the OSA group compared with the non-OSA group. The most commonly encountered comorbidities in our sample were AR, BA, hypertension (HTN), gastroesophageal reflux disease (GERD), and diabetes mellitus; only HTN and GERD were significantly more frequent among OSA patients (Table 1).
AR was encountered in 51 patients with OSA (52.6%). However, in the non-OSA group, AR was found in 36 participants (60.0%), which was not significantly different from the rate in the OSA group (p = 0.3), suggesting a high prevalence of AR among patients attending the sleep clinic.
The OSA group was further divided into two groups according to the presence (AR-OSA) or absence (non-AR-OSA) of AR. Some of the sleep parameters (snoring, BQ score, and AHI) were slightly higher in the AR-OSA group compared with the non-AR-OSA group, but this difference was not significant (Table 2). However, there was a tendency toward increased OSA severity (although not statistically significant) among the AR-OSA group compared with the non-AR-OSA group, as indicated by the AHI [Pearson’s Chi-square test 2(3) = 1.7114, p = 0.63] (Fig. 1). Also, Fig. 1 demonstrated that, although there is a tendency of a link between severity of OSA and AR, this association was not significant.
| Sleep parameter | Overall | Nonallergic rhinitis | Allergic rhinitis | p |
|---|---|---|---|---|
| No. of patients | 97 (100) | 46 (47.4) | 51 (52.6) | NA |
| Snoring: | ||||
| Yes | 88 (90.7) | 43 (93.5) | 45 (88.2) | 0.61 |
| No | 5 (5.2) | 2 (4.4) | 3 (5.9) | |
| Unknown | 4 (4.1) | 1 (2.2) | 3 (5.9) | |
| ESS score | 12.9 ± 6 | 13.3 ± 6.4 | 12.4 ± 5.6 | 0.45 |
| BQ score: | ||||
| High risk | 88 (90.7) | 42 (91.3) | 46 (90.2) | 0.85 |
| Low risk | 9 (9.3) | 4 (8.7) | 5 (9.8) | |
| AHI | 26.8 (12.4–45.7) | 24.2 (11.2–44.7) | 30.3 (15.6–46.6) | 0.33 |
| % of sleep time with O2 saturation ⩽90%, median (IQR) | 1.4 (0.0–25.9) | 8.0 (0.9–49.8) | 7.6 (0.6–37.4) | 0.76 |
Data are presented as n (%), mean ± SD, or median (IQR).
BQ, Berlin questionnaire: high risk indicates the clinical probability of obstructive sleep apnea (OSA) is high; low risk indicates a low clinical probability of OSA; ESS, Epworth sleepiness scale; IQR, interquartile ranges; SD, standard deviation.
Sleep parameters in obstructive sleep apnea (OSA) patients with and without allergic rhinitis (AR).
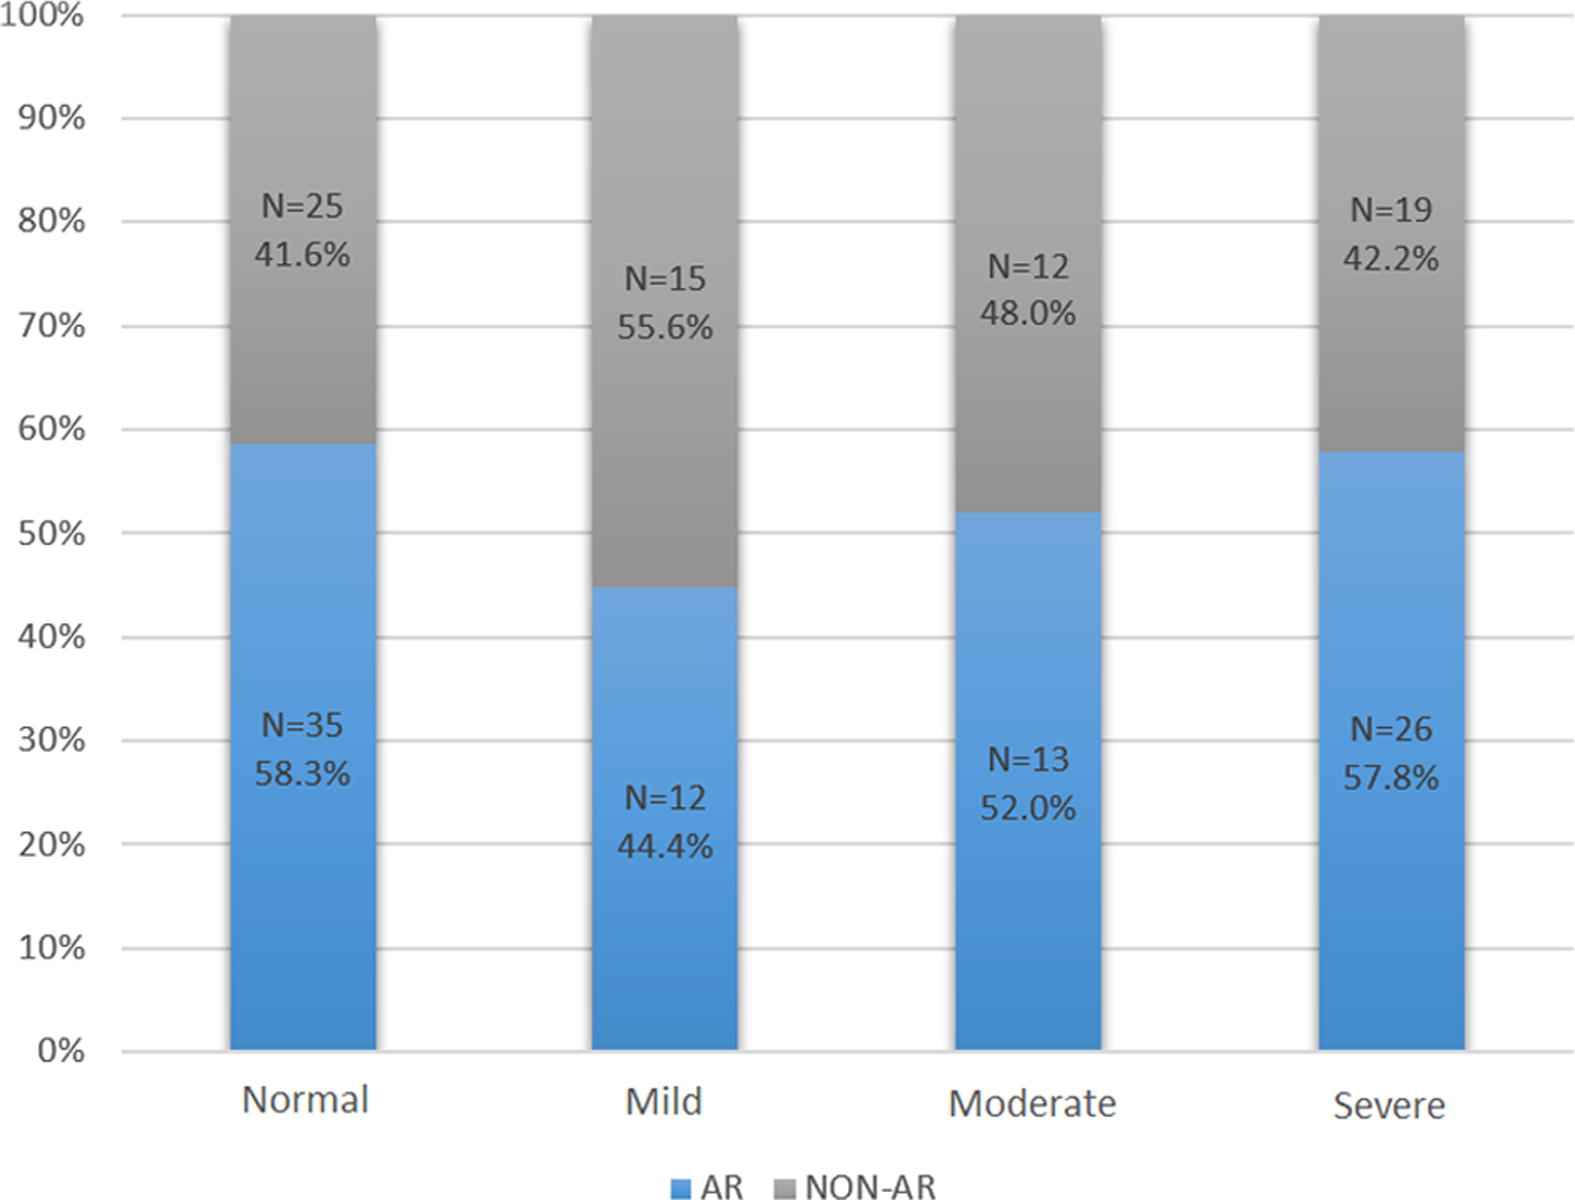
Frequency of allergic rhinitis (AR) among obstructive sleep apnea (OSA) groups. Pearson’s Chi-square test 2 (3) = 1.7114, p = 0.63. Obstructive sleep apnea (OSA) severity: Normal (AHI = 1–4.9), Mild (AHI = 5–14.9), Moderate (AHI = 15–29.9), Severe (AHI ⩾ 30), where AHI is the apnea-hypopnea index. AR = allergic rhinitis.
Regarding atopy parameters, 59 individuals (37.6%) had elevated total IgE (>100 K/μL), 36 (37.1%) of whom had OSA. Eosinophil counts were elevated (>0.45 K/μL) in only 18 (11.5%) individuals, of whom 11 (11.3%) had OSA. Close to half of the non-OSA and OSA groups [27 (45.0%) vs. 40 (41.2%)] had a positive Phadiatop test, with a slightly higher percentage in the non-OSA group. However, no statistically significant differences were found (Table 3).
| Parameter | Overall | Non-OSA | OSA | p |
|---|---|---|---|---|
| No. of patients | 157 (100) | 60 (38.2) | 97 (61.8) | NA |
| Total IgE >100 K/μL | 59 (37.6) | 23 (38.3) | 36 (37.1) | 0.88 |
| Eosinophil count >0.4 K/μL | 18 (11.5) | 7 (11.7) | 11 (11.3) | 0.95 |
| Positive Phadiatop test | 67 (42.7) | 27 (45) | 40 (41.2) | 0.64 |
Data are presented as n (%).
IgE, immunoglobulin E; OSA, obstructive sleep apnea.
Laboratory atopy parameters.
4. Discussion
The main outcome of this study was a high frequency of OSA (61.8%) within the study population, along with a high prevalence of AR (52.6%) among the OSA patients and non-OSA individuals (58.0%). However, a statistically significant difference in the frequency of AR among patients with OSA compared to those without OSA was not found in our cohort. Although, we showed a trend of an increased AHI among patients in the AR-OSA group compared with those in the non-AR-OSA group, this trend was not statistically significant. However, we demonstrated that patients in the AR-OSA group were more likely to have severe OSA compared with those in the non-AR-OSA group (57.8% compared with 42.2%).
The high frequency of OSA detected among patients referred to the sleep clinic in this study is not unusual and has been reported previously. One systematic review revealed that up to 90% of patients referred due to sleep complaints had OSA [15]. This feature is particularly common among those with comorbidities such as HTN, diabetes, and GERD, which were also common in our study population [16].
Although there was no significant difference between the prevalence of AR among those with or without OSA in our cohort sample, we suspect that the prevalence of AR in the non-OSA group does not represent the actual frequency of AR in Saudi Arabia. In fact, the prevalence of AR in the general population in Saudi Arabia is not known. Nevertheless, a 52.6% prevalence of AR among OSA patients is very high compared to the prevalence of AR in the general population elsewhere. Studies from Europe and North America have reported that the prevalence of AR among children and adults ranges from 10.0% to 30.0% [17,18]. In the Middle Eastern population, the data are more limited; however, it was recently reported that one tenth of this population suffers from AR [19]. In Saudi Arabia, there is no extant data on the prevalence of AR among Saudi adults; however, there are reports of nearly one quarter of Saudi children suffering from AR, with an increasing trend over the past decade [20]. Surprisingly, of the 60 patients who were found to be OSA-free in our study, 35 (58.3%) were concurrently suffering from AR. This may be suggestive of AR being highly prevalent in the Saudi population, however, one limitation to keep in mind is that our study was hospital-based. Furthermore, the mean age of the AR group in our study was middle-aged; because the symptoms of AR tend to decline with age, it is unlikely that the prevalence of AR in middle-aged adults is higher than that in children. A plausible explanation for the very high prevalence of AR among non-OSA cases in our study could be the fact that patients with AR are likely to have disturbed sleep – even without OSA – which may result in more frequent visits to sleep clinics. This is a potential hypothesis which presents a limitation to our study and emphasizes the importance of conducting future general population-based studies. Therefore, although our study showed no significant association between AR and OSA when compared with the non-OSA group, these results should be interpreted with caution, taking into account the aforementioned limitations.
The link between the two conditions has been discussed in the literature before and it has been suggested that treating AR may improve symptoms of OSA. In 1997, Young et al. [21] described AR as a potential risk factor for OSA in a population-based study. The authors found that the study participants with nasal congestion due to allergy were 1.8 times more likely to have moderate to severe OSA than those without nasal congestion; however, a linear relationship between nasal obstruction and the severity of sleep-disordered breathing was not found. Subsequently, several studies that investigated AR as a risk factor for OSA produced similarly variable outcomes. In fact, many studies have suggested that there is an increased prevalence of AR among patients with OSA. Gül et al. [3] investigated 80 patients with OSA and found that 23.0% had AR. In another study, Canova et al. [4] also reported an increased prevalence of perennial AR in OSA patients compared with patients with chronic obstructive pulmonary disease (11.0% vs. 2.3%). Based on subjective criteria, Léger et al. [22] reported that OSA was more prevalent in AR patients than in controls. However, our study failed to demonstrate this positive correlation between AR and OSA. This discrepancy with the previous studies may be attributed to different methodologies and the fact that there was a high prevalence of AR among our cohort patients. Interestingly, one recent study reported a significant positive correlation between clinical control of rhinitis symptoms and clinical control of OSA [23]. Although the effect of treating AR on the control of OSA was not addressed in our study, we reported a trend of a slightly increased AHI (not statistically significant) among patients with AR and OSA in our study. In addition, when we classified the severity of the AR-OSA and non-AR-OSA groups as severe, moderate, or mild OSA, we noticed that more patients with severe OSA were identified in the former group than in the latter group.
In the present study, we were especially interested in the results of sensitization to common inhalant allergens and used Phadiatop to confirm atopy. Phadiatop tests were found to be positive in 41.2% of the OSA group and nearly half of the non-OSA group, but these percentages were not significantly different. These results seem to be consistent with several studies assessing the same association in patients undergoing an SPT. For example, Rochford et al, found that 74.0% of subjects with OSA undergoing an SPT were atopic [24]. Similarly, in a more recent study, investigators found that atopy based on the SPT was present in approximately 72.5% of subjects who were at high risk of OSA according to the BQ. Of those, 69.2% who were confirmed to have OSA via PSG were found to be atopic as well [25]. In addition, allergic sensitization was also linked to snoring in children [26]. Previous epidemiologic studies revealed patients with asthma to be at a higher risk of OSA than those without asthma [27,28]. Furthermore, several studies demonstrated that OSA is more common in moderate to severe as well as difficult to treat asthma. In fact, BA and AR often coexist as the one airway hypothesis implies representing a spectrum of the same disease [29]. However, only recently Teodorescu et al, in a population-based study reported that asthma is associated with an increased risk of new-onset OSA [30]. In spite of that, our study failed to demonstrate increased rates of BA among OSA compared with non-OSA patients. Again this discrepancy could be explained by the different methodologies and different cohort patients used in our study.
To the best of our knowledge, this study is the first of its kind in the region. Although it was suggested that AR may be linked to OSA, our study failed to demonstrate a significant difference in the prevalence of AR between the OSA and non-OSA groups. However, our study had certain limitations, including the selection bias and the relatively small sample size, which could bias the association toward the null. In addition, our study failed to demonstrate a significant association between atopic markers with OSA. Nevertheless, our study demonstrated a trend of increased severity of OSA among AR patients, but failed to reach statistical difference. This warrants further investigation in a larger study, which ideally should be population-based rather than conducted among patients attending a sleep clinic.
5. Conflicts of interest
All contributing authors declare no conflicts of interest. All authors have no financial involvement in any organization with a direct financial interest in the subject discussed in the submitted manuscript.
Acknowledgments
We would like to thank all the Sleep Medicine and Research Center staff at KAUH, and especially Ms. Haneen Almutairi and Mr. Ahmad Abu Zahra for their generous help with data collection and data entry. No financial support was received for this research.
References
Cite this article
TY  - JOUR
AU  - Ghadah Gadi
AU  - Siraj Wali
AU  - Emad Koshak
AU  - Mohammad Albar
AU  - Abdulkareem Fida
AU  - Muntasir Abdelaziz
AU  - Khaled Alnoury
AU  - Nabil Alama
PY  - 2016
DA  - 2016/06/27
TI  - The prevalence of allergic rhinitis and atopic markers in obstructive sleep apnea
JO  - Journal of Epidemiology and Global Health
SP  - 37
EP  - 44
VL  - 7
IS  - 1
SN  - 2210-6014
UR  - https://doi.org/10.1016/j.jegh.2016.06.001
DO  - 10.1016/j.jegh.2016.06.001
ID  - Gadi2016
ER  -