
Effect of China’s Zero-Tariff Treatment under Forum on China-Africa Cooperation (FOCAC) on Export Diversification in Beneficiary Countries in Africa
 , Ehizuelen Michael Mitchell Omoruyi2
- DOI
- 10.2991/jat.k.210618.001How to use a DOI?
- Keywords
- China; zero-tariff treatment; export diversification; Africa; Forum on China–Africa Cooperation
- Abstract
In this study, we quantitatively assessed the effect of China’s zero-tariff treatment on export diversification in beneficiary countries in Africa. We assessed its overall effect and its effect on particular industries and regions. The results showed that, overall, zero-tariff treatment significantly promoted export diversification. At the level of industry, zero-tariff treatment had a significant role in promoting the diversification of exports from the manufacturing industry, but did not significantly affect agriculture or mining. At the regional level, zero-tariff treatment significantly promoted export diversification among group members belonging to four major regional economic communities in Africa, albeit to varying degrees. Furthermore, three recommendations are proposed for improving the effect of zero-tariff treatment: expanding the use of benefits across regional groupings, reducing non-tariff barriers, and supporting African countries to enhance exports and production capacity.
- Copyright
- © 2021 African Export-Import Bank. Publishing services by Atlantis Press International B.V.
- Open Access
- This is an open access article distributed under the CC BY-NC 4.0 license (http://creativecommons.org/licenses/by-nc/4.0/).
1. INTRODUCTION
There are 47 least developed countries (LDCs) in the world, and 33 of them are in Africa. Although most African countries have experienced remarkable economic growth in recent years, their export structure remains concentrated in a few primary products, constraining their sustainable economic development in the long term (Masunda, 2020).
In order to assist African countries, especially LDCs, to increase their export competitiveness and promote economic growth, some developed economies that were authorized by the “Enabling Clause” of General Agreement on Tariffs and Trade (GATT)/WTO have implemented a series of nonreciprocal preferential trade agreements on goods exported from African countries. For example, the Generalized System of Preferences targets all developing countries; the African Growth and Opportunity Act (AGOA), implemented by the United States, targets sub-Saharan African countries; and Everything But Arms (EBA), granted by the European Union (EU), targets all LDCs. These trade preferences have received widespread attention from academia and the international community but, according to research, they have failed to increase exports in developing countries (Zappile, 2011; Persson, 2013; Gradeva and Martínez-Zarzoso, 2016). Other major African trading partners, such as China, have similar trade schemes in place to improve access to their markets for African countries. For example, China has attached great importance to supporting African countries and expanding exports, beginning with the first Forum on China–Africa Cooperation (FOCAC) held in 2000. At the second FOCAC in 2003, China granted zero-tariff treatment to goods exported from LDCs in Africa. This policy was officially implemented in 2005 and remains in place. To the best of our knowledge, however, few studies have investigated its effects.
We employed a trade gravity model to empirically assess the effect of China’s zero-tariff treatment under the FOCAC framework on export diversification in African countries. The study contributes to existing literature in three ways. First, we selected China’s zero-tariff treatment in Africa to demonstrate the effect of nonreciprocal preferential trade agreements implemented by developing countries on export diversification in other developing countries-‘South-South’ cooperation. Second, we used HS8-digit trade data (the most detailed classification data) from 2001 to 2017 to evaluate the effect of China’s zero-tariff treatment on export diversification in 31 beneficiary countries in Africa. We assessed the overall effect of zero-tariff treatment, and its effect on particular industries and regions. Third, we adopted the number of goods exported as a measure of export diversification. This avoids the impact of price changes, which affect other methods such as the Herfindahl–Hirschman Index (HHI). Nonetheless, we also employed HHI as a robustness check. We adopted panel Poisson regression instead of ordinary least squares because dependent variables (export diversification) are count variables with a large number of zeroes. Panel negative binomial regression was then used to account for the problem of excessive dispersion.
The remainder of this paper is organized as follows. Section 2 provides the background for China’s zero-tariff treatment under the FOCAC framework and presents its main characteristics. Section 3 summarizes the conclusions to be drawn from previous studies on the effect of preferential trade agreements on trade and export diversification. Section 4 describes the empirical method, and Section 5 presents the empirical results. Section 6 provides robustness tests. Section 7 summarizes the main conclusions and discusses policy implications.
2. MAIN CHARACTERISTICS OF CHINA’S ZERO-TARIFF TREATMENT UNDER THE FOCAC FRAMEWORK
Forum on China–Africa Cooperation (FOCAC) represents a collective dialogue between China and African countries in the context of South–South cooperation, with the objectives of equal consultation, enhancing understanding, expanding consensus, strengthening friendship, and promoting cooperation. The first FOCAC ministerial conference was held in Beijing in October 2000. It was then held every three years, most recently in 2018. At previous FOCAC ministerial conferences, balancing bilateral trade and assisting African countries to diversify their exports have ostensibly been an important part of trade cooperation between China and Africa. To this end, at the second FOCAC ministerial conference held in Ethiopia in 2003, the former premier of China, Wen Jiabao, officially announced that zero-tariff treatment would be granted to LDCs in Africa when their goods entered the Chinese market. As detailed in Table 1, during the period from its official implementation on January 1, 2005 to the end of 2018, the policy underwent three important changes:
- (1)
The number of beneficiary countries has increased steadily. In 2003, China identified 30 beneficiary countries based on two conditions: belonging to LDCs and establishing diplomatic relations with China. The beneficiaries comprised Ethiopia, Angola, Benin, Burundi, Equatorial Guinea, Togo, Eritrea, Cape Verde, Democratic Republic of the Congo (DRC), Djibouti, Guinea, Guinea-Bissau, Comoros, Lesotho, Liberia, Rwanda, Madagascar, Mali, Mauritania, Mozambique, Niger, Sierra Leone, Senegal, Sudan, Somalia, Tanzania, Uganda, Zambia, Chad, and Central African Republic.1 Since then, the list of beneficiary countries has been adjusted several times: Malawi (2010), South Sudan (2015), Gambia (2017), Sao Tome and Principe (2017), Burkina Faso (2018) were added as a result of their establishment of diplomatic relations with China; Equatorial Guinea (2013) and Cape Verde (2014) were excluded because they graduated from the list of LDCs. At the end of 2018, there were 33 beneficiary countries in total.
- (2)
The coverage of beneficiary goods has gradually expanded. Since China implemented the zero-tariff policy, the coverage of beneficiary goods has undergone several adjustments: from the initial 190 to 440 commodities, then expanded to 95% of all tariff lines, and finally to 97% of all tariff lines. According to China’s 2018 tariff adjustment plan published by China’s Ministry of Finance, 97% of all tariff lines that enjoy zero-tariff treatment comprise 8256 commodities, including most agricultural and manufacturing goods. The remaining 3% of all tariff lines include 293 commodities that are still subject to most-favored-nation tariffs when they enter the Chinese market. These include a small number of sensitive commodities such as cereals, animal and vegetable oils, sugar, plastics, beverages, tobacco, fertilizers, wood products, and vehicle parts. The tariffs on these products also apply to other countries.
- (3)
The rules of origin have become more flexible and reasonable. The latest rules of origin implemented by China’s customs administration in 2017 were based on the 2010 and 2013 versions, which fully considered the geographical limitations and economic integration of beneficiary countries in Africa.2 On the one hand, the requirement to provide a bill of landing from the exporting country was changed to a requirement for supporting documents issued or accepted by the third country or by customs. This relaxed the requirements regarding transport documents for most of the beneficiary countries in Africa, and especially benefitted landlocked countries that rely on land transport through a third country with ports and shipping to China. On the other hand, the new rules of origin added bilateral and regional group accumulation as standards of origin, which widened the application range of zero-tariff treatment. Currently, beneficiary countries that belong to members of the Economic Community of West African States are allowed to use raw materials originating from other member states of the group. In addition, the new rules of origin are committed to promoting paperless certificates of origin and improving the efficiency of customs clearance.
| FOCAC | Regulation | Effective date | Beneficiary countries | Beneficiary goods |
|---|---|---|---|---|
| I October 2000 | Both parties are aware of the importance of providing exports from African countries preferential access to the Chinese market. | |||
| II December 2003 | China decided to grant zero-tariff treatment | January 1, 2005 | 25 countries: the original 30 countries, except Angola, Equatorial Guinea, Chad, Somalia, and Senegal | 190 |
| III November 2006 | China expanded the number of beneficiary goods from 190 to more than 440 commodities | January 1, 2007 | 28 countries: the original 30 countries, except Chad and Somalia | 200 |
| January 1, 2008 | 30 countries: the original 30 countries | 458 | ||
| IV November 2009 | China gradually granted zero-tariff treatment to 95% of products | January 1, 2010 | 31 countries: the original 30 countries, plus Malawi | 1218 |
| January 1, 2012 | 30 countries: the original 30 countries | 4762 | ||
| V November 2012 | China gradually granted zero-tariff treatment to 97% of all tariff lines | January 1, 2014 | 30 countries: the original 30 countries, excluding Cape Verde and adding Malawi. The 30 countries are divided into two groups. The first group includes Equatorial Guinea, Mauritania, and Somalia; the second group includes the remaining countries | 60% of all tariff lines with zero tariffs for the first group; 95% of all tariff lines with zero tariffs for the second group |
| January 1, 2015 | 31 countries: the original 30 plus Malawi and South Sudan, excluding Cape Verde. These are divided into three groups. The first group is Mauritania; the second group is Angola, Benin, Togo, Eritrea, Comoros, Liberia, Rwanda, Niger, and Zambia; the third group includes the remaining countries | 60% of all tariff lines with zero tariffs for the first group; 95% of all tariff lines with zero tariffs for the second group; 97% of all tariff lines with zero tariffs for the third group | ||
| VI December 2015 | China continued to actively implement zero-tariff treatment to 97% of all tariff lines | December 12, 2015 | 8 countries: Comoros, Mauritania, Togo, Liberia, Rwanda, Angola, Niger, and Zambia | 97% of all tariff lines |
| December 1, 2017 | 2 countries: Gambia and Sao Tome and Principe | 97% of all tariff lines | ||
| VII September 2018 | China continued to actively implement zero-tariff treatment to 97% of all tariff lines | September 1, 2018 | 1 country: Burkina Faso | 97% of all tariff lines |
Source: China Customs website and FOCAC website.
Provisions and implementation of China’s zero-tariff treatment in previous FOCAC ministerial conferences
In summary, China’s zero-tariff treatment is a unilateral and voluntary preferential trade agreement for exports from African countries that belong to LDCs and establish diplomatic relations with China under the FOCAC framework. This policy also conforms to the “Enabling Clause” of GATT/WTO. In addition to cutting tariffs, China expanded imports from African countries by establishing African product-exhibition centers in China, granting aid for trade-related projects, setting up special funds to finance imports from African countries, and supporting African countries to participate in the China International Import Expo.
3. LITERATURE REVIEW
Several scholars have studied the effects of unilateral preferential trade agreements implemented by developed countries on the total export volume of beneficiary countries in Africa, but their conclusions are inconsistent. First, some studies have found that preferential trade agreements have a positive impact on the exports of beneficiary countries. Ianchovichina et al. (2001) adopted the CGE model and found that preferential market access granted by the EU, Japan, the United States, and Canada would increase exports (non-oil commodities) from sub-Saharan African countries by 14%. Cernat et al. (2004) also used the CGE model and found that the EU-implemented EBA significantly promoted exports in sub-Saharan African countries—especially sugar exports, which increased nearly 10 times. Frazer and Biesebroeck (2010) used the triple difference method to evaluate the impact of AGOA on the exports of African beneficiary countries. They found that AGOA had a large and robust impact on apparel exports from beneficiary countries to the United States, as well as on agricultural and manufacturing exports.
Contradicting the above findings, however, other studies have found that preferential trade agreements have no impact on the exports of beneficiary countries. Zappile (2011) evaluated the impact of AGOA on exports (non-oil commodities) of beneficiary countries to the United States, based on the trade gravity model. The results showed that neither AGOA nor AGOA-apparel clauses promoted exports to the United States from beneficiary countries. Gradeva and Martínez-Zarzoso (2016) adopted the trade gravity model to evaluate the impact of EBA on exports from countries in Africa, the Caribbean, and the Pacific to the EU. They found that EBA did not promote exports to the EU in beneficiary countries. Instead, exports to the EU from EBA beneficiary countries were less than exports from non-EBA beneficiary countries.
Finally, some researchers have argued that the impact of preferential trade agreements on exports in beneficiary countries is uncertain. Collier and Venables (2007) used the triple difference method to examine the impact of AGOA-apparel clauses and EBA on exports from beneficiary countries. They found that the AGOA-apparel clauses significantly promoted exports, whereas EBA had no effect. Davies and Nilsson (2013) examined the impact of AGOA and EBA on exports of non-oil commodities from beneficiary countries based on the trade gravity model. They reported that the impact of EBA was twice that of AGOA. Some scholars have analyzed the reasons why some preferential trade agreements fail to promote exports in beneficiary countries. Zappile (2011) claimed that the main reasons for the failure of AGOA were the low utilization rate of preferential trade agreements by African exporters, additional requirements of political and economic policies for beneficiary countries, and low demand in the United States for goods from beneficiary countries. Collier and Venables (2007) and Gradeva and Martínez-Zarzoso (2016) argued that strict rules of origin and complicated management requirements, as well as the insufficient supply capacity of beneficiary countries (all of them are LDCs), inhibited the effectiveness of EBA.
Export diversification has been at the center of the debate on how developing countries can improve economic performance and achieve higher income (Acemoglu and Zilibotti, 1997; Agosin et al., 2012). A growing body of empirical literature has investigated the underlying factors of export diversification. Frankel and Romer (1999) found that geographical factors affected trade costs and influenced the ability of countries to diversify export operations. Agosin et al. (2012) analyzed the role of several potential determinants of export diversification. Fonchamnyo and Akame (2017) investigated the determinants of export diversification in 32 countries in sub-Saharan Africa. They found that factors such as trade openness, value added in agriculture, value added in manufacturing, and foreign direct investment promoted export diversification, but that GDP per capita restrained it, which they found to play a dominant role in African countries compared with other countries globally. Fosu and Abass (2019) empirically explored the determinants of export diversification in Africa, with particular attention to domestic credit. Masunda (2020) found that aid for trade that is directed toward improving productive capacity enhanced export diversification in sub-Saharan Africa. There are relatively fewer studies on the effect of preferential trade agreements on export diversification. Tadesse and Fayissa (2008) examined the impact of AGOA on exports from sub-Saharan African countries based on the trade gravity model. Their results showed that AGOA contributed to the diversification of exports by African countries to the United States in both manufacturing and non-manufacturing goods. Cook and Jones (2015) assessed the impact of AGOA on export diversification in sub-Saharan African countries and found that AGOA contributed to export diversification, specifically through its apparel provision. Persson and Wilhelmsson (2016) examined the impact of various preferential trade agreements implemented by the EU on export diversification in beneficiary countries based on the trade gravity model. Their results suggested that EBA had a significantly positive impact on export diversification. To the best of our knowledge, however, no studies have investigated the trade effect of China’s zero-tariff treatment in Africa.
4. MODEL SPECIFICATION
We used the trade gravity model (1), adopted from Agosin et al. (2012) and Cook and Jones (2015), and included a dummy variable for China’s zero-tariff treatment to evaluate the potential influencing factors on export diversification in African countries. The newly constructed model (2) is as follows:
- (1)
The dependent variable (EDic) represents export diversification from African countries to China. In the literature on export diversification, the most common methods to measure export diversification are to use the number of export commodities and to use indicators that measure export specialization, such as the HHI (Persson and Wilhelmsson, 2016). Both methods have advantages and disadvantages. The first method is relatively simple, and is not affected by changes in world market prices. Rather, all goods exported are considered equally important. The second method takes into account the relative importance of each commodity in total exports, but it is vulnerable to price changes. To control the impact of price change, we used the number of export commodities to measure export diversification. The HHI was then used as a robustness test. We selected 31 beneficiary countries (shown in Table A1) to quantitatively describe the changes in export volume and export diversification from these beneficiary countries as a whole to China during the period from 2001 to 2017 (as shown in Figure 1). The data show that, in 2001, total export volume from these beneficiary countries to China was only $1.35 billion U.S. dollars. Since 2005, the export volume significantly increased, peaking at $47.75 billion U.S. dollars in 2014. During the period from 2015 to 2016, the export volume declined, partly because of a decline in world commodity prices. However, exports rebounded in 2017, reaching $33.87 billion U.S. dollars. Unlike the total export volume, the number of exports from beneficiary countries to China has risen steadily, from 159 in 2001 to 1093 in 2017, indicating that exports have increasingly diversified.
- (2)
The independent variable (zero-tariff) represents China’s zero-tariff treatment for Africa. If country i is a beneficiary country, the dummy variable is 1; otherwise it is 0. In theory, zero-tariff treatment can influence export diversification through two channels, as illustrated in Figure 2. First, zero-tariff treatment can promote export diversification by eliminating tariffs to reduce trade costs. According to the heterogeneous firm model of Melitz (2003), only enterprises with high production efficiency can export, due to the existence of trade costs. Zero-tariff treatment lowers the threshold for enterprises to enter international markets by reducing trade costs, such that less productive enterprises can also participate in export activities, thereby promoting export diversification. Second, zero-tariff treatment can influence export diversification through its design content, including the coverage of beneficiary commodities, criteria for eligible countries, and rules of origin, similar to the role of non-tariff barriers. If the coverage of the beneficiary’s commodities is limited, it will lead to significant differences in preference margins for different commodities. Limited resources will flow to only a few export commodities with higher preference margins, thus inhibiting export diversification. If the criteria for eligible countries are more stringent and vulnerable, exporters will be uncertain about future expectations. This will inhibit companies from investing in new industries and new products. If the rules of origin are more flexible—for example, by using regional accumulation or third-country fabric accumulation—beneficiary countries will cooperate with other countries to achieve an intra-industry division of labor, which in turn will help to promote export diversification. Thus, China’s zero-tariff treatment would have a positive effect on export diversification in beneficiary countries, due to several of these features: a wide range of beneficiary goods, stable criteria for eligible countries, flexible rules of origin, and no deadlines. Therefore, the coefficient of zero tariffs is expected to be positive.
- (3)
The key variables in the trade gravity model are GDPc, GDPi, and Disic. GDPc and GDPi represent the economic scale of China and African country i, respectively, expressed in real GDP (with 2000 as the base period). It is expected that China’s (the African country’s) GDP will have a positive impact on export diversification, whereby higher GDP in the importing country (exporting country) means that the country has more demand (supply) capability, and demand (supply) more for imported (exported) goods. Disic represents the geographical distance between the two countries. With more distance, the trade costs increase, and this has a negative impact on export diversification.
- (4)
Control variables (Z) are a series of local factors that affect export diversification. Referring to the existing literature on export diversification, five main variables were included: trade openness, financial development, terms of trade, productivity level, and fixed costs. (a) Trade openness (OPEN) is expressed as the ratio of the sum of exports and imports to GDP. It is expected that trade openness will have a positive impact on export diversification, by increasing the number of export enterprises and improving export opportunities. (b) Financial development (FINANCE) is expressed as the ratio of domestic credit to GDP in the private sector. The impact of financial development on export diversification is uncertain. On one hand, financial development is conducive to export diversification. It reduces the negative impact of liquidity restrictions on enterprises entering the international market, thereby promoting export diversification. On the other, financial development is detrimental to export diversification because some investors are reluctant to take risks that have never been tried, yet still invest in sectors with a competitive advantage. (c) The terms of trade (TOT) are expressed in net terms of trade (with 2000 as the base period). The impact of terms of trade on export diversification is uncertain. Moreover, improved terms of trade have a negative impact on export diversification. According to factor endowment theory, an increase in the price of a country’s major export commodities encourages more production factors to flow into these sectors. Consequently, there is less focus on new export commodities, and exports become concentrated in only a few commodities. Improved terms of trade can also have a positive impact on export diversification, however, because they increase exporter profits and promote more exports. (d) The productivity level is expressed in terms of labor productivity (LABOR) and has a positive impact on export diversification. (e) Fixed costs are proxied by the economic freedom index (EFREE), which represents a country’s economic and political situation, government administrative interventions, and non-tariff barriers. A higher degree of economic freedom reduces fixed costs and facilitates export diversification.
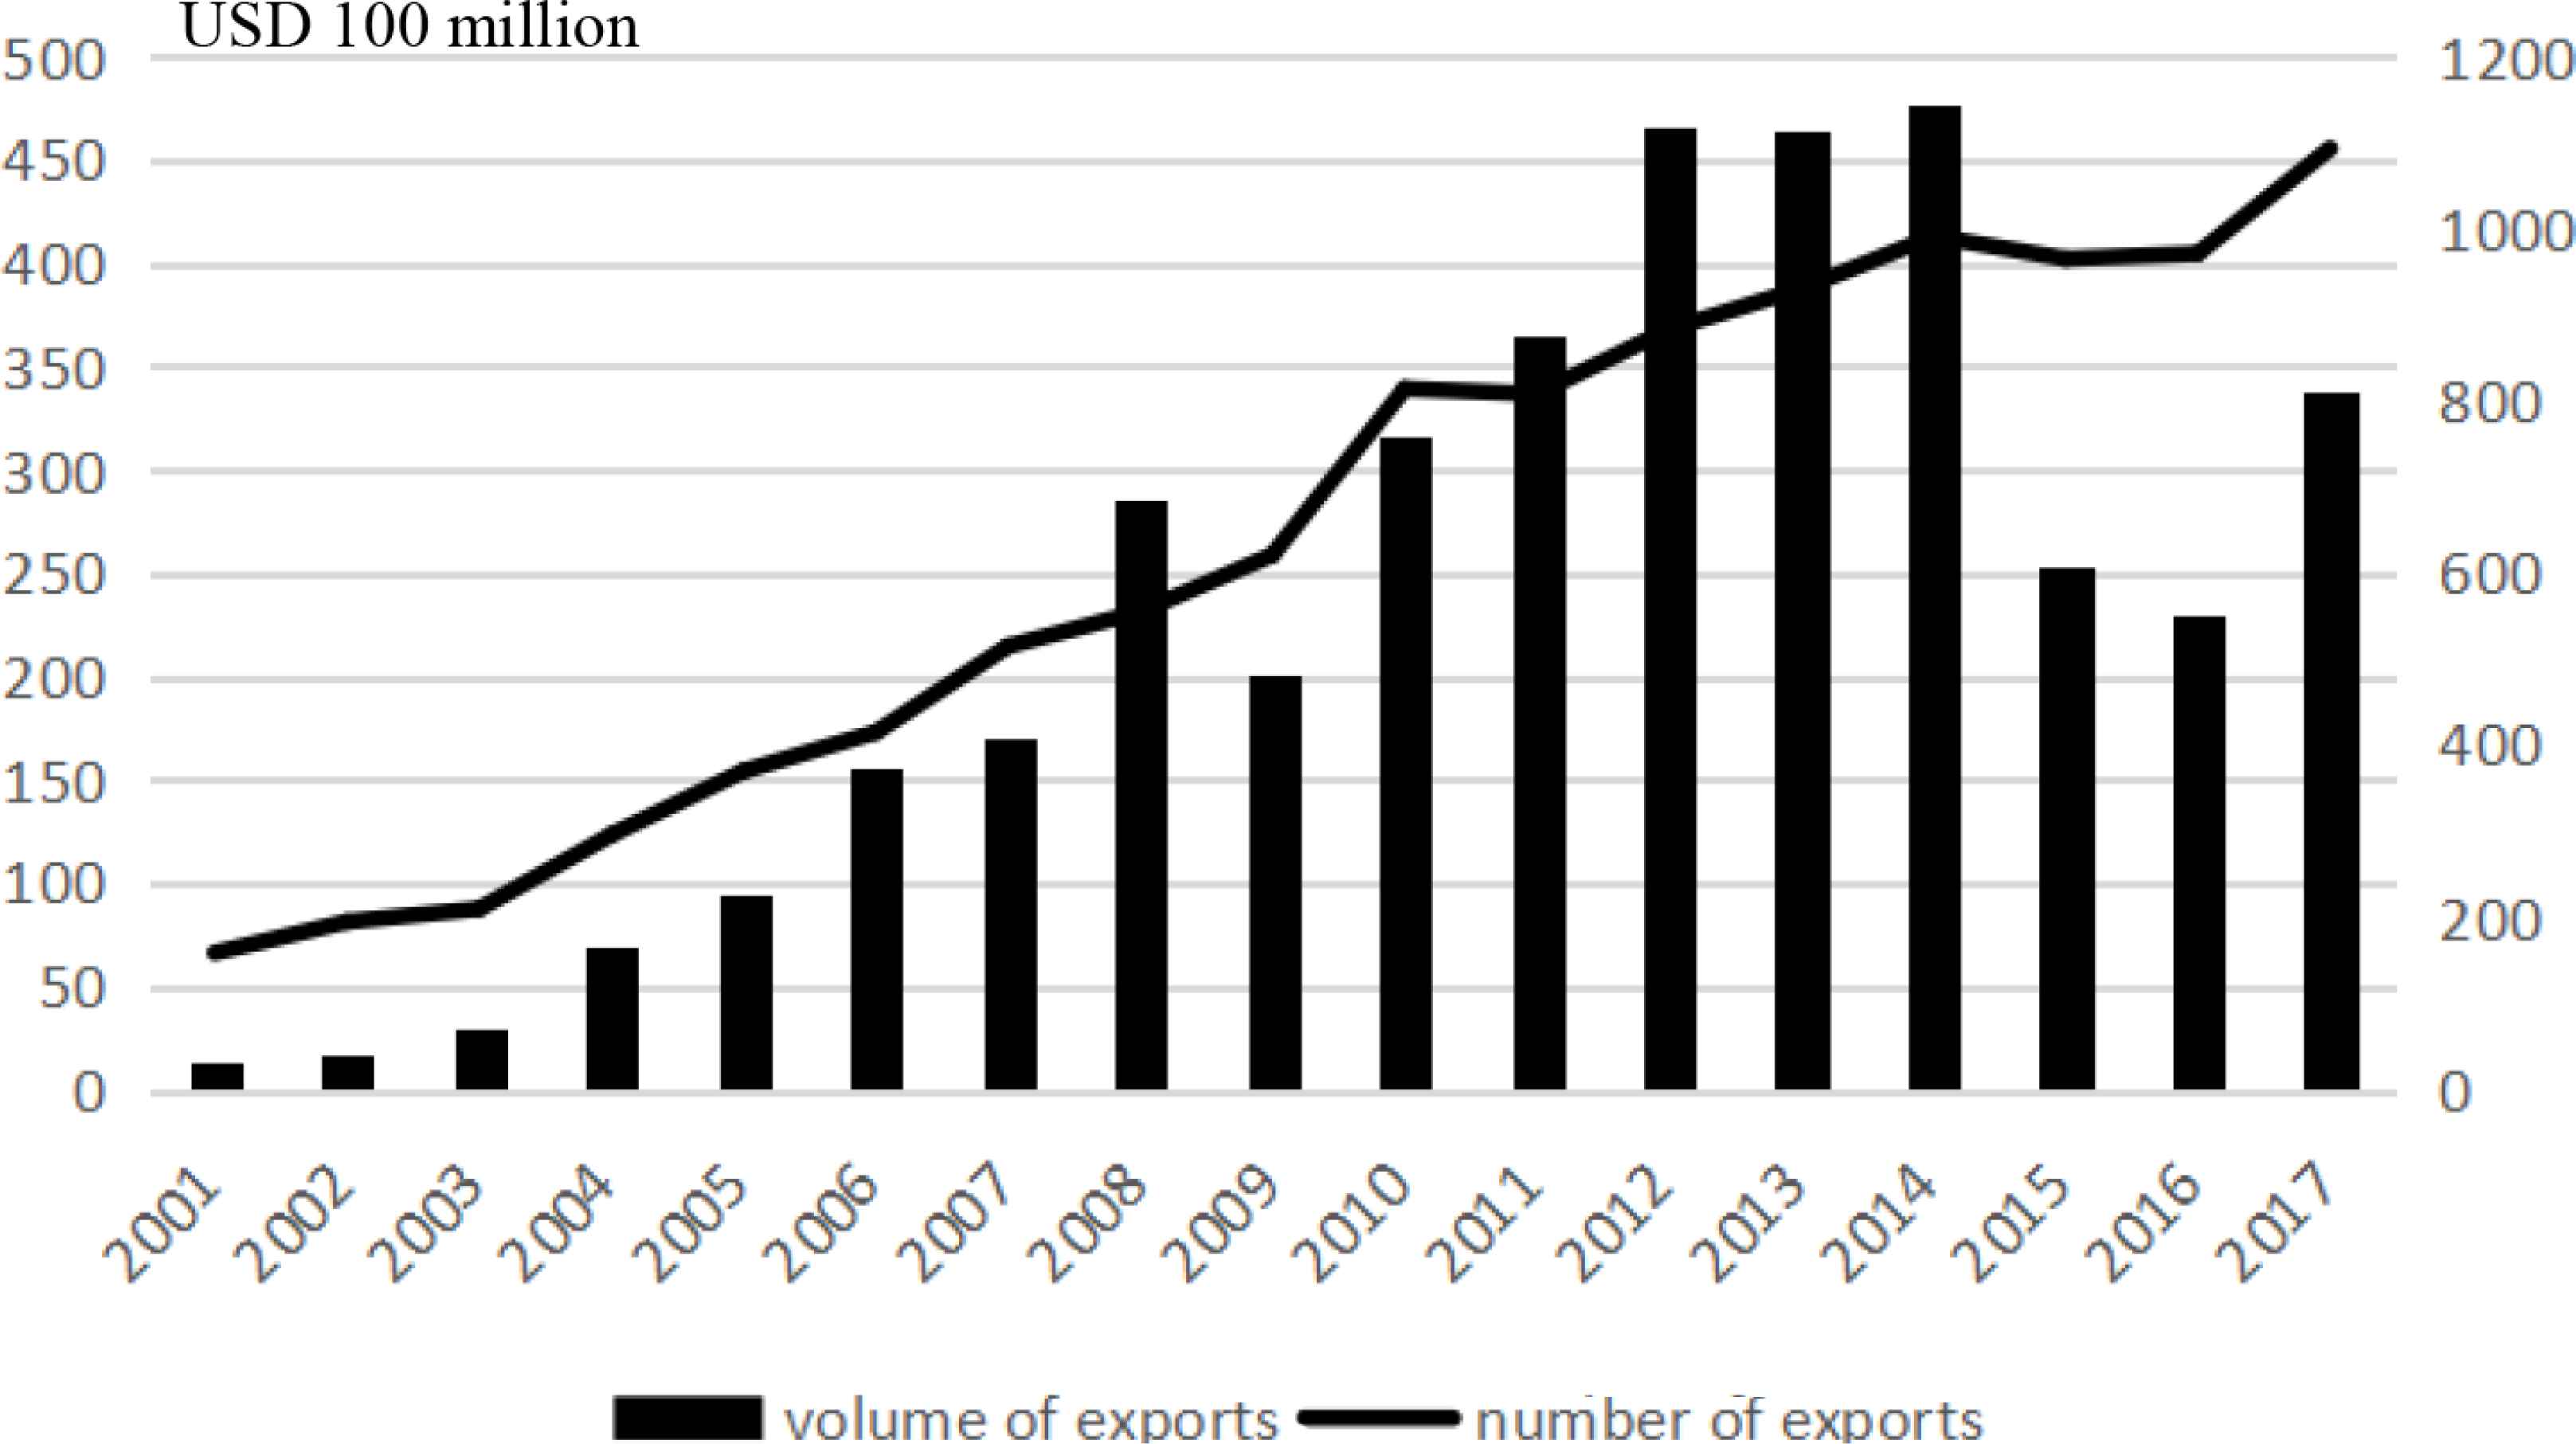
Volume and number of commodities exported by beneficiary countries to China. Source: International Trade Center Trademap database and authors’ calculations.
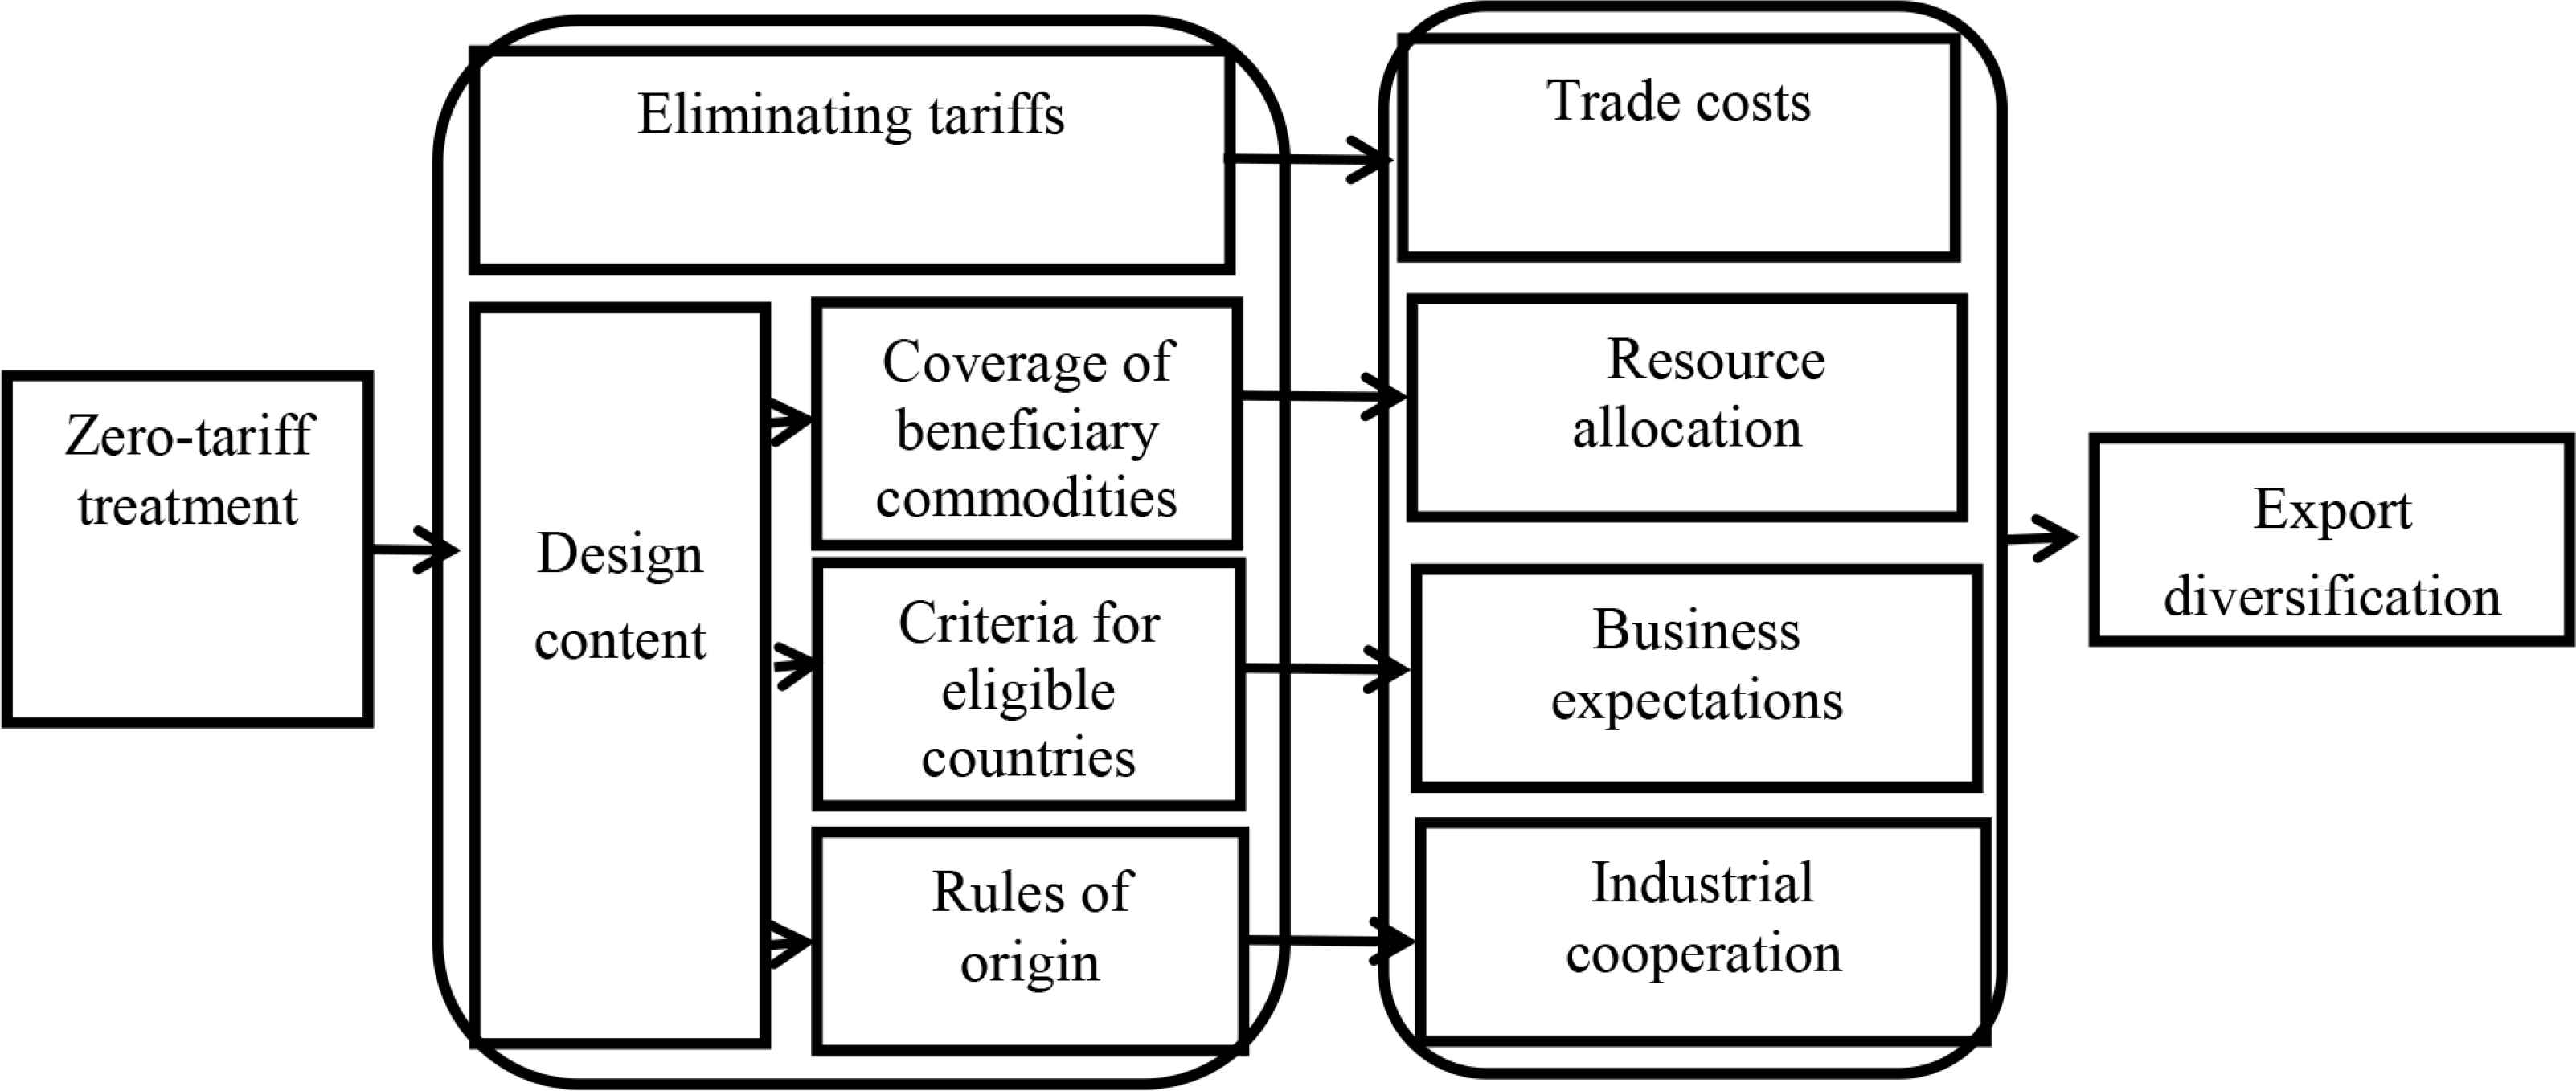
Impact mechanism of zero-tariff treatment on export diversification.
Our study covers 31 countries in Africa that benefit from China’s zero-tariff treatment for the period from 2001–2017. The sample of countries is shown in Table A1 and variable definitions and data sources are detailed in Table A2. In order to reduce the estimation error caused by heterogeneity, all variables (except export diversification and the zero-tariff treatment dummy variable) are taken by the logarithm. The statistical description of each variables are shown in Table 2.
| Variables | Observation | Average value | Minimum value | Maximum |
|---|---|---|---|---|
| EDic | 527 | 20.56 | 0 | 194 |
| Zero-tariff | 527 | 0.67 | 0 | 1 |
| lnOPENi | 527 | 3.92 | 2.86 | 5.16 |
| lnFINANCEi | 527 | 2.48 | −0.89 | 4.19 |
| lnGDPc | 527 | 29.29 | 28.52 | 29.95 |
| lnGDPi | 527 | 22.29 | 18.62 | 25.37 |
| lnDISic | 527 | 9.30 | 8.97 | 9.46 |
| lnTOTi | 527 | 4.69 | 3.89 | 5.40 |
| lnLABORi | 527 | 7.57 | 6.13 | 10.99 |
| lnEFREEi | 527 | 3.95 | 3.56 | 4.21 |
Statistical description of each variable—full sample, 2001–2017
5. ESTIMATION RESULTS AND ANALYSIS
The biggest feature of the data is that the dependent variable (export diversification), measured by the number of export commodities, is a count variable with a large number of zero values. Therefore, we used Poisson regression for the estimation, instead of ordinary least squares. However, the drawback to Poisson regression is that it assumes that the variance is equal to the expectation. If there is excessive dispersion—that is, if the variance is greater than the expectation—panel negative binomial regression can be used as a robustness test.
5.1. Overall Sample
First, a benchmark test was performed using the mixed effects, random effects, and fixed effects of Poisson regression. The results are shown in Table 3. Based on the results of the LM test and the Hausman test, the regression results of the random effects model were selected. According to the results in the table, the coefficient of zero tariffs is positive and passes the significance test, as expected. This means that China’s zero-tariff treatment for Africa significantly promoted export diversification in beneficiary countries. The features of China’s zero-tariff treatment explain these results: viz., wide coverage of beneficiary goods, stable eligibility criteria, flexible rules of origin, and no deadlines (unless countries graduate from the list of LDCs). In addition, trade openness, the GDP of the beneficiary country, and China’s GDP significantly promoted export diversification, whereas the terms of trade significantly inhibited it. The effects of other variables were insignificant. Further tests found that the variance of the dependent variable was 40 times its average value, suggesting excessive dispersion. Therefore, we used panel negative binomial regression as a robustness test. Similarly, based on the results of the LM test and the Hausman test, the regression results of the random effects model were selected. The results of Poisson regression and the results of negative binomial regression were basically the same. This confirms that China’s zero-tariff treatment for Africa significantly promoted export diversification in beneficiary countries.
| Variables | Poisson regression | Negative binomial regression | ||||
|---|---|---|---|---|---|---|
| Mixed effects | Random effects | Fixed effects | Mixed effects | Random effects | Fixed effects | |
| Zero-tariffi | 0.60*** (2.66) | 0.33*** (7.22) | 0.33*** (7.13) | 0.31 (1.05) | 0.33*** (5.16) | 0.33*** (5.54) |
| lnOPENi | 0.46* (1.73) | 0.18*** (2.90) | 0.16** (2.56) | 0.44* (1.88) | 0.17** (2.04) | 0.15* (1.75) |
| lnFINANCEi | −0.27 (−1.38) | −0.02 (−0.43) | −0.01 (−0.29) | −0.28 (−1.25) | 0.01 (0.26) | 0.02 (0.27) |
| lnGDPc | 0.84*** (4.00) | 0.90*** (13.78) | 0.99*** (13.61) | 1.09*** (3.49) | 0.84*** (10.48) | 0.91*** (11.32) |
| lnGDPi | 0.47*** (4.61) | 0.24*** (2.95) | 0.05 (0.51) | 0.56*** (4.58) | 0.36*** (4.06) | 0.20** (2.02) |
| lnDISic | −1.21 (−0.90) | −0.77 (−0.61) | – | −0.75 (−0.52) | −2.89** (−2.33) | −9.76*** (5.54) |
| lnTOTi | −0.25 (−1.10) | −0.17** (−2.18) | −0.17** (−2.19) | −0.12 (−0.40) | −0.17* (−1.71) | −0.18* (−1.77) |
| lnLABORi | −0.21 (−1.15) | 0.02 (0.23) | 0.07 (0.60) | −0.19 (−1.43) | −0.11 (−1.01) | −0.20 (−1.59) |
| lnEFREEi | 1.93** (2.41) | −0.21 (−0.90) | −0.25 (−1.06) | 1.97* (1.92) | −0.12 (−0.39) | 0.07 (0.22) |
| β0 | −27.53** (−2.21) | −21.58* (−1.79) | – | −41.92*** (−2.85) | −1.55 (−0.13) | 64.31*** (2.59) |
Note: ***, **, and * denotes significance at the 1%, 5%, and 10% levels, respectively. The value of t is in parentheses.
Impact of China’s zero-tariff treatment on the export diversification in Africa—overall sample
5.2. Industry Sample
In order to judge whether there are any differences at the industry level regarding the impact of China’s zero-tariff treatment on export diversification in African countries, we divided all commodities into three industries: HS8-digits 1–15 were categorized as agriculture, 25–27 as mining, and the remaining commodities (except 98 and 99) as manufacturing. Table 4 presents the results of the impact of China’s zero-tariff treatment on export diversification in these three industries. The best results from Poisson regression and negative binomial regression selected by the LM test and Hausman test were similar. In order to avoid the problem of excessive dispersion, the results of the negative binomial regression are also presented.
| Variables | Agriculture | Manufacturing | Mining | |||
|---|---|---|---|---|---|---|
| Poisson regression, fixed effects | Negative binomial regression, random effects | Poisson regression, random effects | Negative binomial regression, random effects | Poisson regression, random effects | Negative binomial regression, random effects | |
| Zero-tariffi | −0.06 (−0.49) | −0.02 (−0.15) | 0.44*** (8.04) | 0.44*** (5.57) | 0.17 (1.44) | 0.17 (1.44) |
| lnOPENi | 0.27 (1.41) | 0.31 (1.60) | 0.09 (1.28) | 0.06 (0.57) | 0.43*** (2.87) | 0.43*** (2.87) |
| lnFINANCEi | 0.27* (1.81) | 0.37** (2.52) | −0.05 (−0.91) | −0.002 (−0.03) | −0.12 (−1.19) | −0.12 (−1.19) |
| lnGDPc | 1.33*** (5.82) | 0.57*** (3.03) | 0.88*** (11.96) | 0.78*** (8.62) | 1.09*** (7.22) | 1.09*** (7.22) |
| lnGDPi | −0.39 (−1.44) | 0.54** (2.39) | 0.24** (2.58) | 0.40*** (4.67) | 0.39** (1.25) | 0.39** (2.09) |
| lnDISic | – | −1.91 (−0.90) | −1.67 (−1.24) | −1.72 (−1.50) | −1.56 (−0.79) | −1.56 (−0.79) |
| lnTOTi | −0.31 (−1.54) | −0.30 (−1.50) | −0.29*** (−3.10) | −0.26** (−2.06) | 0.24 (1.25) | 0.24 (1.25) |
| lnLABORi | −1.05*** (−3.08) | −0.48** (−2.25) | 0.11 (0.87) | −0.002 (−0.02) | −0.08 (−0.42) | −0.08 (−0.42) |
| lnEFREEi | −0.81 (−1.14) | −0.66 (−0.93) | −0.43 (−1.58) | −0.22 (−0.61) | 0.92 (1.64) | 0.92 (1.64) |
| β0 | – | −1.61 (−0.08) | −11.60 (−0.90) | −11.81 (−1.07) | −31.18 (−1.62) | −15.50 (−0.03) |
Note: ***, **, and * denotes significance at the 1%, 5%, and 10% levels, respectively. The value of t is in parentheses.
Impact of China’s zero-tariff treatment on export diversification in Africa—industry sample
As can be seen from the results in the table, zero-tariff treatment significantly promoted export diversification in manufacturing, but the effect in mining, though positive, was insignificant. The (negative) effect in agriculture was also highly insignificant. A reasonable explanation for this is that in manufacturing, especially for light industries, the barriers for entry are not high. After China implemented zero tariffs, the policy quickly attracted relevant enterprises to enter these industries and promote more varieties of goods exported to China. However, agriculture and mining require huge initial investments that have a lengthy payback period. Although the implementation of China’s zero-tariff treatment attracted some investment in agriculture and mining, its effect on export diversification in these industries was not immediately clear. It is possible that in agriculture, zero-tariff treatment caused exports to be concentrated in only a few commodities for which these countries have a competitive advantage, and that it restrained export diversification. However, this phenomenon should be alleviated with the implementation of zero-tariff treatment in the long term. For example, sesame was among the first commodities to enjoy zero-tariff treatment. Despite being a main producer of sesame in Africa, Ethiopia did not export any sesame to China in 2002. After the implementation of China’s zero-tariff policy, the proportion of sesame to total imports from Ethiopia to China reached almost 78% in 2005, and peaked at 87% in 2009. Although the import volume of sesame continued to increase, its share in total imports declined, reaching 63% in 2017. This suggests that Ethiopia’s exports diversified. In addition to zero-tariff treatment, other variables also affected export diversification in these three industries.
In the case of agriculture, financial development, the beneficiaries’ GDP, and China’s GDP played a significant role in promoting export diversification, whereas labor productivity inhibited it. For the manufacturing industry, China’s GDP and the beneficiaries’ GDP promoted export diversification, while the terms of trade inhibited it. And, in the case of mining, beneficiary countries’ GDP, trade openness, and China’s GDP inhibited export diversification.
5.3. Regional Sample
To determine whether there are regional differences in the impact of China’s zero-tariff treatment on African export diversification, four important regional economic communities in Africa were selected for testing: the Economic Community of West African States (ECOWAS), the East African Community (EAC), and Southern African Development Community (SADC), and the Common Market for Eastern and Southern Africa (COMESA). All of these communities have established a free trade area, customs union, or common market, and most beneficiary countries are members of one or more of these organizations.3 Table 5 presents the results of the effect of China’s zero-tariff treatment on export diversification in beneficiary countries belonging to the four regional economic communities. The best results of Poisson regression and negative binomial regression, selected by the LM test and Hausman test, were basically consistent, and the results of negative binomial regression were again chosen to be presented and explained, in order to avoid the problem of excessive dispersion.
| Variables | SADC | EAC | COMESA | ECOWAS | ||||
|---|---|---|---|---|---|---|---|---|
| Poisson regression | Negative binomial regression | Poisson regression | Negative binomial regression | Poisson regression | Negative binomial regression | Poisson regression | Negative binomial regression | |
| Zero-tariffi | 0.37*** (5.62) | 0.37*** (5.16) | 0.30** (2.51) | 0.30** (2.51) | 0.43*** (6.14) | 0.44*** (5.78) | 0.38*** (4.16) | 0.41*** (3.22) |
| lnOPENi | −0.09 (−0.92) | −0.09 (−0.84) | 0.35 (1.61) | 0.35 (1.61) | −0.07 (−0.56) | −0.06 (−0.48) | 0.58*** (4.85) | 0.61*** (3.84) |
| lnFINANCEi | 0.17** (2.30) | 0.18** (2.26) | −0.08 (−0.26) | −0.08 (−0.26) | 0.04 (0.52) | 0.04 (0.58) | −0.15 (−1.61) | −0.09 (−0.72) |
| lnGDPc | 0.93*** (10.05) | 0.88*** (7.73) | 0.39 (1.45) | 0.39 (1.45) | 0.79*** (7.46) | 0.76*** (5.96) | 1.12*** (9.61) | 1.08*** (7.41) |
| lnGDPi | −0.32* (−0.85) | −0.25 (−1.29) | 1.22*** (3.20) | 1.22*** (3.19) | 0.19 (1.52) | 0.22 (0.13) | 0.56*** (3.16) | 0.67*** (3.83) |
| lnDISic | −7.56*** (−3.05) | −8.75*** (−3.22) | −10.64 (−0.66) | −10.67 (−0.66) | 1.71 (0.49) | 1.28 (0.70) | 5.10 (1.14) | 6.40 (0.13) |
| lnTOTi | 0.23 (1.52) | 0.20 (1.21) | −0.26 (−1.55) | −0.26 (−1.55) | −0.27** (−2.02) | −0.28** (−2.03) | −0.16 (−1.07) | −0.15 (−0.69) |
| lnLABORi | 0.06 (0.38) | 0.10 (0.63) | −1.49*** (−4.40) | −1.49*** (−4.40) | −0.05 (−0.25) | −0.03 (−0.15) | −0.10 (−0.39) | −0.22 (−0.93) |
| lnEFREEi | 0.69* (1.68) | 0.60 (1.32) | 1.31* (1.66) | 1.31* (1.66) | 0.41 (1.03) | 0.34 (0.79) | −3.25*** (−7.35) | −3.17*** (−5.37) |
| β0 | 49.12** (2.08) | 67.02** (2.41) | 66.15 (0.44) | 74.33 (0.49) | −40.22 (−1.25) | −33.21 (−1.08) | −80.70* (−1.91) | −91.76** (−2.27) |
Note: ***, **, and * denotes significance at the 1%, 5%, and 10% levels, respectively. The value of t is in parentheses.
Impact of China’s zero-tariff treatment on export diversification in Africa—regional sample
The results show that all of the effects of China’s zero-tariff treatment on export diversification in the four regional economic communities were significantly positive, albeit to varying degrees. According to the estimated coefficients, the effects may be rank-ordered as: COMESA > ECOWAS > SADC > EAC.4 The reason for these regional differences may be explained as follows: COMESA includes two countries with the largest number of exports to China, Madagascar, and Ethiopia, so the effect of zero-tariff treatment on export diversification in this group is the most pronounced. For ECOWAS, according to the latest rules of origin adopted by China, beneficiary countries that belong to this group are allowed to use the raw materials originating from other members. This is conducive to industrial cooperation and labor division between countries, which should aid the impact of the zero tariff. The beneficiary countries belonging to SADC and EAC include a large number of LDCs with weak industrial bases and lower production capacity. As such, these regional communities were less likely to benefit from the zero-tariff treatment.
6. ROBUSTNESS TEST
In order to further bolster our results, we performed a robustness test by adopting HHI additionally as a measure of export diversification. As shown in Table 6, the coefficient of zero tariffs is significantly negative (note that a negative sign indicates a positive effect on export diversification). Thus, this result based on the HHI supports our main finding of a positive impact of China’s zero tariff on beneficiary African countries.
| Variables | Mixed effects | Random effects | Fixed effects |
|---|---|---|---|
| Zerotariffi | −0.07*** (−3.00) | −0.04*** (−2.91) | −0.04*** (0.47) |
| lnOPENi | 0.002 (0.08) | 0.03 (1.57) | 0.03 (1.40) |
| lnFINANCEi | −0.08*** (−5.90) | −0.03** (−2.51) | −0.02** (−2.02) |
| lnGDPc | 0.07*** (2.99) | 0.01 (0.32) | −0.001 (−0.39) |
| lnGDPi | 0.01* (1.87) | 0.01 (0.27) | 0.01 (0.33) |
| lnDISic | 0.17** (2.15) | 0.05 (0.19) | – |
| lnTOTi | 0.02 (0.81) | 0.02 (0.83) | 0.02 (0.78) |
| lnLABORi | 0.01 (1.10) | 0.07** (2.40) | 0.10*** (2.81) |
| lnEFREEi | −0.42*** (−5.73) | −0.17** (−2.48) | −0.17*** (−2.36) |
| β0 | −1.88* (−1.88) | −0.28 (−0.10) | 0.24 (0.47) |
Note: ***, **, and * denotes significance at the 1%, 5%, and 10% levels, respectively. The value of t is shown in parentheses. Note that a negative sign indicates a positive effect on export diversification.
Impact of China’s zero-tariff treatment on the export diversification (HHI) in Africa—overall sample
7. MAIN CONCLUSIONS AND POLICY IMPLICATIONS
To the best of our knowledge, this is the first paper to analyze the main characteristics of China’s zero-tariff treatment for LDCs in Africa. The treatment features wide coverage of beneficiary goods, stable criteria for eligible countries, flexible rules of origin, and no deadlines. Our results showed that, overall, the zero-tariff policy significantly promoted export diversification in beneficiary African countries. At the level of industry, the policy significantly promoted export diversification in manufacturing, but it had no significant effect on export diversification in agriculture or mining. At the regional level also, it significantly promoted export diversification in beneficiary countries belonging to the four major regional economic communities in Africa, but to varying degrees: COMESA > ECOWAS > SADC > EAC. In addition to the zero-tariff treatment, factors such as the beneficiary’s GDP, labor productivity, trade openness, economic freedom, financial development, terms of trade, China’s GDP, and the distance between the two countries also affected export diversification in beneficiary countries in Africa.
To improve the role of zero-tariff treatment in expanding exports in African countries, especially in terms of non-resource products, we propose the following three policy suggestions from the Chinese side: First, the use of benefits should be exapnded across regional groups. That is, China should allow members of ECOWAS, for example, to use the raw materials originating from members of the other groups, namely, SADC, EAC or COMESA. Doing so should promote industry collaboration between countries. This is especially important for LDCs with weak industrial bases, so that they can participate in regional and global value chains without having to establish a complete industrial chain by themselves. Second, China can reduce non-tariff barriers on imports from African countries. At present, the measures adopted by China to promote African exports are mainly designed to eliminate tariffs, with few policies explicitly designed to reduce non-tariff barriers. In order to reduce trade costs incurred by non-tariff barriers, China can further simplify the import customs clearance process, expand the number of countries that sign inspection and quarantine agreements with China, and cancel quotas for some non-sensitive commodities. Finally, China can provide support for African countries to improve their exports and production capacity. According to our results, export diversification in these countries is affected by many local factors. For example, in the agricultural sector, financial development had a significantly positive impact on export diversification, while labor productivity had a significant inhibitory effect. Therefore, China can increase aid and investment in trade-related areas (such as port infrastructure), increase financial support for agriculture in African countries, and organize training courses on production and trade to help African countries increase productivity and business capabilities. With regard to training, China has already announced plans in this direction. At the 2018 FOCAC submit, China’s president, Xi Jinping, announced that China would build 10 Luban workshops (named after the father of Chinese architecture from around the fourth century BCE) in Africa to provide youth with vocational skills in the following three years.
CONFLICTS OF INTEREST
The authors declare they have no conflicts of interest.
AUTHORS’ CONTRIBUTION
All authors contributed equally to this work.
ACKNOWLEDGMENTS
The authors are grateful to the editor, Prof. Augustin Fosu, and the anonymous referees for insightful comments and suggestions. This study was supported by the National Social Sciences Foundation of China (Grant No. 19BJY190).
APPENDIX
| Angola | Ethiopia | Niger |
| Benin | Gambia | Rwanda |
| Burkina Faso | Guinea | Sao Tome and Principe |
| Burundi | Guinea-Bissau | Senegal |
| Cape Verde | Lesotho | Sierra Leone |
| Central African Republic | Liberia | Tanzania |
| Chad | Madagascar | Togo |
| Comoros | Malawi | Uganda |
| Democratic Republic of the Congo | Mali | Zambia |
| Equatorial Guinea | Mauritania | |
| Eritrea | Mozambique |
Note: Among beneficiary countries in Africa that enjoy China’s zero-tariff treatment, Sudan, South Sudan, and Somalia were excluded from our sample, due to imperfect data. Equatorial Guinea and Cape Verde were included in sample, even though they were no longer classified as LDCs as of 2013 and 2014, respectively.
Sample of African countries
| Variable name | Definition | Source |
|---|---|---|
| EDci: no of export commodities | A measure of the number of active product lines of imports* to China from African countries, measured at the HS8-digit level. | International Trade center Trademark database |
| EDci: HHI | The index takes a value between 0 and 1, with a higher value indicating lower diversification. | UNCTAD Stat |
| Zero-tariffci | If country i is a beneficiary country, the dummy variable is 1; otherwise it is 0. | FOCAC website |
| GDPc, (GDPi) | This variable is measured at constant 2010 prices (US$). | World Bank World Development Indicators |
| Disci | This variable indicates the geographical distance between Beijing and the capital of country i. | CEPPII database |
| OPENi | The ratio of the sum of exports and imports to GDP. | World Bank World Development Indicators |
| FINANCEi | The ratio of domestic credit to GDP in the private sector. | World Bank World Development Indicators |
| TOTi | This variable is measured by the net terms of trade at constant 2010 prices. | World Bank World Development Indicators |
| LABORi | Labor productivity. | International Labor Organization |
| EFREEi | This variable is replaced by the economic freedom index. | American Heritage Foundation |
Because the statistics of many countries in Africa are imperfect, and importing countries are more motivated to provide accurate trade statistics to avoid tariffs, export data from African countries to China are replaced by import data to China from African countries.
Definitions and sources of variables
Footnotes
General Administration of Customs of the People’s Republic of China website, http://www.customs.gov.cn/customs/302249/302266/302267/630775/index.html. (accessed October 10, 2019).
Ministry of commerce of the People’s Republic of China website, http://www.mofcom.gov.cn/article/zhengcejd/bj/200708/20070804946648.shtml. (accessed October 10, 2019).
ECOWAS and COMESA established the customs union, EAC established the common market, and SADC established free trade area. Among the 31 beneficiary countries selected in this paper, ECOWAS includes Benin, Burkina Faso, Togo, Cape Verde, Gambia, Guinea, Guinea-Bissau, Liberia, Mali, Niger, Sierra Leone, Senegal; EAC includes Burundi, Rwanda, Tanzania, Uganda; SADC includes Angola, DRC, Lesotho, Madagascar, Malawi, Mozambique, Tanzania, Zambia; COMESA includes Ethiopia, Burundi, Eritrea, DRC, Comoros, Rwanda, Madagascar, Malawi, Uganda, Zambia.
It must be cautioned that the differences in these coefficients may not actually be significant.
REFERENCES
Cite this article
TY  - JOUR
AU  - Zhina Sun
AU  - Ehizuelen Michael Mitchell Omoruyi
PY  - 2021
DA  - 2021/07/09
TI  - Effect of China’s Zero-Tariff Treatment under Forum on China-Africa Cooperation (FOCAC) on Export Diversification in Beneficiary Countries in Africa
JO  - Journal of African Trade
SP  - 23
EP  - 32
VL  - 8
IS  - 1
SN  - 2214-8523
UR  - https://doi.org/10.2991/jat.k.210618.001
DO  - 10.2991/jat.k.210618.001
ID  - Sun2021
ER  -