
The Effects of Trade Facilitation on Trade Performance in Africa
Additional information: Executive Founder, Centre for Trade Policy and Development (CETAD Ghana). Email: safesorg@uoguelph.ca
- DOI
- 10.2991/jat.k.191129.001How to use a DOI?
- Keywords
- Africa; gravity model; trade facilitation; trade flows
- Abstract
Institutional trade barriers constitute substantial constraints for a number of exporters and importers. These barriers are multidimensional and they impede trade flows and trade performance of many developing countries, including African countries. In particular, the International Trade Centre through its series of business surveys has identified that a myriad number of businesses within Africa are affected by these barriers. Notwithstanding, there is little empirical knowledge on how they interact and affect trade flows within Africa. In this paper, we assess the effects of trade facilitation measures and their combined effect (using principal component analysis) on trade performance in a sample of 52 African countries within a structural gravity model framework for the period 2006–2015. The results suggest that trade facilitation improves trade performance in Africa; the better the level of trade facilitation, the larger the extent of trade flows. From a policy perspective, reducing trade costs across borders remains key to improve trade performance in Africa.
- Copyright
- © 2019 African Export-Import Bank. Publishing services by Atlantis Press International B.V.
- Open Access
- This is an open access article distributed under the CC BY-NC 4.0 license (http://creativecommons.org/licenses/by-nc/4.0/).
1. INTRODUCTION
International trade is now an embodiment of the new order of the global economy, as it ensures the movement of goods and the factors involved in the production of these goods from one country to the other. However, several authors (see, e.g., Wilson et al., 2003; Portugal-Perez and Wilson, 2009; Mbekeani, 2010; Portugal-Perez and Wilson, 2012; Hoekman et al., 2017) have shown that the effectiveness of this movement depends largely on how trade is facilitated among the countries involved. Especially, for developing countries, such as those in Africa, trade facilitation is an important trade strategy because of the systematic market and coordination failures emanating from information asymmetry (Yakop and van Bergeijk, 2011). This market failure is more likely to affect South–South trade adversely, such that without trade facilitation by governments, market opportunities may be created even through trade agreements, but they cannot be utilized effectively (Afesorgbor, 2018).1 This is the case because complex trade arrangements dissuade firms and countries engaging in international production and trade.
It becomes imperative therefore that what matters for trade facilitation is well understood by policy makers of all countries by incorporating policies aimed at facilitating trade into their long-term development agenda. Interestingly, the promotion of trade facilitation measures is the key rationale behind the 2013 World Trade Organization (WTO) trade facilitation agreement2 meant to expedite the clearance and movement of goods across borders globally. Broadly speaking, trade facilitation involves all arrangements aimed at improving border and transport efficiency and reducing transaction costs associated with trade flows. These arrangements include but are not limited to issues of transport and transit, professionalism of customs authorities, transparency, banking and insurance, business practices, telecommunications and conformity to international (regional) standards (see Buyonge and Kireeva, 2008; Portugal-Perez and Wilson, 2009; Freund and Rocha, 2011; Moïsé et al., 2011; Rippel, 2011; Narayanan et al., 2016; Sakyi et al., 2018). However, in this paper we limit our analysis to the potential impact of trade facilitation, specifically the improvement in border and transport efficiency, namely, time to export, cost to export, the number of documents required to export, time to import, cost to import and the number of documents required to import, as well as the distance to frontier.3 The focus on these trade facilitation variables is particularly important as the region is noted for having one of the highest bureaucracies and custom procedures according to the World Bank Doing Business reports.
Focusing our attention on the impact of trade facilitation on African trade flows is important for many reasons. First, African countries have in recent decades embarked on a number of market reforms so as to attract more financial capital to ensure sustained growth and development. Factors that ensure effective trade facilitation, such as cheaper transport and energy, efficient telecommunication, good customs administration and efficient judicial system to mention a few, are part of the necessary conditions required to attract more financial capital. This implies that the more trade is facilitated, the more financial capital the region will attract. This is the key point in Africa as financial capital inflows are much needed to augment the inadequate domestic financial resources. In essence, trade facilitation would enable Africa to obtain access to more financial resources to increase its pace of growth and development.
Second, trade revenue forms a substantial component of total revenue of most governments in the developing world. Engman (2005), for example, has shown how a large number of developing countries have been able to increase government revenue through the modernization of their customs. This according to him has resulted in better and efficient ways of collecting international trade taxes. It is important to note that Africa is not an exception to these group of developing countries when it comes to international trade taxes. For instance, between 2000 and 2014, taxes on international trade averaged between 5% and 40% of total revenue in most African countries (World Bank, 2016)4. Given this, policies aimed at increasing international trade (through trade facilitation) will generate more revenue to fund the growth and developmental needs of the continent.
Third, African countries have for years been characterized by poverty, inequality and poor performance in terms of school enrollment, child health, life expectancy and human development among several other social welfare challenges (Sakyi et al., 2018). According to Sakyi et al. (2018), improving trade facilitation in Africa is associated with better social welfare outcomes. This is the case because high trade costs associated with poor trade facilitation can have adverse effect on the well-being of individuals in Africa. This outcome is confirmed by the World Bank (2011), which emphasizes that trade facilitation is crucial for improving social welfare of individuals in African countries, especially the poor, as it lowers trade costs by reducing the prices people pay for consumption goods. In addition, trade facilitation can reduce the costs of intermediate and capital-intensive goods that drive the continent’s industrialization process, as well as the acquisition of foreign technology. This is important because efficient borders are usually associated with the transfer of efficient technologies and greater firm-level technology absorption which has the potential of creating jobs, with associated positive social welfare improvement outcomes.
Fourth, increased trade flows especially among African countries would result in greater gains for most African countries by spurring significant economic expansion. According to Seck (2017), trade facilitation would spur economic gain through the reduction in trade costs, thereby increasing firms’ efficiency and performance. The reduced trade costs would spur productivity growth of domestic firms more likely to export while existing ones would increase their trade volume. Indeed, Seck (2016) confirmed that trade facilitation increases the chances of firms’ participation in international trade. This outcome is crucial for Africa as improving trade facilitation within the continent can foster economic integration among African countries and give more impetus to the proposed African Continental Free Trade Area agreement.
A number of studies have looked at the effect of trade facilitation on trade flows in Africa; however, only a limited number of them use an econometric approach in studying the beneficial impact of trade facilitation on trade flows within the region. Studies on Africa devoted to trade facilitation and trade flows, but only use qualitative approach include UNECA (2004a, 2004b and 2013), The U.S. International Trade Commission (2012) and Buyonge and Kireeva (2008). These studies focused only on the potential benefits, challenges and ways of improving trade facilitation in Africa. However, studies such as Njinkeu et al. (2008), Portugal-Perez and Wilson (2009) and Seck (2017) used econometric methods to quantify the effect of trade facilitation on trade flows in Africa. Specifically, Njinkeu et al. (2008) considered only 25 African countries in their sample for the years 2003–2004 and concluded that improvements in port efficiency, service infrastructure and regional trade agreements have positive effects on trade flows. Similarly, Portugal-Perez and Wilson (2009) used a data set covering 104 importers and 115 exporters (including samples from 22 African countries) for the year 2006 and concluded that reduction in trade costs has a greater effect on trade flows than reduction in tariff barriers. In addition, Seck (2017) used data for 2 years: 2007 and 2012 for 41 sub-Saharan African countries and concluded that improvements in road infrastructure and international shipment and logistic competence are important trade facilitation measures that can generate export gains for the region.5
Considering the aforementioned empirical gap, this paper attempts to investigate the effect of trade facilitation on trade flows in 52 African countries for the period 2006–2015. Methodologically, the paper uses Principal Component Analysis (PCA) to create composite indices of variant trade facilitation variables and employs the gravity model to analyze intra-African trade. Using PCA is relevant to solving the multidimensionality problem, because these trade facilitation variables are strongly correlated. Quantitatively, this is the only paper, to the best of our knowledge, that focuses extensively on Africa and uses the PCA in studying trade facilitation and intra-Africa trade.
The rest of the paper is organized as follows. The next section provides an overview of the performance of trade facilitation in Africa and why trade facilitation is relevant for the region. The empirical strategy used in the paper is discussed in Section 3. Section 4 presents and discusses the empirical results. Section 5 concludes the paper with the policy implications of the key findings arising from the study.
2. RELATED LITERATURE
This section of the paper is divided into two parts. The first one provides a brief overview of the evolution and performance of trade facilitation in Africa, while the second part is devoted to why trade facilitation is relevant for Africa.
2.1. Evolution and Performance of Trade Facilitation in Africa: A Brief Overview
Here we provide stylized facts about the evolution and performance of selected trade facilitation indicators in Africa. Specifically, we consider border and transport efficiency indicators (documents to export, time to export, costs to export, documents to import, time to import and costs to import), which are available for almost all African countries. First, we do this analysis for a sample of 52 African countries and compare this with performance in other parts of the world, that is, 35 from the Americas, 26 from Asia and 25 from Europe, for the years 2006–2015.6 Second, we provide a brief discussion on best and worst performing African countries based on average values of the aforementioned indicators.
The evolution, over the period 2006–2015, of the aforementioned indicators is presented in Figures 1–6, respectively. With regard to the number of documents, Figure 1 (exports) and Figure 2 (imports) show that, although there is steady decline over the years, it is much higher in Africa compared with other regions. Thus, it can be stated that the average number of documents required for both exports and imports are higher for Africa relative to other regions and this could possibly be hampering intra-African trade flow.
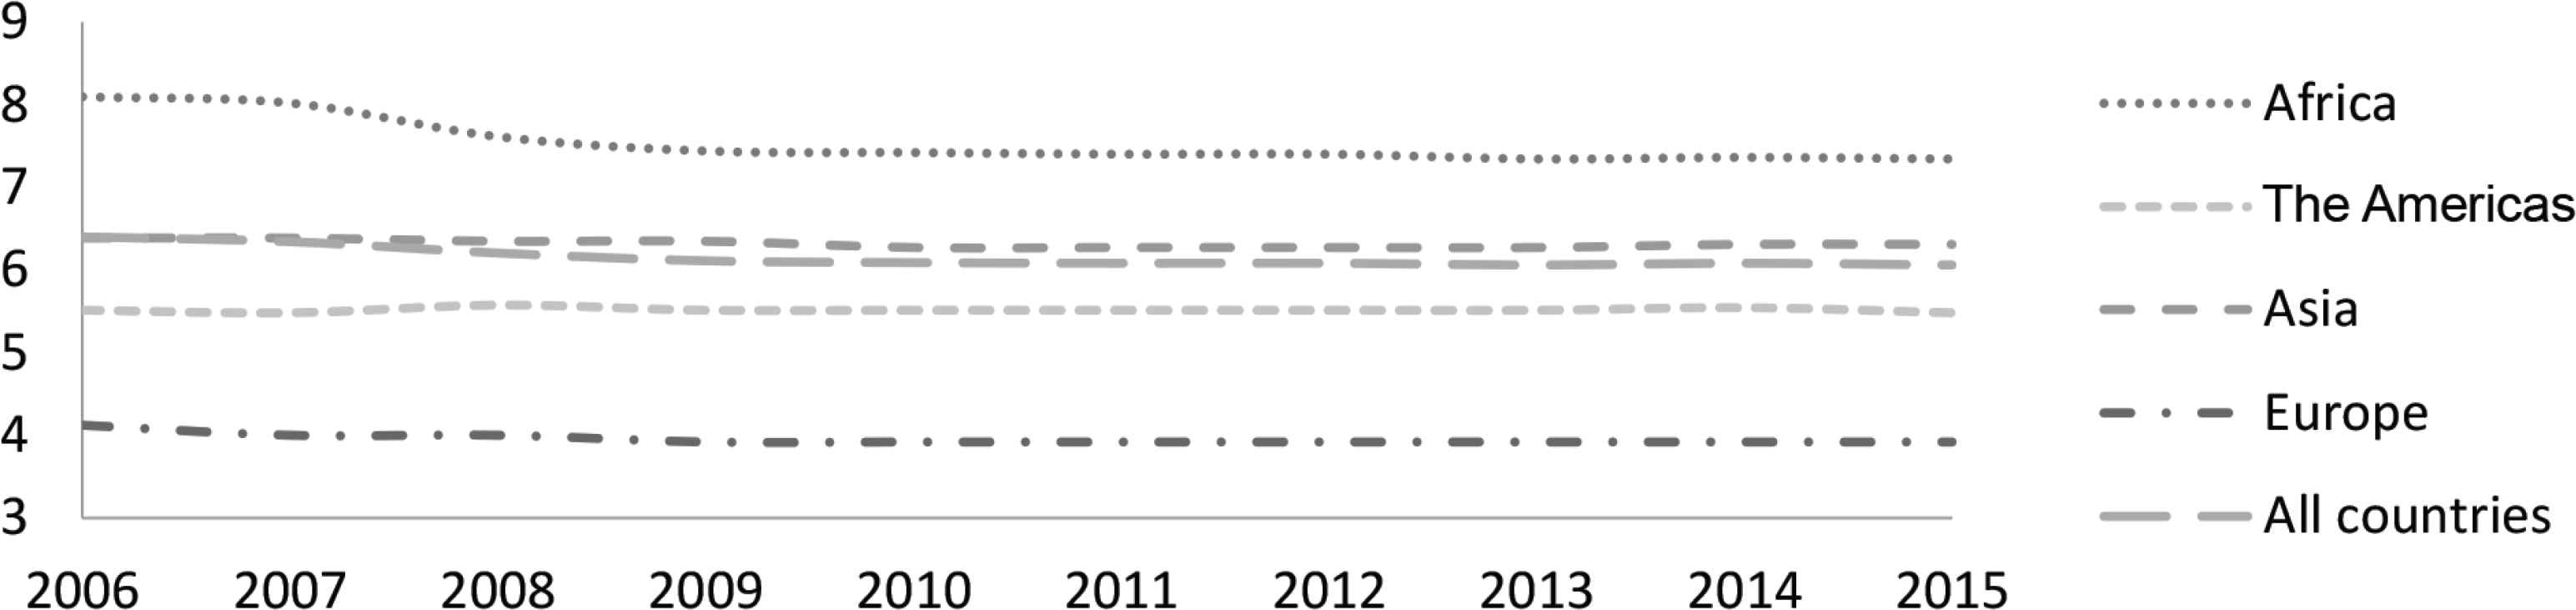
Average documents to export (number). Source: Authors’, based on data from the World Bank Doing Business Database.
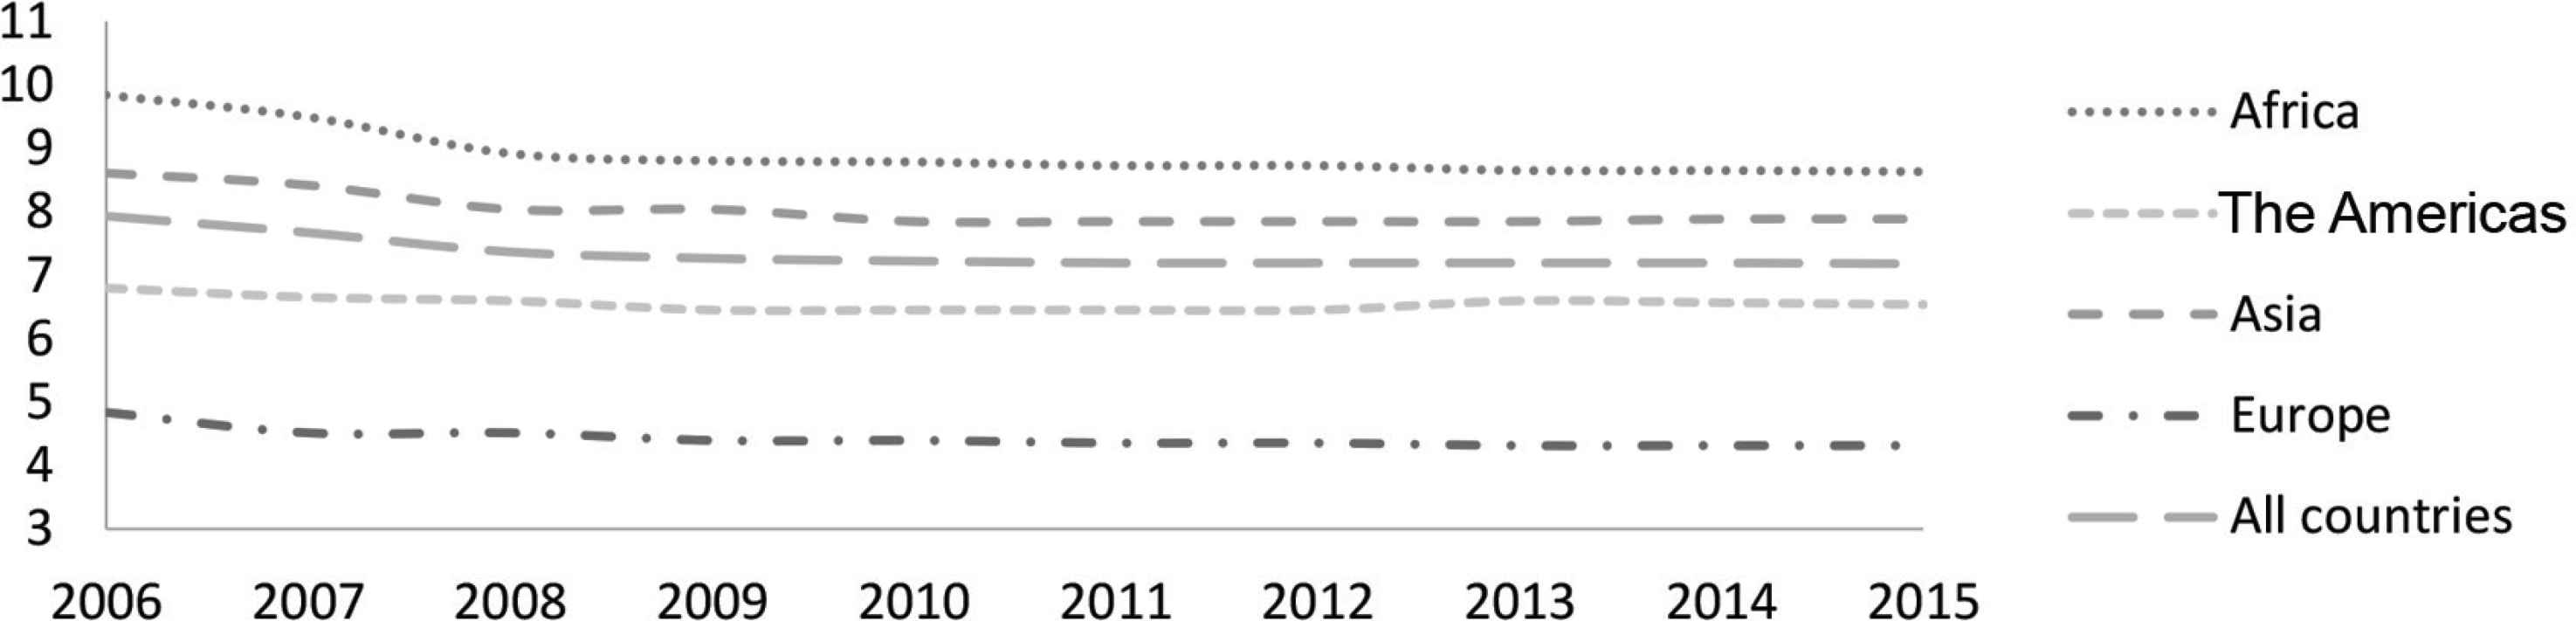
Average documents to import (number). Source: Authors’, based on data from the World Bank Doing Business Database.
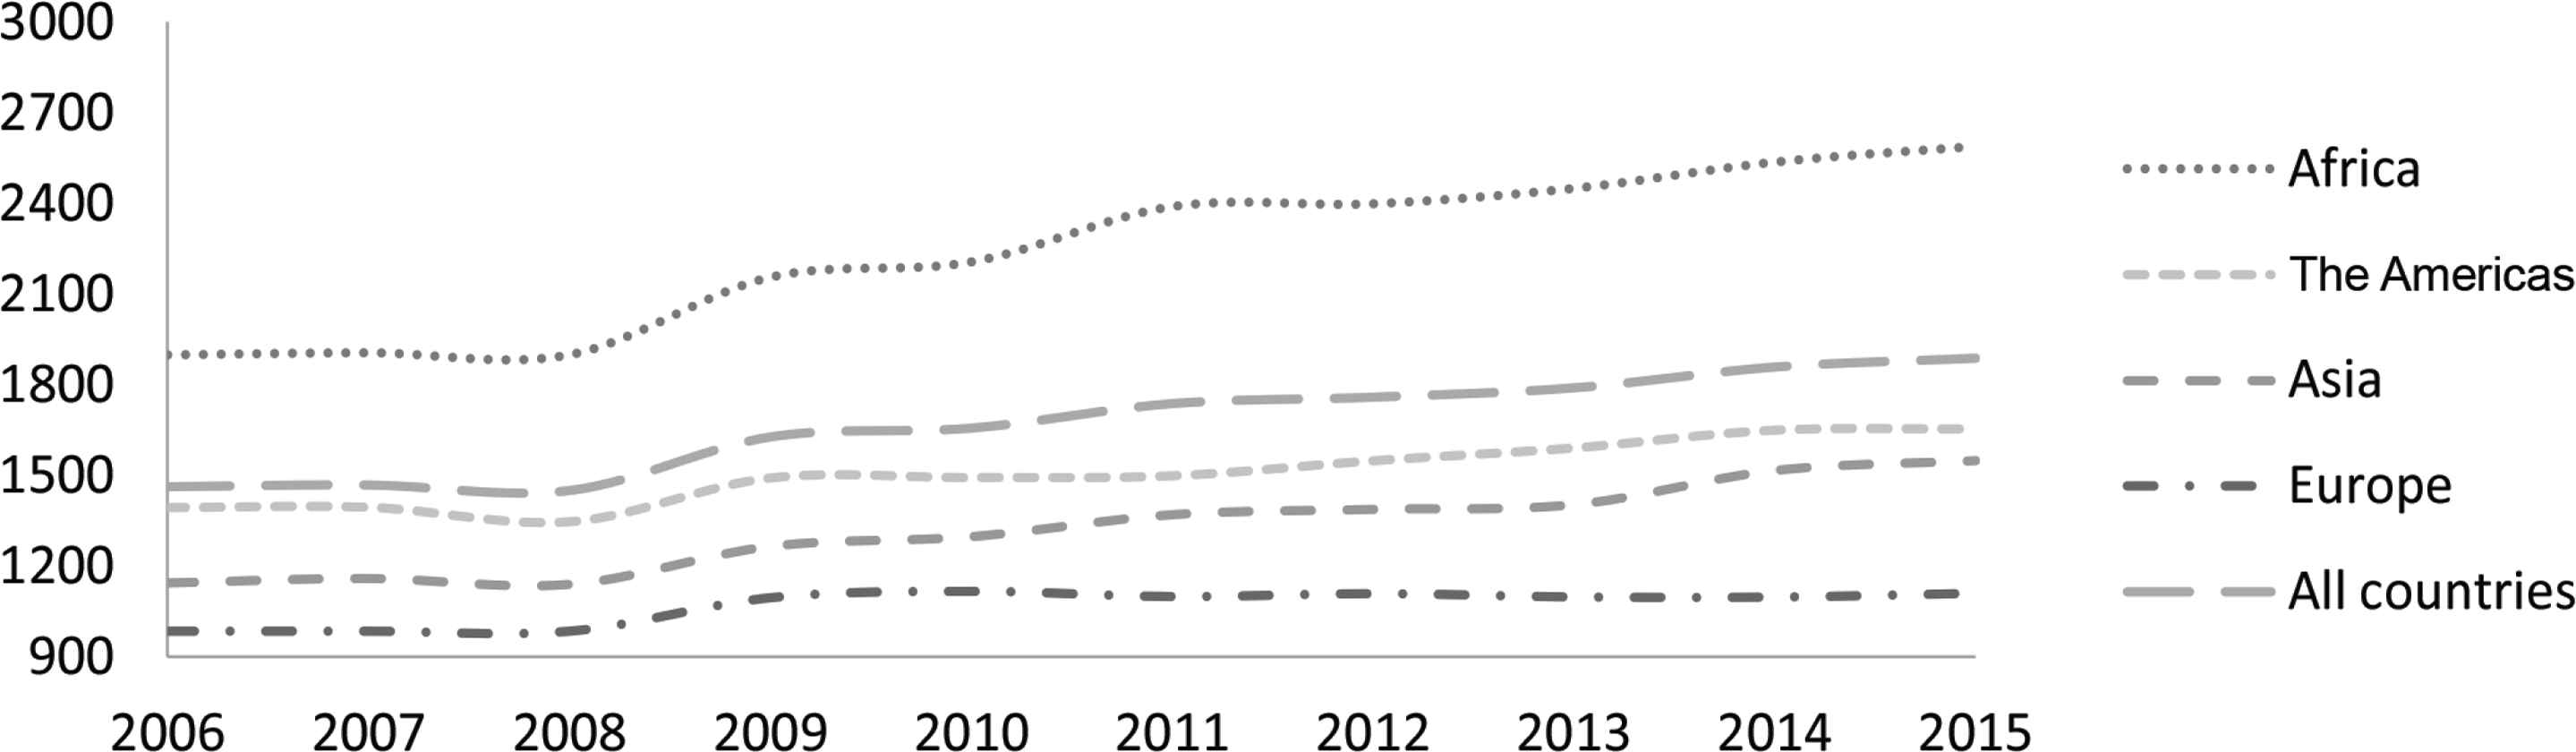
Figures 3 and 4 show the number of days required to export and import, respectively. Similarly, there has also been some improvement over time; however, Africa has the highest number of days spent in order to export and import. In addition, the real costs involved in exporting and importing are displayed in Figures 5 and 6, respectively. It is observed that, on the one hand, the real cost to export/import has increased since 2006 and, on the other, that these costs are significantly higher in Africa than in other regions. In sum, there has been some improvement in the majority of these indicators over the past decade. However, the performance of these indicators clearly shows that African countries lag far behind the other regions of the world. This phenomenon requires urgent attention and policy formulation aimed at improving efficiency of transport and border procedures by policy makers in Africa.
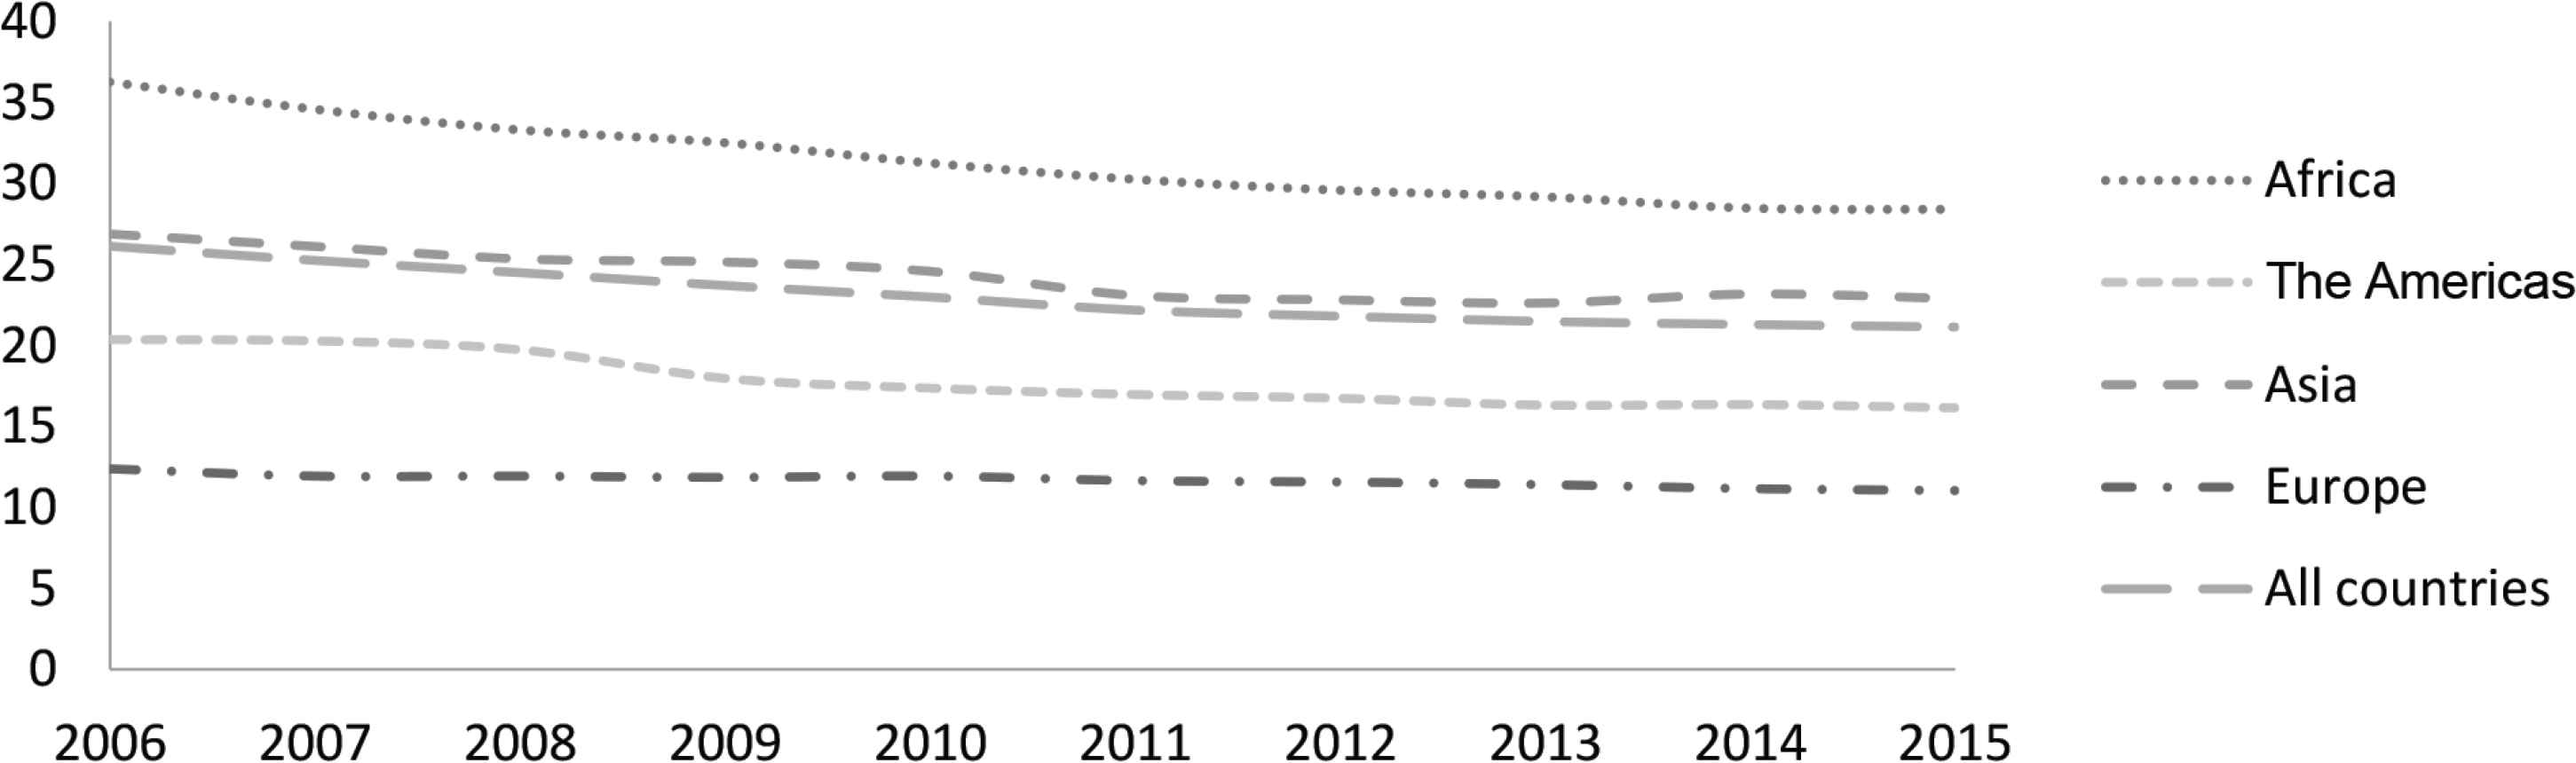
Average time to export (days). Source: Authors’, based on data from the World Bank Doing Business Database.
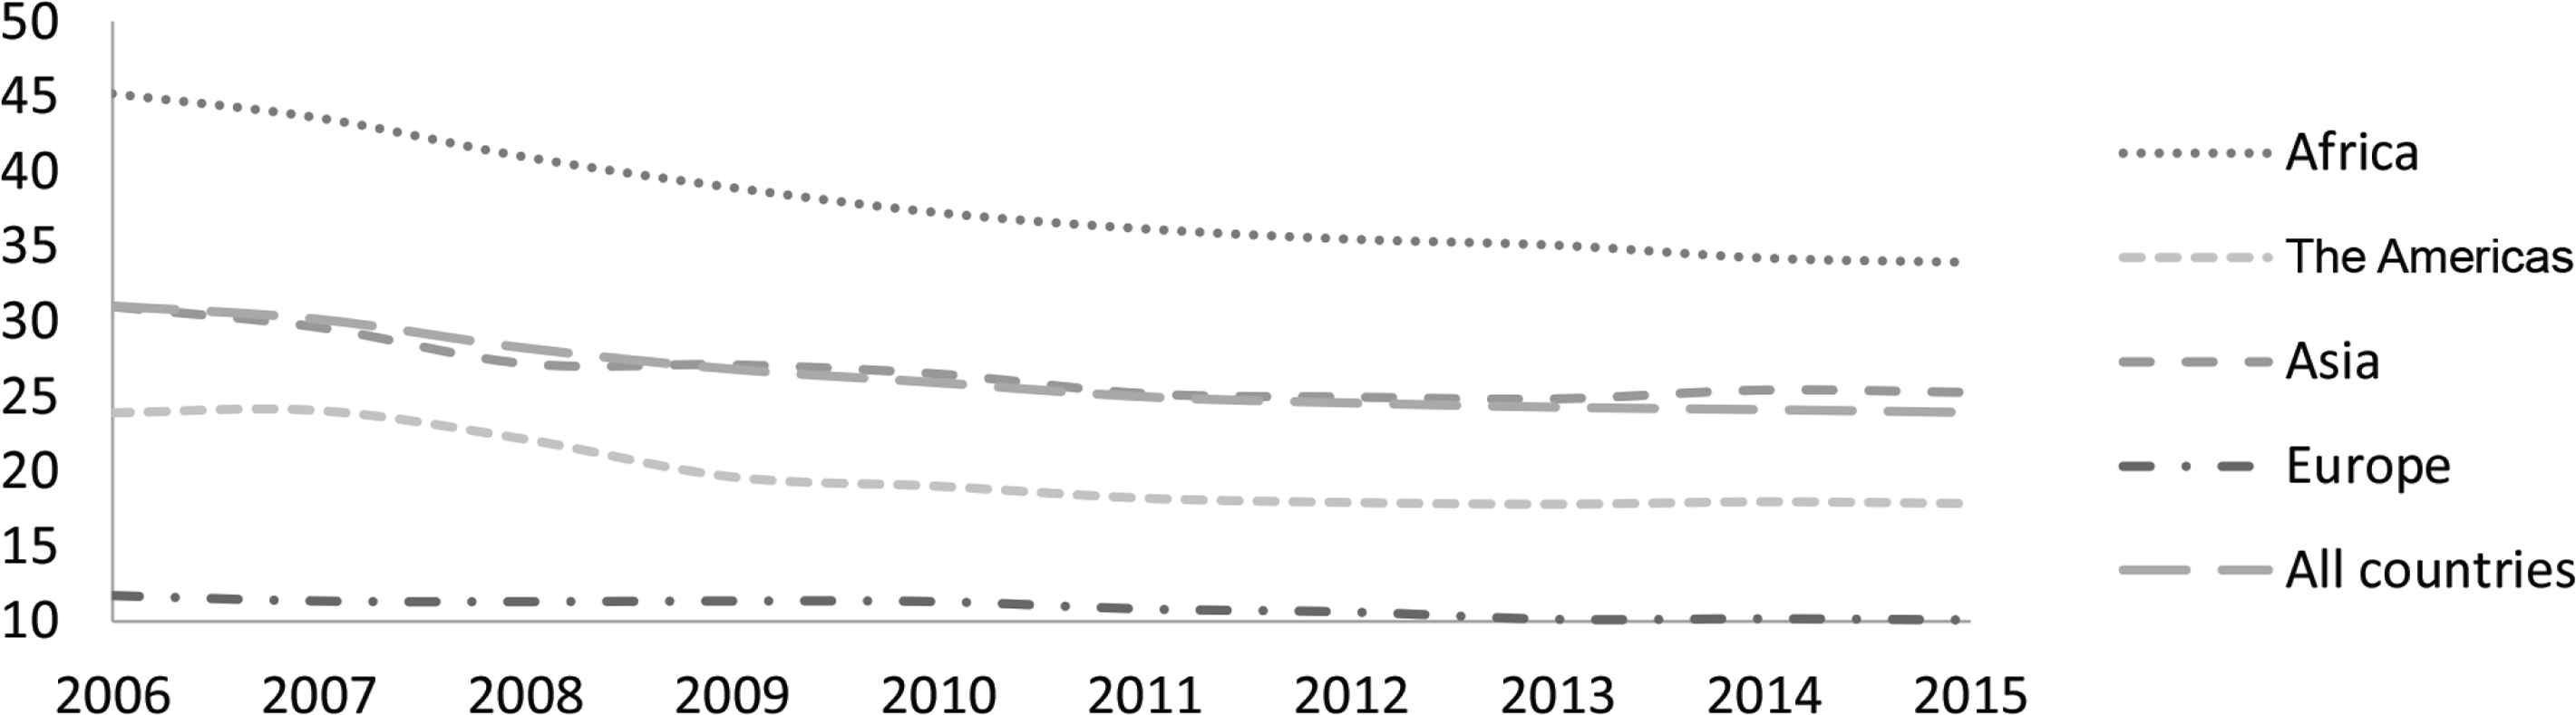
Average time to import (days). Source: Authors’, based on data from the World Bank Doing Business Database.
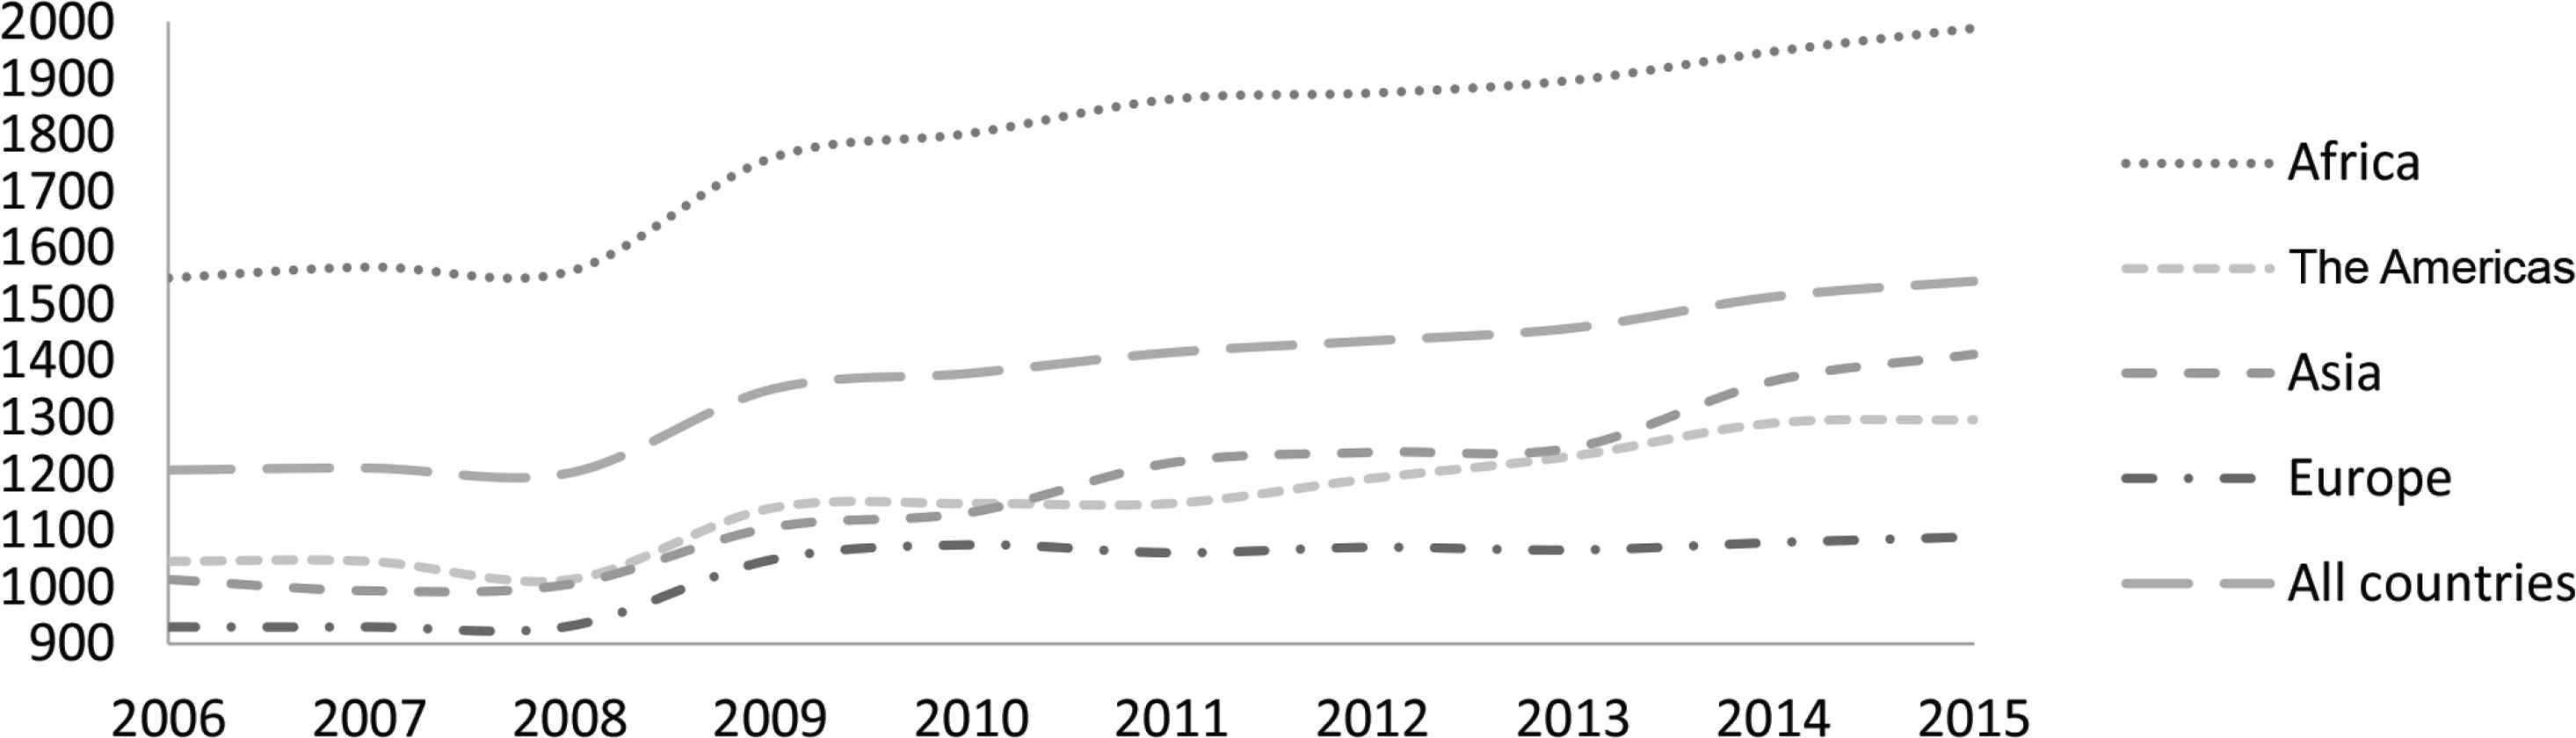
Average cost to export (US$ per container) deflated. Source: Authors’, based on data from the World Bank Doing Business Database.
Average cost to import (US$ per container) deflated. Source: Authors’, based on data from the World Bank Doing Business Database.
To show the performance of specific African countries with regard to these trade facilitation indicators, the average values for border and transport efficiency indicators and distance to frontier, as well as percentage changes of these indicators are reported in Table A1 of Appendix. As evident, the two best (worst) performers are Mauritius and Morocco (Central African Republic and Chad) for distance to frontier, Mauritius and Tunisia (Malawi and Burkina Faso) for number of documents to export, Mauritius and Tunisia (Chad and Niger) for number of days required to export, Morocco and Sao Tome and Principe (Central African Republic and Chad) for costs to export, Seychelles and Mauritius (Central African Republic and Nigeria) for number of documents to import, Seychelles and Senegal (Chad and Zimbabwe) for number of days required to import and Sao Tome and Principe and Gambia (Chad and Central African Republic) for costs to import.
It is evident that while Mauritius, Morocco, Tunisia, Sao Tome and Principe and Seychelles are among the best performers, Central African Republic and Chad remain the worst performers. These outcomes are not surprising given that the worst performing countries are mainly landlocked countries which according to UNECA (2013) are characterized by high trade cost and poor trade facilitation performance while the best performers are not.7 Further, it is worth noting that (see the percentage change) although there has been a significant reduction in the number of days required to export (import) for the majority of African countries, it is generally more difficult to get involved in international trade in the majority of these countries. This calls for urgent attention if African countries are to benefit fully from international and regional trade.
2.2. Why is Trade Facilitation Relevant for Africa?
It is important to note that trade if effectively facilitated has several benefits: it improves trade performance (see, e.g., Santos-Paulino, 2002; Wilson et al., 2003; Portugal-Perez and Wilson, 2009; Freund and Rocha, 2011; Portugal-Perez and Wilson, 2012; Seck, 2017);8 leads to increased income/growth (see Frankel and Romer, 1999; Dollar and Kraay, 2004; Kim and Lin, 2009; Heshmati and Peng, 2012; Herzer, 2013; Sakyi et al., 2015; Sakyi et al., 2017; Santos-Paulino, 2017; Zhou, 2018); reduces unemployment, poverty and inequality (Dollar and Kraay, 2003; Viet, 2015; Zhou, 2018) and improves social welfare (Sakyi et al., 2018). Moreover, increased trade flows resulting from effective trade facilitation, for instance, could lead to a reduction in poverty and inequality directly. This might be due to the fact that increased trade leads to increased economic activity, employment opportunities, competition, education, improved health status and technical know-how (Ravallion, 2001; Dollar and Kraay, 2002; Winters et al., 2004; Goldin and Reinert, 2007; Uprety, 2017).
Theoretically, trade facilitation is not expected to increase trade flow among African countries because of similar comparative advantage or supply structure. However, Afesorgbor (2017) argued that on the basis of new trade theory as pioneered by Krugman (1979), African countries can trade among themselves taking the form of intra-industry trade including simple manufactures or varieties of agricultural goods. Looking at trade facilitation from the perspective of firms, reducing trade costs for firms through trade facilitation can significantly improve the chance of domestic firms to enter foreign markets. Even non-exporters within the domestic economy can improve their chances of entering new markets if trade costs can be reduced significantly. For instance, Spence and Karingi (2011) confirmed the positive association between trade facilitation, firm productivity and export competitiveness. Largely, a higher trade cost in serving a foreign market as within the framework of firm heterogeneity constitutes a major hinderance for domestic firms in entering export markets (Melitz, 2003). Trade if effectively facilitated can reduce the transaction costs of domestic firms in export markets and this could constitute a substantial boost to the productivity of these firms. In addition, Seck (2017) stressed that trade facilitation would spur firms in sub-Saharan African countries to reap greater benefits from global trade systems.
Therefore, considering the gains trade could bring, the United Nations Economic Commission for Africa (UNECA, 2004b) asserted that developing countries (and African countries in particular) have not yet fully benefited from the potential increase in international trade. In short, this makes trade facilitation essential (Iwanow and Kirkpatrick, 2007; Dennis and Shepherd, 2011; Portugal-Perez and Wilson, 2012). This is the case because according to the WTO (2013), trade if effectively facilitated could reduce trade costs by between US$350 billion and US$1 trillion globally. Hufbauer and Schott (2013) further noted that possible growth in trade emanating from extensive trade facilitation arrangements could cause an annual surge in world Gross Domestic Product (GDP) by US$960 billion. Moreover, these amounts could be reinvested to further increase global production and trade.
Despite these potential benefits, trade facilitation in Africa has been inadequate to ensure a smooth running of trade within Africa and with other non-African countries. According to Sakyi et al. (2017), ‘while on average, approximately eight (nine) documents, 31 (38) days and US$1780.27 (US$2243.14) are required for exports (imports) in Africa, only four (five) documents, 12 (11) days and US$1028.04 (US$1069.07) are required for exports (imports) in Europe’. These outcomes support the conclusions drawn from Section 2.1. It is therefore not surprising that in Africa, ineffective facilitation of trade hampers the free flow of trade more than what tariffs and other trade-preventive mechanisms do.
Over the years, most African countries have made significant trade reforms through the structural adjustment programs (Tarp and Aryeetey, 2000).9 The rationale for these reform policies is the quest to increase international trade and to take advantage of the benefits of trade. Despite the fact that major trade liberalization and other reform policies have been adopted by a number of African countries, there has not been a corresponding improvement in African trade performance. For instance, Freund and Rocha (2011) highlighted the abysmal performance of Africa in terms of the falling share of world merchandize exports. Moreover, the numerous regionalism and regional integration activities, and bilateral and multilateral trade negotiations of African countries are expected to provide fertile grounds for trade to abound both within and outside the continent (Sakyi and Osei Opoku, 2014). Notwithstanding, the unimpressive trade performance has remained despite Africa’s enormous natural resources and trade potential. Obviously, these are the consequence of ineffective trade facilitation (Afesorgbor, 2018).
While the volumes of trade flows from and to African countries have generally increased and remain somewhat impressive, in reflection of the continent’s increasing integration into the world economy (see UNECA, 2015), this outcome, according to Traoré and Sakyi (2017), ‘is still below expectations when compared with other regions of the world’. In 1950, Africa’s share of world export was 10% but it dropped to as low as 2.7% in 2000 (UNECA, 2004a). Moreover, Africa’s share of world exports (imports) stood at an average of 4.9% (4.3%) in the 1970s and 2.8% (2.5%) in the 2000s (UNCTAD, 2013). The situation is even worse when we consider only the case of sub-Saharan Africa. On the basis on this outcome, Freund and Rocha (2011), for instance, asserted that controlling for the standard determinants of trade, export volumes are about 16% less than what is expected of Africa.
Ineffective trade facilitation factors, such as undue customs delays and poor administration, insufficient/inefficient transport and telecommunication system, too many documentations and bureaucratic procedural activities, inadequate coordination between government agencies and corruption (see, e.g., Djankov et al., 2006; Buyonge and Kireeva, 2008; UNCTAD, 2008; Teravaninthorn and Raballand, 2009; Portugal-Perez and Wilson, 2012; UNECA, 2013; Shepherd, 2016; Sakyi et al., 2018), are major possible causes of Africa’s inability to fully reap the trade opportunities that globalization presents, making Africa notably a very high cost trading zone. Despite these factors contributing to the region’s poor trade performance, the World Bank (2006) had also blamed this outcome on poor design and execution of trade policies. Therefore, considering the high cost and trade disincentives in the region, issues of trade facilitation cannot be underestimated. The surest way of taking advantage of these opportunities is through effective trade facilitation. This is crucial because, as noted by Hartzenberg (2011) and Shepherd (2016), trade facilitation enhances network connectivity and remains central to boost Africa’s trade both inter-regionally and globally.
3. EMPIRICAL STRATEGY
3.1. Data
To achieve the objectives of our paper, we employ current data set on trade facilitation variables sourced from the World Bank Doing Business Database (DBD) for a sample of 52 African countries.10 The DBD provides comprehensive cross-country data on relevant information related to trade facilitation.
Several trade facilitation indicators which are directly related to border and transport efficiency, namely, time to export, cost to export, the number of documents required to export, time to import, cost to import and the number of documents required to import are used. As several authors have shown (see, e.g., Freund and Rocha, 2011; Portugal-Perez and Wilson, 2012; Sakyi et al., 2017), these indicators play a pivotal role in international trade and economic performance of countries.
To ensure that the results of this paper are robust, we consider in addition to these border and transport efficiency indicators, the World Bank Doing Business’s distance to frontier score which is related to the aforementioned trade facilitation variables. Distance to frontier score ranges from 0 (the least performer) to 100 (the best performer).11 It measures the gap between a particular economy’s performance and the best performer, and serves as a basis for the ease of doing business rankings. Considering that the trade facilitation data are a recently constructed data set, we limit our analysis of their impact to the period 2006–2015.
To determine the impact of trade facilitation on trade flow within Africa, we combine these border and transport efficiency indicators with bilateral trade flows from the International Monetary Fund Direction of Trade Statistics. We measure trade flow using bilateral exports at aggregated level. Exports are measured at free-on-board prices. In addition, we merge the trade flow variables with standard gravity equation variables sourced from the Centre d’Etudes Prospectives et d’Informations Internationales. A short definition of all variables, their sources and summary statistics are included in Tables 1 and 2.
| Variables | Definitions | Sources |
|---|---|---|
| GDPit | Exporting country’s GDP measured in million US$ at time t | CEPII |
| GDPjt | Importing country’s GDP measured in million US$ at time t | CEPII |
| Popit | Exporting country’s population measured in million at time t | CEPII |
| Popjt | Importing country’s population measured in million at time t | CEPII |
| Conflictit | Number of attempted and successful coups in country i at time t | Coup d’Etat Events (Marshall and Marshall, 2017) |
| Conflictjt | Number of attempted and successful coups in country j at time t | Coup d’Etat Events (Marshall and Marshall, 2017) |
| Polity2it | Polity2 score in country i at time t | Polity IV project (Marshall et al., 2017) |
| Polity2jt | Polity2 score in country j at time t | Polity IV project (Marshall et al., 2017) |
| Doc_exportit | Number of document required to export from country i at time t | WBDBD |
| Time_exportit | Number of days required to export from country i at time t | WBDBD |
| Cost to exportit | Cost to export from country i at time t | WBDBD |
| Doc_importit | Number of document required to import from country i at time t | WBDBD |
| Time_importit | Number of days required to import from country i at time t | WBDBD |
| Cost to importit | Cost to import from country i at time t | WBDBD |
| RTAijt | Dummy variable with value 1 if i and j belong to the same RTA at time t, 0 otherwise | CEPII |
| WTOijt | Dummy variable with value 1 if i and j belong to the WTO at time t, 0 otherwise | CEPII |
| Contiguityij | Dummy variable with value 1 if i and j share a land border, 0 otherwise | CEPII |
| Common currencyijt | Dummy variable with value 1 if i and j use the same currency, 0 otherwise | CEPII |
| Distanceij | Geographical distance between country i and j in km | CEPII |
Note: CEPII, Centre d’Etudes Prospectives et d’Informations Internationales; GDP, gross domestic product; RTA, Regional Trade Agreement; WBDBD, World Bank Doing Business Database; WTO, World Trade Organization. Higher values of the trade facilitation indicators imply better outcomes or improved levels.
Definition of variables and data source
| Variables | Observed | Mean | Standard deviation | Min | Max |
|---|---|---|---|---|---|
| Economic and political variables | |||||
| Exports (million) | 15,521 | 42.270 | 222.616 | 0.061 | 5268.292 |
| Imports (million) | 16,523 | 39.700 | 235.547 | 3.000 | 5431.641 |
| GDP_o (million) | 23,255 | 38,837.090 | 80,727.560 | 135.182 | 568,498.900 |
| GDP_d | 23,245 | 38,980.070 | 81,109.920 | 135.182 | 568,498.900 |
| pop_o | 23,650 | 19.810 | 28.262 | 0.085 | 182.202 |
| pop_d | 23,644 | 20.020 | 28.477 | 0.085 | 182.202 |
| polity2_o | 21,527 | 1.891 | 5.128 | –9 | 10 |
| polity2_d | 21,526 | 1.861 | 5.159 | –9 | 10 |
| coups_o | 21,560 | 0.050 | 0.241 | 0 | 2 |
| coups_d | 21,560 | 0.051 | 0.243 | 0 | 2 |
| Trade facilitation variables | |||||
| docexp_o | 23,360 | 7.517 | 1.804 | 4.000 | 14.000 |
| timexp_o | 23,360 | 30.830 | 14.358 | 10.000 | 78.000 |
| costexp_o | 23,360 | 1755.187 | 1089.500 | 463.000 | 6615.000 |
| docimp_d | 23,350 | 8.979 | 2.736 | 5.000 | 21.000 |
| timeimp_d | 23,350 | 37.253 | 18.123 | 9.000 | 102.000 |
| costimp_d | 23,350 | 2192.378 | 1527.325 | 577.000 | 9025.000 |
| Other trade cost variables | |||||
| Distance | 23,720 | 3635.242 | 1923.225 | 162.182 | 9772.055 |
| Contiguity | 23,720 | 0.074 | 0.262 | 0.000 | 1.000 |
| Common language | 23,720 | 0.448 | 0.497 | 0.000 | 1.000 |
| Common currency | 23,720 | 0.078 | 0.269 | 0.000 | 1.000 |
| RTA | 23,720 | 0.188 | 0.391 | 0 | 1 |
Note: RTA, Regional Trade Agreement. Source: Authors’ computations. Higher values of the trade facilitation variables imply better facilitation outcomes.
Summary statistics
3.2. Methodology
As indicated previously, we rely on the standard gravity model as used by Anderson and van Wincoop (2003) as our main empirical tool to analyze the impact of trade facilitation on trade flows in Africa. As often argued, the gravity model is used as a workhorse to explain trade flows between countries. It indicates that trade flow between two countries is explained by the supply potential (proxied by the GDP) of the exporting country, the market demand potential (proxied by GDP) of the importing country and the trade cost (proxied by the distance) between the exporting and importing countries.
Traditionally, the gravity model is specified in a naive form where the GDP and distance variables are augmented with observable trade cost variables such as trade agreements, common currency, contiguity and common language (see Sandberg et al., 2006). However, following the works of Anderson and van Wincoop (2003), the emphasis has been placed on the Multilateral Resistance Term (MRT). The MRT emphasizes that bilateral trade between two countries is not determined solely by the bilateral variables between the two countries but rather by the relative position of the two countries to the rest of the world. Considering that MRTs are unobserved and difficult to compute, we rely on the use of dyadic fixed effects to control for the MRT (Feenstra, 2004). These fixed effects would also control for unobserved time-invariant heterogeneity that is likely to correlate with trade flows as well as trade cost variables. To cater for this econometric concern, we specify our main empirical model as Equation (1).
Apart from the MRT issue, the second major econometric concern relates to issues of zero flows in trade measurement data. High percentage of zero flows arises because of statistical rounding-up especially when trade volumes or values between countries are small. This issue if not adequately addressed introduces selection bias. Many studies that focus on trade flow among African countries report that the issue of zero flows are endemic. For example, in Afesorgbor (2017), the study reported zero flows in trade data of about 55%. However, these outcomes are mainly attributed to looking at trade flow in the distant past. Our study uses trade flows that spanned a more current period (2006–2015) and as a result of this, zero flows are not a significant problem in our data set.12
Our third econometric concern revolves around the problem of multidimensionality of the border and transport efficiency indicators (time to export, cost to export, the number of documents required to export, time to import, cost to import and the number of documents required to import) and their related distance to frontier (dtf) variables [time to export (dtf), cost to export (dtf), the number of documents required to export (dtf), time to import (dtf), cost to import (dtf) and the number of documents required to import (dtf)] in which these variables are also strongly correlated with one another. To minimize this econometric concern, we do not only consider these variables in each equation separately, but we also adopt the empirical strategy of PCA.13 Using the PCA approach, four composite indicators of trade facilitation are created. First, is the principal component derived from time to export, cost to export and the number of documents required to export (borderx_pca_o). Second, is the principal component derived from time to export (dtf), cost to export (dtf) and the number of documents required to import (dtf) (borderx_pca_dtf_o). Third, is the principal component derived from time to import, cost to import and the number of documents required to import (borderm_pca_d). Fourth, is the principal component derived from time to import (dtf), cost to import (dtf) and the number of documents required to import (dtf) (borderm_dtf_pca_d). Table 3 summarizes the results of the PCA for the additional trade facilitation indicators used in the paper.
| Eigen value | Proportion explained | Primary variables | Eigen vectors | Correlation coefficients | Bartlett (p-value) | |
|---|---|---|---|---|---|---|
| Export costs (borderx_pca_o) | 1.946 | 0.649 | Time to export | 0.662 | 0.923 | |
| Cost to export | 0.612 | 0.853 | 0 | |||
| Number of documents to export | 0.434 | 0.605 | ||||
| Export costs (dtf) (borderx_dtf_pca_o) | 2.061 | 0.687 | Time to export (dtf) | 0.647 | 0.928 | |
| Cost to export (dtf) | 0.609 | 0.875 | 0 | |||
| Number of documents required to import (dtf) | 0.459 | 0.659 | ||||
| Import costs (borderm_pca_d) | 2.082 | 0.694 | Time to import | 0.623 | 0.898 | |
| Cost to import | 0.594 | 0.857 | 0 | |||
| Number of documents required to import | 0.510 | 0.735 | ||||
| Import costs (dtf) (borderm_dtf_pca_d) | 2.204 | 0.735 | Time to export (dtf) | 0.619 | 0.918 | |
| Cost to export (dtf) | 0.603 | 0.895 | 0 | |||
| Number of documents required to import (dtf) | 0.504 | 0.749 |
Note: The principal component scores are normalized to a scale of 0–10 using min–max transformation with higher values corresponding to better trade facilitation outcomes. The correlation coefficients show the degree of correlation between the constructed composite index and the corresponding trade facilitation variables. The number of principal components is selected by the Kaiser criterion of eigenvalue greater than one. Source: Authors’ computations.
Principal component analysis of trade facilitation indicators
4. RESULTS AND DISCUSSION
Here we report and provide an economic interpretation of the coefficients of the estimated gravity model. These results are summarized in Tables 4–6. Table 4 reports the case when we include only the border and transport efficiency indicators [time to export, cost to export, the number of documents required to export and time to import, cost to import, the number of documents required to import] and the PCA indices of these indicators (borderx_pca_o and borderm_pca_d) for the exporting and importing countries.
| Variables | (1) lnexports | (2) lnexports | (3) lnexports | (4) lnexports | (5) lnexports | (6) lnexports | (7) lnexports | (8) lnexports |
|---|---|---|---|---|---|---|---|---|
| lngdp_o | 0.319*(0.157) | 0.302** (0.156) | 0.311* (0.153) | 0.305* (0.155) | 0.316* (0.157) | 0.301** (0.156) | 0.308* (0.153) | 0.305* (0.155) |
| lngdp_d | 0.299* (0.127) | 0.298* (0.127) | 0.311* (0.126) | 0.298* (0.126) | 0.290* (0.128) | 0.297* (0.127) | 0.313* (0.126) | 0.301* (0.126) |
| lnpop_o | 0.562 (0.839) | 0.394 (0.840) | 1.287 (0.856) | 0.744 (0.839) | 0.557 (0.840) | 0.393 (0.841) | 1.287 (0.855) | 0.746 (0.840) |
| lnpop_d | 0.635 (0.878) | 0.639 (0.878) | 0.564 (0.871) | 0.603 (0.875) | 0.657 (0.879) | 0.667 (0.876) | 0.295 (0.882) | 0.598 (0.878) |
| polity2_o | –0.0316* (0.0137) | –0.0284* (0.0137) | –0.0294* (0.0133) | –0.0227** (0.0136) | –0.0315* (0.0137) | –0.0284* (0.0138) | –0.0295* (0.0133) | –0.0229** (0.0136) |
| polity2_d | 0.0232** (0.0130) | 0.0233** (0.0131) | 0.0226** (0.0129) | 0.0227** (0.0130) | 0.0244** (0.0131) | 0.0231** (0.0131) | 0.0217** (0.0130) | 0.0217** (0.0131) |
| conflict_o | –0.187** (0.0994) | –0.196* (0.0989) | –0.189** (0.0987) | –0.192** (0.0989) | –0.186** (0.0995) | –0.195* (0.0991) | –0.190** (0.0988) | –0.192** (0.0991) |
| conflict_d | 0.0858 (0.0693) | 0.0860 (0.0691) | 0.0878 (0.0692) | 0.0860 (0.0691) | 0.0862 (0.0693) | 0.0867 (0.0690) | 0.0931 (0.0690) | 0.0879 (0.0690) |
| borderx_pca_o | 0.133*** (0.0413) | 0.133*** (0.0414) | ||||||
| borderm_pca_d | –0.0194 (0.0354) | |||||||
| costexp_o | 0.167*** (0.0476) | 0.166*** (0.0474) | ||||||
| costimp_d | –0.0595* (0.0298) | |||||||
| timexp_o | 0.0636** (0.0373) | 0.0638** (0.0373) | ||||||
| timeimp_d | –0.00452 (0.0331) | |||||||
| docexp_o | 0.0331 (0.0226) | 0.0332 (0.0226) | ||||||
| docimp_d | 0.0215 (0.0287) | |||||||
| Constant | –4.618 (4.750) | –4.042 (4.722) | –7.421 (4.699) | –5.302 (4.719) | –4.529 (4.745) | –4.047 (4.720) | –6.262 (4.764) | –5.236 (4.730) |
| Observations | 13,590 | 13,590 | 13,590 | 13,590 | 13,555 | 13,555 | 13,555 | 13,555 |
| R2 | 0.038 | 0.038 | 0.040 | 0.040 | 0.038 | 0.038 | 0.041 | 0.040 |
| Number of pair_id | 1963 | 1963 | 1963 | 1963 | 1945 | 1945 | 1945 | 1945 |
| Dyadic fixed effects | Yes | Yes | Yes | Yes | Yes | Yes | Yes | Yes |
| Time fixed effects | Yes | Yes | Yes | Yes | Yes | Yes | Yes | Yes |
Note: Robust standard errors in parentheses,
p < 0.01,
p < 0.05,
p < 0.1.
Source: Authors’ computations.
Exports model for trade facilitation indicators
| Variables | (1) lnexports | (2) lnexports | (3) lnexports | (4) lnexports | (5) lnexports | (6) lnexports | (7) lnexports | (8) lnexports |
|---|---|---|---|---|---|---|---|---|
| lngdp_o | 0.323* (0.157) | 0.303** (0.156) | 0.209 (0.159) | 0.255 (0.155) | 0.323* (0.157) | 0.303** (0.156) | 0.211 (0.159) | 0.258** (0.155) |
| lngdp_d | 0.299* (0.127) | 0.299* (0.127) | 0.301* (0.127) | 0.296* (0.127) | 0.299* (0.127) | 0.298* (0.127) | 0.355*** (0.125) | 0.317* (0.128) |
| lnpop_o | 0.552 (0.840) | 0.457 (0.840) | 0.515 (0.838) | 0.491 (0.838) | 0.551 (0.841) | 0.458 (0.841) | 0.505 (0.837) | 0.491 (0.839) |
| lnpop_d | 0.639 (0.878) | 0.638 (0.878) | 0.635 (0.874) | 0.632 (0.875) | 0.651 (0.881) | 0.692 (0.875) | 0.710 (0.875) | 0.700 (0.874) |
| polity2_o | –0.0316* (0.0137) | –0.0284* (0.0138) | –0.0294* (0.0136) | –0.0221 (0.0138) | –0.0316* (0.0138) | –0.0285* (0.0138) | –0.0295* (0.0136) | –0.0224 (0.0138) |
| polity2_d | 0.0233** (0.0130) | 0.0234** (0.0131) | 0.0232** (0.0130) | 0.0231** (0.0130) | 0.0232** (0.0131) | 0.0226** (0.0131) | 0.0218** (0.0131) | 0.0207 (0.0131) |
| conflict_o | –0.187** (0.0994) | –0.197* (0.0986) | –0.186** (0.0992) | –0.193** (0.0990) | –0.187** (0.0995) | –0.196* (0.0987) | –0.186** (0.0992) | –0.193** (0.0990) |
| conflict_d | 0.0859 (0.0693) | 0.0861 (0.0691) | 0.0857 (0.0691) | 0.0854 (0.0691) | 0.0860 (0.0693) | 0.0886 (0.0689) | 0.0839 (0.0690) | 0.0878 (0.0690) |
| borderx_dtf_pca_o | 0.104*** (0.0327) | 0.104*** (0.0327) | ||||||
| borderm_dtf_pca_d | –0.0345 (0.0334) | |||||||
| costexp_dtf_o | 0.0635*** (0.0201) | 0.0630*** (0.0201) | ||||||
| costimp_dtf_d | –0.0309 (0.0192) | |||||||
| timexp_dtf_o | 0.0418 (0.0254) | 0.0418 (0.0254) | ||||||
| timeimp_dtf_d | –0.0102 (0.0246) | |||||||
| docexp_dtf_o | 0.0247 (0.0178) | 0.0247 (0.0178) | ||||||
| docimp_dtf_d | –0.00241 (0.0242) | |||||||
| Constant | –4.635 (4.757) | –4.022 (4.722) | –2.154 (4.762) | –3.233 (4.702) | –4.624 (4.761) | –4.089 (4.722) | –3.468 (4.759) | –3.776 (4.696) |
| Observations | 13,590 | 13,590 | 13,590 | 13,590 | 13,555 | 13,555 | 13,555 | 13,555 |
| R2 | 0.038 | 0.038 | 0.039 | 0.039 | 0.038 | 0.038 | 0.040 | 0.040 |
| Number of pair_id | 1963 | 1963 | 1963 | 1963 | 1945 | 1945 | 1945 | 1945 |
| Dyadic fixed effects | Yes | Yes | Yes | Yes | Yes | Yes | Yes | Yes |
| Time fixed effects | Yes | Yes | Yes | Yes | Yes | Yes | Yes | Yes |
Note: Robust standard errors in parentheses,
p < 0.01,
p < 0.05,
p < 0.1.
Source: Authors’ computations. Higher values of the trade facilitation variables imply better facilitation outcomes.
Exports model for distance to frontier indicators
| Variables | (1) lnexports | (2) lnexports | (3) lnexports | (4) lnexports | (5) lnexports | (6) lnexports | (7) lnexports | (8) lnexports |
|---|---|---|---|---|---|---|---|---|
| lngdp_o | 0.319* (0.157) | 0.302** (0.156) | 0.311* (0.153) | 0.305* (0.155) | 0.323* (0.157) | 0.303** (0.156) | 0.209 (0.159) | 0.255 (0.155) |
| lngdp_d | 0.299* (0.127) | 0.298* (0.127) | 0.311* (0.126) | 0.298* (0.126) | 0.299* (0.127) | 0.299* (0.127) | 0.301* (0.127) | 0.296* (0.127) |
| lnpop_o | 0.562 (0.839) | 0.394 (0.840) | 1.287 (0.856) | 0.744 (0.839) | 0.552 (0.840) | 0.457 (0.840) | 0.515 (0.838) | 0.491 (0.838) |
| lnpop_d | 0.635 (0.878) | 0.639 (0.878) | 0.564 (0.871) | 0.603 (0.875) | 0.639 (0.878) | 0.638 (0.878) | 0.635 (0.874) | 0.632 (0.875) |
| polity2_o | –0.0316* (0.0137) | –0.0284* (0.0137) | –0.0294* (0.0133) | –0.0227** (0.0136) | –0.0316* (0.0137) | –0.0284* (0.0138) | –0.0294* (0.0136) | –0.0221 (0.0138) |
| polity2_d | 0.0232** (0.0130) | 0.0233** (0.0131) | 0.0226** (0.0129) | 0.0227** (0.0130) | 0.0233** (0.0130) | 0.0234** (0.0131) | 0.0232** (0.0130) | 0.0231** (0.0130) |
| conflict_o | –0.187** (0.0994) | –0.196* (0.0989) | –0.189** (0.0987) | –0.192** (0.0989) | –0.187** (0.0994) | –0.197* (0.0986) | –0.186** (0.0992) | –0.193** (0.0990) |
| conflict_d | 0.0858 (0.0693) | 0.0860 (0.0691) | 0.0878 (0.0692) | 0.0860 (0.0691) | 0.0859 (0.0693) | 0.0861 (0.0691) | 0.0857 (0.0691) | 0.0854 (0.0691) |
| borderx_dtf_pca_o | 0.104*** (0.0327) | |||||||
| costexp_dtf_o | 0.0635*** (0.0201) | |||||||
| timexp_dtf_o | 0.0418 (0.0254) | |||||||
| docexp_dtf_o | 0.0247 (0.0178) | |||||||
| borderx_pca_o | 0.133*** (0.0413) | |||||||
| costexp_o | 0.167*** (0.0476) | |||||||
| timexp_o | 0.0636** (0.0373) | |||||||
| docexp_o | 0.0331 (0.0226) | |||||||
| Constant | –4.618 (4.750) | –4.042 (4.722) | –7.421 (4.699) | –5.302 (4.719) | –4.635 (4.757) | –4.022 (4.722) | –2.154 (4.762) | –3.233 (4.702) |
| Observations | 13,590 | 13,590 | 13,590 | 13,590 | 13,590 | 13,590 | 13,590 | 13,590 |
| R2 | 0.038 | 0.038 | 0.040 | 0.040 | 0.038 | 0.038 | 0.039 | 0.039 |
| Number of pair_id | 1963 | 1963 | 1963 | 1963 | 1963 | 1963 | 1963 | 1963 |
| Dyadic fixed effects | Yes | Yes | Yes | Yes | Yes | Yes | Yes | Yes |
| Time fixed effects | Yes | Yes | Yes | Yes | Yes | Yes | Yes | Yes |
Note: Robust standard errors in parentheses,
p < 0.01,
p < 0.05,
p < 0.1.
Source: Authors’ computations. Higher values of the trade facilitation variables imply better facilitation outcomes.
Exports models for both trade facilitation and distance to frontier indicators
In Table 5, we report the case when we include only the distance to frontier versions of the border and transport efficiency indicators [time to export (dtf), cost to export (dtf), the number of documents required to export (dtf), time to import (dtf), cost to import (dtf), the number of documents required to import (dtf)] and the PCA indices of these indicators (borderx_dtf_pca_o and borderm_dtf_pca_d) while we include only exports-related trade facilitation indicators (time to export, cost to export, the number of documents required to export), exports-related distance to frontier indicators [time to export (dtf), cost to export (dtf), the number of documents required to export (dtf)] and the PCA indices of these indicators (borderx_dtf_pca_o and borderx_dtf_pca_o) in Table 6.
With regard to coefficients of variables of interest and their economic interpretation, the results clearly suggest that trade facilitation at the country of origin of export in Africa has economically and statistically significant positive effect on exports within the region. This outcome is clearly evident when we consider the results related to the PCA indices in all tables. In terms of magnitude for these PCA indices, the coefficient of the border and transport efficiency (distance to frontier) indicator indicates that a one-point scale improvement in border and transport efficiency (distance to frontier) by an African exporting country leads to a 13.3% (10.4%) increase in export flows with an African importing country.
It is important to note that among the trade facilitation and the distance to frontier indicators, the reduction in export costs has the most pronounced positive effect on exports. In terms of magnitude, the coefficient of the border and transport efficiency (distance to frontier) indicator indicates that a one-point scale reduction in export costs by an African exporting country leads to a 16.7% (6.4%) increase in export flows with an African importing country. This positive effect of export flows also extends similarly to the other border and transport efficiency (distance to frontier) indicators: in that, a reduction in the time and the number of documents required to export also positively influence trade flows between the exporting and importing countries though this outcome is not statistically significant in some cases.
In contrast to the positive effect of border and transport efficiency (distance to frontier) at the border of the exporting country, our results (see columns 5–8 of Tables 4 and 5) show that improving border and transport efficiency (distance to frontier) at the border of the importing countries does not necessarily increase export from the country of origin to the destination country. This result may be justified as most African countries are more focused on trade facilitation that promote exports rather than imports as evidenced by the several exports promotion and regional integration strategies aimed at increasing exports of these countries.
Our results therefore show that promoting trade facilitation at the border of the exporting country in Africa will be beneficial for countries to gain the full benefits of trade reforms aimed at facilitating intra-African trade. There is therefore the urgent call for African countries to intensify their trade facilitation strategies in exports promotion policies in export-oriented countries rather than in import-dependent ones to reap the potential benefits of trade facilitation. Obviously, and as the outcome of this study suggests, African countries in their quest to facilitate trade should focus more on reducing export costs at country of origin rather than destination ones. All in all, the conclusion obtained on the effect of trade facilitation on trade flows in Africa is that improvement in trade facilitation is crucial for trade flows in Africa.
Turning to the control variables in the gravity model, the coefficients are within plausible range of standard gravity model estimates. The trade elasticity of GDP indicates a positive and significant GDP effect on trade for a both exporting and importing countries comparable to those reported by Sandberg et al. (2006). Similarly, the population variables are positive, though not significant at conventional levels of statistical significance. The political and conflict variables show significant effects. For democratization, Yu (2010) argues that highly democratic countries would have better developed institutions, stronger protection of intellectual property and higher consumer protection rights that would translate into high-quality and competitive products which are favorable for exports. By contrast, our results from the Polity IV index indicate that democratization in the exporting country may increase trade costs, thereby reducing bilateral export. One plausible reason could be that the cost of democratization is expensive for countries in the continent, and as earlier argued, because international trade taxes are a major source of revenue for most governments in Africa, as these countries become more democratic, they charge higher export tariffs that discourage exports. Finally, we find that conflict in an exporting country has an adverse effect on its export supply potentials, as to be expected.
5. CONCLUSION
This paper has examined the effect of trade facilitation on trade performance in Africa within the framework of the gravity model. Annual data covering the period 2006–2015 for a sample of 52 African countries was used. Several trade facilitation indicators, namely, time to export, cost to export, number of documents to export, time to import, cost to import, number of documents required to import, their corresponding distance to frontier indicators and other composite indices created from these indicators using PCA are used. The results suggest that improvements in trade facilitation boost trade performance in Africa, and the better the extent of trade facilitation, the larger the impact of trade flow from an origin country to a destination. With reference to the three trade facilitation variables used and their associated distance to frontier indicators, it is observed that reductions in the real cost to export and import across borders remain the key drivers of the performance of intra-African trade. With regard to the control variables considered in the gravity model, we find that GDP, political democracy and conflicts have significant effects on trade performance in Africa, whereas population does not.
Based on the findings, it would be prudent for policy makers to aim at policies that would substantially improve trade facilitation in Africa. This is important because of the low levels of trade facilitation indicators in the region when compared with other regions of the world. Policies should focus more on reducing the real costs of trading across borders in Africa.
We note certain limitations of the study, especially the fact that we did not use disaggregated trade data and also our trade data cover only recent bilateral trade flows. Thus, we recommend that further research could focus on using a long time span to examine how trade facilitation can affect intra-African trade at a more disaggregated level as well as how trade facilitation affects extensive and intensive margins of intra-African trade. In doing so, tariff data could be used to put the results of the relationship between trade facilitation and trade performance into perspective by computing the tariff equivalence (or distance equivalence) of trade facilitation initiatives.
CONFLICTS OF INTEREST
The authors declare that they have no conflicts of interest.
AUTHORS’ CONTRIBUTION
The authors contributed equally to the article.
FUNDING
This work was supported by
ACKNOWLEDGMENTS
Earlier versions of this paper were presented at the African Review of Economics and Finance Conference held at Ghana Institute of Management and Public Administration (GIMPA), Accra, Ghana on August 30–31, 2017, Western Economics Association International’s 93rd Conference held at Vancouver, British Columbia, Canada on June 26–30, 2018, and AGRODEP Workshop on African Continental Free Trade Area (AfCFTA) held at IFPRI–Dakar Office, Dakar, Senegal, 12–16 November, 2018. Authors thank participants of these conferences and workshop, anonymous reviewers and the editor of this journal Augustin Fosu, for the helpful comments and suggestions. All remaining errors are those of the authors.
APPENDIX
| Country | Distance to frontier | Δ | Documents to export (number) | Δ | Time to export (days) | Δ | Cost to export (US$) | Δ | Documents to import (number) | Δ | Time to import (days) | Δ | Cost to export (US$) | Δ |
|---|---|---|---|---|---|---|---|---|---|---|---|---|---|---|
| Algeria | 5622 | −25.46 | 8.239 | −1 | 16.66 | 2 | 1320.224 | −336 | 929 | 0 | 24.314 | 4 | 1408.217 | −446 |
| Angola | 26.4643 | 5.46 | 9.646 | 0 | 55.350 | −24 | 193236 | 410 | 8.225 | 1 | 5242 | −15 | 254136 | 775 |
| Benin | 55.6723 | −9.74 | 7.830 | −1 | 30.431 | −9 | 1043.611 | 65 | 8.727 | −2 | 32.927 | −13 | 1401.116 | 265 |
| Botswana | 49.4230 | 47.18 | 67 | 0 | 29.730 | −6 | 2595.243 | 1057 | 6.79 | −1 | 40.132 | −8 | 3168.841 | 1115 |
| Burkina Faso | 28.7239 | 47.01 | 10.550 | −1 | 42.642 | −4 | 2319.841 | 79 | 12.549 | −1 | 50.841 | −5 | 4057.645 | 508 |
| Burundi | 21.5547 | 34.84 | 942 | 0 | 40.140 | −15 | 2614.244 | 618 | 9.834 | −1 | 59.345 | −28 | 420746 | 385 |
| Cabo Verde | 69.96 | −3.66 | 714 | 0 | 19.911 | −2 | 1084.713 | 51 | 713 | 0 | 19.36 | −2 | 943.58 | −145 |
| Cameroon | 46.7633 | −35.89 | 10.149 | 2 | 24.620 | −4 | 1236.122 | 347 | 11.341 | 2 | 28.416 | −8 | 2184.134 | 249 |
| CAR | 11.8652 | 50.91 | 8.641 | 1 | 53.649 | −11 | 5180.851 | 909 | 1752 | 0 | 63.548 | 2 | 5350.251 | 1801 |
| Chad | 16.1451 | 26.3 | 7.224 | 1 | 75.552 | −8 | 5640.152 | 1748 | 10.239 | 1 | 99.952 | −12 | 733352 | 3310 |
| Comoros | 59.1719 | 8.52 | 942 | 0 | 3132 | 0 | 1202.818 | 190 | 821 | 0 | 2413 | 0 | 1197.312 | 187 |
| Democratic Republic of the Congo | 19.5348 | −16.62 | 714 | 0 | 44.843 | −2 | 293745 | 768 | 9.935 | 1 | 64.249 | −3 | 351944 | 1602 |
| Republic of the Congo | 18.7449 | 1.56 | 1152 | 0 | 5045 | 0 | 3062.747 | 1594 | 1036 | 0 | 60.446 | −8 | 5082.850 | 5389 |
| Cote d’Ivoire | 44.7534 | 8.33 | 942 | 0 | 24.219 | 2 | 1632.730 | −104 | 1350 | 0 | 3829 | −11 | 2176.933 | −147 |
| Djibouti | 68.97 | 1.11 | 7.123 | −9 | 22.114 | −7 | 863.69 | 79 | 6.79 | −8 | 19.47 | −8 | 880.67 | 79 |
| Egypt | 62.8513 | 2.68 | 832 | 0 | 154 | −15 | 731.74 | −389 | 10.138 | −1 | 19.25 | −17 | 860.36 | −316 |
| Equatorial Guinea | 52.3527 | −13.13 | 714 | 0 | 29.229 | 0 | 1402.325 | −13 | 63 | 0 | 43.637 | 2 | 1624.924 | −31 |
| Eritrea | 17.4950 | −6 | 1047 | 0 | 52.747 | −9 | 1799.732 | 129 | 1246 | 0 | 62.247 | −10 | 1986.729 | 19 |
| Ethiopia | 26.842 | 22.56 | 832 | 0 | 45.944 | −3 | 2181.840 | 343 | 1140 | 0 | 42.836 | 3 | 272939 | 170 |
| Gabon | 61.6814 | −18.15 | 5.75 | 1 | 19.710 | 1 | 1844.534 | 635 | 7.718 | 1 | 2211 | 0 | 1902.528 | 675 |
| Gambia | 71.835 | −4.12 | 67 | 0 | 20.812 | −4 | 1074.112 | −159 | 63 | 0 | 219 | −4 | 770.63 | −114 |
| Ghana | 56.221 | 13.51 | 67 | 0 | 2213 | −28 | 7766 | 251 | 713 | 0 | 42.335 | −22 | 1146.511 | 518 |
| Guinea | 52.328 | 4.92 | 714 | 0 | 3536 | 2 | 8568 | 185 | 821 | 0 | 31.826 | −1 | 142218 | 195 |
| Guinea-Bissau | 64.4210 | −11.69 | 67 | 0 | 25.823 | −2 | 1476.227 | 3 | 63 | 0 | 22.812 | −2 | 2031.832 | 257 |
| Kenya | 47.5932 | 44.62 | 7.931 | 1 | 28.928 | −19 | 2087.539 | 275 | 9.532 | −5 | 31.324 | −36 | 2212.535 | 25 |
| Lesotho | 53.9525 | 47.12 | 7.728 | −1 | 37.537 | −13 | 1520.728 | 607 | 7.718 | −1 | 41.634 | −16 | 162725 | 835 |
| Liberia | 47.7431 | −29.72 | 1047 | 0 | 17.48 | −5 | 1267.223 | 188 | 1246 | 0 | 30.420 | −3 | 1273.214 | 168 |
| Libya | 60.6116 | 4.67 | 714 | 0 | 2317 | 0 | 114015 | 0 | 929 | 0 | 3728 | 0 | 125513 | 0 |
| Madagascar | 56.9220 | 25.63 | 5.86 | −4 | 28.327 | −27 | 1208.519 | 13 | 9.532 | −2 | 30.721 | −27 | 1494.123 | 273 |
| Malawi | 26.2244 | 51.84 | 10.751 | 0 | 40.541 | −11 | 1824.133 | 577 | 11.442 | 1 | 48.239 | −15 | 264737 | 395 |
| Mali | 43.2535 | 39.83 | 6.412 | −1 | 33.233 | −18 | 2082.938 | 688 | 11.442 | −1 | 46.838 | −35 | 3373.842 | 1665 |
| Mauritania | 52.4226 | 4.09 | 832 | 0 | 34.335 | −9 | 159229 | 160 | 821 | 0 | 39.231 | −2 | 147522 | 160 |
| Mauritius | 84.81 | −3.76 | 41 | 0 | 11.51 | −3 | 7043 | −8 | 5.22 | −1 | 10.31 | −3 | 689.82 | 27 |
| Morocco | 78.752 | 9.24 | 5.24 | −2 | 12.92 | −7 | 570.61 | 18 | 6.38 | −1 | 18.43 | −15 | 10649 | −530 |
| Mozambique | 59.8317 | 12.35 | 714 | 0 | 24.921 | −7 | 1086.514 | 45 | 929 | 0 | 3018 | −11 | 142719 | 415 |
| Namibia | 63.6511 | −0.21 | 832 | 0 | 2418 | 0 | 1667.531 | 111 | 713 | 0 | 208 | 0 | 1760.927 | 255 |
| Niger | 26.0145 | 39.18 | 832 | 0 | 58.551 | −3 | 3402.549 | 1732 | 1036 | 0 | 64.950 | −5 | 3466.943 | 1554 |
| Nigeria | 37.9336 | 1.38 | 9.145 | −1 | 26.0824 | −18.1 | 1232.621 | 766 | 13.451 | −4 | 41.2833 | −19.1 | 1463.921 | 499.5 |
| Rwanda | 36.4237 | 72.15 | 8.540 | −6 | 39.239 | −34 | 334948 | −595 | 11.845 | −12 | 48.940 | −68 | 478249 | 990 |
| São Tomé and Príncipe | 63.6112 | 5.66 | 832 | 0 | 26.625 | −1 | 6902 | 0 | 63 | 0 | 28.617 | −1 | 5771 | 0 |
| Senegal | 65.39 | 10.85 | 7.527 | −5 | 154 | −9 | 1144.416 | 267 | 7.820 | −6 | 18.94 | −13 | 199230 | 20 |
| Seychelles | 76.14 | −1.08 | 53 | 0 | 16.66 | −1 | 841.87 | −171 | 51 | 0 | 18.12 | −2 | 835.85 | −201 |
| Sierra Leone | 54.224 | −5.79 | 7.326 | −1 | 27.226 | −6 | 1216.820 | 103 | 821 | 0 | 3123 | −6 | 1334.815 | 553 |
| South Africa | 60.9515 | −0.57 | 6.412 | −2 | 22.316 | −9 | 1445.426 | 743 | 6.79 | −1 | 30.721 | −14 | 1671.526 | 885 |
| Sudan | 27.7441 | 1.5 | 714 | 0 | 37.838 | −24 | 203737 | 760 | 713 | 0 | 54.543 | −37 | 270438 | 1430 |
| Swaziland | 59.4918 | 43 | 7.728 | −1 | 19.39 | −4 | 1911.135 | 182 | 6.79 | −1 | 27.115 | −7 | 2031.231 | 425 |
| Tanzania | 50.7529 | −21.64 | 7.224 | −2 | 22.215 | −12 | 1150.717 | 268 | 11.544 | −6 | 31.625 | −25 | 1441.720 | 698 |
| Togo | 65.348 | 2.48 | 6.211 | −2 | 2522 | −10 | 893.710 | 552 | 7.317 | −3 | 30.119 | −14 | 1084.610 | 349 |
| Tunisia | 78.583 | −12.59 | 41 | 0 | 14.33 | 0 | 744.55 | 45 | 63 | 0 | 21.210 | −9 | 8074 | 310 |
| Uganda | 34.4838 | 40.42 | 832 | −5 | 33.634 | −10 | 256342 | 1750 | 1246 | −10 | 38.630 | −33 | 314840 | 430 |
| Zambia | 24.4146 | 46.16 | 714 | 0 | 5246 | −2 | 3445.950 | 3067 | 8.526 | −1 | 56.644 | −6 | 472048 | 4220 |
| Zimbabwe | 28.240 | 37.8 | 714 | 0 | 52.747 | 1 | 2946.546 | 2386 | 8.727 | −1 | 70.851 | 4 | 4358.247 | 3740 |
| Total | 48.55 | 7.55 | 31.37 | 1780.27 | 8.93 | 38.1 | 2243.14 |
Note: Superscripts are rankings of countries for the indicators used. Δ refers to change over the sample period. CAR, Central African Republic. Source: Authors’ computations.
Average border and transport efficiency indicators (2006–2015), by country
| 1 | Algeria | 19 | Ethiopia | 37 | Niger |
| 2 | Angola | 20 | Gabon | 38 | Nigeria |
| 3 | Benin | 21 | Gambia | 39 | Rwanda |
| 4 | Botswana | 22 | Ghana | 40 | São Tomé and Príncipe |
| 5 | Burkina Faso | 23 | Guinea | 41 | Senegal |
| 6 | Burundi | 24 | Guinea-Bissau | 42 | Seychelles |
| 7 | Cabo Verde | 25 | Kenya | 43 | Sierra Leone |
| 8 | Cameroon | 26 | Lesotho | 44 | South Africa |
| 9 | Central African Republic | 27 | Liberia | 45 | Sudan |
| 10 | Chad | 28 | Libya | 46 | Swaziland |
| 11 | Comoros | 29 | Madagascar | 47 | Tanzania |
| 12 | Democratic Republic of the Congo | 30 | Malawi | 48 | Togo |
| 13 | Republic of the Congo | 31 | Mali | 49 | Tunisia |
| 14 | Cote d’Ivoire | 32 | Mauritania | 50 | Uganda |
| 15 | Djibouti | 33 | Mauritius | 51 | Zambia |
| 16 | Egypt | 34 | Morocco | 52 | Zimbabwe |
| 17 | Equatorial Guinea | 35 | Mozambique | ||
| 18 | Eritrea | 36 | Namibia |
List of African countries included in our empirical analysis
Footnotes
Afesorgbor (2018) argued that intraregional trade is still low among African countries even in the face of increased number of Regional Trade Agreements (RTAs) mainly because of the lack of effective trade facilitation.
The agreement was adopted by WTO members at the 9th Ministerial Conference in Bali, 3–6 December 2013, and entered into force on 22 February 2017.
The distance to frontier measure is also an important one to identify the gap between Africa and best regulatory practices globally.
Taxes on international trade include import duties, export duties, profits of export or import monopolies, exchange profits and exchange taxes.
Seck (2017) acknowledged the limitation of not capturing the heterogeneity associated with trade flows and trade facilitation measures by the use of only two sample years.
We could only select these groups of countries for this part of the analysis due to data availability.
UNECA (2013) provided a comprehensive analysis of the performance of African countries for these indicators (https://www.uneca.org/sites/default/files/PublicationFiles/trade_facilitation_eng.pdf).
Freund and Rocha (2011), for example, noted that trade facilitation which helps in reducing the long delays in transporting export goods from the factory gate to harbours for shipping would boost Africa export performance significantly.
The liberalization process, which began in the mid-1980s to late 1980s through the 1990s, was characterized by massive dismantling of tariff and nontariff barriers, devaluation of overvalued African currencies, and removal of controls on exchange rates.
The list of countries included in our empirical analysis is reported in Table A2 of Appendix.
A distance to frontier score of 60 for a country, for instance, implies this country is 40% away from the best performer.
Our data set has no zero flows. We rather have missing values which we chose to treat as missing observations rather than zero flows. For this reason, there was no need to use the Poisson pseudo maximum likelihood estimator.
The PCA is a straightforward approach for creating new indexes which are linear composites of the original ones. To ensure that higher values of trade facilitation indicators represent better outcomes, we rescaled all the six trade facilitation indicators to range from 0 to 10 by the use of the min–max transformation. This transformation is not only important for the PCA, but it also facilitates comparison of the trade facilitation indicators with the other variables used in the paper.
REFERENCES
Cite this article
TY  - JOUR
AU  - Daniel Sakyi
AU  - Sylvanus Kwaku Afesorgbor
PY  - 2019
DA  - 2019/12/17
TI  - The Effects of Trade Facilitation on Trade Performance in Africa
JO  - Journal of African Trade
SP  - 1
EP  - 15
VL  - 6
IS  - 1-2
SN  - 2214-8523
UR  - https://doi.org/10.2991/jat.k.191129.001
DO  - 10.2991/jat.k.191129.001
ID  - Sakyi2019
ER  -