
How Do Trade Margins Respond to Exchange Rate? The Case of Egypt✩
Egyptian Center for Economic Studies
Marburg University
The authors are grateful to Fida Karam, Diaa Noureldin, the editor and two anonymous referees for their useful and constructive comments.
- DOI
- 10.2991/jat.k.190528.001How to use a DOI?
- Keywords
- Exports; exchange rate policy; Egypt
- Abstract
This paper examines the effect of the exchange rate devaluation on the quantity and value of exports (intensive margin of trade), as well as the ability to export new products and/or venture into new export markets (extensive margin of trade). Using monthly firm-level and sector-level data for the period 2005–2016, the study is applied to Egypt, which appears to be an interesting case to investigate considering several changes that have occurred in its exchange rate regime. The exchange rate is measured by the real effective exchange rate and exchange rate misalignment. The results of the intensive margin show that a depreciation of the real exchange rate (RER) increases the value of exports without affecting the quantity of exports, highlighting the fact that the price effect is more significant than the quantity effect: depreciation lowers the foreign currency price of exports, but does not increase the quantity of exports. The response of the extensive margin shows that both the number of destinations and the number of products respond positively to the exchange rate depreciation. At the sectoral level, the intensive margin seems to matter for some products more than others. Indeed, the most beneficial products are those that are sensitive to RER depreciations and for which Egypt has a comparative advantage, such as fruits and vegetables, apparel and clothing, fibers, mineral fuels and oils, and some chemical products. At the destination level, European countries seem to be the most sensitive.
- Copyright
- © 2019 African Export-Import Bank. Publishing services by Atlantis Press International B.V.
- Open Access
- This is an open access article distributed under the CC BY-NC 4.0 license (http://creativecommons.org/licenses/by-nc/4.0/).
1. INTRODUCTION
The trade literature provides evidence of the robust correlation between the growth of exports growth and Real Exchange Rate (RER) depreciation, especially in developing and emerging countries (Aghion et al., 2009). A depreciated currency makes exports cheaper to foreigners, and thus increases their demand for exports. Therefore, both the quantity and the value of exports are likely to be affected by exchange rate developments. In addition, exchange rate misalignment is likely to affect export performance: RER depreciation/undervaluation is likely to generate a potential comparative advantage in new and more sophisticated exportable goods and services. Indeed, countries that have managed to engineer an undervalued RER (e.g., China, the Republic of Korea, and Chile) appear to have indirectly overcome institutional constraints during the early phases of their development process (Rodrik, 2008; Elbadawi and Kaltani, 2016).
The literature on exchange rate and exports is abundant and inconclusive. At the macroeconomic level, while several studies have endorsed a favorable relationship between exchange rate devaluations and export performance (Genc and Artar, 2014; Bahmani-Oskooee and Ardalani, 2006), others have pointed to the limited changes in export performance following exchange rate movements in some economies (Rowbotham et al., 2014; Loto, 2011). Across Middle East and North African (MENA) countries, studies tend to rely mainly on aggregate data rather than firm-level data (El-Ramly, 2008; Bahmani-Oskooe and Kandil, 2009; Nouira et al., 2011; Bahmani-Oskooee et al., 2015a). At the firm level, some studies were carried out in respect to Latin America [Chen and Juvenal (2016) for Argentina, Campos (2010) for Brazil, and Eaton et al. (2007) for Colombia], Asia [Li et al. (2015) for China, Cheung and Sengupta (2013) for India], and Europe [Amiti et al. (2014) for Belgium, Berman et al. (2012) for France, Campa (2004) for Spain]. However, no such studies were conducted for either African or Arab economies.
The case of Egypt is relevant to study the effect of exchange rate developments on exports. In the aftermath of the January 25, 2011 revolution, Egypt’s external accounts became more fragile. With lower tourism receipts, Foreign Direct Investment (FDI) outflows, and less exports, international reserves declined from US$36 billion in December 2010 to US$26.4 billion in June 2011, US$15.5 billion in June 2012, and US$15.4 billion in January 2015 (equivalent to 2.8 months of imports). This evolution reflects the efforts of the Central Bank of Egypt (CBE) to defend the Egyptian pound, which lost only 4% of its value against the dollar between January 2011 and December 2012. Moreover, in December 2012, the CBE introduced a new system for buying and selling foreign currency. The system features regular currency auctions, designed to allow the Egyptian pound to float more freely, with its price more closely reflecting supply and demand. The objective was to conserve foreign reserves that reached a critical level. Following these auctions, the Egyptian pound plummeted to an 8-year low against the US dollar, reaching EGP6.70/US$1 in March 2013. It experienced a further depreciation in early 2015, when the CBE announced that the value of the dollar was EGP7.61, with a level of foreign reserves of US$15.4 billion, and was expected to reach EGP8.95 in March 2016. In late November 2016, the CBE announced the floatation of the Egyptian pound, the value of which fell by around 45% and settled at EGP13.00 against the US dollar following the decision, and at EGP18.00 soon after. The objective was to increase the availability of foreign exchange for households and businesses, strengthen competitiveness and exports, and attract FDI.
This study has three main contributions. First, in order to capture the short-term dynamics of the exchange rate, we use monthly firm-level data combined with different measures of exchange rate and misalignment. Second, we examine the impact of both devaluation and exchange rate misalignment on the intensive (the quantity and value of exports) and the extensive (the probability of exporting a new product to a new destination, exporting a new product to an existing destination, or exporting an existing product to a new destination) margins. Third, we apply this study to the Egyptian economy because to our knowledge, no previous studies have investigated Africa or the MENA region, and Egypt has experienced several changes in its exchange rate regime. Therefore, it is interesting to examine the effect of such a depreciation on the export performance of Egyptian firms.
Our main findings show that a RER depreciation increases the value of exports without affecting the quantity of exports, highlighting the fact that the price effect is more significant than the quantity effect in investigating the intensive margin of trade. In other words, currency depreciation lowers the foreign currency price of exports, but does not increase the quantity of exports. Furthermore, both measures of the extensive margin of trade (i.e., the number of destinations and the number of products) respond positively to the exchange rate depreciation. At the sectoral level, the intensive margin seems to matter for some products more than others. Indeed, the most beneficial products are those that are sensitive to RER depreciations and for which Egypt has a comparative advantage, such as fruits and vegetables, apparel and clothing, fibers, mineral fuels and oils, and some chemical products. At the destination level, European countries seem to be the most sensitive.
The remainder of the paper is organized as follows: Section 2 reviews the available literature on this topic. Section 3 presents some stylized facts. Section 4 is dedicated to the methodology. Section 5 presents the empirical findings for the intensive and the extensive margins of trade. Section 6 presents the conclusion.
2. LITERATURE REVIEW
Our study examines the effect of currency depreciation on trade margins using a unique set of micro data. The majority of the existing studies, especially in the MENA region, use aggregate data, while studies focusing on micro data are mostly devoted to developed countries. In this section, we particularly investigate how the literature debated the impact of exchange rate movements on export performance at both the aggregate and firm levels.
2.1. Macroeconomic Studies
Exchange rate movements are usually claimed to have substantial effects on export volumes. According to a recent International Monetary Fund (IMF) study (2015), based on annual data for 60 economies from 1980 to 2014, a 10% real effective depreciation in an economy’s currency is associated with an average rise in real net exports of 1.5% of GDP. Although a number of studies (e.g., Genc and Artar, 2014; Bahmani-Oskooee and Ardalani, 2006) have endorsed a favorable relationship between exchange rate devaluations and export performance, other studies have pointed to the limited changes in export performance following exchange rate movements in some economies. Rowbotham et al. (2014) examined this relationship for a sample of nine efficiency-driven economies, all of which had floating exchange rate regimes, for the period 1990–2009. Using panel data models and fixed effects, their results showed that a weaker exchange rate does not necessarily improve export performance. On the contrary, export growth seems to be associated with stronger exchange rates. Previous findings from Loto (2011) suggested that a devaluation/depreciation can only benefit countries that are originally export-based before the movement of the currency, and that economies that are import-dependent can hardly benefit from these currency movements. Another prominent example that corroborates the insignificant influence of exchange rate depreciation on exports is the case of Japan. The Japanese yen experienced a prolonged depreciation between the periods 1988–1990 and 1995–1997. Klitgaard (1999) examined how Japanese firms, in four industries that accounted for approximately 75% of Japanese exports in 1997, respond to the conflicting objectives of maintaining stable profit margins and stable export sales when the value of the yen fluctuates. The author showed that Japanese exporters respond in the same manner regardless of the yen’s direction. He argued that Japanese exporters absorb part of the yen’s movement into their profit margins, an action that reduces the profit on each item sold when the yen appreciates and raises the profit margin when the yen depreciates. Although firms’ foreign consumers indeed observe exchange-rate-driven changes in prices, Japanese firms moderate the extent of these changes by altering their profit margins. Firms seek to stabilize prices as seen by their customers in both foreign and domestic markets, which means that their relative profit margins rise and fall with the yen.
A number of studies in the international trade literature have also focused on the importance of both the intensive and extensive margins to model export behavior across countries. Focusing on geographical diversification, Besedes and Prusa (2011), investigated and compared countries’ export growth based on their performance at the extensive margin (defined as establishing new partners and markets) and the intensive margin (having relationships that survive or persist, and deepening existing relationships. Using disaggregated bilateral manufacturing exports of 46 countries between 1975 and 2003 while focusing primarily on developing countries including Latin America, Africa, and East Asia, they suggest that across countries, developed countries and more successful developing countries have higher survival and greater deepening (intensive margin). On the other hand, developing countries are able to form new export relationships and find new markets, but are much less successful in maintaining those relationships. A similar conclusion was reached by Cadot et al. (2011), who explored the relationship between export diversification and income level among 159 countries over 17 years at the HS6 level of disaggregation using various export concentration indices. They argue that low- and middle-income countries diversify mostly along the extensive margin through the addition of new product lines, whereas high income countries diversify along the intensive margin and ultimately re-concentrate their exports toward fewer products. Cooke (2014) recently linked countries’ trade margins of exports to their real exchange rates by developing a two-country Dynamic General Equilibrium model. His results proposed that a favorable movement in the RER increases export participation and expands its extensive margin of exports. Likewise, Colacelli (2010), who empirically studied the behavior of the intensive margin (the volume of exports) and the extensive margin (new exporters) among a sample of 136 countries, found that the extensive margin of trade has a significant role in overall yearly export responses to RER fluctuations.
Across MENA economies, studies tend to rely mainly on aggregate data rather than firm-level data. Following the devaluation of the Egyptian pound in 2003, a considerable amount of literature focused on assessing its impact on Egyptian output, suggesting that the positive effect of devaluation on output starts to materialize only in the long-run (El-Ramly, 2008; Bahmani-Oskooe and Kandil, 2009). Several studies pointed to the significant impact of currency misalignment on export performance. For instance, Brixiova et al. (2014) examined whether the RER misalignment contributed to the weak export competitiveness of Egypt, Morocco, and Tunisia from 1980 to 2009. The authors argued that the relative flexibility of the exchange rate system rate in Morocco and Tunisia resulted in a depreciating trend for the Real Effective Exchange Rate (REER) that reinforced the price competitiveness of exports, unlike Egypt, which experienced protracted periods of misalignment both in the past and in recent years. Consistent with the aforementioned results, Nouira et al. (2011) suggested that over the period 1990–2005, Morocco and Tunisia, who opted for the proactive exchange rate strategy consisting of deliberate RER depreciation, were performing much better in terms of export diversification than Egypt and Jordan where the exchange rate strategy was not proactive. Similarly, Nabli and Véganzonès-Varoudakis (2002) investigated the impact of currency overvaluation on the competitiveness of manufactured exports for a panel of 53 countries, ten of which are MENA economies, for the 70s, 80s, and 90s. They showed that during the three decades, MENA countries experienced substantial RER misalignment with a net tendency to overvaluation of their RER that negatively affected manufactured exports. Few studies have addressed the relationship between exchange rate risk and Egypt’s trade. Bahmani-Oskooee et al. (2015a) examined the effect of the exchange rate risk on Egypt’s trade with the European Union by applying co-integration analysis to data for the period 1994Q1 to 2007Q4 for 59 industries. The authors found that relatively few trade flows responded to increased risk in the short-run. However, in the long-run, a large proportion (i.e., 24 of 59 import industries and 28 of 59 export industries) experienced trade flow reductions due to the increased exchange rate risk, particularly oil and gas as well as large industries. Therefore, the authors recommended the need for quick responses to stabilize the Egyptian pound in relation to the Euro. However, Bahmani-Oskooee et al. (2015b) examined the effect of the exchange rate risk on Egypt’s trade with the United States. They found evidence of positive long-run relationships, with exports increasing due to higher risk in a large proportion of cases, and concluded that neither oil exports nor exports of other types of products stand to benefit from a stable pound.
2.2. Firm-level Studies
Until the mid-2000s, most of the trade literature considered the impact of exchange rate changes on aggregate imports and exports. Thereafter, progress has been made in collecting information on the firm-level (Berthou and Fontagné, 2013). The focus on firms rather than aggregate variables has widened the scope of the literature to understand firms’ reactions to exchange rate movements and further explain the aggregate level results. These response variations could be in the form of a change in the prices of the traded goods, the trade volume of goods, the destination country, the variety of goods that are traded, or the likelihood of introducing new exporters to the market.
Speaking of the prices of traded goods, firms’ heterogeneity has contributed to clarifying the aggregate pass-through in different countries. Chen and Juvenal (2016) recently investigated, theoretically and empirically, the effects of RER changes on the pricing response of Argentinean firms exporting multiple products with heterogeneous levels of quality. The model predicts more pricing-to-market (markup adjustment) following a real depreciation for higher quality goods. These theoretical predictions were strongly supported by empirical testing using a combination of a firm-level data set of wine export values and volumes between 2002 and 2009, and a data set of experts’ wine ratings to measure the quality. Li et al. (2015) provided evidence on Chinese exporters’ reactions to Renminbi movements from 2000 to 2007. Their study suggested that price responses to exchange rate changes were very small. Amiti et al. (2014) similarly suggested a low aggregate pass-through for Belgian exporters, especially for large exporters who tend to have lower pass-through. Amiti et al. (2014) explained that the low pass-through for larger firms occurs due to two main reasons: The first is that large exporters happen to be import intensive firms, and in addition, they also offset almost half of the exchange rate movement by active markup adjustment, which eventually justifies the low aggregate pass-through. On the other hand, small non-importing firms barely adjust their producer prices and fully pass on the exchange rate movements to foreign consumers. Likewise, Berman et al. (2012), using French firm-level data, suggested that firm heterogeneity can help to explain the low aggregate elasticity of exports to exchange rate movements in industrialized countries: High-productivity firms (usually larger firms) choose to partially absorb exchange rate fluctuations by increasing their markups, leading to a relatively muted response of aggregate exports to exchange rates. These results were again corroborated by Cheung and Sengupta (2013) who used detailed firm-level data from a sample of Indian non-financial firms to empirically investigate the REER effect on firms’ export behavior for the period 2000–2010. Their empirical analysis revealed that Indian firms that have smaller export shares tend to have a stronger negative response to both REER change and volatility. Besides, firms that export services are more vulnerable to exchange rate fluctuations compared with those that export goods. Earlier findings from Campos (2010) suggested that new and incumbent Brazilian firms, who happen to have lower productivity, tend to charge higher prices, which is consistent with most of the firm-level literature discussed above. While the majority of the literature linked the price adjustment to firm size/productivity, Chatterjee et al. (2013) explained that firms in Brazil raise their markups for all products in response to a RER depreciation, although the increase in producer prices is stronger for products closer to the core products (i.e., products that the firm is most efficient at producing).
The quantity of traded exports was found to have a moderate response to currency devaluation, according to Chen and Juvenal (2016) and Li et al. (2015) who found a smaller response of export volumes to an exchange rate depreciation.
In respect to the extensive and intensive margins, Li et al. (2015) found that Renminbi appreciation reduces both the extensive margin (the probability that a firm exports to a new market) and the intensive margin (the probability that a firm survives in the existing market), namely, a 10% appreciation reduces the probability of new entry by 0.6% and the probability of continuing in the export market by 1.1%. These results are consistent with those of Tang and Zhan (2012) who found that, over the same period, a 10% real appreciation of the Renminbi is associated with a 1% point decline in the probability of entry, and a 0.2% point increase in the probability of exit. Moreover, a RER appreciation of the Chinese currency also lowers the firm’s likelihood of introducing a new product to a market, and raises its likelihood of dropping a product, which resembles the findings of Chatterjee et al. (2013) in Brazil, which suggested that in response to a RER depreciation, firms increase their product range.
According to Berman et al. (2012), exchange rate depreciation tends to have a positive impact on export probability. A 10% depreciation increases the probability of exporting by around 1.8% points. The effect is significant on both the extensive margin (i.e., the entry probability) which increases by around 1.4% points, and on the intensive margin (i.e., the probability of remaining an exporter) which increases by a range of between 1.3% and 2.1% points. These results are more or less identical to some preliminary work carried out in 2004 by Jose Campa (2004) who, similar to the former studies, broke down export adjustments between changes in output levels by existing exporters (intensive margin) and movements due to changes in the number of exporters (extensive margin), using data related to a sample of Spanish manufacturing firms. Campa (2004) endorsed the positive significance of exchange rate depreciation for both the extensive and intensive margins, although his findings suggested that most of the change in export volume is not due to changes in the number of exporters but to the intensive margin. Conversely, Eaton et al. (2007), who used Colombian firm data for the period 1996–2005 to track firms’ entry and exit into and out of certain destination markets, suggested that, in a typical year, nearly half of all Colombian exporters tend to be extremely small exporters who were not exporters in the previous year, and most do not continue to export in the following year. However, out of each group of new exporters, a number of firms continue expanding their foreign sales very rapidly, and over the period of less than a decade, they accounted for almost half of the total export expansion. Their paper argued that these new exporters begin in a single foreign market and, if they survive, they gradually expand into additional destinations. However, the geographic expansion paths that they follow, and their likelihood of survival as exporters, depend on their initial destination market.
Against this background, it is evident that the literature is abundant and inconclusive at both the macroeconomic and firm levels. Furthermore, no firm-level studies were conducted for either African or Arab economies. This is why the case of Egypt is worthy of examination.
3. STYLIZED FACTS
3.1. A Macroeconomic Overview
Egypt’s exports have experienced modest growth after the financial crisis in 2008 and the political turmoil in 2011, increasing by 19% between 2009 and 2013. As shown in Table 1, the deterioration in Egyptian export competitiveness, which contributed to a 32% reduction in export growth, was counterbalanced by two factors: the increase in world trade (+49%) and the growth in product specialization (+8%).
| Marginal Growth due to | US$ change | % change |
|---|---|---|
| World’s trade growtha | 11,797,832.8 | 48.8 |
| Product specializationb | 1,925,387.8 | 8.0 |
| Geographic specializationc | −1,390,742.0 | −5.8 |
| Competitivenessd | −7,735,189.6 | −32.0 |
| Sum of marginal growths | 4,597,289.0 | 19.0 |
Source: International Trade Center online dataset (ITC) (2014).
This index was calculated based on growth rates of products exports at the world level.
Product specialization is measured using a Herfindahl index.
Geographic specialization is measured using a Herfindahl index.
Competitiveness is measured by the change in the exporting country’s share in destination markets’ imports multiplied by the initial share of partner countries’ imports in world trade (weighted average of the variation in the country’s position on elementary markets).
Factors behind marginal growth of Egypt’s exports (2014)
Figure 1 shows how intensive and extensive margins explain export growth in Egypt. Indeed, the export growth of 19% can be broken down as follows: 51.5% decrease in traditional markets’ exports, 70% increase in traditional products in traditional markets, 1.5% increase in new products to traditional markets, and 0.1% increase of traditional products in new markets. This shows how exports are relatively rigid since Egyptian exporters were unable to either enter new markets or export new products.
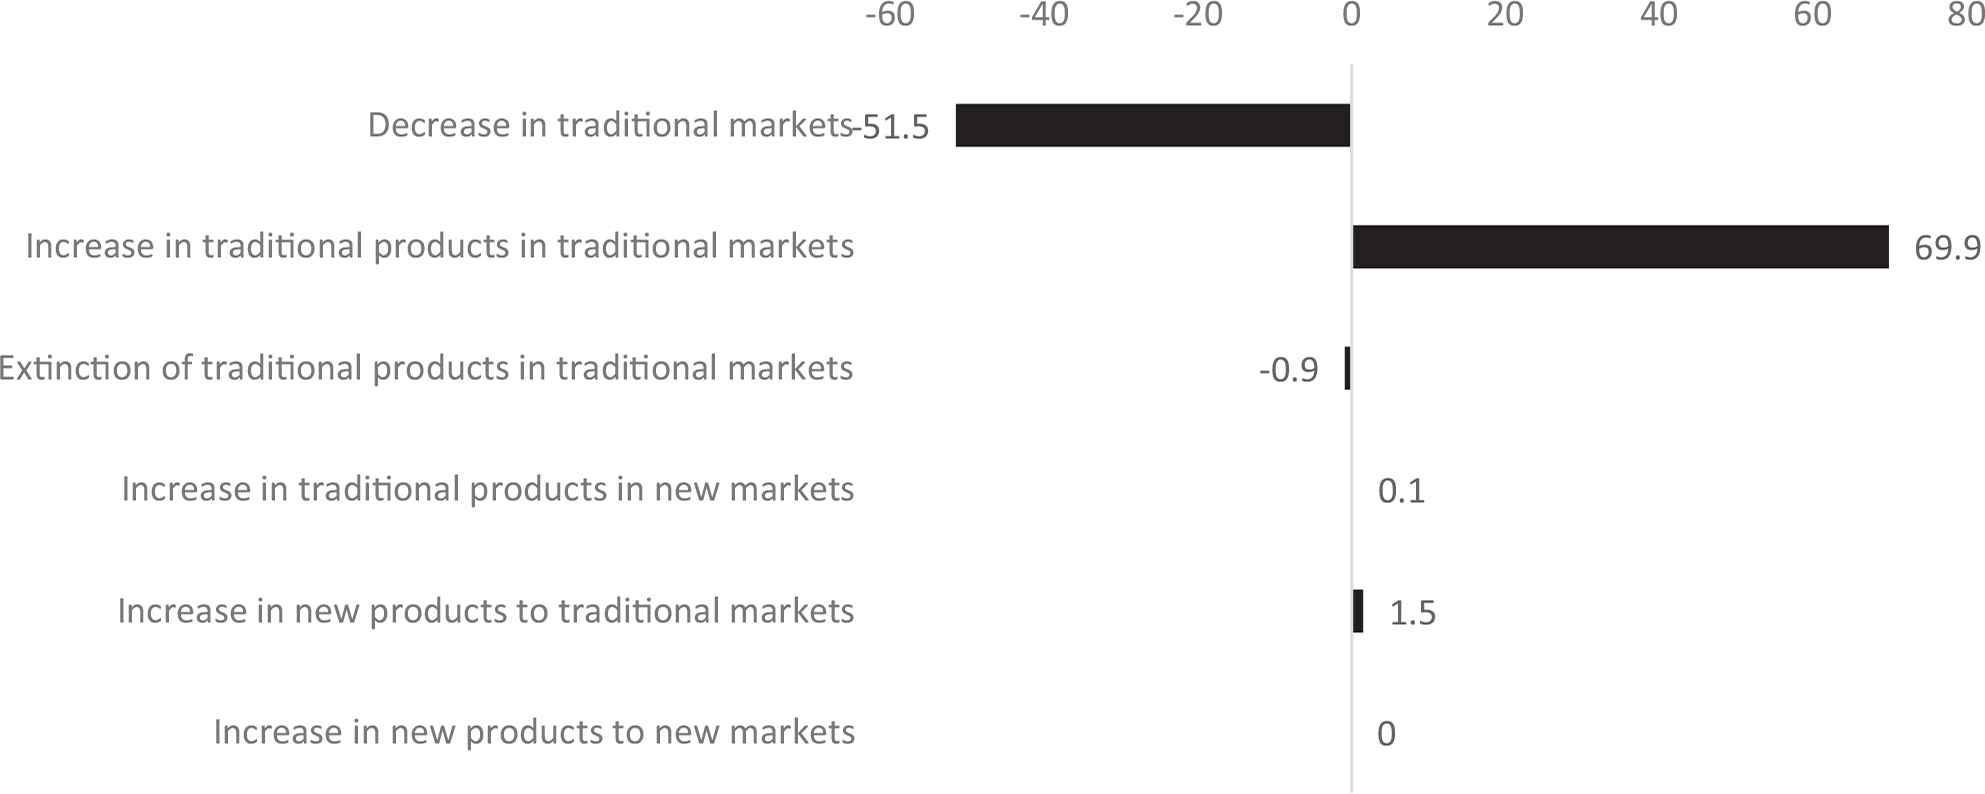
Factors behind growth of Egypt’s exports. Source: International Trade Center online dataset (ITC) (2014).
In terms of export destinations, Figure 2 shows that Organisation for Economic Co-operation and Development (OECD) economies and Arab countries mainly account for more than two-thirds of Egypt’s exports. It is noteworthy that the geographical distribution has also changed after the financial crisis when Egypt shifted its exports from USA to Arab countries.
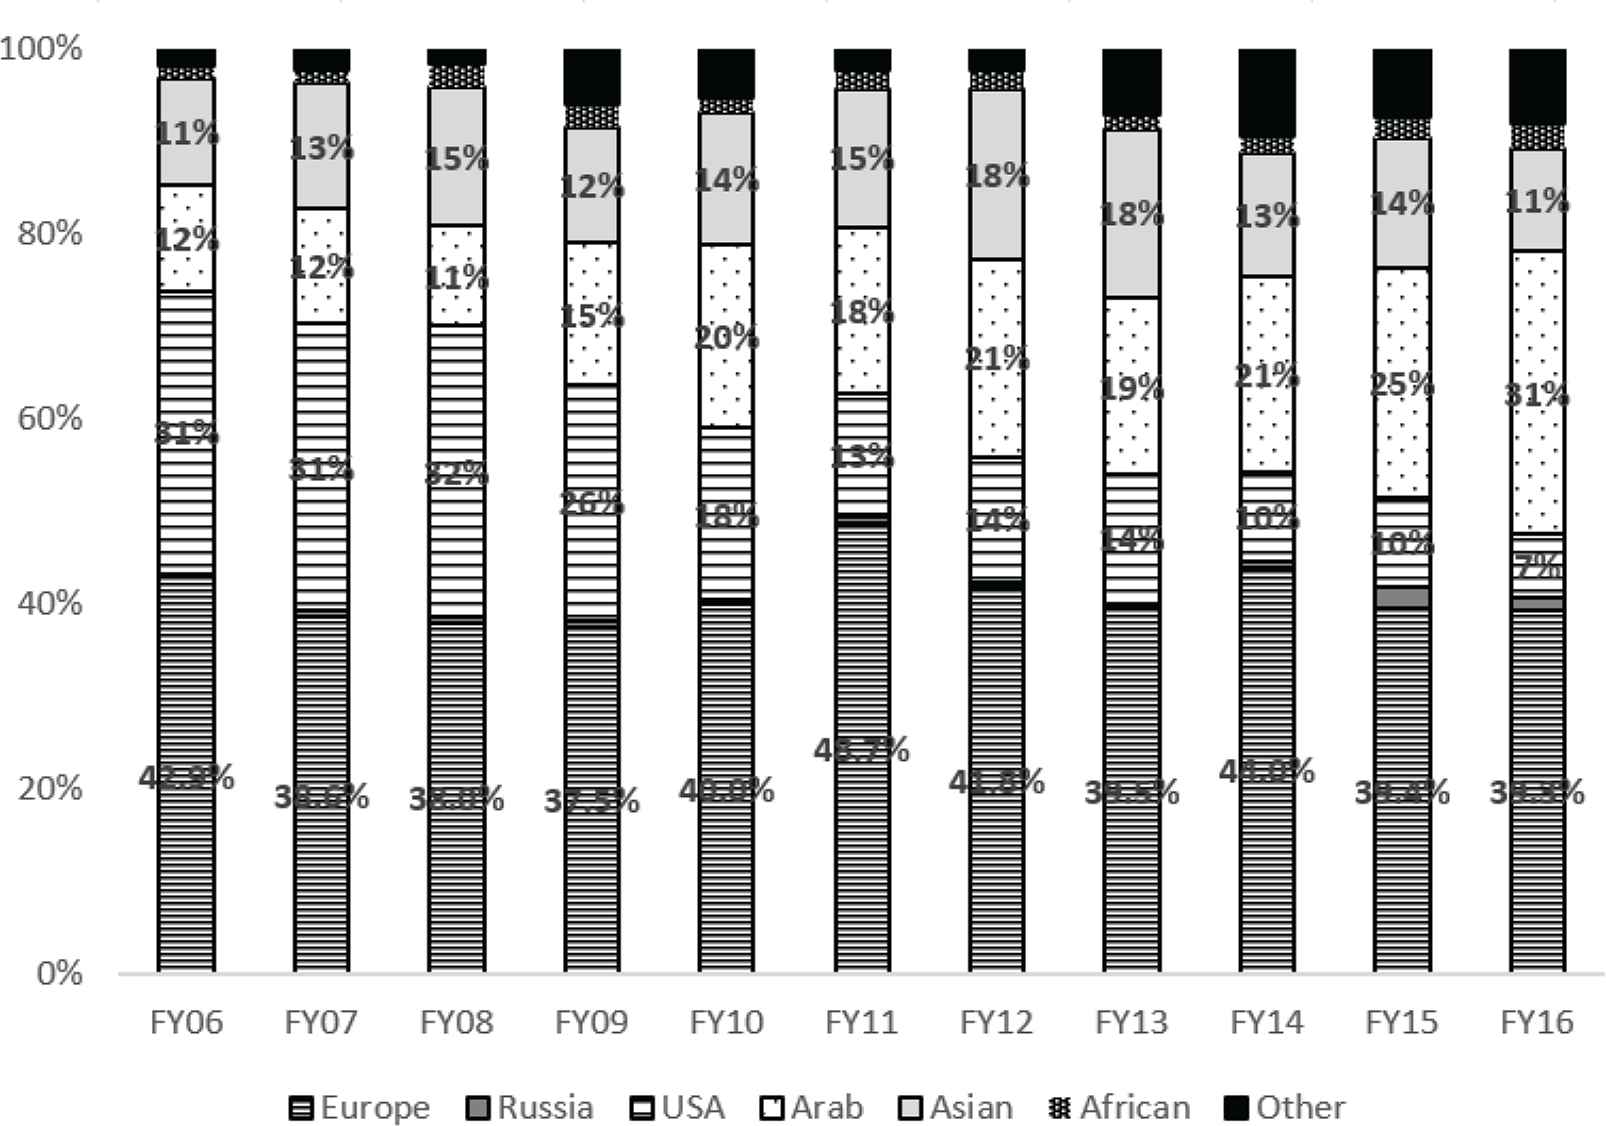
Egypt’s exports by region of destination. Source: Constructed by the authors using the CBE Dataset.
Table 2 shows that the share of oil exports has declined, reaching 30% in 2016, while raw materials and finished goods have increased to reach 9% and 50%, respectively. The latter are chiefly dominated by fertilizers, garments, and textiles. Yet, based on the International Trade Center (ITC) calculations, Egypt needs to have better specialization to meet the international demand in growing sectors, as most of the sectors in which Egypt is specialized fail to match international demand, with the exception of essential oils, furniture, and edible vegetables. Hence, in order to overcome such missed opportunities (due to specialization in resource-based and low-technology exports), a greater focus on dynamizing sectors at the world level is a priority (especially in equipment, electronics, and high-technology exports).
| FY11 (%) | FY12 (%) | FY13 (%) | FY14 (%) | FY15 (%) | FY16 (%) | |
|---|---|---|---|---|---|---|
| Fuel, mineral oils and products, of which | 46.7 | 46.3 | 48.8 | 47.9 | 40.6 | 30.8 |
| Crude oil | 21.0 | 20.8 | 27.1 | 29.6 | 27.7 | 19.0 |
| Petroleum products x | 24.0 | 24.0 | 21.2 | 17.8 | 12.3 | 11.3 |
| Coal and types thereof | 0.2 | 0.2 | 0.1 | 0.1 | 0.2 | 0.2 |
| Raw materials, of which | 5.2 | 4.7 | 5.0 | 5.7 | 7.8 | 9.8 |
| Cotton | 0.8 | 0.5 | 0.4 | 0.3 | 0.2 | 0.3 |
| Potatoes | 0.2 | 0.2 | 0.3 | 0.6 | 0.6 | 1.0 |
| Citrus fruits | 0.1 | 0.3 | 0.2 | 0.4 | 0.7 | 1.1 |
| Medicinal plants | 0.1 | 0.1 | 0.1 | 0.1 | 0.1 | 0.2 |
| Spices and vanilla | 0.0 | 0.0 | 0.0 | 0.1 | 0.1 | 0.2 |
| Dairy products, eggs and honey | 0.6 | 0.7 | 0.7 | 0.9 | 1.2 | 1.1 |
| Flax, raw | 0.0 | 0.0 | 0.0 | 0.0 | 0.0 | 0.0 |
| Semi-finished goods, of which | 7.7 | 7.8 | 7.4 | 8.5 | 8.8 | 9.0 |
| Carbon | 0.4 | 0.7 | 0.7 | 0.5 | 0.6 | 0.5 |
| Essential oils and resins | 0.1 | 0.2 | 0.1 | 0.1 | 0.2 | 0.3 |
| Aluminum, unalloyed | 0.3 | 0.4 | 0.4 | 0.1 | 0.1 | 0.3 |
| Cotton yarn | 0.8 | 0.4 | 0.3 | 0.5 | 0.4 | 0.4 |
| Organic and inorganic chemicals | 2.2 | 2.3 | 1.9 | 2.1 | 2.5 | 1.9 |
| Finished goods, of which | 40.2 | 41.3 | 38.8 | 37.8 | 42.8 | 50.4 |
| Rice | 0.1 | 0.1 | 0.2 | 0.2 | 0.5 | 0.2 |
| Soap, washing prep. and artificial waxes | 1.2 | 1.6 | 1.3 | 1.0 | 0.9 | 1.3 |
| Dried onion | 0.1 | 0.1 | 0.1 | 0.1 | 0.1 | 0.0 |
| Pharmaceuticals | 1.7 | 1.5 | 1.4 | 1.1 | 1.2 | 1.2 |
| Fertilizers | 4.2 | 3.4 | 3.1 | 2.7 | 1.6 | 2.8 |
| Carpets and other floor coverings | 0.7 | 0.7 | 0.6 | 0.7 | 0.9 | 0.9 |
| Articles of iron and steel | 2.0 | 1.1 | 1.4 | 1.3 | 1.1 | 1.1 |
| Aluminum articles | 1.2 | 1.2 | 0.8 | 1.0 | 1.3 | 1.1 |
| Ready-made clothes | 2.9 | 2.9 | 2.7 | 3.0 | 3.6 | 3.7 |
| Cotton textiles | 2.3 | 2.3 | 2.9 | 2.9 | 3.3 | 3.7 |
| Undistributed exports | 0.2 | 0.0 | 0.0 | 0.0 | 0.0 | 0.0 |
| Total exports | 100.0 | 100.0 | 100.0 | 100.0 | 100.0 | 100.0 |
Source: Constructed by the authors using the Central Bank of Egypt dataset.
Structure of Egypt’s exports
In terms of comparative advantage,1 Table 3 identifies three groups of products: products with an increasing Revealed Comparative Advantage (RCA) between 2001 and 2015, products with a decreasing comparative advantage (and thus declining market shares), and products that were not characterized by a comparative advantage in 2001 but in which Egypt managed to specialize and gained some export market shares. The first group includes traditional exports such as articles of apparel and clothing accessories, articles of stone, plaster, cement, edible fruit and nuts, edible vegetables and certain roots, glass and glassware, oil seeds and oleaginous fruits; preparations of vegetables, fruit, nuts, products of the milling industry, and soap. The main products for which Egypt lost comparative advantage include aluminum and articles thereof; animal or vegetable fats and oils; articles of apparel and clothing; ceramic products; cereals; cotton; fertilizers; iron and steel; mineral fuels, mineral oils; and rubber and articles thereof. Interestingly, Egypt gained some comparative advantage in respect to the following products: articles of iron or steel; carpets and other textile floor covering; cocoa and cocoa preparations; copper and articles thereof; dairy produce; birds’ eggs; natural honey, essential oils, and resinoids; perfumery; furniture; lead and articles thereof; live trees and other plants; man-made filaments, paper and paperboard; articles of paper, plastics and articles thereof; preparations of cereals, flour, starch; tanning or dyeing extracts, tannins; and wool, fine or coarse animal hair.
| RCA in 2001 and increased in 2015 | RCA in 2001 and decreased in 2015 | No RCA in 2001 and RCA in 2015 |
|---|---|---|
| Articles of apparel and clothing access | Aluminum and articles thereof | Albuminoidal substance |
| Articles of stone, plaster, cement | Animal or vegetable fats and oils | Articles of iron or steel |
| Edible fruit and nuts; peel of citrus | Articles of apparel and clothing access | Carpets and other textile floor covering |
| Edible vegetables and certain roots | Ceramic products | Cocoa and cocoa preparations |
| Glass and glassware | Cereals | Copper and articles thereof |
| Oil seeds and oleaginous fruits; miscellaneous | Coffee, tea, spices | Dairy produce; birds’ eggs; natural honey |
| Preparations of vegetables, fruit, nuts | Commodities not elsewhere specified | Essential oils and resinoids; perfumery |
| Products of the milling industry; malt | Cotton | Furniture; bedding, mattresses, mattress |
| Raw hides and skins (other than fur skins) | Fertilizers | Lac; gums, resins and other vegetables |
| Salt; sulfur; earths and stone; plaster | Inorganic chemicals; organic or inorganic | Lead and articles thereof |
| Soap, organic surface-active agents | Iron and steel | Live trees and other plants; bulbs |
| Sugars and sugar confectionery | Mineral fuels, mineral oils and product | Man-made filaments; strip and the like |
| Other made-up textile articles; sets | Man-made staple fibers | |
| Other vegetable textile fibers; paper | Miscellaneous chemical products | |
| Rubber and articles thereof | Miscellaneous edible preparations | |
| Vegetable plaiting materials; vegetable | Miscellaneous manufactured articles | |
| Paper and paperboard; articles of paper | ||
| Plastics and articles thereof | ||
| Preparations of cereals, flour, starch | ||
| Products of animal origin, not elsewhere | ||
| Special woven fabrics; tufted textile f | ||
| Tanning or dyeing extracts; tannins and | ||
| Tobacco and manufactured tobacco | ||
| Wadding, felt and nonwovens | ||
| Wool, fine or coarse animal hair; horse |
Source: Constructed by the authors using the International Trade Center database.
Evolution of RCA between 2001 and 2015
3.2. Development of the Exchange Rate Policy Regime
The development of the exchange rate policy regime in Egypt is discussed in this section in order to show the link between the evolution of this policy and export performance.
3.2.1. The nominal exchange rate
Egypt maintained a fixed adjustable peg of its currency to the US dollar for over 40 years, since the 1960s until 2003. This policy was accompanied by foreign exchange controls and multiple exchange rates. By the end of the decade, a macroeconomic reform program was conducted by the Egyptian government in order to tackle the external and internal imbalances. The overvaluation of the exchange rate has negatively affected the exporting trend, particularly in non-oil exports. The multiple exchange rate changed from five to three exchange rates. In addition, a gradual devaluation of the exchange rate was implemented (Mohieldin and Kouchouk, 2003). These were considered crucial steps to eliminate the differences between various export-oriented activities and reduce the bias against exports. However, in order to capture the benefits of devaluation, it is necessary to adjust the ability of Egypt’s economy and exports to cater for the new demand, particularly on the supply side.
In order to have an active monetary policy, the CBE had two options. The first was to continue with the peg system while placing restrictions on the capital market. The other option was to move to a flexible exchange rate policy with no capital market restrictions. With the adoption of the Economic Reform and Structural Adjustment Program in the early 1990s, the multiple exchange rate system was replaced by two exchange markets – a primary restricted market and a secondary free market – which were later unified. Thereafter, the exchange rate stabilized and was maintained within an implicit band of around US$1 = EGP 3.33. Sterilized intervention was successful and the nominal exchange rate remained stable between 1991 and 2000. In January 2001, the exchange rate had a three-stage devaluation, and a new central exchange rate was introduced to stabilize the market and move to a crawling peg.
In January 2003, the government announced the abandonment of the exchange rate peg. As the exchange rate was still far from its market-clearing equilibrium, expectations resulted in an immediate fall in the value of the Egyptian pound. The establishment of a foreign exchange interbank market in December 2004 eliminated the parallel foreign exchange market and stabilized the nominal exchange rate starting in December 2005. Following these measures, the nominal exchange rate began to appreciate in December 2004 and stabilized at around EGP 5.7/US$1 until June 2006. Strong capital inflows subsequently helped to further boost the pound against the US dollar. The appreciation trend was mild at first but increasingly strengthened, reflecting increased capital inflows. Consequently, the IMF reclassified Egypt’s exchange rate regime into a “managed float.” In this period, Egypt’s exports increased significantly due to the changes in the exchange rate system.
Yet, in the wake of political turmoil in 2011, international reserves declined rapidly from US$36 billion in December 2010 to US$26.4 billion in June 2011, US$15.5 billion in June 2012, and US$15.4 billion in January 2015 (i.e., equivalent to 2.8 months of projected imports of goods and services). This evolution reflected the CBE’s efforts to defend the Egyptian pound, which lost only around 4% of its value against the dollar between January 2011 and December 2012. In December 2012, the CBE introduced a new system for buying and selling foreign currency. The system features regular currency auctions, designed to allow the Egyptian pound to float more freely, with its price more closely reflecting supply and demand. The objective was to conserve its foreign reserves, which had fallen to a critical level. Following these auctions, the Egyptian pound plummeted to an 8-year low against the US dollar, reaching EGP6.70/US$1 in March 2013. The Egyptian pound experienced a further depreciation in early 2015, when the CBE announced that the value of the dollar was now EGP7.61 with a level of foreign reserves of US$15.4 billion. This system resulted in the rise of black-market practices. While the dollar reached an official rate of EGP8.88, it reached EGP18.00 on the parallel market. The CBE hereafter announced its decision to move, with immediate effect, to a liberalized exchange rate regime in order to quell any distortions in the domestic foreign currency market. By the end of 2016, the Egyptian pound was floated against the US dollar to EGP13.00 per US$. By early 2017, the exchange rate reached EGP18.00/US$ Figure 3 leading to soaring inflation rates Figure 4.
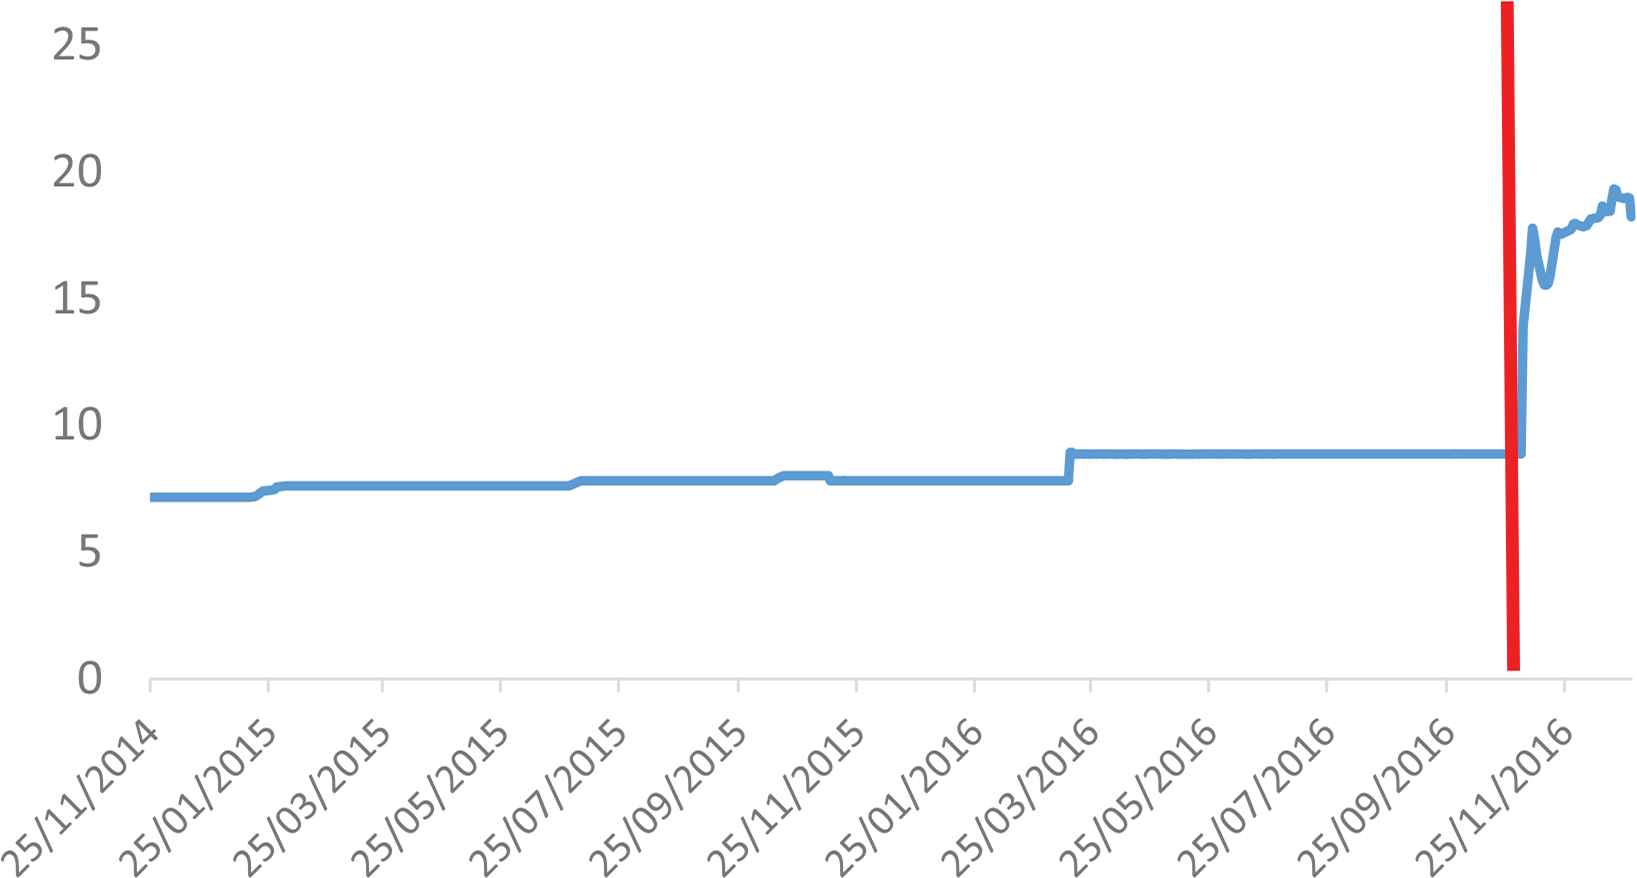
Exchange rate developments. Source: The Central Bank of Egypt.
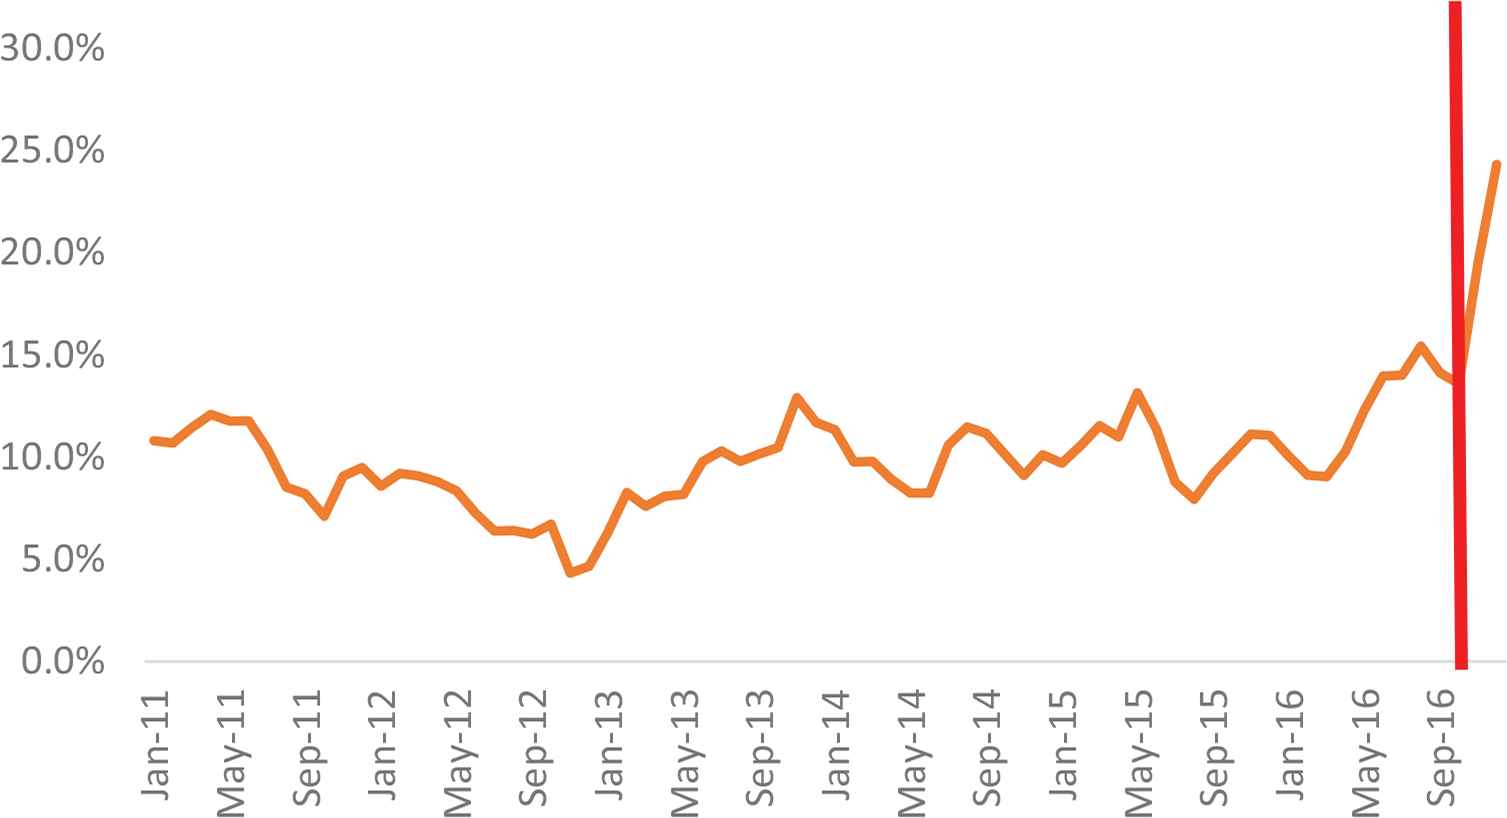
Inflation rate development. Source: The Central Bank of Egypt.
3.2.2. The effective exchange rates
The REER and the Nominal Effective Exchange Rate (NEER) indices are sourced from Brugel’s database (Darvas, 2012). The NEER is defined as the value of a currency against a weighted average of several foreign currencies. An increase in NEER indicates an appreciation of a currency against the weighted basket of currencies of its trading partners. While the REER is the NEER adjusted for inflation differentials, an increase in the REER shows that exports become more expensive and imports become cheaper.
In order to measure international competitiveness, Figure 5 shows the evolution of Egypt’s REER and NEER from January 2005 to June 2016, and Figure 6 depicts the average and standard deviation for both indices. It can be seen that the NEER showed a downward trend with a lower standard deviation while the REER witnessed an upward trend with a high standard deviation. Moreover, Figure 5 delineates the movement of both the REER and the NEER, showing that the NEER was steadily declining over the sample period, while the REER followed a steady upward trend. Thus, an appreciation of the REER indicates that the domestic price level in Egypt was rising over the reported period compared to its trading partner countries. Figure 7 shows two other measures for the exchange rate development, namely, the REER (REER2) and exchange rate misalignment (Misal) estimated by Noureldin (2017). It is clear that the two measures of REER exhibited the same pattern between 2005 and 2016. Furthermore, the Egyptian pound was overvalued during the period under study. Table 4 also shows a strong correlation (0.99) between the two measures of REER and a significantly negative correlation between the three measures of exchange rate and exports, thus proving that a real appreciation or an overvaluation of the Egyptian pound are negatively correlated to exports.
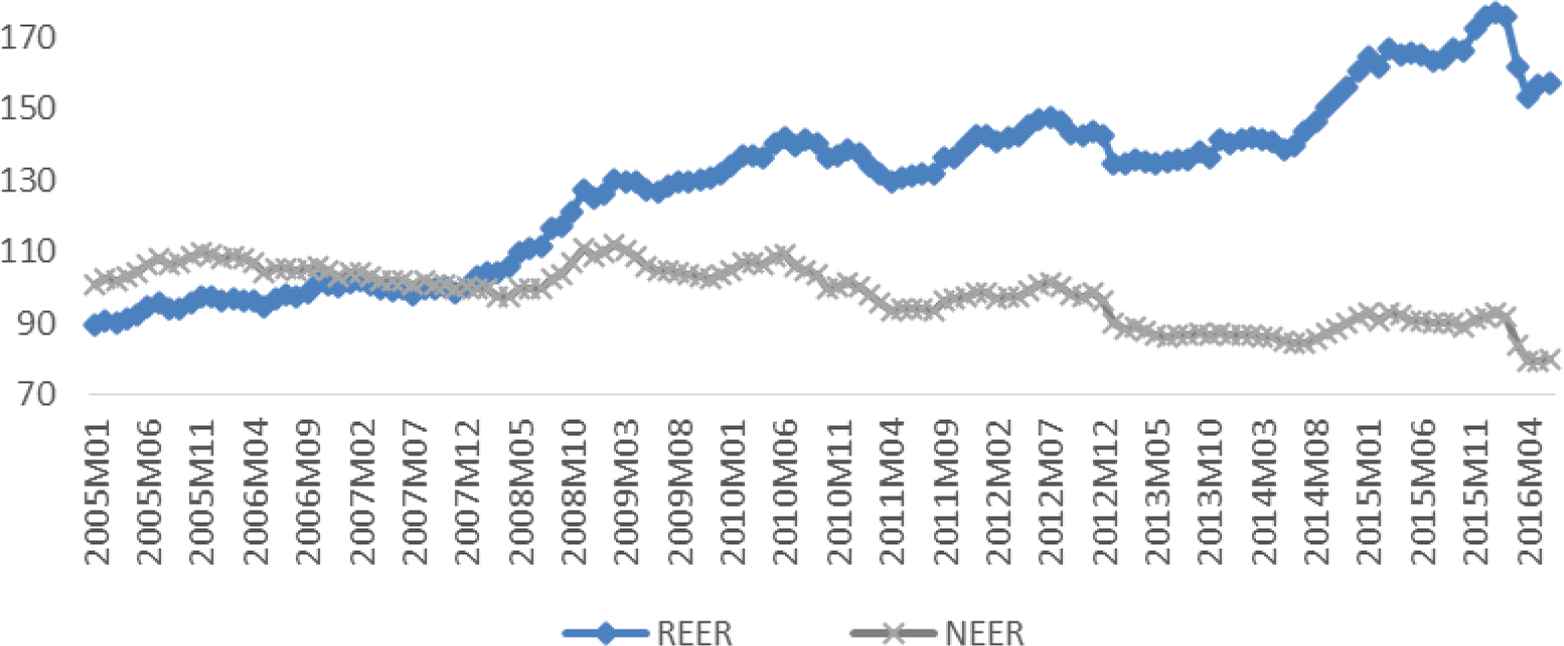
Egypt’s real effective exchange rate (REER) and nominal effective exchange rate (NEER) for the period January 2005 to June 2016. Note: An increase in the REER index indicates an appreciation (in real terms) of the home currency against the basket of currencies of trading partners. Source: Constructed by the authors using Brugel’s database (Darvas, 2012).
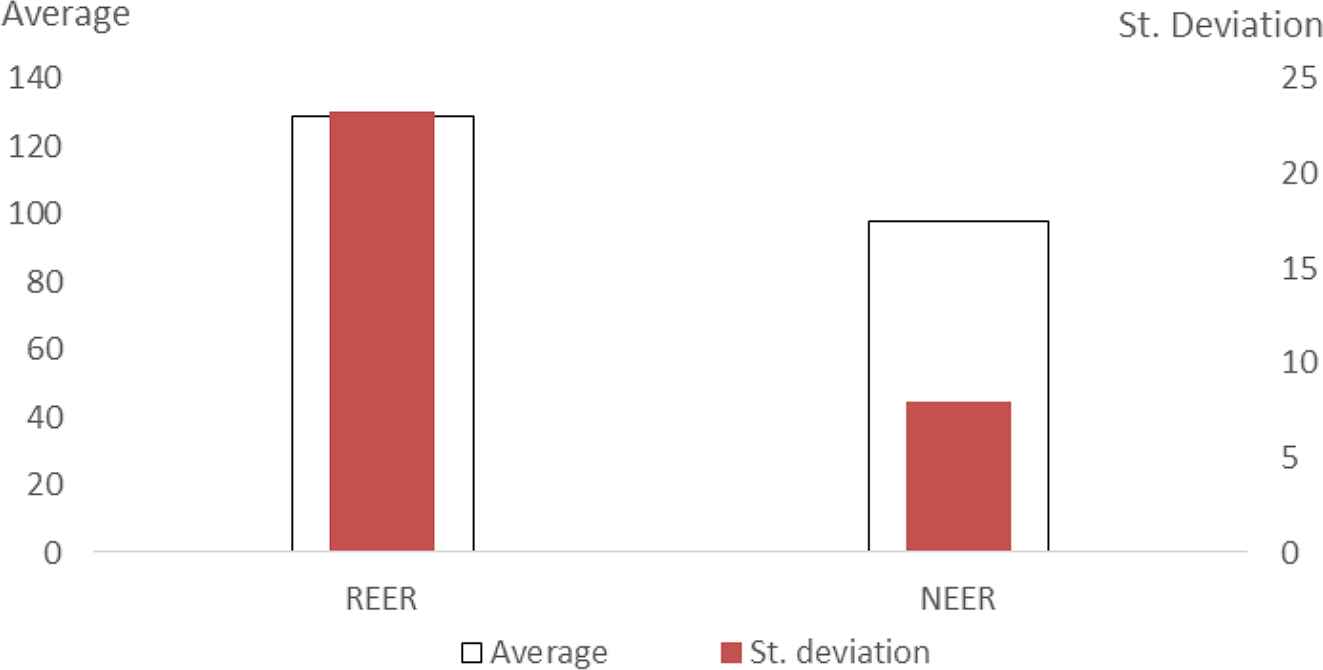
Average and standard deviation for the real effective exchange rate (REER) and nominal effective exchange rate (NEER). Source: Constructed by the authors using Brugel’s database (Darvas, 2012).
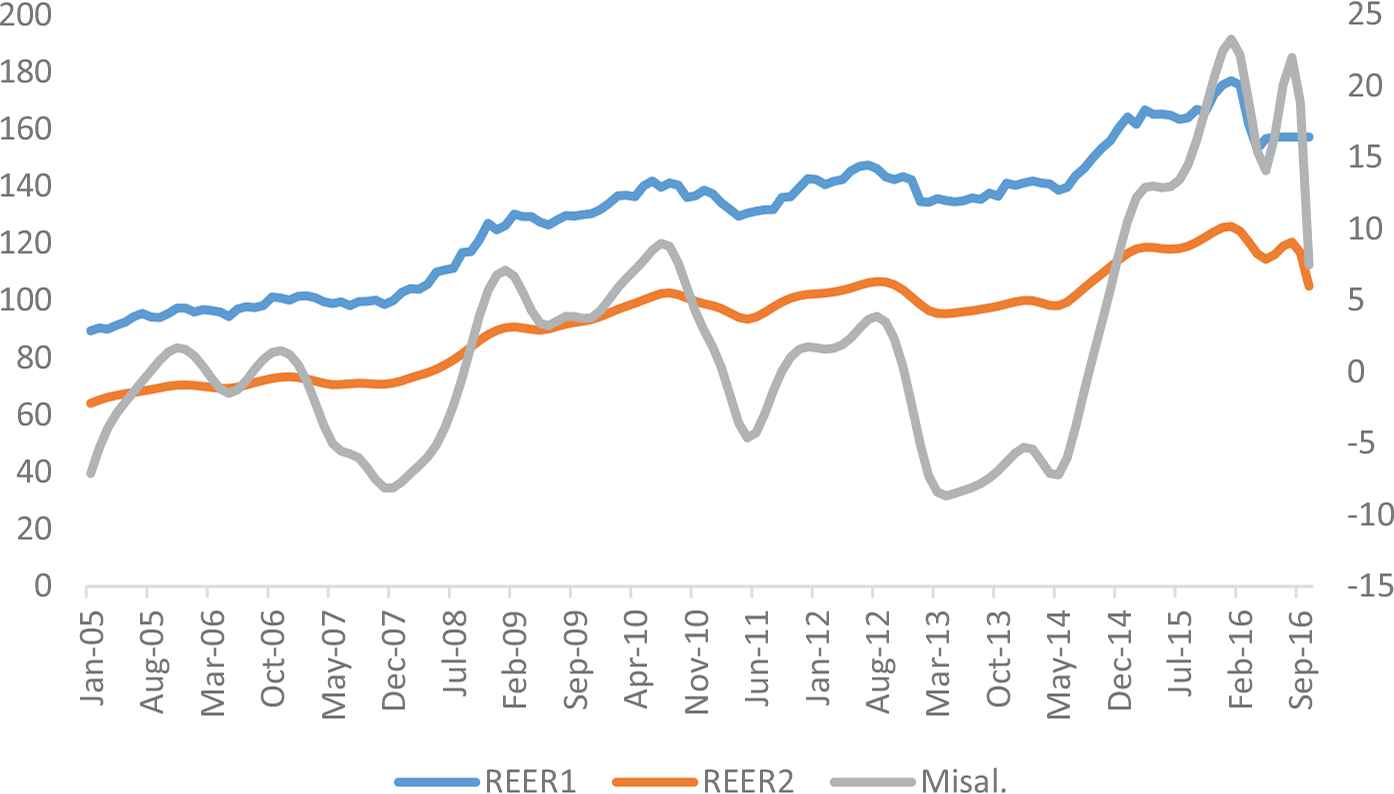
Different measures of REER and exchange rate misalignment. Note: (1) REER1 is the real effective exchange rate estimated by Darvas (2012), REER2 is the real effective exchange rate estimated by Noureldin (2017), both on the left-hand side axis and Misal is the exchange rate misalignment estimated by Noureldin (2017) on the right-hand side axis. (2) An increase in REER1 or REER2 means an appreciation. Positive value for Misal means overvaluation. Source: Constructed by the authors using Darvas (2012) and Noureldin (2017).
| ln(Value) | ln(REER1) | Misal | ln(REER2) | |
|---|---|---|---|---|
| ln(Value) | 1 | |||
| ln(REER1) | −0.035*** (0.000) | 1 | ||
| Misal | −0.019*** (0.000) | 0.593*** (0.000) | 1 | |
| Ln(REER2) | −0.031*** (0.000) | 0.996*** (0.000) | 0.635*** (0.000) | 1 |
Source: Constructed by the authors using Darvas (2012), Noureldin (2017).
1% significance level.
Note: p-values between parentheses. Misal, exchange rate misalignment; REER1, real effective exchange rate measured by Darvas 2012; REER2, real effective exchange rate measured by Noureldin (2017).
Correlation between exports and exchange rate measures
3.3. Trade Margins and Exchange Rate
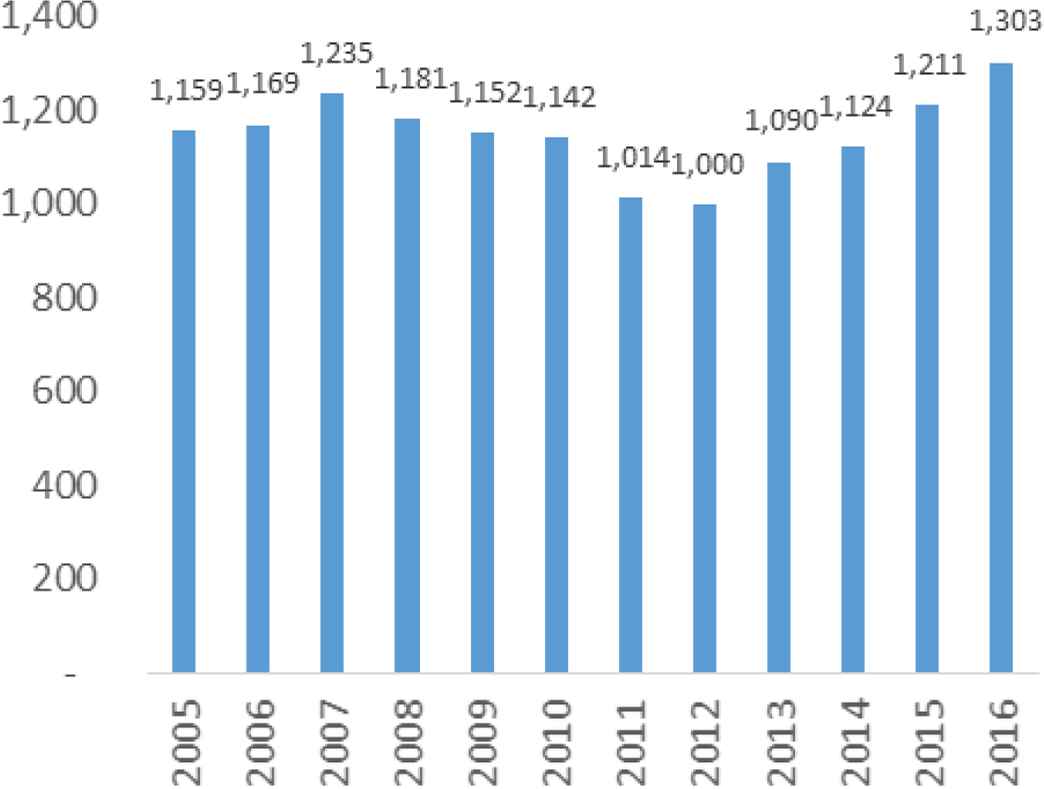
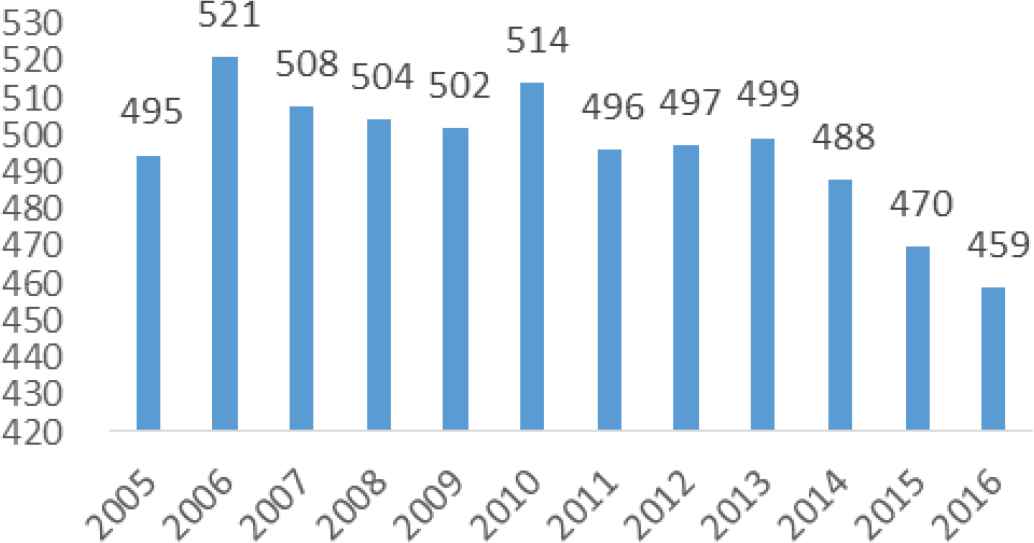
On average, the number of exporting firms has increased between 2005 and 2016, reaching 11,550 firms in 2016 Figure 8. The number of continuing firms decreased between 2007 and 2012, and then witnessed an increasing trend between 2013 and 2016 Figure 9.
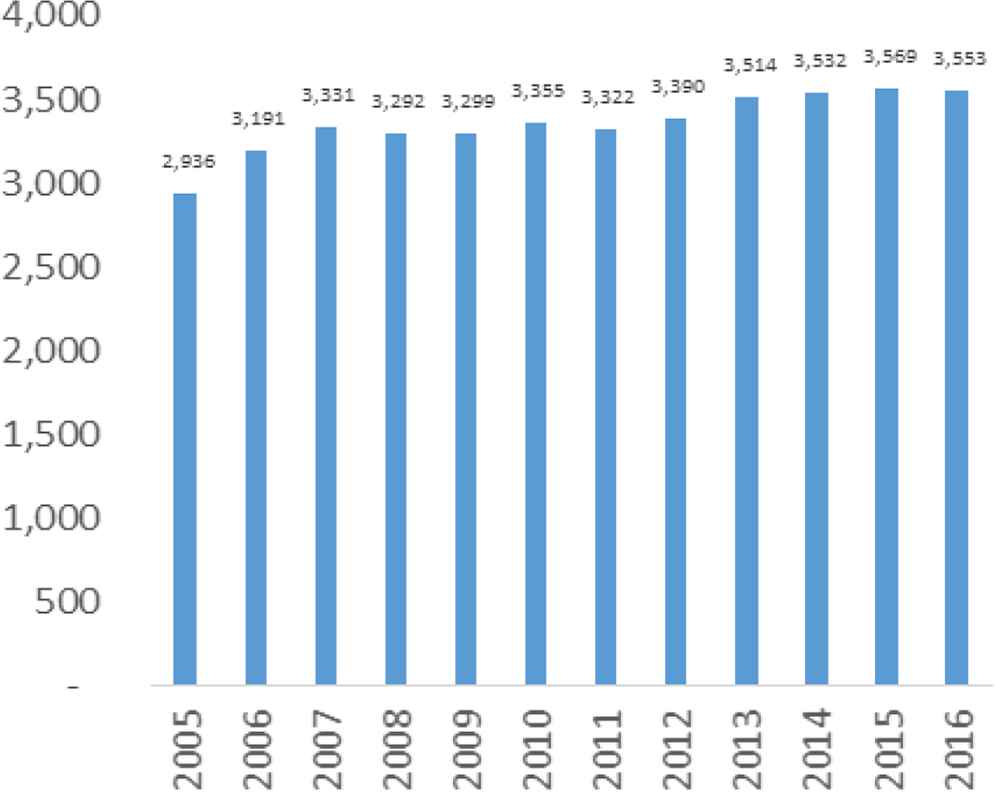
Average number of firms per year. Source: Constructed by the authors using the GOEIC dataset.
Average number of continuing firms per year. Source: Constructed by the authors using the GOEIC dataset.
The number of exported products had an opposite trend to the increase in the number of firms. The number of products declined over the whole period, with the exception of an increase in 2010 Figure 10.
Average number of exported products per year. Source: Constructed by the authors using the GOEIC dataset.
Figures 11–18 illustrate the relationship between the trade margins and the exchange rate. Scatter plots are drawn between the variables capturing the extensive and intensive margins and the exchange rate. The exchange rate is measured by the REER (calculated by Darvas, 2012) and the exchange rate misalignment (calculated by Noureldin, 2017). Figures 11–14 tackle the extensive trade margin. First, Figure 11 shows that the correlation between the log of the number of destinations and the log of the REER (calculated by Darvas, 2012) is positive but weak. Second, Figure 12 shows that the relationship between the exchange rate misalignment and the destination is negative but weak. Third, while Figure 13 shows a negative association between the products and the REER, the relationship between the products and misalignment in Figure 14 is also negative but weak. This indicates that a real appreciation results in a decline in the number of exported products.
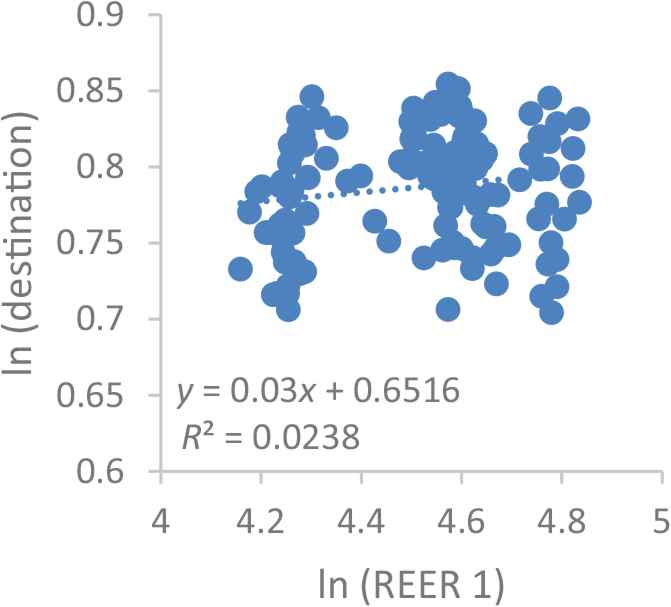
Destination and real effective exchange rate (REER). Source: Constructed by the authors using Darvas (2012), Noureldin (2017) and the General Organization for Import and Export Control (GOEIC) dataset.
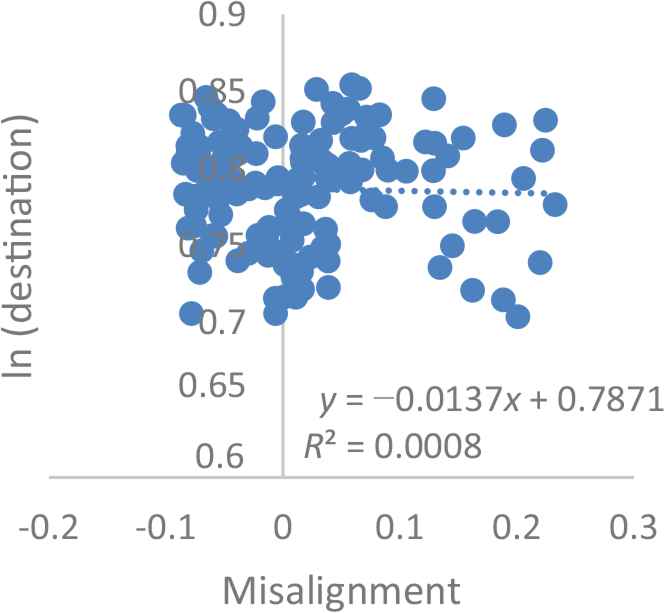
Destination and misalignment. Source: Constructed by the authors using Darvas (2012), Noureldin (2017) and the General Organization for Import and Export Control (GOEIC) dataset.
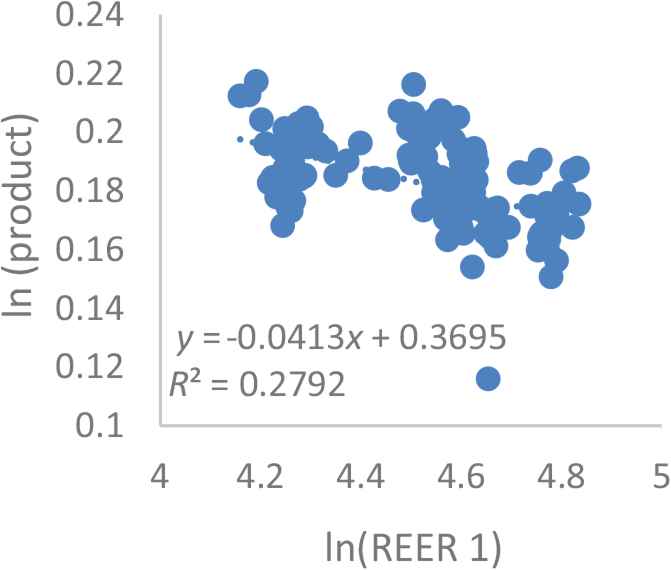
Products and real effective exchange rate (REER). Source: Constructed by the authors using Darvas (2012), Noureldin (2017) and the General Organization for Import and Export Control (GOEIC) dataset.
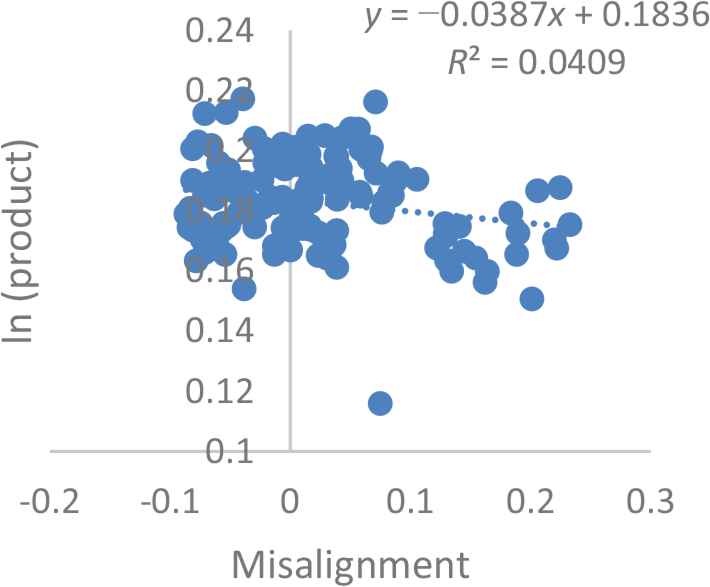
Products and misalignment. Source: Constructed by the authors using Darvas (2012), Noureldin (2017) and the General Organization for Import and Export Control (GOEIC) dataset.
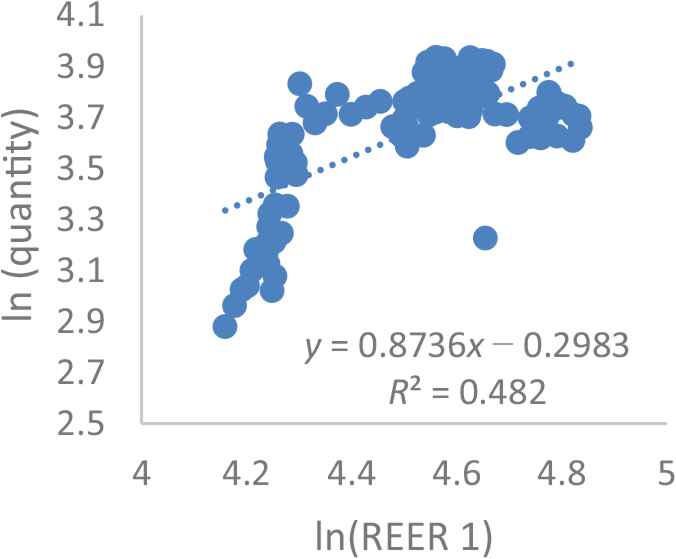
Quantity and real effective exchange rate (REER). Source: Constructed by the authors using Darvas (2012), Noureldin (2017) and the General Organization for Import and Export Control (GOEIC) dataset.
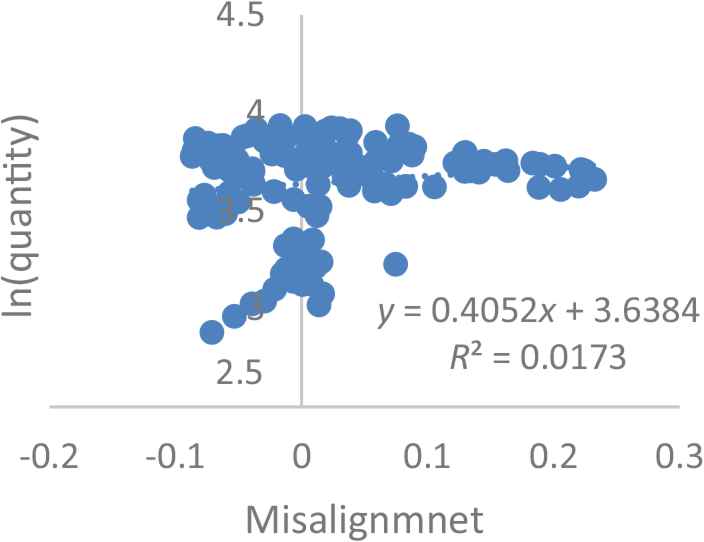
Quantity and misalignment. Source: Constructed by the authors using Darvas (2012), Noureldin (2017) and the General Organization for Import and Export Control (GOEIC) dataset.
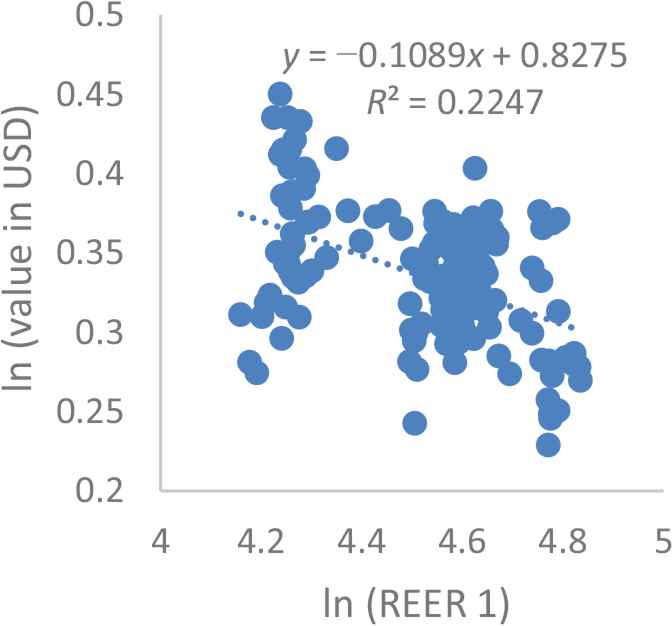
Value in USD and real effective exchange rate (REER). Source: Constructed by the authors using Darvas (2012), Noureldin (2017) and the General Organization for Import and Export Control (GOEIC) dataset.
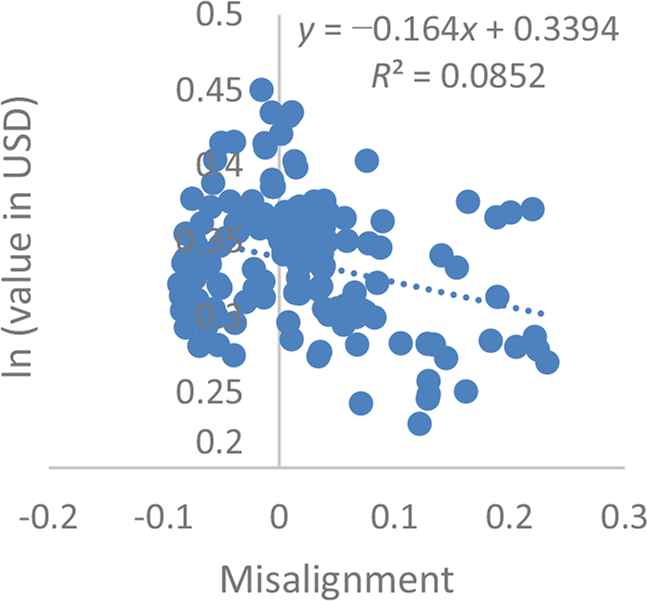
Value in USD and misalignment. Source: Constructed by the authors using Darvas (2012), Noureldin (2017) and the General Organization for Import and Export Control (GOEIC) dataset.
Figures 15–18 tackle the intensive trade margin. Figure 15 indicates that there is a strong positive relationship between the REER and the quantity of trade. Figure 16 shows that the relationship with the exchange rate misalignment is positive but weaker. Figure 17 shows that the relationship between the log of the value of exports in US dollars and the log of the REER is negative and relatively strong. Figure 18 indicates that the relationship between the value and the exchange rate misalignment is also negative but weak. These trends indicate that a RER appreciation negatively affects exports.
4. DATA AND METHODOLOGY
In order to examine the effect of exchange rate developments on trade margins, and following the literature in this field, we adopt a gravity-type model that has become an essential tool in the empirics of international trade to predict bilateral trade flows using multiple determinants of trade (McCallum, 1995; Feenstra et al., 2001; Feenstra, 2002; Anderson and van Wincoop, 2003). Moreover, this tool has been widely used in order to examine the effect of different variables (tariffs, non-tariff measures or exchange rate) on trade at both the macroeconomic and the firm levels.
To measure the intensive margin of exports, our dependent variable is the value of trade between firm i in Egypt and country j at month t (xkijt) for product k. Our explanatory variables include classical gravitational variables such as the gross domestic product (GDP) of partner j, several variables measuring transaction costs that include transport costs measured by the bilateral distance between Egypt and its partner j (dij), some dummies capturing whether one country was a colony of the other at some point in time (Colij), whether the two countries share a common border (Contij) or share a common language (Langij). To examine the impact of exchange rate devaluation (REERt), we run the following regression:
We also examine the effect of exchange rate misalignment (Misal) on exports as follows:
As per the extensive margin, we run the same regressions and include the number of products by firm i to destination j in month-year t:
Finally, we also examine the effect of exchange rate developments on the extensive margin measured by the number of destinations by firm i in month-year t:
Sectoral regressions at Harmonized System-4 digits (HS4) level and country regressions at the destination level are also run to determine which products and which markets are more sensitive to exchange rate developments.
Since the firm-level dataset does not include any variable that measures firms’ characteristics (e.g., labor, capital, location, etc.), the only feasible solution is to include firm-level fixed effects. Moreover, we introduced month and year fixed effects in order to control for month and year unobservables, as well as any seasonality that can characterize the exchange rate dataset. Therefore, we run linear regressions with high-dimension fixed effects.
Trade data was obtained from the General Organization for Export and Import Control (GOEIC) and the Ministry of Industry and Foreign Trade in Egypt (monthly data, between 2005 and 2016, at the HS4 level, both quantities and values of exports). Other variables derive from the Doing Business dataset, the World Development Indicators, and the Centre des Etudes Prospectives et d’Information Internationales (CEPII) gravity dataset. The real effective exchange rate derives from two sources (Darvas, 2012; Noureldin, 2017) that have been used to check the robustness of our results. Exchange rate misalignment also comes from Noureldin (2017).
5. EMPIRICAL FINDINGS
5.1. Intensive Margin
Table 5 shows the impact of the exchange rate on the value of exports (whether it is measured in USD or EGP). In terms of the classical gravity variables, while distance has a significant negative impact on bilateral trade flow, a common language and colonial links have a significant positive impact. Moreover, a higher GDP increases the value of exports. A depreciation of the RER (REER1 measured by Darvas, 2012, and REER2 by Noureldin, 2017) increases the value of exports. By contrast, Table 6 exhibits an insignificant impact of REER on the quantity of exports. This is chiefly attributed to two main reasons. First, this result depends on the price elasticity of exports. If the price-elasticity of exports in terms of a foreign currency of a country that is less than unity, the value of exports in terms of a foreign currency will fall as the increase in the physical volume of exports will be more than offset by the depreciation of the currency. Hence, prices will react more than quantities. Second, as Egypt is a net importer of capital goods and raw materials used in exportables, the rise in their import prices will not only directly raise the price level, but as they are used as inputs in the production of other goods, a rise in their imports prices will also push up the cost of production of these other goods. This situation will thereby generate cost-push inflation, especially if the demand for imports is inelastic, which can erode the benefits of depreciation unless the country imposes some protectionist measures. This result is in line with Chen and Juvenal (2016) and Li et al. (2015) who found a smaller response of export volumes to a deprecation. Indeed, the quantity of traded exports, contrary to prices, was found to have a moderate response to currency devaluation.
| ln(Value EGP) | ln(Value USD) | |||||
|---|---|---|---|---|---|---|
| ln(GDP imp) | 0.103*** (0.00129) | 0.103*** (0.00129) | 0.103*** (0.00129) | 0.0686*** (0.00218) | 0.0686*** (0.00218) | 0.0686*** (0.00218) |
| ln(Dist.) | −0.0624*** (0.00295) | −0.0624*** (0.00295) | −0.0624*** (0.00295) | 0.00204 (0.00511) | 0.00205 (0.00511) | 0.00200 (0.00511) |
| Contiguous | 0.0379*** (0.00830) | 0.0379*** (0.00830) | 0.0378*** (0.00830) | 0.00292 (0.0140) | 0.00290 (0.0140) | 0.00291 (0.0140) |
| Common language | 0.0602*** (0.00513) | 0.0602*** (0.00513) | 0.0602*** (0.00512) | 0.0804*** (0.0101) | 0.0804*** (0.0101) | 0.0803*** (0.0101) |
| Colony | 0.0190*** (0.00558) | 0.0189*** (0.00558) | 0.0190*** (0.00558) | 0.00405 (0.00987) | 0.00405 (0.00987) | 0.00402 (0.00987) |
| ln(REER1) | −0.195*** (0.0610) | −0.200** (0.0984) | ||||
| ln(REER2) | −0.227*** (0.0664) | −0.198* (0.112) | ||||
| Misal | −0.174*** (0.0510) | −0.197** (0.0848) | ||||
| Constant | −1.045*** (0.280) | −0.973*** (0.283) | −1.929*** (0.0320) | −0.823* (0.455) | −0.895* (0.479) | −1.729*** (0.0630) |
| Firm FE | Yes | Yes | Yes | Yes | Yes | Yes |
| Year FE | Yes | Yes | Yes | Yes | Yes | Yes |
| Month FE | Yes | Yes | Yes | Yes | Yes | Yes |
| Observations | 320496 | 320496 | 320496 | 320496 | 320496 | 320496 |
| R2 | 0.394 | 0.394 | 0.394 | 0.433 | 0.433 | 0.433 |
Robust standard errors in parentheses.
p < 0.1.
p < 0.05.
p < 0.01.
FE, fixed effects; Misal, exchange rate misalignment; REER1, real effective exchange rate measured by Darvas (2012); REER2, real effective exchange rate measured by Noureldin (2017).
Results of the intensive margin – value of exports
| ln(Quantity) | |||
|---|---|---|---|
| ln(GDP imp) | 0.110*** (0.00224) | 0.110*** (0.00224) | 0.110*** (0.00224) |
| ln(Dist.) | −0.0905*** (0.00434) | −0.0905*** (0.00434) | −0.0904*** (0.00434) |
| Contiguous | 0.141*** (0.0124) | 0.141*** (0.0124) | 0.141*** (0.0124) |
| Common language | 0.179*** (0.00659) | 0.179*** (0.00659) | 0.179*** (0.00658) |
| Colony | 0.0417*** (0.00894) | 0.0417*** (0.00894) | 0.0417*** (0.00894) |
| ln(REER) | 0.141 (0.156) | ||
| ln(REER2) | 0.122 (0.155) | ||
| Misal | −0.0200 (0.124) | ||
| Constant | −0.198 (0.709) | −0.0716 (0.657) | 0.439*** (0.0651) |
| Firm FE | Yes | Yes | Yes |
| Year FE | Yes | Yes | Yes |
| Month FE | Yes | Yes | Yes |
| Observations | 1493001 | 1493001 | 1493001 |
| R2 | 0.569 | 0.569 | 0.569 |
Robust standard errors in parentheses.
p < 0.1.
p < 0.05.
p < 0.01.
FE, fixed effects; Misal, exchange rate misalignment; REER, real effective exchange rate; REER2, real effective exchange rate measured by Noureldin (2017).
Results of the intensive margin – quantity of exports
5.2. Extensive Margin
As per the extensive margin, we found that a higher GDP at the destination leads to a lower number of destinations, as exporters tend to concentrate their exports in large markets Table 7. The higher the distance, the more destinations will be served as exporters will seek closer partners. Table 7 shows a negative association between the REER (and misalignment) and exports. Indeed, a depreciation is likely to increase the number of destinations at the extensive margin since developing countries are able to form new export relationships and find new markets, but are much less successful in maintaining those relationships. Consequently, Egypt is likely to witness higher diversification at the destination level with a more depreciated (or undervalued) currency.
| ln(Dest.) | |||
|---|---|---|---|
| ln(GDP imp) | −0.0380*** (0.00128) | −0.0380*** (0.00128) | −0.0389*** (0.00128) |
| ln(Dist.) | 0.0371*** (0.00320) | 0.0373*** (0.00320) | 0.0364*** (0.00322) |
| ln(REER) | −0.130*** (0.0273) | ||
| ln(REER2) | −0.138*** (0.0272) | ||
| Misal | −0.128* (0.0654) | ||
| Constant | 2.196*** (0.132) | 2.188*** (0.122) | 1.598*** (0.0336) |
| Firm FE | Yes | Yes | Yes |
| Year FE | Yes | Yes | Yes |
| Month FE | Yes | Yes | Yes |
| Observations | 423482 | 423482 | 423482 |
| R2 | 0.673 | 0.673 | 0.673 |
Robust standard errors in parentheses.
p < 0.1.
p < 0.05.
p < 0.01.
FE, fixed effects; Misal, exchange rate misalignment; REER, real effective exchange rate; REER2, real effective exchange rate measured by Noureldin (2017).
Results of the extensive margin
At the number of products level, Table 8 shows that a higher GDP is associated with a higher number of products since larger countries have a stronger demand. Other classical gravity variables have the expected sign and are statistically significant. Our results show that changes in the exchange rate (which lead to changes in trade costs) have a significant impact on the range of products exported by firms as a higher depreciation (or undervaluation) is likely to increase the number of products exported to a certain destination. Indeed, recent trade models introduce the possibility for firms to choose endogenously between the range of products that they sell in the domestic market and/or export. Cadot et al. (2011) found similar results since they argued that low- and middle-income countries diversify mostly along the extensive margin (i.e., the addition of new product lines), whereas high income countries diversify along the intensive margin.
| ln(Product) | |||
|---|---|---|---|
| ln(GDP imp) | 0.0207*** (0.000300) | 0.0207*** (0.000300) | 0.0205*** (0.000308) |
| ln(Dist.) | −0.0138*** (0.000558) | −0.0137*** (0.000559) | −0.0140*** (0.000567) |
| Contiguous | 0.0218*** (0.00191) | 0.0218*** (0.00190) | 0.0244*** (0.00181) |
| Common language | 0.0706*** (0.00123) | 0.0706*** (0.00123) | 0.0698*** (0.00124) |
| Colony | 0.00919*** (0.00138) | 0.00920*** (0.00138) | 0.00827*** (0.00137) |
| ln(REER) | −0.0853*** (0.00540) | ||
| ln(REER2) | −0.0843*** (0.00539) | ||
| Misal | −0.0519*** (0.0196) | ||
| Constant | 0.127*** (0.0288) | 0.0944*** (0.0270) | −0.277*** (0.00778) |
| Firm FE | Yes | Yes | Yes |
| Year FE | Yes | Yes | Yes |
| Month FE | Yes | Yes | Yes |
| Observations | 1073476 | 1073476 | 1073476 |
| R2 | 0.377 | 0.377 | 0.376 |
Robust standard errors in parentheses.
p < 0.1.
p < 0.05.
p < 0.01.
FE, fixed effects; Misal, exchange rate misalignment; REER, real effective exchange rate; REER2, real effective exchange rate measured by Noureldin (2017).
Results of the extensive margin
5.3. Sectoral Results
We run the regressions at the HS4 level and keep the products for which the coefficient of the real effective exchange rate is negative and significant, showing that exports are sensitive to a real depreciation of the Egyptian pound (using our two measures of REER and the exchange rate misalignment). In general, products that are affected by the exchange rate depreciation include edible vegetables and certain roots and tubers, edible fruit and nuts, peel of citrus fruit or melons, oil seeds and oleaginous fruits; animal or vegetable fats and oils and their cleavage products, prepared edible fats; mineral fuels, mineral oils and products of their distillation, plastics and articles thereof; paper and paperboard, articles of paper pulp, paper or paperboard; cotton; man-made staple fibers, articles of apparel and clothing accessories, knitted or crocheted, other made-up textile articles, worn clothing, and worn textile articles; articles of stone, plaster, cement, asbestos, mica, or similar materials; glass and glassware; copper and articles thereof; lead and articles thereof; cereals, residues and waste from the food industries; ores, organic chemicals, rubber and articles thereof; iron and steel; electrical machinery and equipment. Yet, it is important to note that some of these products are not characterized by a comparative advantage in Egypt. This is why it is crucial to examine the link between specialization and REER sensitivity. Hence, we identify four groups of products at the HS2 level3 (whether or not they are sensitive to REER and whether or not Egypt has a comparative advantage for such products), as shown in Table 9.
| Not sensitive | Sensitive | |
|---|---|---|
| No RCA | 41 | 8 |
| 9% | 9% | |
| RCA | 30 | 18 |
| 26% | 56% |
Source: Constructed by the authors. Note: The upper number shows the number of products at the HS2 level and the lower number shows the share of these products in the value of total exports.
RCA vs. REER sensitivity
The first group includes products for which Egypt does not have a comparative advantage and that are not sensitive to a real effective exchange rate depreciation. In our dataset, they represent 41 products, which account for 9% of total exports and mainly include products of the printing industry; silk; precious or semi-precious stones; artificial flowers; cork; base metals; musical instruments; impregnated, coated, covered, or laminated textile fabrics; vehicles other than railway or tramway; toys, games, and sports requisites; pharmaceutical products; articles of leather, saddlery, and harness; explosives; aircraft; knitted or crocheted fabrics; arms and ammunition; machinery, mechanical appliances; nuclear reactors; meat and edible meat offal; coffee, tea, and spices; nickel and articles thereof; wood and articles thereof; beverages, spirits, and vinegar (see Table A.1 in Appendix 1 for further details). These products primarily face two difficulties. First, some of them are subject to several technical barriers to trade as well as sanitary and phytosanitary measures that negatively affect their export. Second, some of them are intensive in high-technology techniques that are relatively scarce in Egypt compared with other Arab countries (see Figure 19). These products are not likely to be boosted by a real depreciation as they are not sensitive to currency movements and Egypt does not have a comparative advantage in their production.
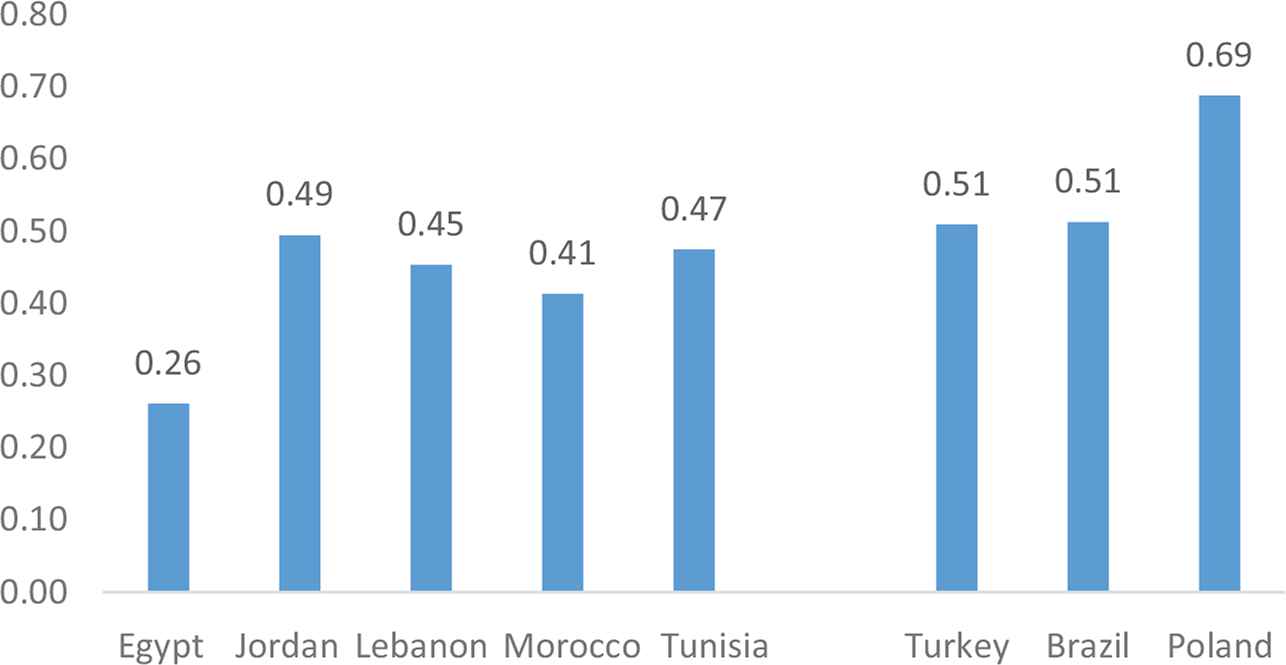
Share of medium and high-tech activities in total value-added. Source: Competitive Industrial Performance.
The second group includes products that are sensitive to real depreciation but Egypt does not have a comparative advantage in their production. These include eight products, accounting for 9% of total exports: cereals, residues and waste from the food industries; ores; organic chemicals; rubber and articles thereof; iron and steel; electrical machinery and equipment. If Egypt manages to gain a higher comparative advantage in such products, they are likely to yield positive gains from a real depreciation. This group represents the extensive margin of trade from which Egypt can benefit more with a real depreciation of the Egyptian pound.
Third, we identify products for which Egypt has a comparative advantage but which are not sensitive to real depreciation (30 products with a share of 26% in total exports). This group encompasses: articles of apparel and clothing accessories, not knitted or crocheted; albuminoidal substances; soap and washing preparations; tobacco; cocoa and cocoa preparations; edible products of animal origin; paper yarn and woven fabrics of paper yarn; articles of iron or steel; carpets and other textile floor coverings; ceramic products; sugars and sugar confectionery; essential oils and resinoids; perfumery; fertilizers; preparations of vegetables, fruit, nuts, or other parts of plants; inorganic chemicals; organic or inorganic compounds of precious metals; man-made filaments; live trees and other plants, bulbs, roots and the like; cut flowers and ornamental foliage; aluminum and articles thereof; and wool, fine or coarse animal hair. As this group is not likely to be affected by the recent developments in the exchange rate, one cannot expect export growth driven by currency depreciation. This is why it is important to maintain their competitiveness despite an insensitivity with respect to the exchange rate, especially for products that are in high demand among the rest of the world.
Fourth, at the sectoral level, the intensive margin seems to matter for some products more than others. Indeed, the most beneficial group includes products that are sensitive to real depreciations and for which Egypt has a comparative advantage (18 products, accounting for a share of 56% in the value of total exports). These products include edible vegetables and certain roots and tubers; edible fruit and nuts, peel of citrus fruit or melons, oil seeds and oleaginous fruits; animal or vegetable fats and oils and their cleavage products, prepared edible fats; mineral fuels, mineral oils, and products of their distillation; miscellaneous chemical products, plastics and articles thereof; paper and paperboard, articles of paper pulp, paper, or paperboard; cotton; man-made staple fibers; articles of apparel and clothing accessories, knitted or crocheted, other made-up textile articles, worn clothing and worn textile articles; articles of stone, plaster, cement, asbestos, mica, or similar materials; glass and glassware; copper and articles thereof; lead and articles thereof; miscellaneous manufactured articles. Our findings are relatively in line with Bahmani-Oskooee and Hosny (2013) who found that some industries will benefit from the real depreciation of the Egyptian pound, such as live animals other than those of this division; dairy products; birds eggs; vegetables, fruit, coffee, tea, cocoa, spices, manufactured food and miscellaneous edible products and preparations; oil seeds, oleaginous fruits; crude fertilizers and crude minerals; fixed vegetable fats; oils crude and refined; inorganic chemicals; medicinal and pharmaceutical products; paper, paperboard, articles of paper pulp; non-metallic minerals; electrical machinery; prefabricated buildings, sanitary ware, plumbing, heating, and furniture and parts thereof; bedding, mattresses. This group falls mainly in the intensive margin of trade as it represents Egypt’s traditional exports.
5.4. Country Regressions
In order to determine the destinations that respond more to exchange rate developments, we run the regressions at the country level. Table 10 shows that four groups of countries can be identified. First, traditional markets, such as Spain and Italy, have a large share in Egypt’s exports and are highly sensitive to the exchange rate movements, regardless of the measure of the exchange rate that we use. For this group, Egypt should take advantage of its presence on those markets and of the sensitivity to the pound depreciation to increase its exports. Second, other European countries have a lower sensitivity to the exchange rate but also account for a large share in Egypt’s trade, such as Germany, France, and the Netherlands. These destinations are not likely to be affected by the recent developments of the exchange rate. Hence, Egypt’s exports to these destinations should remain high, though constant. The same analysis applies to some Arab countries, such as Lebanon and Jordan. Third, some African and Asian countries are highly sensitive to the exchange rate even though their share in Egypt’s trade is relatively low, such as Pakistan, Burkina Faso, Guinea, and Zambia. Obviously, these countries represent potential export markets since their demand is sensitive to Egypt’s exchange rate. This potential increase is related to the extensive margin mentioned above. Finally, the last group includes countries that have a low share in Egypt’s exports and that are not sensitive to the exchange rate, such as Portugal and Sri Lanka. In general, sensitive markets represent 36% of Egypt’s total exports, as shown in Table 10.
| Rank | REER2 | REER1 | Misal | |||
|---|---|---|---|---|---|---|
| Country | Share (%) | Country | Share (%) | Country | Share (%) | |
| 1 | ITA | 7.28 | ITA | 7.28 | ITA | 7.28 |
| 2 | ESP | 3.20 | ESP | 3.20 | ESP | 3.20 |
| 3 | RUS | 1.29 | RUS | 1.29 | BFA | 0.04 |
| 4 | ZMB | 0.08 | ZMB | 0.08 | SWE | 0.14 |
| 5 | BFA | 0.04 | GBR | 4.43 | TTO | 0.00 |
| 6 | GIN | 0.05 | PAK | 0.70 | PAK | 0.70 |
| 7 | GBR | 4.43 | BDI | 0.04 | RUS | 1.29 |
| 8 | PAK | 0.70 | BEL | 1.74 | BDI | 0.04 |
| 9 | MUS | 0.10 | TUR | 5.80 | GIN | 0.05 |
| 10 | NOR | 0.06 | LTU | 0.06 | NOR | 0.06 |
| 11 | BDI | 0.04 | UKR | 0.34 | MOZ | 0.03 |
| 12 | MOZ | 0.03 | CZE | 0.10 | GBR | 4.43 |
| 13 | UKR | 0.34 | MLI | 0.04 | MUS | 0.10 |
| 14 | LTU | 0.06 | MOZ | 0.03 | LBN | 2.93 |
| 15 | MLI | 0.04 | GIN | 0.05 | LBR | 0.03 |
| 16 | CIV | 0.14 | CIV | 0.14 | LVA | 0.03 |
| 17 | PRT | 0.44 | BFA | 0.04 | MDV | 0.01 |
| 18 | BEL | 1.74 | IRN | 0.27 | ZMB | 0.08 |
| 19 | CZE | 0.10 | DEU | 2.70 | ||
| 20 | DEU | 2.70 | NLD | 2.46 | ||
| 21 | SWE | 0.14 | MDV | 0.01 | ||
| 22 | FRA | 3.31 | CMR | 0.13 | ||
| 23 | IRL | 0.14 | PRT | 0.44 | ||
| 24 | LBN | 2.93 | LKA | 0.09 | ||
| 25 | QAT | 1.09 | ZAF | 1.37 | ||
| 26 | MDV | 0.01 | IND | 1.49 | ||
| 27 | HUN | 0.05 | JOR | 2.31 | ||
| 28 | COG | 0.08 | ||||
| 29 | TUR | 5.80 | ||||
| Total | 36.40 | 36.65 | 20.44 | |||
Source: Constructed by the authors. Misal, exchange rate misalignment; REER, real effective exchange rate; REER2, real effective exchange rate measured by Noureldin (2017). For country codes, see Appendix 2.
Destinations ranking and exchange rate sensitivity
6. CONCLUSION AND POLICY IMPLICATIONS
This paper examines the effect of the exchange rate devaluation on the quantity and value of exports (intensive margin of trade), as well as the ability to export new products and/or venture into new export markets (extensive margin of trade). Using monthly firm-level and sector-level data for the period 2005–2016, the study is applied to Egypt, which appears to be an interesting case to investigate after several changes de jure and de facto in its exchange rate regime. The exchange rate is measured by the real effective exchange rate and the exchange rate misalignment. At the intensive margin level, the results show that, while a depreciation of the RER increases the value of exports, the quantity of exports is not affected, highlighting the fact that the price effect is more significant than the quantity effect. For the extensive margin, the number of destinations and the number of products respond positively to the exchange rate depreciation. However, at the sectoral level, the intensive margin seems to matter for some products more than others. This is in line with the assumption that RER depreciation/undervaluation is likely to generate a potential comparative advantage in new and more sophisticated exportable goods and services.
Four important conclusions and policy implications are drawn from our results. First, it is worth investigating if the serious exchange rate devaluation that Egypt is experiencing lately, is likely to promote export performance at both the intensive and extensive margins.
Second, a major finding in this paper is that the value, and not the quantity, of exports is positively affected by a real depreciation of the pound. Several factors might explain why the pound depreciation might have a limited effect on Egypt’s export volume and trade balance. In fact, as a rough rule of thumb, a 10% devaluation may increase prices by 2–3%. Moreover, imports are inelastic as 75% of the imported goods are either intermediate, investment, raw materials, and fuel necessary for both production and exports. Therefore, since devaluation leads to higher import prices, raw materials used in production increase in price and contribute to cost-push inflation. To some extent, higher raw material costs offset the lower export prices. Ahmed et al. (2015) argued that as countries are more integrated in global production processes, a currency depreciation only improves the competitiveness of a fraction of the value of final goods exports. In line with this intuition, the analysis finds evidence that the rise of participation in global value chains explains, on average, 40% of the fall in the elasticity, and that corrections of the real effective exchange rate for participation in global value chains do not present the same decreasing pattern in elasticity. This is why Hummels et al. (2001) also found that the use of imported inputs in producing goods that are exported (vertical specialization) accounts for 21% of OECD exports, and grew almost 30% between 1970 and 1990. They also found that growth in vertical specialization accounts for 30% of the growth in these countries’ exports. Second, a devaluation might have a limited effect if the country’s main export partners are in a recession. Indeed, the Eurozone, which is Egypt’s main trading partner, has weak growth. Thus, more competitive Egyptian exports might be insufficient to boost export demand. Third, Egyptian firms shall pass on the effects of devaluation. Indeed, while devaluation leads to a lower price of exports, firms may not choose to keep foreign currency prices as they are to increase their profit margins. Fourth, since depreciation affects demand, supply is not concerned. Hence, some studies argue that depreciation can reduce the incentive to be efficient because firms can become competitive without the effort of increasing productivity, which might make depreciation inefficient.
Moreover, two other important findings are related to the extensive margin: a stronger depreciation leads to an increase in the number of products exported and the number of destinations. Thus, real depreciation can be perceived as a tool to promote export diversification at both the product and market levels and to reduce Egypt’s dependence on specific products or destinations.
Finally, the depreciation of the Egyptian pound per se is not sufficient to boost Egyptian exports. This policy must be accompanied by other measures to guarantee an increase in exports. At the trade policy level, first, it is important to improve the quality of Egyptian exports. In fact, with low quality products and a significantly depreciated pound, exports might not find large markets. Second, taking advantage of preferential trade agreements between Egypt and the countries of the world is a must in order to have greater access to various foreign markets and amplify the benefits of a high depreciation. Third, improving administrative procedures and reducing bureaucracy and red tape costs shall increase incentives for producers and improve export competitiveness as such barriers are a deadweight loss for the economy. As per industrial policy, incentives are an important determinant of firms’ export performance. As argued by El-Haddad (2016), incentives should be performance-based, finite, pre-announced and enforced, and subject to constant independent monitoring and evaluation. In the same vein, as also suggested by El-Haddad (2016), it is crucial to improve the economy’s competitive environment and accentuate the equality of opportunity between all market players. Finally, in terms of investment policy, depreciation increases the flexibility of the foreign currency which reduces fears and uncertainty related to capital controls and caps on currency transfers. This consequently increases the flow of FDI in any country. Indeed, it has been shown that when financial openness is driven by FDI, it tends to reinforce the export promotion effect of the RER undervaluation/depreciation, because as the literature suggests, FDI is likely to induce technological development and, hence, enhance the productivity of exporting firms.
APPENDIX
Appendix 1.
| Not sensitive | Sensitive | |
| (41 products) | (8 products) | |
| No RCA | Printed books, newspapers, pictures and other products of the printing industry; manuscripts; Silk; Natural or cultured pearls, precious or semi-precious stones, precious metals; prepared feathers and down and articles made of feathers or of down, artificial flowers; Pulp of wood or of other fibrous cellulosic material; cork and articles of cork; headgear and parts thereof; other base metals, cermets; musical instruments, parts and accessories of such articles; impregnated, coated, covered or laminated textile fabrics; vehicles other than railway or tramway rolling stock, and parts and accessories thereof; tin and articles thereof; optical, photographic, cinematographic, measuring, checking, precision, medical or surgical; toys, games and sports requisites; pharmaceutical products; zinc and articles thereof; furskins and artificial fur; articles of leather, saddlery and harness, travel goods, handbags and similar containers; preparations of meat, of fish or of crustaceans, molluscs or other aquatic invertebrates; explosives, pyrotechnic products, matches, pyrophoric alloys; manufactures of straw, of esparto or of other plaiting materials; photographic or cinematographic goods; aircraft, spacecraft, and parts thereof; clocks and watches and parts thereof; tools, implements, cutlery, spoons and forks, of base metal; knitted or crocheted fabrics; arms and ammunition; parts and accessories thereof; machinery, mechanical appliances, nuclear reactors, boilers; parts thereof; live animals; meat and edible meat offal; works of art, collectors’ pieces and antiques; miscellaneous articles of base metal; coffee, tea and spices; nickel and articles thereof; footwear, gaiters and the like; parts of such articles; wood and articles of wood, wood charcoal; fish and crustaceans, molluscs and other aquatic invertebrates; beverages, spirits and vinegar; railway or tramway locomotives, rolling stock and parts thereof; railway or tramway track fixtures; commodities not elsewhere specified; ships, boats and floating structures. | Cereals; Residues and waste from the food industries, prepared animal fodder; Ores, slag and ash; Organic chemicals; Rubber and articles thereof; Umbrellas, sun umbrellas, walking sticks, seat-sticks, whips, riding-crops and parts thereof; Iron and steel; Electrical machinery and equipment and parts thereof; sound recorders and reproducers, television. |
| (30 products) | (18 products) | |
| RCA | Miscellaneous manufactured articles; articles of apparel and clothing accessories, not knitted or crocheted; Albuminoidal substances, modified starches; Soap, organic surface-active agents, washing preparations, lubricating preparations, artificial; Tobacco and manufactured tobacco substitutes; Cocoa and cocoa preparations; Dairy produce, birds’ eggs, natural honey, edible products of animal origin, not elsewhere; Other vegetable textile fibres, paper yarn and woven fabrics of paper yarn; Articles of iron or steel; Special woven fabrics, tufted textile fabrics, lace, tapestries, trimmings, embroidery; Carpets and other textile floor coverings; Ceramic products; Products of the milling industry, malt, starches, inulin; Furniture, bedding, mattresses, mattress supports, cushions and similar stuffed furnishings; Sugars and sugar confectionery; Preparations of cereals, flour, starch or milk; Essential oils and resinoids; Perfumery, cosmetic or toilet preparations; Fertilizers; Products of animal origin, not elsewhere specified or included; Salt, Sulphur, earths and stone; plastering materials, lime and cement; Wadding, felt and nonwovens, special yarns, twine, cordage, ropes and cables and articles thereof; Preparations of vegetables, fruit, nuts or other parts of plants; Vegetable plaiting materials, vegetable products not elsewhere specified or included; Inorganic chemicals;, organic or inorganic compounds of precious metals, of rare-earth metals; Man-made filaments, strip and the like of man-made textile materials; Raw hides and skins (other than furskins) and leather; Live trees and other plants, bulbs, roots and the like, cut flowers and ornamental foliage; Miscellaneous edible preparations; Aluminum and articles thereof; Lac, gums, resins and other vegetable saps and extracts; Wool, fine or coarse animal hair; horsehair yarn and woven fabric. | Edible vegetables and certain roots and tubers; Edible fruit and nuts, peel of citrus fruit or melons; Oil seeds and oleaginous fruits; miscellaneous grains, seeds and fruit; Animal or vegetable fats and oils and their cleavage products; prepared edible fats; mineral fuels, mineral oils and products of their distillation, bituminous substances; tanning or dyeing extracts, tannins and their derivatives, pigments and other coloring; miscellaneous chemical products; plastics and articles thereof; paper and paperboard; articles of paper pulp, of paper or of paperboard; cotton; man-made staple fibers; articles of apparel and clothing accessories, knitted or crocheted; other made-up textile articles, worn clothing and worn textile articles; articles of stone, plaster, cement, asbestos, mica or similar materials; glass and glassware; copper and articles thereof; lead and articles thereof; miscellaneous manufactured articles. |
Source: Constructed by the authors.
Comparative Advantage and Exchange Rate Sensitivity
Appendix 2. Country Codes
| Code | Country |
|---|---|
| ABW | Aruba |
| AFG | Afghanistan |
| AGO | Angola |
| AIA | Anguilla |
| ALB | Albania |
| AND | Andorra |
| ANT | Netherland Antilles |
| ARE | United Arab Emirates |
| ARG | Argentina |
| ARM | Armenia |
| ATF | French Southern Antartic territories |
| ATG | Antigua and Barbuda |
| AUS | Australia |
| AUT | Austria |
| AZE | Azerbaijan |
| BDI | Burundi |
| BEL | Belgium and Luxembourg |
| BEN | Benin |
| BFA | Burkina Faso |
| BGD | Bangladesh |
| BGR | Bulgaria |
| BHR | Bahrain |
| BHS | Bahamas |
| BIH | Bosnia and Herzegovina |
| BLR | Belarus |
| BLZ | Belize |
| BMU | Bermuda |
| BOL | Bolivia |
| BRA | Brazil |
| BRB | Barbados |
| BRN | Brunei Darussalam |
| BTN | Bhutan |
| BWA | Botswana |
| CAF | Central African Republic |
| CAN | Canada |
| CCK | Cocos (Keeling) Islands |
| CHE | Switzerland |
| CHL | Chile |
| CHN | China |
| CIV | Côte d’Ivoire |
| CMR | Cameroon |
| COG | Congo |
| COK | Cook Islands |
| COL | Colombia |
| COM | Comoros |
| CPV | Cape Verde |
| CRI | Costa Rica |
| CUB | Cuba |
| CXR | Christmas Island |
| CYM | Cayman Islands |
| CYP | Cyprus |
| CZE | Czech Republic |
| DEU | Germany |
| DJI | Djibouti |
| DMA | Dominica |
| DNK | Denmark |
| DOM | Dominican Republic |
| DZA | Algeria |
| ECU | Ecuador |
| EGY | Egypt |
| ERI | Eritrea |
| ESH | Western Sahara |
| ESP | Spain |
| EST | Estonia |
| ETH | Ethiopia |
| FIN | Finland |
| FJI | Fiji |
| FLK | Falkland Islands |
| FRA | France |
| FRO | Faroe Islands |
| FSM | Micronesia (Federated States of) |
| GAB | Gabon |
| GBR | United Kingdom |
| GEO | Georgia |
| GHA | Ghana |
| GIB | Gibraltar |
| GIN | Guinea |
| GLP | Guadeloupe |
| GMB | Gambia |
| GNB | Guinea-Bissau |
| GNQ | Equatorial Guinea |
| GRC | Greece |
| GRD | Grenada |
| GRL | Greenland |
| GTM | Guatemala |
| GUF | French Guiana |
| GUY | Guyana |
| HKG | Hong Kong |
| HND | Honduras |
| HRV | Croatia |
| HTI | Haiti |
| HUN | Hungary |
| IDN | Indonesia |
| IND | India |
| IRL | Ireland |
| IRN | Iran |
| IRQ | Iraq |
| ISL | Iceland |
| ISR | Israel |
| ITA | Italy |
| JAM | Jamaica |
| JOR | Jordan |
| JPN | Japan |
| KAZ | Kazakhstan |
| KEN | Kenya |
| KGZ | Kyrgyzstan |
| KHM | Cambodia |
| KIR | Kiribati |
| KNA | Saint Kitts and Nevis |
| KOR | Korea |
| KWT | Kuwait |
| LAO | Lao People’s Democratic Republic |
| LBN | Lebanon |
| LBR | Liberia |
| LBY | Libyan Arab Jamahiriya |
| LCA | Saint Lucia |
| LKA | Sri Lanka |
| LSO | Lesotho |
| LTU | Lithuania |
| LUX | Luxembourg |
| LVA | Latvia |
| MAC | Macau (Aomen) |
| MAR | Morocco |
| MDA | Moldova, Rep. of |
| MDG | Madagascar |
| MDV | Maldives |
| MEX | Mexico |
| MHL | Marshall Islands |
| MKD | Macedonia (the former Yugoslav Rep. of) |
| MLI | Mali |
| MLT | Malta |
| MMR | Burma |
| MNG | Mongolia |
| MNP | Northern Mariana Islands |
| MOZ | Mozambique |
| MRT | Mauritania |
| MSR | Montserrat |
| MTQ | Martinique |
| MUS | Mauritius |
| MWI | Malawi |
| MYS | Malaysia |
| NAM | Namibia |
| NCL | New Caledonia |
| NER | Niger |
| NFK | Norfolk Island |
| NGA | Nigeria |
| NIC | Nicaragua |
| NIU | Niue |
| NLD | Netherlands |
| NOR | Norway |
| NPL | Nepal |
| NRU | Nauru |
| NZL | New Zealand |
| OMN | Oman |
| PAK | Pakistan |
| PAL | Palestine |
| PAN | Panama |
| PCN | Pitcairn |
| PER | Peru |
| PHL | Philippines |
| PLW | Palau |
| PNG | Papua New Guinea |
| POL | Poland |
| PRI | Puerto Rico |
| PRK | Korea, (Democratic People’s Republic of) |
| PRT | Portugal |
| PRY | Paraguay |
| PYF | French Polynesia |
| QAT | Qatar |
| REU | Reunion |
| ROM | Romania |
| RUS | Russian Federation |
| RWA | Rwanda |
| SAU | Saudi Arabia |
| SDN | Sudan |
| SEN | Senegal |
| SGP | Singapore |
| SHN | Saint Helena |
| SLB | Solomon Islands |
| SLE | Sierra Leone |
| SLV | El Salvador |
| SMR | San Marino |
| SOM | Somalia |
| SPM | St. Pierre and Miquelon |
| STP | Sao Tome and Principe |
| SUR | Suriname |
| SVK | Slovakia |
| SVN | Slovenia |
| SWE | Sweden |
| SWZ | Swaziland |
| SYC | Seychelles |
| SYR | Syrian Arab Republic |
| TCA | Turks and Caicos Islands |
| TCD | Chad |
| TGO | Togo |
| THA | Thailand |
| TJK | Tajikistan |
| TKL | Tokelau |
| TKM | Turkmenistan |
| TMP | East Timor |
| TON | Tonga |
| TTO | Trinidad and Tobago |
| TUN | Tunisia |
| TUR | Turkey |
| TUV | Tuvalu |
| TWN | Taiwan |
| TZA | Tanzania, United Rep. of |
| UGA | Uganda |
| UKR | Ukraine |
| URY | Uruguay |
| USA | United States of America |
| UZB | Uzbekistan |
| VCT | Saint Vincent and the Grenadines |
| VEN | Venezuela |
| VGB | British Virgin Islands |
| VNM | Viet Nam |
| VUT | Vanuatu |
| WLF | Wallis and Futuna |
| WSM | Samoa |
| YEM | Yemen |
| YUG | Serbia and Montenegro |
| ZAF | South Africa |
| ZAR | Congo (Democratic Republic of the) |
| ZMB | Zambia |
| ZWE | Zimbabwe |
Source: CEPII dataset.
Footnotes
The RCA index of country i for product j is often measured by the product’s share in the country’s exports in relation to its share in world trade: RCAij = (xij/Xit) / (xwj/Xwt) where xij and xwj are the values of country i’s exports of product j and world exports of product j and where Xit and Xwt refer to the country’s total exports and world total exports. A value less than unity implies that the country has a revealed comparative disadvantage in the product. Similarly, if the index exceeds unity, the country is said to have a RCA in the product.
In order to determine the number of destinations, we counted the number of destinations by firm, month, and year. Moreover, it is important to note that both GDP and distance have been averaged across destinations. Other gravity variables were not included as this regression does not have a bilateral dimension.
This mapping was done at the HS2 level as the RCA index is available at the HS2 only.
REFERENCES
Cite this article
TY  - JOUR
AU  - Chahir Zaki
AU  - Alia Abdallah
AU  - May Sami
PY  - 2019
DA  - 2019/06/18
TI  - How Do Trade Margins Respond to Exchange Rate? The Case of Egypt✩
JO  - Journal of African Trade
SP  - 60
EP  - 80
VL  - 6
IS  - 1-2
SN  - 2214-8523
UR  - https://doi.org/10.2991/jat.k.190528.001
DO  - 10.2991/jat.k.190528.001
ID  - Zaki2019
ER  -