
Infrastructure, trade facilitation, and network connectivity in Sub-Saharan Africa☆,☆☆
- DOI
- 10.1016/j.joat.2017.05.001How to use a DOI?
- Keywords
- Trade; Global value chains; Connectivity; Infrastructure; Trade facilitation; Sub-Saharan Africa
- Abstract
This paper uses new measures of value added in exports in two sectors (textiles and clothing, and agriculture) to examine the linkages between trade facilitation and infrastructure on the one hand, and value chain participation on the other. It applies network analysis methods to derive a summary measure of value chain connectivity for 189 countries, including 44 in Sub-Saharan Africa. There is a statistically significant association between this measure and summary indicators of infrastructure development and trade facilitation performance. Moreover, it is not only a country’s own performance that matters, but also that of its neighbors. The regional dimension of infrastructure and trade facilitation policies is an important determinant of particularly SSA countries’ ability to connect to global value chains.
- Copyright
- © 2017 Afreximbank. Production and hosting by Elsevier B.V. All rights reserved.
- Open Access
- This is an open access article under the CC BY-NC license (http://creativecommons.org/licences/by-nc/4.0/).
1. Introduction
Global and regional value chains (GVCs) are an important way of organizing production, trade, and investment in a wide variety of sectors. The term “value chain” refers to the full range of processes involved in the design, production, and distribution of a final product. It stretches from far upstream—activities like research and development—to downstream activities such as assembly, distribution, marketing, and after sales service. The distinctive property of GVCs is that these activities are spread across multiple countries, often in the same neighborhood, but sometimes also in different parts of the world. Each firm that is part of a GVC specializes in a particular task, and the lead firm brings all the various tasks together through the supply of headquarters services, coordinating all inputs of goods and services to produce the final product and get it to the consumer.
The GVC paradigm potentially offers a new model to developing countries looking to build up their industrial base (e.g., Baldwin, 2013). In themselves, GVCs are neither wholly good nor wholly bad for development. On the positive side, they provide relatively low cost ways of linking to international trade networks, and allow countries to specialize in activities that are aligned with their comparative advantage. Developing countries can benefit through income and employment effects, even if they specialize in low value added activities, such as assembly. However, concerns have been expressed that GVCs run the risk of locking countries into those activities, and not promoting industrial or social upgrading over time. Clearly, the challenge of moving up a value chain into higher value added activities—which typically have important economic spillovers—looms large for many developing countries.
This paper does not seek to resolve the ongoing debate over the development merits of GVCs either generally, or in terms of their specific effects in a particular country or region. Instead, it starts from the position that GVCs can—under the right circumstances, including the presence of appropriate complementary policies—offer important economic and development benefits to developing countries. Against that background, the motivating question for this paper is as follows: how can traditionally marginalized countries in Sub-Saharan Africa (SSA) join GVCs, and improve their position in the global network of value added trade? In particular, what is the role of regional approaches to infrastructure and trade facilitation policies? These questions are important because of income-based linkages between trade and important economic and development outcomes, including poverty. This paper therefore focuses on one way in which regional infrastructure and trade facilitation can contribute to economic growth, development, and, as a consequence, poverty reduction, by examining the intermediate link to GVC participation.
There are good reasons to believe that trade costs are a key determinant of the pattern of trade and production under the GVC paradigm. For example, Saslavsky and Shepherd (2014) show that trade in parts and components—which typically takes place within GVCs—is more sensitive to improvements in logistics performance than is trade in final goods. Similarly, Ma et al. (2009) find that China’s processing trade—a key part of its GVC participation—is linked to upstream and downstream trade costs. Infrastructure and trade facilitation are important components of trade costs (Arvis et al., 2013), so it is reasonable to expect that they would influence the ability of a country to connect with GVCs.
This paper makes a number of contributions with respect to the previous literature. First, it provides the first quantitative analysis of trade in value added—an indicator of GVC trade—for SSA. Existing work on value chains in SSA is typically qualitative, or limited to analyzing the ways in which value added is divided up among different actors in the chain. Quantitative work on value added trade has been limited to developed countries, and a small number of developing countries, mostly in Asia. This paper uses a new dataset to provide estimates of domestic value added content in exports for two sectors, textiles and clothing and agriculture, for 189 countries, including 44 in SSA.
Second, I build on recent applications of network analysis methods to economic phenomena (e.g., Acemoglu et al., 2012) to construct a measure of value chain connectivity in the two example sectors, again for 189 countries. The index is calculated for 1996, 2001, 2006, and 2011. Performance is compared across regions, and SSA’s position in the global trade network is clearly put in perspective.
Third, I use national and regional measures of infrastructure and trade facilitation performance to analyze the ways in which value chain connectivity is determined by those two variables. There are strong indications in the data that interventions at both levels have considerable scope to improve value chain connectivity, particularly in textiles and clothing. Among the various types of infrastructure considered, maritime connectivity and air connectivity appear to be particularly important. The regional dimension is important in part because it captures spillovers from national policies, as well as coordinated efforts across borders.
Against this background, the paper proceeds as follows. In the next section, I describe the data used and the ways in which they are treated. Section 3 conducts a preliminary analysis of the data using graphical methods. Section 4 contains the paper’s empirical models and results, and Section 5 concludes and discusses policy implications of my findings.
2. Data
This section presents the paper’s dataset and discusses basic treatment undertaken to produce measures of trade in value added, as well as indices of connectivity and regional and national infrastructure and trade facilitation performance.
2.1. Trade in value added for SSA
The starting point for this project is the Eora dataset, which brings together interlinked input–output tables for 189 countries, including 44 in SSA. The methods used to collect the underlying data for Eora are set out in detail in Lenzen et al. (2012) and Lenzen et al. (2013). The database covers 26 sectors. GVCs are not active in all sectors, however, and in particular may not be active in SSA. For the purposes of this study, two example sectors are therefore used: textiles and clothing, and agriculture. Both sectors are of interest to developing countries in the low and middle income groups, and often represent feasible industries in the early stages of industrialization. A number of SSA countries are known from case study work to be involved in value chains in both sectors, which reinforces the pertinence of this choice.
The advantage of a source like Eora is that it can be manipulated to produce measures of value added trade. Value added trade data differ from traditional trade data in that they identify the value added content of exports, by netting out intermediate input use and reflected flows among other factors. Traditional data sources, such as UN COMTRADE, do not net out intermediates: trade is measured on a gross shipments, rather than value added, basis. In all countries, value added trade is less than gross shipments trade, often substantially so when GVC participation is high (reflected in the use of imported intermediates). Value added trade data have recently been produced by the OECD and WTO working together (the Trade in Value Added, TiVA, dataset), a consortium working under the World Input Output Database (WIOD) umbrella, and by UNCTAD using Eora data. The TiVA and WIOD data do not have good coverage in the developing world, and are particularly sparse in SSA, thereby making them ill adapted to the present study. The version of the UNCTAD database that has been released provides country aggregates, but not bilateral trade data, which is again ill adapted to the study of GVCs, which are network business models consisting of webs of bilateral interactions.
With this in mind, this project has gone back to the most basic Eora data—input–output relationships—to develop its own measures of domestic value added in exports. The approach follows Koopman et al. (2010), who provide an encompassing framework for previous important contributions such as Hummels et al. (2001), and Johnson and Noguera (2012). Using the Leontief inverse and identities from the input–output system literature, it is possible to derive a matrix of bilateral value added trade flows for all 189 countries in the Eora database. Each element in the matrix represents the domestic value added in exports from country i to country j.
It is important to be clear at the outset that Eora relies on input–output tables for developing countries, including a large number in SSA. Those tables are necessarily noisy, as are trade and production data for the countries of interest. In many cases, data are imputed rather than measured directly, which necessarily creates additional noise. It is therefore likely that future work on value added trade in Africa will be able to refine the estimates presented here. This paper is the first to use value added trade data for Africa in an analytical setting, but results are presented for their initial indicative value, and with full knowledge of the limitations of the underlying dataset. The data are the best currently available, so the approach adopted here is to favor presenting initial information in the interests of promoting future inquiry, rather than to refrain from any analysis at all due to data concerns.
2.2. Measuring value chain connectivity
The Eora trade in value added data measure the domestic value added content of exports from country i to country j. GVCs are networks of value added trade transactions, involving complex movements of goods and services across borders, usually multiple times. As such, network analysis methods can be useful in summarizing the properties of the bilateral value added trade matrix, and deriving numerical summaries of country performance that take account of all interactions in the network.
Economists have recently turned their attention to the application of network analysis methods originally developed by applied mathematicians and computer scientists. These approaches can be used to better understand economic phenomena that take place in network contexts. For example, Acemoglu et al. (2012) model economy-wide input output relationships as a network, and derive a simple, theory-based measure of the volatility to which each sector is subject due to shocks that occur elsewhere in the network. That measure is related to the concept of centrality, which describes how important each node is in the context of the full set of network flows. Shepherd and Archanskaia (2014) apply a similar intuition to a network of trade in value added using data produced by the OECD and WTO. They use the concept of eigenvector centrality to summarize each country’s position in the network. A country has a higher eigenvector centrality score if it is well connected to other countries that are themselves well connected. The name of the indicator stems from the fact that it is calculated using the principal eigenvector of the bilateral trade share matrix, i.e. the value added trade matrix with each entry deflated by the column sum.
This paper similarly adopts eigenvector centrality as a measure of value chain connectivity for the textiles and clothing and agriculture sectors. It is calculated using the Eora data referred to above. Scores are therefore produced for all 189 countries in the database, including all countries in SSA. The data and their implications for SSA are analyzed below.
2.3. Infrastructure and trade facilitation: national and regional data
In addition to understanding the network character of GVCs that include SSA countries in sectors such as textiles and clothing and agriculture, an important part of this paper is to understand the role that trade facilitation, and particularly infrastructure, can play in enabling countries to better connect to GVCs. It is therefore also important to collect data on those two variables for as many of the 189 Eora countries as possible. In addition, an objective of this research is to examine the extent to which the regional dimension is important for developing value added trade linkages through boosting infrastructure and trade facilitation performance, so it will be important to manipulate the data to produce regional measures in addition to own country measures.
At this stage, five infrastructure and trade facilitation variables have been identified as being of particular interest. The first is the infrastructure component of the World Bank’s Logistics Performance Index (Arvis et al., 2015). It measures the quality of trade and transport-related infrastructure, and is based on a survey of international logistics professionals such as freight forwarders and express carriers. A second important piece of data is the Liner Shipping Connectivity Index produced by UNCTAD. That data series summarizes each (maritime) country’s ability to connect to international shipping networks in terms of volume, frequency, and type of service. Third, and of particular importance to some GVCs, is the World Bank’s Air Connectivity Index (Arvis and Shepherd, 2011). Created using network analysis methods, the index summarizes each country’s ability to access global air transport markets to move its goods rapidly across borders. Fourth, intra-African trade is often reliant on road transport, so it is important to have data on road network length, sourced from the CIA World Factbook. Unlike the other indicators, the data on road network length do not capture strictly international connections—no data are available that do so. They are therefore used as a proxy only. Fifth, it is important to recall that soft infrastructure is also important to trade facilitation and connectivity: to that end, each country’s average score on the OECD’s Trade Facilitation Indicators is also included. The TFIs capture the extent of a country’s implementation of core trade facilitation disciplines through regulations and procedures, and reflects its preparedness in terms of the WTO Trade Facilitation Agreement.
The value added trade matrix is available for both example sectors for the years 1996, 2001, 2006, and 2011 (the latest year available in the Eora dataset). Infrastructure and trade facilitation data are not available for all of these years, so the econometric analysis is conducted on a purely cross-sectional basis for the year 2011.
It is important to highlight that data have been collected for all 189 Eora countries. The purpose is to ensure the largest effective sample, and greatest effective variation, from a statistical point of view. However, the focus of the project is on SSA, so the particular implications for SSA countries will be the focus of this paper.
3. Preliminary analysis
As a preview of the types of results found in the core empirical section of the paper, this section conducts an initial assessment of the data, focusing on two aspects. First, the Eora bilateral trade in value added data are presented using tools borrowed from network analysis. The emphasis is on laying bare the basic structure of the network, analyzing SSA’s position in it and relationship to other regions, and looking at changes over time. In the second subsection, graphical methods are used to examine the associations between infrastructure and trade facilitation measures on the one hand, and this paper’s indicator of value chain connectivity on the other. National and regional dimensions are both considered.
3.1. SSA in the value added trade network
Visual representation can provide important information on the dynamics underlying network phenomena. However, the full network of value added trade in this case—35,532 bilateral links observed over four years for two sectors—makes a full representation unhelpful due to its complexity. Instead, as a starting point the network is simplified to the maximum possible extent, in the hope that this will make it possible to identify some important stylized facts. To that end, only the largest bilateral trade flow is retained for each country in each sector, and only the endpoints of the sample period (1996 and 2011) are examined.
There is no unique visual representation of a matrix of bilateral trade flows as a network. It is necessary to make a methodological choice as to which of the available algorithms will be used. In this case, a force directed algorithm is deployed. That algorithm groups countries together based on common export destinations and shared trade links, and uses a physical analogy to separate countries and even partition them into different sub-samples based on the closeness of links within groups and the relative sparseness of links between groups.
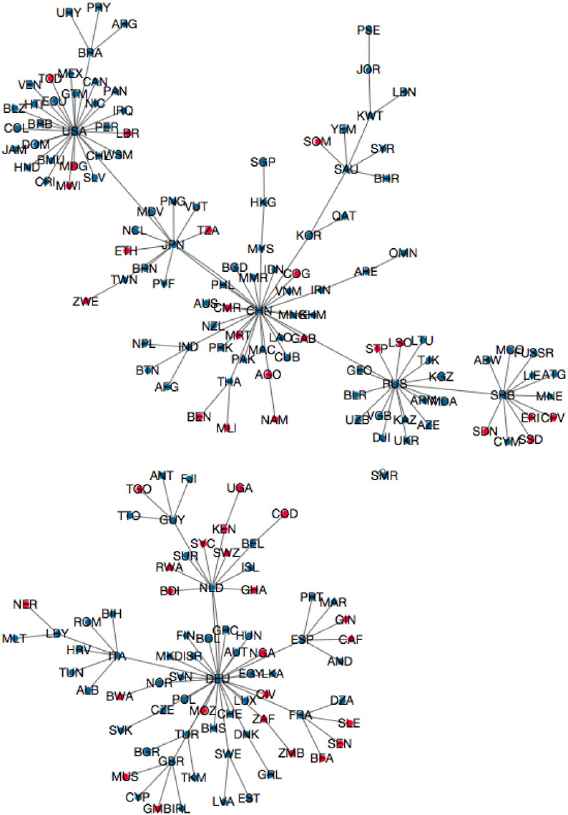
Figs. 1 and 2 present results for textiles and clothing. SSA countries are marked in red, all others in blue. If two countries are linked, it means that one of them has its largest export flow with the other. The trade network is heavily centered on the USA in both years. In addition, significant links between the American and European trading blocs develop towards the end of the sample, but Asia decouples to form its own distinct economic area. The rise of China as a central point in the network is notable, and is in line with well-known stylized facts following the progressive liberalization of the sector mandated by the WTO’s Agreement on Textiles and Clothing. SSA countries begin the sample period closely linked to the USA, and in some cases also to traditional European markets, but by 2011 they have spread out to have different main linkages depending on the country. Some remain tied to the USA and Europe, but others have linked into the Asian market centered on China. In this sector, there have therefore been significant changes in SSA’s pattern of value added exports, which are reflective in part of its changing interactions with GVCs.
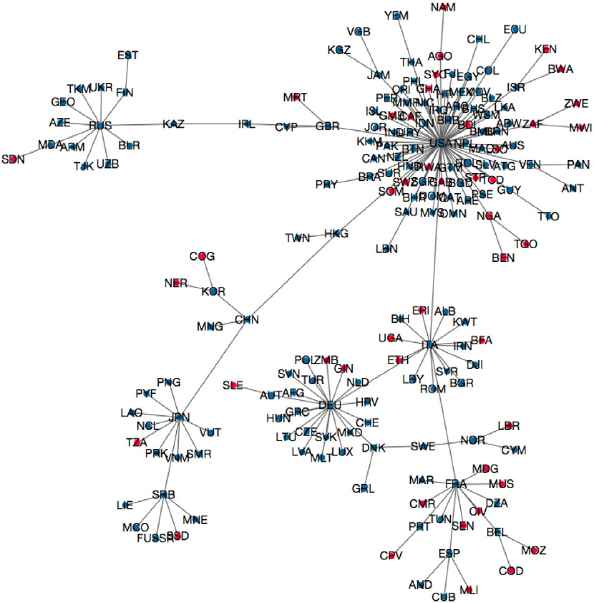
Network of value added trade in textiles and clothing, 1996, largest export flow only.
Network of value added trade in textiles and clothing, 2011, largest export flow only.
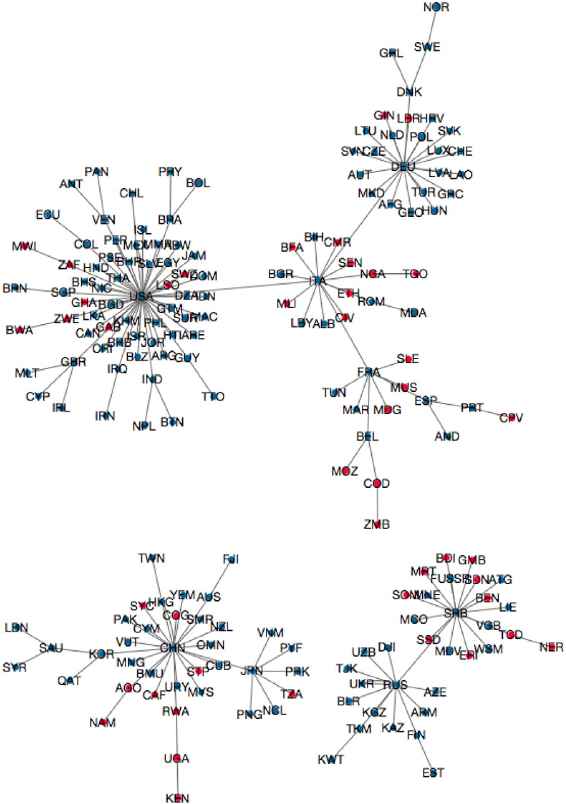
Figs. 3 and 4 take the same approach to the trade in value added data for agriculture. In both figures, the first stylized fact that emerges is the existence of two main “blocs” of agricultural trade: one centered on the USA, which links to Asia, and another centered on Europe. A second fact that comes out of a comparison of the two figures is that between 1996 and 2011, the number of SSA countries that have their main agricultural trade link with the USA drops, with the main shift taking place towards Asia, and in particular China. Traditional markets in Europe also remain important. From the perspective of understanding value added trade activity involving SSA—including through GVCs—the role of Europe and Asia will therefore be crucial.
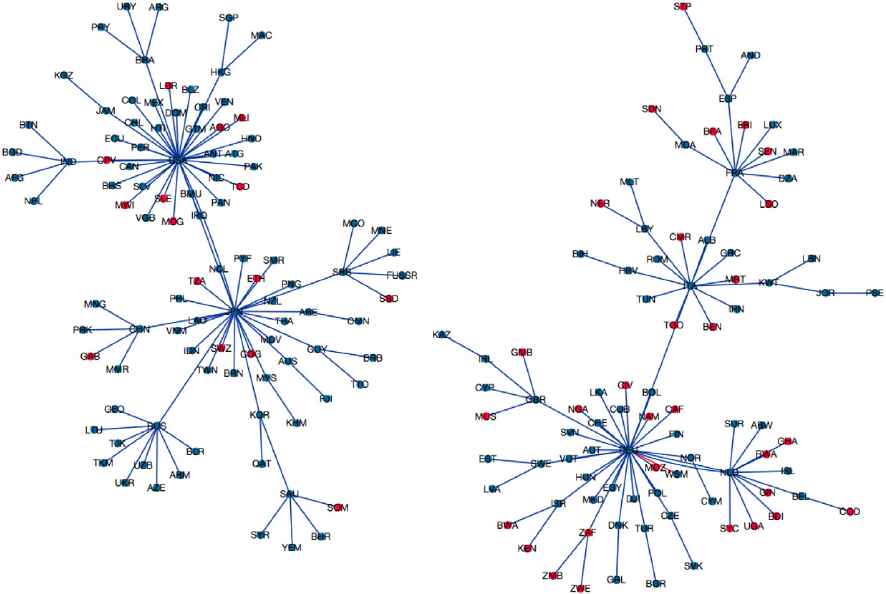
Network of value added trade in agriculture, 1996, largest export flow only.
Network of value added trade in agriculture, 2011, largest export flow only.
One striking fact to emerge from Figs. 1–4 is that African countries have their largest trading links with a wide variety of other nations, typically from other regions. Although there is some evidence of important intra-African trade links, the central economies for African trade in these sectors are nonetheless by and large Europe, Asia, and the USA. The dispersion of red nodes around the figure shows that Africa’s trade lacks regional coherence. Of course, it is important to emphasize that the trade flows analyzed here are formal. If informal trade were to be considered, intra-African trade would be considerably larger than it is estimated to be here. There would likely be a somewhat greater degree of regional trading identity for Africa, but it is unlikely that the core insight—that Africa’s trade centers on other regions—would be undone. In any case, reliable data on informal trade are not widely available, and it is not possible to quantify it in a cross-country setting like the one being used here. Another issue is that exchanges of value added can take place in a variety of different relational contexts between firms, and micro-level research is necessary to identify particular flows with the operation of value chains, as opposed to traditional point-to-point trade transactions.
In addition to graphical methods, this project uses eigenvector centrality to summarize each country’s connectivity with respect to global markets for value added in the two example sectors. The procedure is simple: each country’s connectivity score is equal to the corresponding entry in the principal eigenvector of the value added trade matrix, the entries of which are deflated by country sums and thus represent export shares. Eigenvector centrality has previously been used by Shepherd and Archanskaia (2014) and De Benedictis et al. (2013) as an indicator of a country’s overall place in the global trade network.
Results from the eigenvector centrality (connectivity) calculations based on the full trade matrix (not just the largest flow, as in Figs. 1–4) are presented in Figs. 5 and 6. Kernel densities show the distribution of scores across all 189 countries, and can be thought of as a kind of smoothed histogram. Results are quite similar between the two sectors: a few countries have high connectivity scores, but most have very low scores. This pattern is consistent with a hub-and-spoke setup in which those countries with high scores act as global trade hubs, and other countries act as more peripheral spokes. As suggested by the network graphics, SSA countries are generally spokes in the international trade network, with low connectivity scores. The average for SSA is only 0.003 in textiles and clothing, compared with 0.02 for the Middle East and North Africa and Latin America and the Caribbean, 0.05 for Europe and Central Asia, 0.13 for South Asia, and 0.31 for East Asia and the Pacific. The highest ranked SSA country is South Africa, with a score of 0.05, which is still quite low by world standards. These results suggest that SSA is at real risk of being marginalized from developments in the GVC economy.
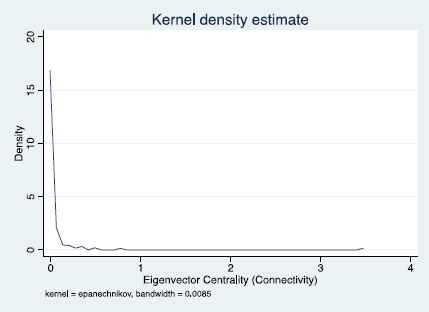
Eigenvector centrality (connectivity) for textiles and clothing, 2011.
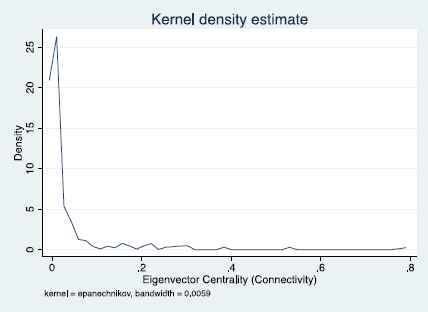
Eigenvector centrality (connectivity) for agriculture, 2011.
To gain a fuller picture of SSA’s position in the value added trade networks for agriculture and textiles and clothing, it is useful to compare performance with other World Bank developing regions, and track it through time using data for the full sample, namely 1996–2011 at five year intervals. Regional performance is tracked using the simple average across countries.
Table 1 presents results for textiles and clothing. It is immediately apparent that in some regions, scores are much higher than for agriculture (Table 2). That is the case for East Asia and the Pacific and South Asia. Both regions are important exporters of apparel, and this fact is reflected in their centrality in the matrix of bilateral value added trade in this sector. East Asia and the Pacific has a higher score in 2011 than in 1996, as does South Asia. The other regions see either declining scores or stable scores through time. The level and trend of scores in SSA is again of concern: in 2011, the region’s score was only 1% as high as that of the leading region (East Asia and the Pacific). Moreover, there has been a noticeable decline in its score since 1996. In part, this dynamic might reflect the reallocation of production that took place following the abolition of quotas under the WTO Agreement on Textiles and Clothing, a process that generally favored the most competitive Asian producers and posed problems for less competitive firms in other regions.
| 1996 | 2001 | 2006 | 2011 | |
|---|---|---|---|---|
| East Asia & Pacific | 0.240 | 0.290 | 0.131 | 0.312 |
| Europe & Central Asia | 0.072 | 0.055 | 0.025 | 0.048 |
| Latin America & Caribbean | 0.020 | 0.025 | 0.008 | 0.018 |
| Middle East & North Africa | 0.020 | 0.022 | 0.008 | 0.018 |
| South Asia | 0.130 | 0.141 | 0.050 | 0.135 |
| Sub-Saharan Africa | 0.004 | 0.004 | 0.001 | 0.003 |
Eigenvector centrality (connectivity) for textiles and clothing, 1996–2011, by World Bank region.
| 1996 | 2001 | 2006 | 2011 | |
|---|---|---|---|---|
| East Asia & Pacific | 0.046 | 0.078 | 0.091 | 0.101 |
| Europe & Central Asia | 0.019 | 0.017 | 0.019 | 0.020 |
| Latin America & Caribbean | 0.020 | 0.030 | 0.026 | 0.030 |
| Middle East & North Africa | 0.007 | 0.010 | 0.010 | 0.010 |
| South Asia | 0.035 | 0.065 | 0.063 | 0.078 |
| Sub-Saharan Africa | 0.004 | 0.005 | 0.005 | 0.005 |
Eigenvector centrality (connectivity) for agriculture, 1996–2011, by World Bank region.
Table 2 presents results for agriculture. Regional average scores are typically quite low, but they mask considerable heterogeneity across countries. Most regions exhibit an upward trend in connectivity, as measured by eigenvector centrality in the matrix of bilateral value added trade. The best connected region in this sector is East Asia and the Pacific, followed by South Asia. It is of concern that SSA is by far the weakest performer of all the World Bank developing regions: in 2011, its value chain connectivity score in agriculture is only half that of the next lowest placed region, the Middle East and North Africa. Its score is only about one twentieth as high as that of the East Asia and the Pacific region. Moreover, there is little evidence of a trend in Sub-Saharan Africa: its score is essentially constant throughout the sample period. The general picture that emerges is one of marginalization of Sub-Saharan Africa from the global network of value added trade in agricultural products.
3.2. Infrastructure, trade facilitation, and value chain connectivity
Having examined the networks of value added trade for textiles and clothing and agriculture, and calculated measures of connectivity, this section relates the results to indicators of infrastructure and trade facilitation performance, both in a given country and in its region. A country’s region is defined for the purposes of this section as being the average of the three geographically closest countries on a given metric. In the econometric part of the paper, that definition is relaxed as a robustness check. The methodology used in this preliminary review of the data is simple graphical analysis, which exposes the underlying correlations in the data in a bivariate context. The econometric part of the paper takes a more rigorous approach. Preliminary results are presented as indicative only.
First, I consider the association between a country’s own infrastructure and trade facilitation performance, and its value chain connectivity in the textiles sector (Fig. 7). Infrastructure performance is measured using the trade and transport related infrastructure component of the LPI, as discussed above, and trade facilitation is proxied using the average TFI score. In both cases, the figure discloses an upward sloping line of best fit, which is consistent with a positive relationship between infrastructure and trade facilitation on the one hand, and value chain connectivity on the other. These graphs provide a first basis for arguing that improvements in infrastructure quantity and quality, as well as trade facilitation performance, can be associated with better value chain connectivity.
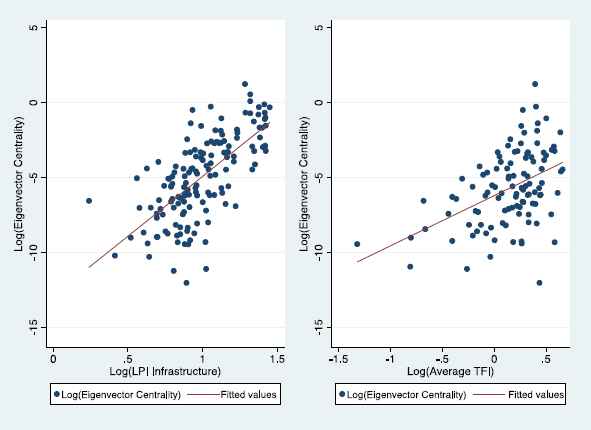
Eigenvector centrality vs. own country infrastructure and trade facilitation.
To examine the regional dimension, Fig. 8 uses infrastructure and trade facilitation data based on the average score for each country’s three closest neighbors. Proceeding in this way takes account of cross-border spillovers and complementarities in infrastructure development and trade facilitation policies. The underlying variables are the same as in Fig. 7. Again, the line of best fit in each case is clearly upward sloping. There is thus a clear suggestion in the data that improvements in infrastructure and trade facilitation performance in neighboring countries can have spillover effects. The regional dimension is therefore important in understanding the potential of both sets of policies to promote stronger connections to value chains. This aspect is explored in greater depth in the next section, where I estimate econometric models that go beyond the bivariate correlations presented here.
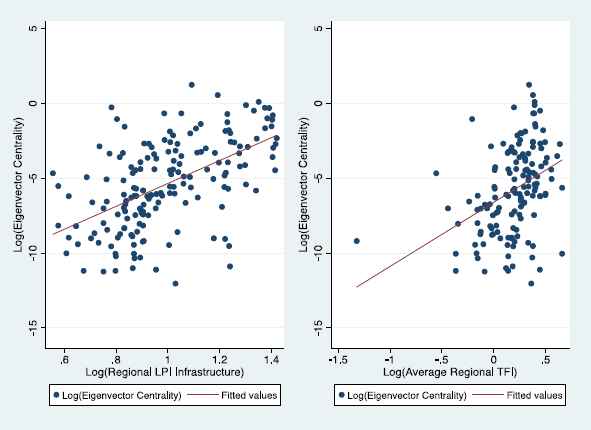
Eigenvector centrality vs. regional (nearest three countries) infrastructure and trade facilitation.
4. Empirical models and results
The objective of this paper is to analyze the ways in which infrastructure and trade facilitation promote value chain connectivity, focusing on the regional dimension. As previously noted, the concept of connectivity is an emerging one in the literature, and there is as yet no widely accepted model explaining its determinants. However, GVCs need to move goods across borders multiple times, quickly, efficiently, and at low cost, before the final product is shipped to the consumer. It therefore seems plausible that infrastructure and trade facilitation—which affect firms’ ability to perform those operations—should be linked to value chain connectivity as defined in this paper.
With these considerations in mind, I posit an empirical model of the following form:
In the first stage of the analysis, the regression is run using data on each country’s own trade facilitation performance and infrastructure development. Results therefore indicate the extent to which countries can boost their own value chain connectivity by improving these two areas. However, the regional dimension is important to this paper, so it is important not to limit consideration to a country’s own performance. I therefore conduct two sets of supplementary regressions in which each country’s own score is replaced by respectively the average score of the three countries closest to it, and the average score of the five countries closest to it, based on the geodesic distance between main cities. Each of these “closest neighbor” averages can be considered to be indicators of regional performance in the areas of trade facilitation and infrastructure, focusing on cross-country coordination as well as spillover effects. Positive and statistically significant coefficients would indicate that regional infrastructure and trade facilitation initiatives can have important spillover benefits in terms of promoting value chain connectivity in neighboring countries.
Full details of data and sources are presented in Table 3. For trade facilitation, I use the simple average score on the OECD’s Trade Facilitation Indicators (TFIs). That database covers 107 countries, and is a multidimensional assessment of the extent to which core disciplines of the new WTO Trade Facilitation Agreement have been implemented. The average of the database indicators therefore represents an overall assessment of “narrow sense” trade facilitation performance in a country, i.e. focusing on customs and border procedures.
| Variable | Definition | Source |
|---|---|---|
| Log(ACI) | Natural logarithm of the Air Connectivity Index | Arvis et al. (forthcoming) |
| Log(Connectivity) | Natural logarithm of eigenvector centrality based on the matrix of bilateral value added trade flows in respectively agriculture and textiles and clothing | Eora Database |
| Log(GDPPC) | Natural logarithm of per capita GDP in PPP terms | World Development Indicators |
| Log(LPI) | Natural logarithm of the trade and transport related infrastructure component of the Logistics Performance Index | World Development Indicators |
| Log(LSCI) | Natural logarithm of the Liner Shipping Connectivity Index | UNCTAD |
| Log(Roads) | Natural logarithm of road network length | CIA World Factbook |
| Log(TFI) | Natural logarithm of the mean score on the Trade Facilitation Indicators | OECD |
Note: All data are for 2011 or the closest available year.
Data and sources for the regressions.
I measure infrastructure using a number of different variables. First, to obtain an overall impression of the links between infrastructure and value chain connectivity, I use the infrastructure component index of the World Bank’s Logistics Performance Index (LPI). That database covers 155 countries, and measures six core dimensions of logistics performance, including the quality of trade and transport related infrastructure. This variable therefore gives an overall indication of the quality of infrastructure in each country, focusing on the types of infrastructure—roads, ports, and airports—that are of most importance for trade. To allow for the fact that different types of infrastructure potentially have different effects on connectivity, I run additional regressions in which the LPI data are replaced by data for individual modes of transport. For road transport, I use the total length of a country’s road network. For air transport, I use the Air Connectivity Index developed by Arvis and Shepherd (2011), and extended to more recent years by Arvis et al. (forthcoming). That index uses network analysis methods to measure each country’s “push” and “pull” on the global air transport network, and thus provides an indication of relative importance of particular nodes. Finally, for maritime transport, I use UNCTAD’s Liner Shipping Connectivity Index (LSCI). The LSCI is an aggregate index based on a set of indicators describing the size of vessels that call at a particular country’s ports, as well as the regularity of service, and other dimensions of importance that determine overall connectivity.
Each of the two sectors—textiles and clothing and agriculture—is considered separately. Results from the baseline regression for the textiles and clothing sector—using data on each country’s own infrastructure and trade facilitation performance—are in Table 4. Column 1 uses the LPI as the infrastructure indicator, and column 2 replaces it with modal indicators. Results are in line with expectations in terms of sign and statistical significance: infrastructure and trade facilitation are both positively and significantly associated with value chain connectivity. The control variable, GDP per capita, has the expected positive sign, but is statistically insignificant. The reason is likely that it is correlated with the two regressors of interest.
| (1) | (2) | |
|---|---|---|
| Log(Connectivity) | Log(Connectivity) | |
| Log(LPI) | 3.967** (0.033) | |
| Log(TFI) | 1.4453 (0.062) | 1.393*** (0.003) |
| Log(Roads) | 0.778*** (0.000) | |
| Log(ACI) | 0.662* (0.088) | |
| Log(LSCI) | 0.513** (0.010) | |
| Log(GDPPC) | 0.259 (0.283) | 0.270 (0.112) |
| Constant | −11.799*** (0.000) | −17.925*** (0.000) |
| Observations | 92 | 77 |
| R2 | 0.245 | 0.750 |
Note: Robust standard errors are in parentheses below the parameter estimates. Statistical significance is indicated as follows: * (10%), ** (5%), and *** (1%).
Regression results for own infrastructure and trade facilitation (textiles and clothing sector).
The magnitude of the two main coefficients in column 1 of Table 4 is striking: connectivity is very sensitive to improvements in logistics and trade facilitation. A 1% improvement in a country’s LPI score is associated with a nearly 4% improvement in value chain connectivity, while a 1% improvement in trade facilitation performance is associated with a nearly 1.5% improvement in connectivity. These elasticities are very high, but need to be kept in perspective, in particular in the case of SSA countries: most countries have very low connectivity scores, as indicated by the kernel densities, so even significant increases will still leave them a long way from the main international hubs. Similarly, the LPI is measured on a one to five scale, with a large number of countries bunched up in the middle. A small increase in score therefore represents a significant change in a country’s competitiveness, as it is associated typically with a noticeable change in rank. The difficulty of achieving wholesale changes in value chain connectivity should therefore not be understated.
Column 2 of Table 4 replaces the LPI with modal infrastructure indicators. All three modes—road, air, and maritime—have the expected positively signed coefficients that are statistically significant at the 10% level or better. The control variable, GDP per capita, remains statistically insignificant, and the trade facilitation variable has a similar magnitude and level of significance to the column 1 regression.
As noted at the outset of this paper, it is not just the national dimension of infrastructure and trade facilitation that is important, but also the regional one. Tables 5 and 6 present results using regional indicators calculated using average scores for the three and five closest countries respectively. The sample size for these regressions is larger because it includes some countries for which direct measures of infrastructure were not available on a national basis, such as landlocked countries that do not have an LSCI score, or countries omitted from the OECD’s TFIs.
| (1) | (2) | |
|---|---|---|
| Log(Connectivity) | Log(Connectivity) | |
| Log(LPI) | 4.953*** (0.004) | |
| Log(TFI) | 1.788* (0.055) | 1.553 (0.159) |
| Log(Roads) | 0.117 (0.624) | |
| Log(ACI) | 0.925 (0.149) | |
| Log(LSCI) | 0.398 (0.414) | |
| Log(GDPPC) | 0.485** (0.029) | 0.486* (0.055) |
| Constant | −15.158*** (0.000) | −13.414*** (0.000) |
| Observations | 134 | 130 |
| R2 | 0.291 | 0.282 |
Note: Robust standard errors are in parentheses below the parameter estimates. Statistical significance is indicated as follows: * (10%), ** (5%), and *** (1%). The infrastructure and trade facilitation variables are calculated as the average of the scores of the three closest countries to the country of interest.
Regression results for three country regional infrastructure and trade facilitation (textiles and clothing sector).
| (1) | (2) | |
|---|---|---|
| Log(Connectivity) | Log(Connectivity) | |
| Log(LPI) | 5.778*** (0.003) | |
| Log(TFI) | 2.922** (0.026) | 3.074* (0.061) |
| Log(Roads) | −0.017 (0.939) | |
| Log(ACI) | 0.156 (0.809) | |
| Log(LSCI) | 1.144** (0.013) | |
| Log(GDPPC) | 0.537** (0.010) | 0.672*** (0.006) |
| Constant | −16.502*** (0.000) | −15.421*** (0.000) |
| Observations | 149 | 151 |
| R2 | 0.359 | 0.358 |
Note: Robust standard errors are in parentheses below the parameter estimates. Statistical significance is indicated as follows: * (10%), ** (5%), and *** (1%). The infrastructure and trade facilitation variables are calculated as the average of the scores of the five closest countries to the country of interest.
Regression results for five country regional infrastructure and trade facilitation.
In column 1 of Table 5, the three country average of the LPI infrastructure component and the Trade Facilitation Indicators both have positively signed coefficients that are statistically significant. A 1% increase in neighboring countries’ LPI scores is associated with a 5% increase in connectivity, while a similar improvement in trade facilitation performance is associated with a 1.8% increase in connectivity. Both magnitudes are larger than the own country effects in Table 4, which is a striking result. These findings clearly support the view that it is important to move forwards on infrastructure and trade facilitation at the regional level, and correspondingly that national developments can have important spillover effects for neighboring countries.
Column 2 of Table 5 breaks out infrastructure according to mode of transport, as in column 2 of Table 4. Results are inconclusive in this case, probably because of correlation between per capita GDP and the infrastructure and trade facilitation variables. All variables are signed in line with expectations, but the coefficients are not statistically significant. It is difficult to gain any insight from this regression, which is surprising in light of the strong results in column 1.
Table 6 replaces the three nearest country average of infrastructure and trade facilitation performance with numbers based on the five nearest countries. It therefore uses a more expansive version of regional infrastructure and trade facilitation performance. Again, column 1 shows the LPI infrastructure indicator and the Trade Facilitation Indicators average as having positively signed and statistically significant coefficients. Their magnitudes are larger than in either Table 4 or Table 5, which reinforces the view that the regional dimension is of particular importance with the objective in mind of increasing value chain connectivity. Column 2 again shows results by mode of transport, and the indicator of trade facilitation, as well as the LSCI, stand out as having positive and statistically significant coefficients. The remaining coefficients are not statistically significant. Although the reasons for the difference in findings between column 2 of Table 5 and column 2 of Table 6 is not clear, the latter tends to suggest that improving maritime connectivity as well as customs and border procedures—both at the regional level—may be of particular importance from the point of view of value chain connectivity.
The discussion thus far has focused on value chain connectivity in the textiles and clothing sector. The other sector used as an example in this paper is agriculture. Tables 7–9 present results for that sector, following the same presentation plan as for textiles and clothing. In general, results are weaker for agriculture than for textiles and clothing: model R2s are lower, and there are relatively few statistically significant coefficients. There could be many reasons for this finding. One is the plethora of distortionary policies that affect the agricultural sector, both in developed and developing countries. In some parts of SSA, measures such as import prohibitions and export bans are commonplace (Maur and Shepherd, 2015), so incentives facing producers and consumers are evidently different from a more liberal environment like the one for textiles and clothing (at least post-liberalization under the Agreement on Textiles and Clothing). Similarly, in developed country markets, compliance with SPS and TBT requirements is a serious issue for many potential developing country exporters, but is not easily captured in a data analysis like this one. A second important factor is that in many regions of the world—and particularly SSA—value chains for agricultural products are mainly national in scope. International connections are limited by policies, as well as the practicalities of moving perishable goods across borders. Agriculture is a sector in which the GVC model is starting to emerge in some parts of the world, but it is by no means as dominant as it is in textiles and clothing. As a result, measurement of value chain connectivity in this sector may be more problematic than in textiles and clothing.
| (1) | (2) | |
|---|---|---|
| Log(Connectivity) | Log(Connectivity) | |
| Log(LPI) | 2.300* (0.087) | |
| Log(TFI) | 0.710 (0.266) | 0.512 (0.121) |
| Log(Roads) | 0.741*** (0.000) | |
| Log(ACI) | −0.182 (0.545) | |
| Log(LSCI) | 0.446** (0.011) | |
| Log(GDPPC) | −0.169 (0.381) | −0.081 (0.531) |
| Constant | −5.994*** (0.000) | −13.254*** (0.000) |
| Observations | 92 | 77 |
| R2 | 0.066 | 0.764 |
Note: Robust standard errors are in parentheses below the parameter estimates. Statistical significance is indicated as follows: * (10%), ** (5%), and *** (1%).
Regression results for own infrastructure and trade facilitation (agricultural sector).
| (1) | (2) | |
|---|---|---|
| Log(Connectivity) | Log(Connectivity) | |
| Log(LPI) | 2.173* (0.096) | |
| Log(TFI) | 1.199* (0.052) | 1.121 (0.112) |
| Log(Roads) | 0.164 (0.325) | |
| Log(ACI) | 0.226 (0.658) | |
| Log(LSCI) | 0.071 (0.858) | |
| Log(GDPPC) | −0.084 (0.638) | −0.042 (0.845) |
| Constant | −6.864*** (0.000) | −7.339*** (0.002) |
| Observations | 134 | 130 |
| R2 | 0.075 | 0.074 |
Note: Robust standard errors are in parentheses below the parameter estimates. Statistical significance is indicated as follows: * (10%), ** (5%), and *** (1%). The infrastructure and trade facilitation variables are calculated as the average of the scores of the three closest countries to the country of interest.
Regression results for three country regional infrastructure and trade facilitation (agricultural sector).
| (1) | (2) | |
|---|---|---|
| Log(Connectivity) | Log(Connectivity) | |
| Log(LPI) | 2.823* (0.069) | |
| Log(TFI) | 1.257 (0.232) | 1.713 (0.167) |
| Log(Roads) | 0.115 (0.520) | |
| Log(ACI) | −0.322 (0.563) | |
| Log(LSCI) | 0.419 (0.331) | |
| Log(GDPPC) | 0.068 (0.720) | 0.221 (0.324) |
| Constant | −8.742*** (0.000) | −9.772*** (0.000) |
| Observations | 149 | 151 |
| R2 | 0.100 | 0.099 |
Note: Robust standard errors are in parentheses below the parameter estimates. Statistical significance is indicated as follows: * (10%), ** (5%), and *** (1%). The infrastructure and trade facilitation variables are calculated as the average of the scores of the five closest countries to the country of interest.
Regression results for five country regional infrastructure and trade facilitation.
To summarize results for agriculture, there is some evidence that infrastructure and trade facilitation matter for value chain connectivity, as in the case of textiles and clothing, but findings are weaker. In column 1 of Table 7, the infrastructure indicator has a positive and statistically significant coefficient, which means that a country’s own infrastructure is important to the development of linkages with agricultural value chains. In the second column of that table, the trade facilitation variable and the LSCI and roads measures all have positively signed and statistically significant coefficients, which reinforces the view from the textiles and clothing sector that these aspects are of particular importance for value chain connectivity. It is important to note that the LPI captures the full range of trade-related infrastructure, whereas the modal indicators do not take account of specific agriculture issues, such as the need for cold storage facilities with reliable electricity supply.
In terms of the regional dimension, results using three and five nearest country scores in Tables 8 and 9 consistently indicate that infrastructure in neighboring countries is important for value chain connectivity, and Table 8 (3 country average) indicates that trade facilitation is also a key determinant. Results for agriculture are therefore broadly supportive of those for textiles and clothing, and are consistent enough that it is possible to conclude that the textiles and clothing results are not entirely driven by sectoral particularities. Having said that, it is important to interpret the results for agriculture with caution, for the reasons set out above.
An additional reason to take the results as indicative and as a basis for further investigation is that there may be endogeneity that affects model results. However, in the absence of additional data with which to construct a valid instrumental variables strategy, these results represent an important first indication of a relationship that deserves further research in the future.
5. Conclusion and policy implications
This paper has presented new evidence on the links between national and regional infrastructure and trade facilitation on the one hand, and value chain connectivity on the other, focusing on SSA. To do this, it has used a new set of multi-region input output tables to produce estimates of the domestic value added content of trade for 189 countries—including 44 in SSA—for the textiles and clothing and agriculture sectors. In addition, it has applied network analysis techniques to better understand the position of SSA in the relevant trading networks, and to compare its connectivity with that of other developing regions.
The first key finding is that SSA is relatively marginalized for world networks of value added trade, and thus from GVCs. Given the high levels of trade costs prevailing in SSA (Arvis et al., 2013), this result is no surprise. But the magnitude of the gap between SSA and the best performing developing region, East Asia and the Pacific, is very large. GVCs are prevalent in developing Asia in many sectors, and they are still in their relative infancy in SSA. Nonetheless, SSA exhibits poor value chain connectivity in textiles and clothing as well as agriculture. This finding sits well with recent qualitative work by Maur and Shepherd (2015), which found that in the case of food staples in West Africa, policy barriers as well as other sources of trade costs create a climate in which value chains remain largely national, even though ambitions are increasingly being articulated at the level of the region.
The second important finding from the trade in value added data is that African countries are reliant on external markets as sources of demand for their exports. Intra-regional links are relatively weak. Few African countries have other African countries as their primary export market, and there is no African economy that can be considered a hub of global commerce. Even the largest and most developed African countries are spokes in the global trade network—another example of the continent’s marginalization in terms of value added trade.
Third, and more encouragingly, improving infrastructure and trade facilitation is one way in which African countries can better connect to GVCs. There is a clear positive association between both sets of policies and value chain connectivity, particularly in textiles and clothing. Among the various modes of transport, maritime and air connectivity are especially important determinants of value added trade performance.
The last key finding from the paper is that when it comes to infrastructure and trade facilitation, the regional dimension matters. There is a strong positive association between infrastructure and trade facilitation improvements in neighboring countries, and greater value chain connectivity at home. It is therefore not just what a country does that matters for its connectivity, but also what its neighbors do.
These results have potentially important policy implications. African countries need to continue to improve infrastructure and trade facilitation performance, in the latter case including through implementation of the WTO Agreement on Trade Facilitation. Infrastructure is an area that has long needed attention in SSA, and this paper underscores its heightened importance in the era of GVCs. Joining and moving up in GVCs requires good gateway infrastructure, as well as strong connections to the hinterland. African policymakers, as well as donors and multilateral agencies, need to redouble their efforts in this area. Moreover, this paper’s results provide support for a regional approach to infrastructure development—which sits well with recent emphasis on economic corridors in some parts of the continent. A corridor approach recognizes that infrastructure can have cross-border spillovers, and treats economic units that span borders as integrated wholes. In a general sense, this approach has much to recommend it, and results reported here suggest that its benefits can include helping African firms connect to GVCs.
An additional policy issue that has special salience relates to the special position of landlocked countries in SSA. Although there is insufficient data variation to be able to draw concrete conclusions at this point, it stands to reason that the regional dimension of infrastructure and trade facilitation should be even more important for landlocked countries than it is for coastal countries. The reason is that they depend on neighboring countries—and thus on regional infrastructure and trade facilitation development—to move their goods to international markets. Future research could therefore usefully focus on landlocked countries, and the ways in which projects and corridors with neighboring countries can help promote value chain connectivity.
Appendix A. Country coverage in SSA
| Angola | Mauritania |
| Burundi | Mauritius |
| Benin | Malawi |
| Burkina Faso | Namibia |
| Botswana | Niger |
| Central African Republic | Nigeria |
| Cote d'Ivoire | Rwanda |
| Cameroon | Sudan |
| Congo | Senegal |
| Cape Verde | Sierra Leone |
| Eritrea | Somalia |
| Ethiopia | South Sudan |
| Gabon | Sao Tome and Principe |
| Ghana | Swaziland |
| Guinea | Seychelles |
| Gambia | Chad |
| Kenya | Togo |
| Liberia | Tanzania |
| Lesotho | Uganda |
| Madagascar | South Africa |
| Mali | Zambia |
| Mozambique | Zimbabwe |
Footnotes
Peer review under responsibility of Afreximbank.
I am grateful to the following for helpful comments and suggestions: Douglas Brooks, Marie-Agnès Jouanjean, and Dirk Willem te Welde. Jakob Engel provided excellent research assistance. I am also grateful to an anonymous reviewer and to the Editor for their helpful comments.
References
Cite this article
TY  - JOUR
AU  - Ben Shepherd
PY  - 2017
DA  - 2017/07/06
TI  - Infrastructure, trade facilitation, and network connectivity in Sub-Saharan Africa☆,☆☆
JO  - Journal of African Trade
SP  - 1
EP  - 22
VL  - 3
IS  - 1-2
SN  - 2214-8523
UR  - https://doi.org/10.1016/j.joat.2017.05.001
DO  - 10.1016/j.joat.2017.05.001
ID  - Shepherd2017
ER  -