
A Traffic Tracking Analysis Model for the Effective Management of E-commerce Transactions
 , Shenghong Lu2
The initial research for this paper was carried out while Dr. S. A. Ehikioya was with the University of Manitoba, Winnipeg, Canada.
- DOI
- 10.2991/ijndc.k.200515.006How to use a DOI?
- Keywords
- Traffic tracking and analysis; data mining; personalization and recommendation systems; path analysis tree; Web log files; packet monitors; single-pixel image
- Abstract
The increasing popularity of the Internet and e-commerce makes online merchants to constantly seek tools that would permit them to attract new and retain old customers. Traffic tracking and analysis tools can help businesses know more about their customers. These tools track visitors’ behaviors on Web sites. The information obtained from Web traffic tracking and analysis can help online merchants target specific audiences with customized products and services. Most commonly used approaches include Web log file, packet monitors, and single-pixel image approach. Each of these approaches has some drawbacks, which limits the types of data it can track or the user environment. In this paper, we propose a tracking and analysis approach, which has fewer limitations and more advantages than the existing approaches. We discuss three different approaches (i.e., improved single-pixel image, JavaScript tracking and HTTP (Hypertext Transfer Protocol) proxy server), which work together to track a user’s activities. In addition to basic analysis, we implement advanced analysis such as path analysis tree and user clustering. Path analysis is pivotal for Web site management and marketing in e-commerce. In modeling the tracking and analysis approach, we used a formal technique to guide quality assurance imperatives.
- Copyright
- © 2020 The Authors. Published by Atlantis Press SARL.
- Open Access
- This is an open access article distributed under the CC BY-NC 4.0 license (http://creativecommons.org/licenses/by-nc/4.0/).
1. INTRODUCTION
Many organizations now rely on the Web to conduct business. The increasing popularity of the Internet and e-commerce makes online merchants to constantly seek tools/mechanisms that would permit them to attract new and retain old customers. To achieve these two goals, a business should know, as much as possible, about its customers. Customers are the pivot of all businesses. When businesses lack knowledge of their customers, such businesses cannot efficiently develop their marketing activities.
The rapid development of e-commerce and its efficiency and convenience for online services results in the generation of huge amounts of data, increasing on a daily basis. The large amount of data being produced by e-services platforms during transaction is much unpredictable but contains hidden and very useful information which could help organizations to find more potential customers’, increase trading volume, improve product publicity, restructure their websites, and develop customer loyalty and emotional equity.
The e-commerce business model is, however, fundamentally different from other brick and mortar traditional businesses because a traditional business can easily construct a demographical and psychographic target audience profile. In e-commerce, every customer’s activity occurs on the Web. This means a business cannot know much about the visitors to its Web site, because most visitors are anonymous, they come and go without much trace. This lack of trail imposes a heavy burden on businesses that want to get more information about their customers beyond sales data.
Another feature of the Web is its interactivity, which means it not only transfers information to the visitors, but also be able to get some information from the visitors. This feature makes it possible for e-commerce Web sites to obtain their visitors’ data while the visitors are browsing. This is one major reason for the rapidly growing Web analytic market today.
Traffic tracking and analysis tools can help businesses know more about their customers. These tools track visitors’ behavior on Web sites. One can easily obtain valuable information such as what people like, how they feel, how they respond, etc, when the information obtained from Web traffic tracking and analysis is combined with the traditional demographic and psychographic business information. Such information is important to any business because it enables a business to target specific audiences with customized products and services.
An online merchant would be interested in a variety of issues regarding both the general performance and effectiveness of its Web site in order to shape its marketing strategies. Some of the interesting basic issues/questions are:
- •
Which browsers and operating systems are the most commonly used?
- •
How many visitors visit the Web site?
- •
Which page is most frequently requested?
- •
From what sites are visitors coming?
Some of the advanced analysis an online merchant would be interested in may include:
- •
Path analysis, which allows the merchant to know how visitors come to its site.
- •
Grouping the visitors according to their interests and other attributes.
- •
The visitors purchase conversion rate, i.e., how many people made purchases among the visitors?
- •
What is User A’s interest?
- •
Which referrer results in the most purchases, not just hits?
Capturing the data necessary to provide answers to these basic and advanced questions is the thrust of this paper. While the answers to the basic questions can easily be derived from traditional web logs, answers to the advanced questions can be possible by integrating customer profiles and other specific data such as the contents of page views that are not normally available in traditional web logs. The first step in doing so is to capture the necessary data, which will then be analyzed to derive the relevant information that accurately addresses those questions above. Thus, it is necessary to develop a way to track online visitors’ behaviors and analyze Web traffic for an e-commerce system.
Web log analysis is the most commonly used approach to obtain data about online visitors based on the data from Web server logs. The analysis process, however, is complicated due to Web log file characteristics, such as large size and different formats for different servers. Other analyses are based on TCP/IP (Transmission Control Protocol/Internet Protocol) packet monitoring. This approach may lower the server’s performance if monitoring is performed on the server. Monitoring by packet sniffing may put an extra load on the server. Single-pixel analysis gathers its data from each page that a visitor browses. Because Single-pixel analysis is simply based on HTTP (Hypertext Transfer Protocol) image loading and JavaScript technologies, it has some limitations since JavaScript may not be completely supported or can be disabled by the visitor.
The above situations motivate the need to find a different tracking tool which can track as much data and with less limitations as the above methods or tools. This paper focuses on the development of a traffic tracking and analysis model suitable for the effective management of e-commerce transactions which has fewer limitations and more advantages than the existing approaches. We discuss three different approaches (i.e., improved single-pixel image, JavaScript tracking and HTTP proxy server), which work together to track a user’s activities. In addition to basic analysis, we implement advanced analysis such as path analysis tree and user clustering. We abstract a user’s session as a full path, which is made up of sub-paths with different length. According to Ehikioya and Lu [1], although partial paths, such as maximal reference sequence module, can also reveal useful information in some aspects about a user in a session, a full path contributes more to the understanding of the navigational patterns in path analysis. Also, we implement the model for traffic tracking and analysis in Java programming language. We use a path string to represent a full path in a user’s session. To store all paths efficiently and display the data visually, we developed a path tree structure and an algorithm for constructing such a path tree. Evaluation results show that this model can provide a lot of useful information about users’ navigation and a website’s usage. In addition, the work reported in this paper can be used as a base model to develop web recommendation and personalization systems. We adopt a formal technique to guide quality assurance imperatives in modeling the tracking and analysis approach. The formal method is based on mathematical theory, especially discrete mathematical theory, and notations. We use set theoretical notations to describe structural components, while we use predicate logic to describe requirements.
The remainder of this paper is organized as follows: Section 2 briefly examines some of the key related research work in the literature. Section 3 provides foundational/background material necessary for a proper understanding of our work. Section 4 describes our traffic tracking model while Section 5 describes our traffic data analysis model. Section 6 shows the implementation results of the model. Finally, Section 7 contains the conclusion of the paper and offers directions for further research.
2. REVIEW OF RELATED LITERATURE
In the e-commerce environment/domain, users’ navigational behavior indicates their steps through the shopping process. Thus, analyzing tracked navigational data is critical to the success of any online business.
Generally, traffic tracking and analysis is based on session data. It can also be based on the individual users if the users can be identified. When users’ personal data1 become available from other sources, such as user inputs, user tracking tools, etc., more advanced information can be obtained by combining these users’ data with path analysis [1].
Web analytics is a technique for understanding users’ online experience for improvement of the overall quality of experience of the users. In other words, web analytics is a technique used to collect, measure, report, and analyze website data in order to assess the performance of the website and optimize its usage with the ultimate goal of increasing the return on investment. Web analytics provide a tactical approach to track key metrics and analyze visitors’ activity and traffic flow and generate reports [2–4]. Thus, it is an indispensable technique for e-commerce merchants.
Web analytics is well documented in the literature [5,6].2 For example, a detailed examination of the rationale for web analytics is available in following resources [2,5,7–11] while some [12–14] examine web analytics and web metrics tools and their characteristics, functionalities and types, and data acquisition approaches and the selection of web tools for particular business models. Further, Clifton [8] examines available methodologies and their accuracy.
The data for analysis come from two major categories [15]:
- •
user-centric data, i.e., data collected based on individual users, which include all browsing behavior of a user on all websites; typically collected by Internet Service Provider (ISP). This permits the creation of a user’s profile of all internet usage across multiple channels.
- •
site-centric data, i.e., data collected from a single website, which represent the activities and behaviors of visitors on the website. This permits focused data mining and understanding of the context of the website.
Our approach in this paper focuses on site-centric data in performing website usage characterization by identifying patterns and regularities in the way users access and use web resources.
Digging deep into a visitor’s behavior and customer’s purchasing habits on a website through specific engagement metrics data provides critical insights into the performance of product pages, and optimization and improvement of the effectiveness of the ecommerce solution. Ezzedin [16] examines the top engagement metrics for each step of the purchasing cycle and show how to analyze the data collected for the different users’ segments using Google Analytics [6,8,17] measurement platform.
Booth and Jasen [14] provide an overview of methodologies for analyzing websites to increase revenue and customer satisfaction through careful analysis of visitor interaction with a website. They discussed how basic visitor information, such as number of visitors and visit duration, can be collected using log files and page tagging by including a “tracking code on every page of your website, and then access reports to view the data that is collected” [17]. Usually each user of a website creates a visitor path. A visitor path is the route a visitor uses to navigate through a website [14]. Each visitor creates a path of page views and actions while on a website. By studying these paths, one can identify usage characterization of the website and any challenges a user has in using the website.
Nguyen et al. [4] use web usage mining process to uncover interesting patterns in web server access log file from a university in Vietnam. By incorporating attribute construction (or feature construction), one of strategies of data transformation of data pre-processing technique, they had wide knowledge about users access patterns. Such knowledge is useful for optimizing system performance (such as deciding reasonable caching policies for web proxies) as well as enhancing personalization.
The sequence of viewed pages and actions taken are commonly referred to as “paths”, and the clickstream data collected provide valuable insight into how the website is used by its users. Clickstream data offers consumer’s online behavior analysis, and the effectiveness of marketing actions implemented online, due to its ability to provide information concerning the sequence of pages viewed and actions taken by consumers as they navigate a website [18]. However, as Clark et al. [19] note, clickstream data does not reveal the true intentions of the user on the website, or other possible activities that the user engaged in during the use of the website.
Ellonen et al. [20] analyze consumer behavioral patterns on a magazine website using a unique dataset of real-life clickstream data from 295 visitors to a magazine’s website. They found interesting behavioral patterns that 86% of all sessions only visit the blogs hosted by the magazine. Similarly, Ribeiro [21] examines the navigational patterns of users on the website of Shifter, an online media company, for a 3 months period using Microsoft Excel tool to obtain a context for each piece of content produced and published. Analysis of Shifter’s data resulted in recommendations for rethink, and the redesign, of the editorial content of the business to respond to different community’s needs.
Lindén [22] similarly examines behavioral patterns of users on an online magazine website with a view to first find and visualize user paths within the data generated during collection, and then identify some generic behavioral typologies of user behavior using cluster analysis and sequential path analysis. He used a dataset of clickstream data generated from the real-life clicks of 250 randomly selected website visitors over a period of 6 weeks using Microsoft Excel to visualize user paths and analyze descriptive studies based on the clickstream data. The analytical process focuses on a combined methodology of cluster analysis and swim-lane diagrams. Similarly, Jain et al. [23] and Pani et al. [24] provide an analysis of Internet browsing and site usage behavior using sequential access pattern mining, while Siddiqui and Aljahdali [25] discuss Web mining tree structure. Also, Jokar et al. [26] examine Web mining and Web usage techniques while presenting an efficient framework for Web personalization based on sequential and non-sequential patterns, and analyze the structure of the web pages using compression of tree structure method.
E-commerce transaction systems execute in open network infrastructure and they are, therefore, not completely fraud proof because some points of a system are vulnerable in the real world due to the openness of the network, which attackers and fraudsters can exploit. Wang et al. [27] examine vulnerable points analysis for e-commerce transaction system with a known attack using a Petri nets based model, called vulnerable e-commerce transaction net. They define and espouse the concepts of vulnerable points and vulnerable levels in order to describe the cause and levels of vulnerability, and show the effectiveness and rationality of the concepts and method.
Tian et al. [28] propose a systematic structural analysis framework model that reveals the hidden mechanism of e-commerce market structure and Internet social system. This model relies on ecosystem theory and network science. The model uses element identification, relationship analysis, and formation mechanism analysis as the core steps to explain e-commerce market structure. They show several illustrative applications based on the analysis model.
Lewis and White [29] present a method for web usage mining based on a linear ordering of the age transition matrix created from web server access logs. This ordering facilitates the categorization of web pages into different classes (such as origins, hubs, or destinations) based on position in the linear order; thus providing a measure of the orderliness of website traffic. They applied this technique to website traffic of a university over time by comparing the website traffic immediately after a major change to the website design and the traffic 2 years later since changes in website organization could also dramatically change visitors flow. The results show the traffic is more ordered. Similarly, Asha and Rajkumar [30] discuss web usage mining techniques for enhanced quality of experience of customers shopping online and also discuss web mining techniques to find dishonest recommenders in open social networks. They propose a recommendation system that uses semantic web mining process integrated with domain ontology which can be used to extract interesting patterns from complex and heterogeneous data.
Clickstream data provide information about the sequence of pages or the path viewed by users as they navigate a website. Montgomery et al. [31] show how path information can be categorized and modeled using a dynamic multinomial probit model of Web browsing (i.e., clickstream data) using data from a major online bookseller. Their results suggest that paths may reflect a user’s goals, which could be helpful in predicting future movements at a website. One potential application of their model is to predict purchase conversion. This technique is useful in the personalization of Web designs and product offerings based upon a user’s path.
Noreika and Drąsutis [32] propose website activity data analysis model based on a composition of website traffic and structure analysis models with intelligent methods. The measurement of visitors’ website activities relies highly on data mining techniques. This approach enables theoretical predictions on how and what factor changes in website structure affect a visitor’s click paths and overall website activity. Their model relies on the main principle of dividing the website analysis into two parts; namely website structure analysis model and website traffic analysis model. They construct and formalize these models separately and then establish a relation function between them based on intelligent methods. One of the limitations of their work is that they only describe the models construction leaving out the key intelligent methods as a black box, which leaves too many unknowns.
Ohta and Higuchi [33] analyze store layout that underlie supermarket store design and product display styles and then examine the interaction between shop floor layout and customer behavior from the perspective of the supermarket owner to discover the main sections within the shop likely to attract customers into the store. The authors made a general classification between the standard layout, which accounted for approximately 90% of the survey sample, and the minority layout, used by <10% of the survey sample. Using the survey results, they analyzed the customer circulation rates and section drop-by rates as influenced by the store layout. They concluded that the standard layout is superior. This study is fundamental and analogous to the behavior of online visitors to e-commerce websites.
Zheng et al. [34] propose a way of detecting fraud in users transactions by extracting the Behavior Profiles (BPs) of users based on their historical transaction records, and then verify if an incoming transaction is a fraud or not in view of their BPs. The Markov chain models [35] are popular in representing BPs of users, which is effective for those users whose transaction behaviors are relatively stable. However, with the development and popularity of e-commerce, it is more convenient for users to shop online, which diversifies the transaction behaviors of users. Therefore, Markov chain models are unsuitable for the representation of these behaviors. However, they propose use of Logical Graph of BP (LGBP), a total order-based model, to represent the logical relation of attributes of transaction records. Based on the LGBP and users’ transaction records, one can compute a path-based transition probability from one attribute to another, and diversity coefficient to characterize users’ transaction behaviors and diversity. In addition, to capture temporal features of a user’s transactions they also defined a state transition probability matrix. Their experiments over a real data set show that the LGBP method can characterize the user’s transaction behaviors precisely, and abstracts and covers all different transaction records.
Ehikioya and Lu [1] propose a path analysis model as an effective way to understand visitors’ navigation of a website, which can provide a lot of useful information about users’ navigation and a website’s usage. Also, Ehikioya and Zheng [36] present a Web content usage logging system for Website administrators and business analysts to capture Web site visitors’ interests at a fine granular level, and show how a Web site, designed using the object-oriented paradigm, can benefit from this logging system to capture interested objects’ attributes and relationships among these attributes. The Web content usage log provides valuable data for Web usage data mining with minimal effort in data extraction, transformation, and loading. Similarly, Fernandes et al. [37] propose an algorithm that uses paths based on tile segmentation to build complex clusters. The algorithm offers two advantages; it does not create overlapping clusters, which simplifies the interpretation of results and it does not demand any configuration parameters from users, making it easier to use. Also, Lavanya and Princy [38] discuss recent research about concept maps and data mining techniques, and graph reading algorithms used for concept map generation and tabulate popular data mining techniques used in big data analytics.
Traffic tracking and analysis is pivotal for Web site management and marketing in e-commerce. While several analyses use sequential pattern discovery (i.e., path analysis) techniques [39–42] to discover frequent path patterns, some authors use advanced path analysis to achieve more complex tasks such as serving as a basis of personalization [42] or recommendation systems [43–47]. Recommendation systems and personalization are two related and popular research areas in Web data mining. They both apply statistical and knowledge discovery techniques to achieve serving/selling of more products, thereby enhancing the profitability of e-commerce sites [47]. In a recommendation system, a new user is matched against a pre-built database, which stores consumers’ products preferences. If some neighbors, who are customers already in the database and have the same taste as the new user, are found, products favored by those neighbors are recommended to the new user. One example to using path analysis for recommendation systems is to predict HTTP requests [48], which is based on path profiles and recommends an URL with a high probability to the user before the user makes such a request.
Kahya-Özyirmidokuz [49] analyzes the large amounts of Facebook social network data which are generated and collected for valuable decision making information about shopping firms in Turkey in order to have a competitive advantage by translating social media texts into something more quantitative to extract information. The author used web text mining techniques to determine Facebook patterns in 200 popular Turkish online shopping companies’ web URLs via similarity analysis and clustering. Consequently, the clusters of the Facebook websites and their relationships and similarities of the firms are obtained.
Chen et al. [50] examine the usage behavior patterns of mobile telecommunication services users, a key and critical factor to harness the power of mobile technology that has drastically impacted how people interact socially, using opinion leaders deemed tremendously influential on the usage behavior of other users. They examined data from one of the largest Taiwanese telecommunications databases and try to identify mobile opinion leaders and further cluster their mobile usage patterns by mining the actual data. This study exploits a combination of techniques, including statistics, data mining, and pattern recognition, in the data analysis of opinion leadership theories applied in the traditional marketplace into mobile services based on a big data system. Further, they provide a taxonomy to logically analyze each pattern of mobile content usage behavior gathered from mining the data to provide better planning blueprint for future mobile resource consumption.
Sunil and Doja [51] discuss web data mining strategies and applications in e-services which are required for optimizing website structure that will help business and learning platforms to increase their revenues, attract new and retain old customers or learners, and assist developers to increase the frequency of customers/learners visits.
Landers et al. [52] examine web scraping, which involves the automated collection of information from web pages, as an approach to collecting and analyzing data in big data systems/environment. Web scraping is highly scalable and fast as one can create massive big datasets with tens of thousands of variables, as it can also be used to create modestly sized, more manageable datasets with tens of variables but hundreds of thousands of cases, which one can analyze within a few hours.
Flory et al. [53] provide an effective and efficient solution of how-to-design decision support systems to address the consumers’ need for non-burdensome sense making of online reviews through interactive web personalization artifacts and validate their superior performance for adequately validating the solutions of review quality research. Due to the increasingly high volume of such reviews, automatic analyses of their quality have become imperative. Similarly, Alkalbani et al. [54] examine reviews by cloud consumers that reflect consumers experiences with cloud services. They analysed the reviews of about 6000 cloud service users using sentiment analysis to identify the attitude of each review, and to determine whether the opinion expressed was positive, negative, or neutral using two data mining tools, KNIME (KoNstanz Information MinEr) and RapidMiner, based on four supervised machine learning algorithms: K-Nearest Neighbour, Naïve Bayes, Random Tree, and Random Forest. The results show that the Random Forest predictions achieve 97.06% accuracy, which makes this model a better prediction model than the other three.
Hongyan and Zhenyu [55] provide an in-depth study of the progress of theoretical research services and service quality management theory necessary for establishment of collaborative filtering, recommendation systems, predict consumer model, personalized recommendations and services to address the information overload problem arising from social integration of e-commerce systems based on large data analysis and complex network in order to predict consumer behavior.
In summary, the ability of finding clusters without knowing features of the data sets to be clustered is quite relevant in the analysis of massive e-transactions data (in the big data and data mining domains). Big data deals with large data sets that may produce clusters with arbitrary shapes from different sources, such as geographic systems, medical systems, sensor systems, e-commerce systems, etc. Web mining is the application of data mining techniques to discover and extract useful and interesting information from the Web. Web mining in e-commerce is well documented in the literature [56]. According to Arti et al. [56], web mining is applied to e-commerce data set to know the browsing behavior of customers, to determine the success of marketing efforts, to improve the design of e-commerce web site, and to provide personalized services.
To gain competitive advantage, businesses need to have a detailed track of the activities on their website in order to have decisive knowledge. However, to monitor and to optimize website performance, organizations need strong web analytics tools and skills. Kumar and Ogunmola [57] present a comprehensive review, and a comparative analysis, of the most important web analytics tools and techniques, which are vital to report a website’s performance and usage. Also, Capterra [58] provides a profile of commercial web analytics software products (such as Visitor Analytics) to guide businesses.
3. FOUNDATION/BACKGROUND WORK
Traffic analysis process includes data tracking process and data analysis process. The traffic analysis process includes four stages: Capture, Store, Analyze, and Report. The first stage, Capture, tracks data about online visitors. Since these data are the base for later different analyses, therefore, they need to be stored. This is achieved by the second stage, Store. To make raw data useful, we need to analyze the raw data in the third stage, Analyze; while the last stage, Report, uses the results of the analysis to generate reports.
There are three primary approaches in Web traffic analysis market. They are user-centric, site-centric, and ad-centric. Site- and ad-centric technologies are based on Web logs, HTML tags, and packet sniffers, while user-centric technology is based on polling [59]. As for the tools for doing analysis, the traditionally and widely used approach to capture data from Web site visitors is the HTTP server log files and packet monitors [60–63]. Single-pixel technology is another, but a newer approach [60,62]. Other technologies such as HTML forms, URL rewriting, HTML hidden fields, cookies and sessions [64] are also used to capture data from visitors.
3.1. HTTP Web Server Log File Analysis
When visiting a Web site, the user connects to a Web server, which serves the files the user requests. The Web server creates a text file (one entry for each file request) to record this activity, each text file consists of the Web log file for that Web server.
The HTTP Web server log analysis technology is the oldest technology developed in 1995 [65]. This analysis is used primarily to obtain a general understanding of what happened on a Web site. Webmasters and system administrators often need information typically for Web site management purposes: how much traffic they got, how many requests failed, and what kinds of errors were generated. Web log file analysis tools have become the most frequently and widely used approach by Web marketers, with e-commerce becoming an important platform for business.
A Web server records its HTTP traffic continuously into its log file. Normally, each Web server has one log file – a text file containing all HTTP requests and responses from the Web server. The information in a log file generally depends on which Web server generates them. Generally, different Web servers support different log formats. The most commonly used format, W3C Extended Log Format, logs one entry for each HTTP request.
Web log files provide valuable insight into Web site usage. Based on the data from the server log file, the basic usability analysis includes:
- •
Number of requests made (“hit”).
- •
Total files successfully served.
- •
Number of requests by type of files, such as HTML page views.
- •
Distinct IP addresses served and the number of requests each made.
- •
Number of requests by HTTP status codes (successful, failed, redirected, informational).
- •
Referring pages to the given site.
- •
Browsers and versions which made the requests.
Some advanced analysis data may be obtained from Web log files [65]. This analysis should answer the following questions:
- •
Who visited the given site? Session data can be used to identify whether a unique visitor is returning to the given site or not.
- •
Which path took the visitors to the site? With the knowledge of each page a visitor viewed and the order of viewing the pages, the trends in how the visitors navigated through the pages can be determined. And which HTML element (link, icon, and image) a visitor clicked on each page to get to the next page also yields important information.
- •
How long did visitors spend on each page? The length of time most visitors’ stay on a page can be used to deduce whether the page is interesting or not.
- •
Where did visitors leave the site? The last page a visitor left your site is the logical place to end the visit, it may be the page the visitor did not enjoy and thus wanted to leave the site.
- •
What was the success rate of user’s experience at the site? To compute this value, we can use measures, such as, how many purchases occurred and how many downloads were finished.
3.2. Advantages of Web Log File Analysis
A Web server captures actual usage data in its working environment in a natural way. A Web log file reflects the activities of most visitors to a given site, over a potentially long period of time. Therefore, it is extremely valuable for Web design engineers to do usability assessments.
Although Web log files began as a way for IT administrators to ensure adequate bandwidth and server capacity on their organizations’ web sites [66], this approach has been advanced considerably in recent years by e-commerce companies. These companies mine log files for details about visitors profiles and purchase activities, through learning about the usability of their Web sites (i.e., how successfully they meet their marketing goals, and the visitors’ satisfaction).
3.3. Problems with Web Log File Analysis
Web server log files contain a lot of information [67]. A one-megabyte (1 MB) log file typically contains about 4000–5000 page requests. Web site analysis tools typically import the log file data into a built-in database, which in turn transforms the data into readable, graphical reports for different purposes. This process is difficult and time-consuming because the log data are abbreviated and cryptic.
The original purpose of log files is to produce site-level performance statistics. Thus, it is not a surprise that they cannot provide accurate and effective usability information on a given site. Two main problems make log file analysis as usage indicator difficult. The first one is that the tracked data in a log file are insufficient, which may be caused by the lack of certain types of usage data that should have been logged. Another problem is that extraneous data can go into a log file. These problems give rise to insufficient, unsound, and misleading information, which results in weak answers to most of the questions required for advanced analysis. The main shortcomings of a Web log file are:
- •
A log file cannot track the visitor’s ID even if the site has a login page. This inability to track a visitor’s ID makes it hard to identify a unique visitor. Although session data and IP addresses are available, it may still be difficult to identify a visitor because a lot of visitors use dynamic IP addresses offered by their Internet service providers.
- •
When the site owner, or the Internet service provider, has a central cache for Web pages, or when the visitor uses the browser’s cache, the pages obtained by the visitor by pressing the back button during the subsequent visits in the same session are typically from those caches and thus cannot be logged (or recorded) in a log file. This problem results in an incorrect path analysis. In addition, page caching may give wrong information to know where the visitor left. For example, if the last page was from a cache, the log file cannot reflect it.
- •
The Web server would record nothing in the log file when a visitor arrived at a page by typing the URL in the address box, using a bookmark, or following an email link [68]. This problem will result in wrong information about the referrers.
- •
A log file only records the time when data transmission was initiated, not the time when the data transmission completes. Therefore, the time spent on a page by this visitor can only be roughly estimated based on comparing the timestamps of the current request and the next request.
Additional details of the challenges associated with Web log file analysis are available in Krishnamurthy and Rexford [69] and Davison [70].
3.4. Packet Monitors
Packet monitors collect traffic data directly from the TCP/IP packets sent to and from a given Web server. They use packet sniffing technology, which is the equivalent of telephone tapping [62]. When a Web browser connects to a Web server, it communicates with the server by sending requests and receiving responses. All requests and responses are transferred as data, which in fact are split into TCP/IP packets by HTTP, along with other Internet application protocols. It is possible to “sniff” these packets when they move across the network to collect Web site traffic data. Two types of packet monitors exist: server monitor and network monitor. Each type is based on where to collect the traffic data.
Typically, a server monitor runs as a plug-in to the Web server. A server monitor gets information about each event happening on the Web server it monitors through an application programming interface. But what events and data are visible to the server monitors depend on the Web server [71]. Normally, a server monitor can get a visitor’s ID, referrer pages and some other information about the events on the server.
A network monitor is a packet sniffer, which can capture all data packets passing through a given network. A network monitor can be set up to capture the packets to a certain machine or all packets traversing a given network. Network monitors are more frequently used than server monitors in tracking traffic. A network monitor can see almost everything between the visitor and the given Web server. The tracked information include the requests, the server responses, cookies, and transferred HTML files. In addition, a network monitor can also track stop events issued by the browser, which makes it possible for the site owner to know those pages that are taking too long to generate and display by the client’s browser. In addition, it can record the Web server’s response time to each request. Some network monitors can capture HTML “form data” transmitted via a POST method when the visitor clicks a submit button [71].
3.5. Advantages of Packet Monitors
One obvious advantage of packet sniffing over Web log files is that data can be captured and analyzed in real time. Another advantage is that it can track almost all information found in a Web log file, and the information at the network level such as “stop” events, which are not present in log files. Besides, packet sniffing can be compatible with almost any custom Web server, because it is independent of log file format and underlying operating system. In addition, organizations with distributed Web servers can easily and automatically collect their traffic information in a centralized data warehouse for later analysis.
3.6. Problems with Packet Monitors
Server packet monitoring can introduce unexpected problems into the server itself (e.g., can cause the server to shut down when the packet monitor crashes) since a monitor acts as a plug-in. In addition, the kinds of data a server packet monitor can track depend on the Web server. A network monitor can be installed on each Web server although such configuration is difficult to manage if the Web servers are in different geographic locations. Although a network monitor can track more data than Web log files, it consumes a lot of processor time and, therefore, causes a heavy load on Web servers.
Another problem is that packet sniffing captures data in real-time and the data are not immediately logged, therefore, if something goes wrong with the packet sniffer, the data will be lost.
3.7. Single-pixel Technique
A single-pixel is known by various names such as one-by-one GIFs, invisible GIFs, beacon GIFs, and web bugs. A single-pixel method inserts an IMG tag on a Web page. This tag encloses some HTML and JavaScript codes, which are interpreted by the user’s browser when the user gets such a page from the site’s server and thus, captures relevant data from that page. The single-pixel technique is commonly used with cookies and JavaScript, and is based on the image downloading mechanism. When a page is downloaded, the browser not only creates a connection to the Web server where the page resides, but also creates a connection to the Web server where the image resides to request the image.
3.8. Advantages of Single-pixel Technique
Web log files record a user’s activity by “hits”. This means if a page has three images on a page, the log file would create at least four separate records for the request for this page. These four records constitute the results of the request for this page, and one for each image. Unlike Web log files, single-pixel gathers information by page views, i.e., one record for each page. Detailed information is collected when the page is fully loaded. One obvious benefit of single-pixel technique is that the information can be easily collected and put into a database, while Web log analysis normally needs data from multiple Web servers that may be located in different places. That means, for example, if a page has five IMG tags, and these five images are located on five servers, a request to this page will lead to a record in each log file of these five servers. To analyze the data, we have to collect these records from those five servers, but with single-pixel analysis, it simply creates one record because it is associated with one image. Once the image is downloaded, the tracking program runs and records all necessary data as one data entry.
When working with client-side JavaScript code, which can capture more client-side data (such as screen solution), the single-pixel can capture more data than those tools working on the sever side like web log files and packet monitors, and these data are not obtainable by these server-side tools.
3.9. Problems with Single-pixel Technique
The single-pixel approach, which is based on JavaScript, can fail to capture the required data when the visitor’s browser disables JavaScript or when the browser does not support JavaScript [60,62].
Another problem is that, like packet sniffing, single-pixel captures data in real-time. If something affects the downloading of the image, the data will be lost.
An additional problem with the single-pixel technique is current concern over the use of this technology that it is surreptitious because, unlike cookies, Web browsers do not offer preference settings to warn users that pages contain Web bugs [72]. Some consumers may be unhappy with the awareness that they are being monitored and tracked [73,74].
3.10. Other Approaches
In addition to those tracking approaches discussed above, some other approaches are also used to collect online visitors’ data. Some approaches work explicitly, such as HTML forms, while others work in the background.
3.10.1. HTML forms
The most direct method of gathering data from Web visitors is by using HTML forms. This method allows a site to capture information about its visitors and what they want. Once a visitor fills out a form and submits it, the information contained in the form is sent to a server side program, which parses and saves the data into a database for later analyses.
The main advantage of this approach is that the Web site can collect data of interest. By using pre-designed forms, the tracked data are easy to save and analyze later. However, this approach is unattractive because most Internet users are unwilling to spend a few minutes in completing a form if it is optional.
3.10.2. HTML hidden fields
HTML hidden fields capture a visitor’s session data about the visitor. An HTML hidden field looks like the following: <INPUT TYPE = “HIDDEN” NAME = “session” VALUE = “…”>. When the form is submitted, the specified name and value are included in the GET or POST data.
HTML hidden fields are easy to use, but they only work if every page is dynamically created.
3.10.3. HTTP cookies
HTTP cookies are widely used to collect data from visitors. A cookie contains small bits of textual information that a Web server sends to a Web browser the first time that browser connects to the Web site. On subsequent visits, the Web browser sends the same ID back to the Web server, telling the Web site that a specific user has returned.
Web site developers can easily identify individual visitors using cookies, which results in a better understanding of how the site is used; for example, visitors on most order sites do not need to re-enter session information already saved or some personal data every time on subsequent visits.
The major disadvantage of this technology is the fact: “Browsers generally accept only 20 cookies per site and 300 cookies in total, and each cookie can be limited to 30 KB” [64]. Therefore, cookies cannot be used to keep a lot of information about each visitor.
3.10.4. URL-rewriting
URL-rewriting is another session control technique whereby a browser appends extra data that identifies the session to the end of each URL, and the Web server associates the session identifier with data it has stored about the session. For example, in the following URL: http://some/site/file.html;someId=123, the session information is attached as someId=123. This approach works even when the browser does not support cookies or when the visitor disables the cookies. A disadvantage of this technique is that it adds tedious processing tasks to the Web server. In addition, if a visitor leaves a session and comes back via a bookmark or link, the session information can be lost.
3.11. Advanced Analysis of Web Traffic: Data Mining
Mining data from the Web is a new hot area in data mining. Research in this area integrates the data obtained from the Web with other data sources, such as customer databases. Advanced relationship between the Web data and external data sources is used when creating reports.
Many data miners, especially those who mine data to develop new marketing strategies, new product development, and enhance customers’ services, pay high attention to Web traffic data. To them, Web traffic analyses are gold. Most analyses are based on data from log files, or from packet monitoring
Using data obtained from packet monitoring, Morris and Lin [75] show that Web traffic aggregates in a Poisson-like manner in certain situations. Mah [76] obtains statistics and distributions for higher-level quantities, such as the size of HTTP files, the number of hits per “Web page”, and visitor browsing behavior. Feldmann [77] discuss a packet tracing system using packet level data to extract Web data.
Web log file analysis has attracted a lot of attention in recent years. Lamm et al. [78] examine visitor WWW access patterns by extending a virtual reality system, which is designed to analyze and display real-time performance data and applied to the analysis of WWW traffic. They found “that a geographic display metaphor has provided new insights into the dynamics of traffic patterns and provides a model for development of a WWW server control center, similar to that in network operations”. Crovella and Bestavros [79] show the mechanisms that give rise to self-similar network traffic using data collected on over thirty WWW sites. Schechter et al. [48] conclude that path profiles can be efficiently created by processing session data and HTTP server log files based on the concept of path profile, which “is a set of pairs, each contains a path and the number of times that path occurs over the period of the profile”. Using path profiles, some novel Web applications, such as pushing a Web page to a visitor before it is requested, can be developed. Cunha et al. [80] identify a number of trends and reference patterns in WWW use and show that many characteristics of WWW use can be mathematically modeled by powerful distributions. Masseglia et al. [81] develop a novel data structure, called a Web access pattern tree, to mine access patterns from Web logs efficiently. Zaiane et al. [82] present the design of a knowledge discovery tool, WebLogMiner, to mine data from Web logs. Among the research on Web log files, some [83–86] analyze visitors’ behavior by access patterns, while others focus on recommendation applications [43,44,47].
Contents of WWW pages are rich in information but cannot be queried and manipulated in a general way, because the information is semi-structured and is also dynamic (and therefore, not easily regenerated). Several research focus on approaches to mine data from Web pages. For example, Myllymaki and Jackson [87] convert HTML into XML because the data are easy to parse from an XML file. Hammer et al. [88] describe a “configurable tool” for extracting semistructured data from a set of HTML pages and for converting the extracted information into database objects. Bergholz and Freytag [89] present “a graph-based three-layer model” for querying semi-structured data while Webfoot, a preprocessor that parses web pages into “logically coherent segments” based on page layout cues, is presented in Soderland [90].
4. DESIGN OF TRAFFIC TRACKING MODEL
In this paper, we propose a comprehensive model to track a user. The traffic tracking is achieved in three ways: HTTP Proxy Sever, Improved Single-pixel, and JavaScript tracking. Proxy server tracks all requests and responses between a user and the Web server. Improved single-pixel uses a single-pixel image to track the user, while JavaScript tracking resides on the client-side and mainly tracks a user’s events on a page. We describe each of these techniques below.
4.1. HTTP Proxy Server
A proxy is an application-specific server program, which sits between a user’s browser and the requested Web server. When a user visits the Web server, the user connects to the proxy server program first, and then the program sets up relay connections to the Web server. After receiving and checking the request, the Web server then returns the Web page or an error page to the proxy, which directs the page to the user. Thus, two connections are set up - one between the user’s client on the source network and the proxy, and another between the proxy and the destination Web server. The proxy server transfers packets from one connection to the other throughout the lifetime of the connection. In the meantime, when the proxy server gets requests and returns the responses from/to the users, it records the information about the requests and responses into the data warehouse. Information recorded by the proxy server is similar to those in a Web log file. Since this approach tracks users based on the HTTP requests and responses, it works always irrespective of whether a requested page is static or dynamic. In addition, since this approach is developed for the tracking purpose only, the data tracked can be more specific. Therefore, compared with a Web log file, this approach makes the later data analysis simpler. This tracking process is illustrated in pseudo code shown in Figure 1. The address of the target Web server is obtained by specifying the predetermined Web server.
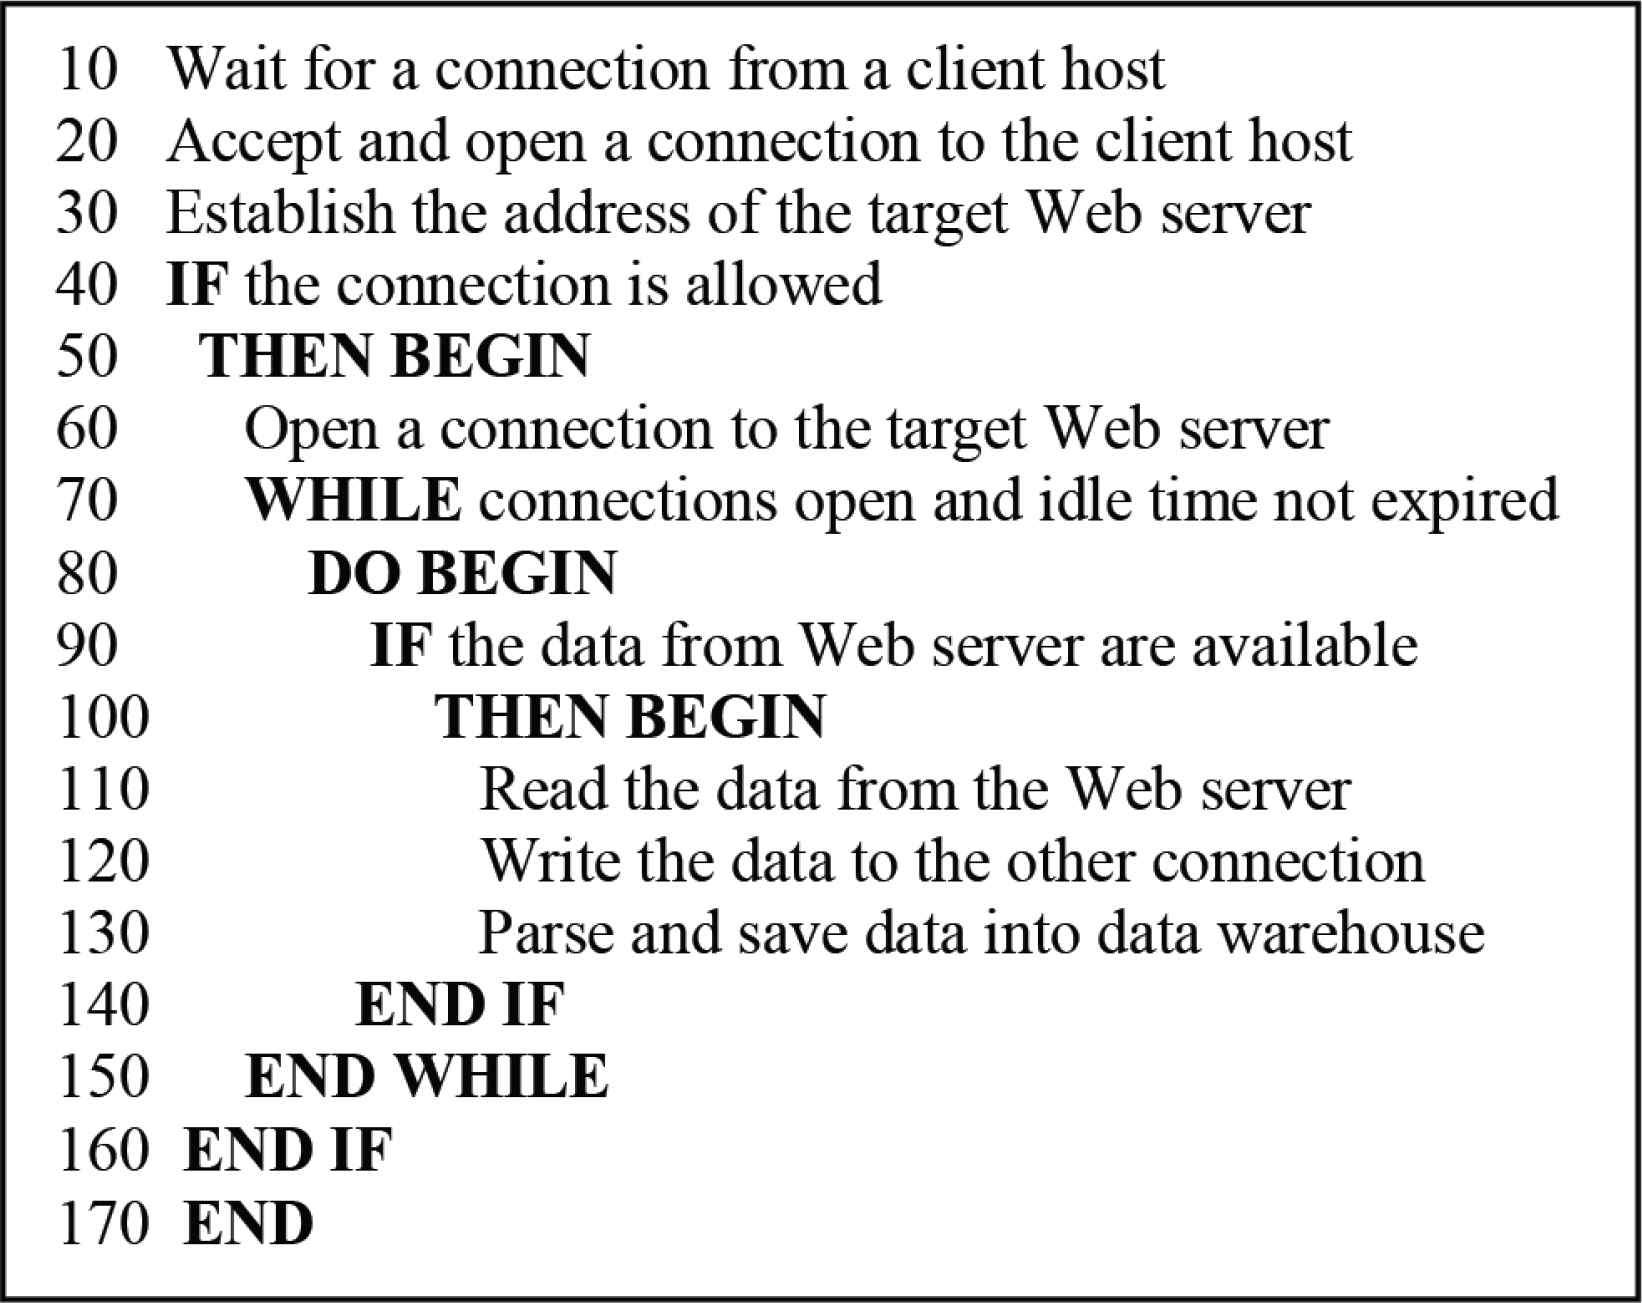
Simplified application proxy server tracking algorithm.
4.2. Improved Single-pixel Tracking Approach
Another method for tracking online users we developed in this paper is based on single-pixel image. This method uses HTML and Java [servlet] technologies. The tracking process is based on Java technology and the mechanism of image downloading.
An image tag is inserted on each of those pages on which we need to collect users’ data. Every time the page is requested and loaded, the image is loaded from the server. This image loading event triggers the tracking process by execution of the code attached or associated with the invisible IMG tag on the server.
The data tracked by this approach include the access time, IP addresses, user-agent, information about the request such as request paths, request methods (get or post), and session data. The triggered program, i.e., the tracking servlet, which is a program written in Java and runs on the server-side, collects the above information from the client through the HTTP protocol, and saves the tracked data into a data warehouse. Figure 2 shows the mechanism of this process.
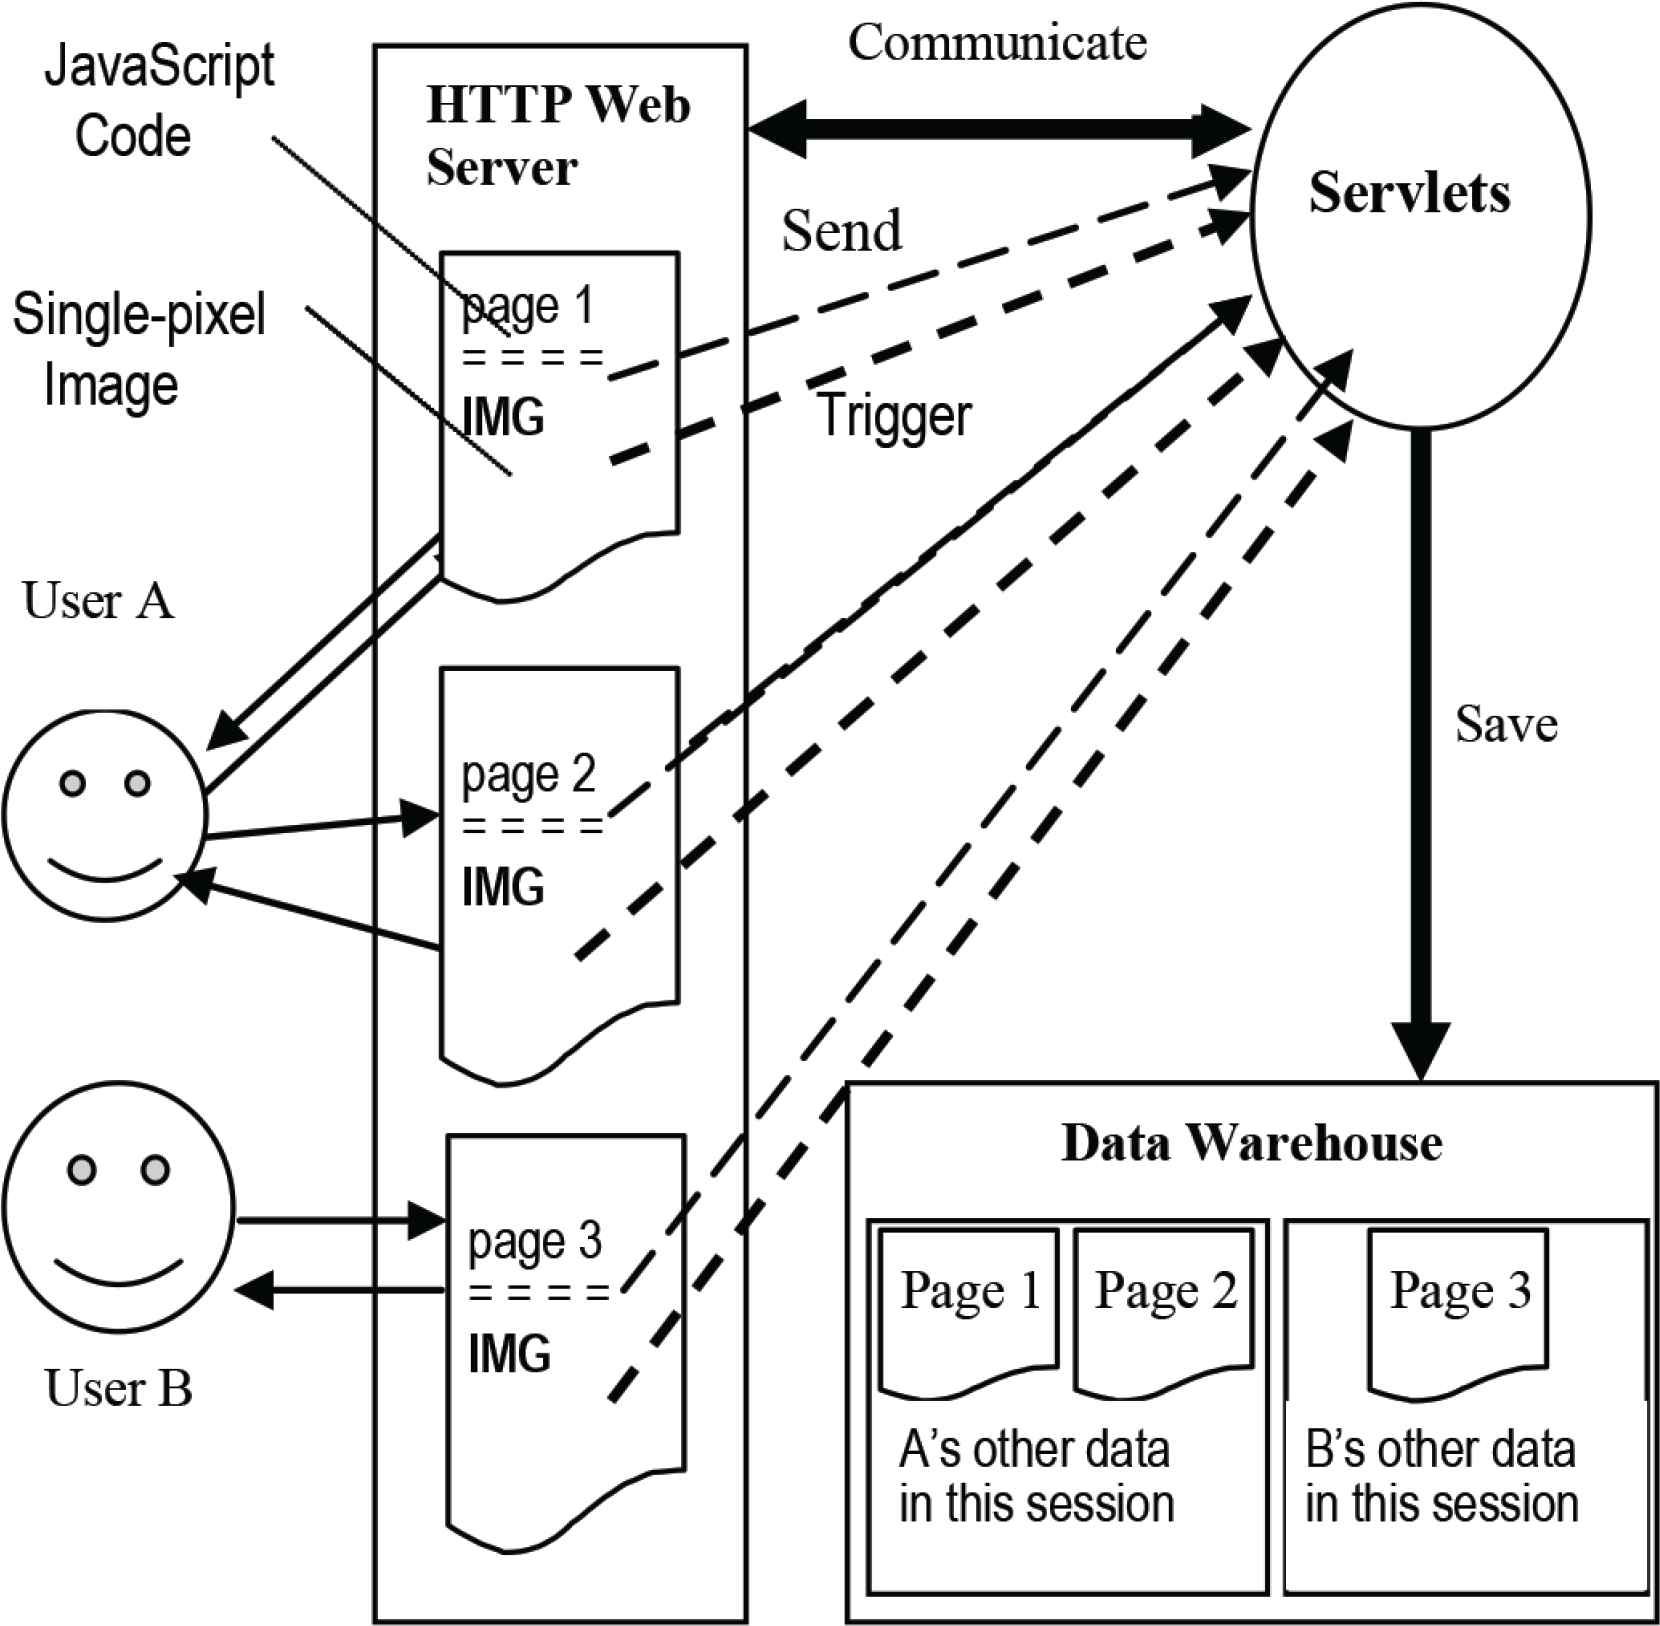
JavaScript tracking and improved single-pixel image.
The mechanism used by this traffic tracking approach is similar to that of the commonly used single-pixel technique, which is based on HTML, JavaScript technologies, and some CGI programs. However, compared with the general Single-pixel technique, our improved single-pixel approach offers the following advantages:
- •
Unlike those available tools which need the user’s browser to support JavaScript, our approach can work even if a user’s browser does not support JavaScript or the user turns off JavaScript functionality on the browser. This is one of the most distinctive features which make our approach different from those available tools.
- •
Java Servlets are extension of Java technology. They are designed to fulfill the “Write Once, Run Anywhere” promise. Therefore, they are compatible with many browsers on different platforms, while JavaScript and most CGI programs have some limitations on some platforms with some browsers.
- •
Java Servlet technology offers a more powerful control on the users’ sessions than most current available methods, such as cookies. Although the session technique is based on cookie technology, the Java technology adds more powerful functions and thus, makes e-commerce sites to identify users’ sessions and identify the unique users more effectively.
- •
With Java Servlet technology, more data, such as all the Web pages that a user browsed in each session, can be tracked. This is important for later analysis, since Web page content is a valuable source of data for Web data mining.
With the development of computer technologies, a lot of pages are dynamically created in response to a user’s request to the Web server. To insert tracking image into those dynamic pages cannot be done as in Figure 2. However, the tracking image can be embedded in the dynamic code for outputting the page. In this way, the inserted image can trigger the tracking servlet when the page is requested and the image is downloaded.
4.3. Javascript Tracking Approach
JavaScript enhances Web pages and servers performance. It has become the most widely used scripting language. JavaScript functions can be called, and often executed by keyboard strokes, mouse functions, buttons, or other actions from the user. Through JavaScript’s full control of a user’s Web browser, the user’s behavior on the pages can be captured. JavaScript is used to track a user’s keyboard and mouse movements on a page.
To achieve JavaScript tracking, a few lines of JavaScript code are inserted on each of those pages where we need to collect users’ data. For the JavaScript enabled browsers, when the page is downloaded, the inserted code on the page is also downloaded and runs locally to collect the user’s data. When the user unloads the page, the tracked data are sent to the server program, which writes the data into a data warehouse. Since JavaScript code works on the client-side, it can track almost all of a user’s events, which include mouse movements and keyboard events, form input, etc. In addition, the server-side program, which is triggered by the client-side events, can track session data about the user. Figure 2 shows the process of JavaScript tracking.
One difference between them is that the tracking task is achieved by tracking servlet, ImgServlet, which is triggered by the inserted image tag; while in JavaScript tracking approach, the main tracking task is implemented by the inserted JavaScript code. During navigation on a page, some user’s events will trigger the JavaScript code to send the tracked data to the server-side program, JsServlet, which mainly works for the purposes of session control and basic data processing.
Besides the advantages of using Servlet over CGI programs as in Single-pixel tracking, the other major advantages of the JavaScript tracking approach are:
- •
It is easier to add the tracking code on any Web page, since all the JavaScript codes are grouped in several external files.
- •
It works on both static and dynamic Web pages.
- •
It can capture the user’s keyboard events and mouse movements. A unique feature of the JavaScript tracking technique that distinguishes it from the other tracking approaches is that it can capture any form input including text-area, text-field, selection, etc.
Figure 3a shows how the tracking code is inserted into a static Web page. To insert IMG tag and JavaScript code into a dynamic Web page, simply embed them on the response page. When the page arrives at the client-side, the client’s browser will download the image and the JavaScript code. As a result, the single-pixel tracking and JavaScript tracking will run.
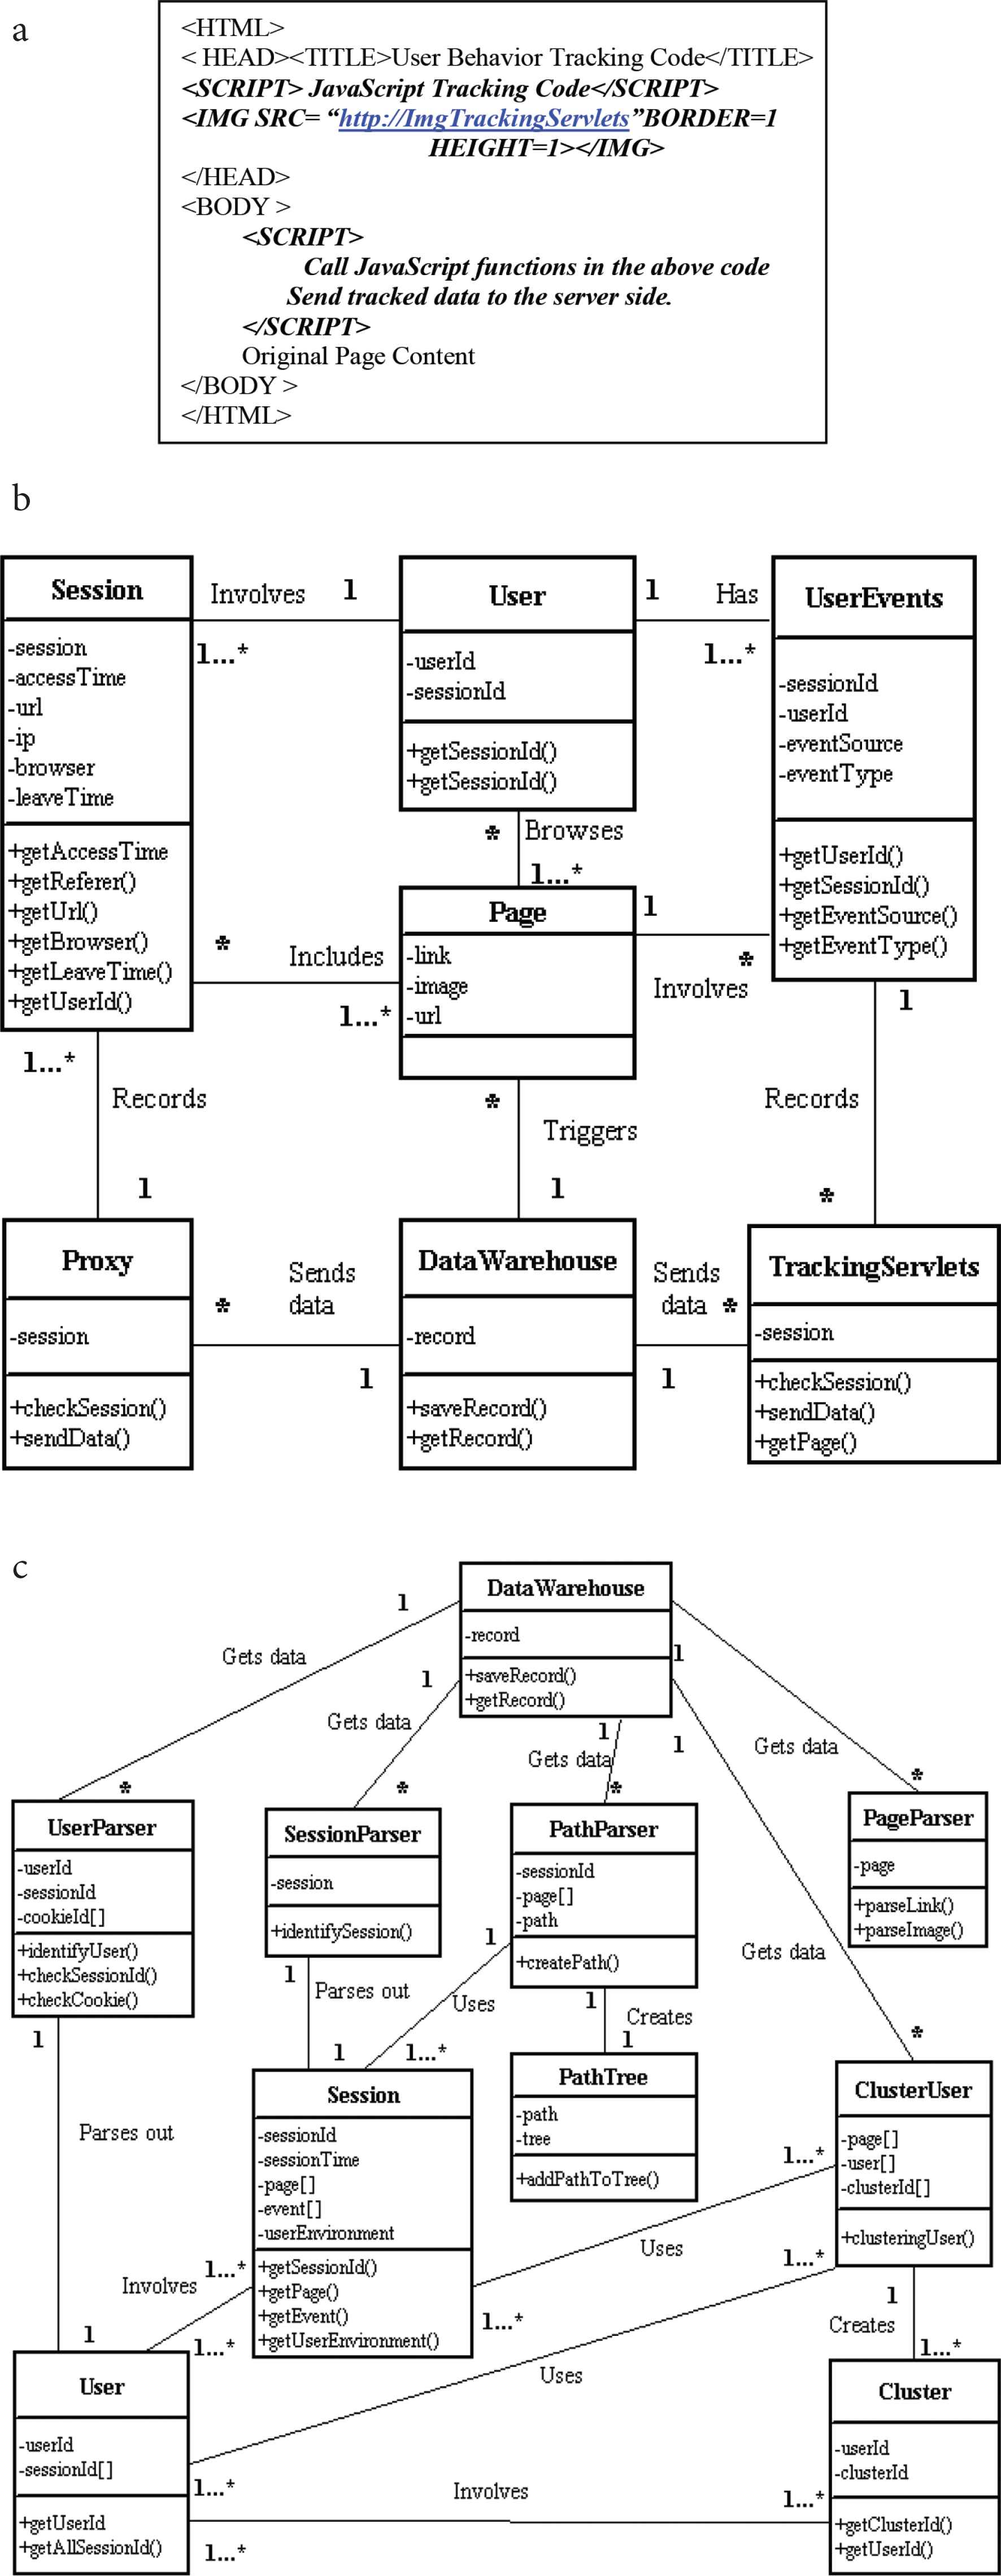
(a) Insert the tracking code into a Web page. (b) Class diagram for the tracking part. (c) Class diagram for the analysis part.
4.4. Data Storage
Another important aspect of the tracking system is the data storage. Any popular Web site has hundreds and thousands of online users. To keep all data of the users for such a Web site, a huge storage space is needed. Since the data include not only the Web usage data, which a lot of log files can capture, but also the users’ keyboard movements and page content, which involve images and links, these data need much more storage than textural information.
A data warehouse is an ideal storage model for the large sets of data. Among those three approaches, the proxy tracks page and session data and all data into the data warehouse when requests and responses pass through the proxy server. The data captured using the JavaScript code on each page are saved into strings with a pre-defined format and sent to the data warehouse finally by the servlet program. The data captured using the single-pixel approach is saved to the data warehouse when the image is downloaded.
Figure 3b and 3c shows the class diagrams of the tracking part and analysis part for this traffic analysis system, respectively.
The traffic tracking and analysis tool runs at the back end of an e-commerce Web site mainly for the tracking and analyzing of the users’ data on that site. Due to anonymity of online users and statelessness of the HTTP protocol, tracking on the server side as the traditional Web log files is not only necessary but indispensable to keep session data, and thus help identify unique session or unique user. An HTTP proxy and several Java servlets are used to implement the server-side tracking.
However, simply doing tracking on the server side alone does not offer much relevant data. The HTTP protocol does not send any data back to the server after a page is rendered, unless the user makes another explicit request. That means, just by server-side tracking, a lot of data will be missing while the user is surfing on a page. To capture those data, tracking on the client-side becomes a necessity. To achieve this goal and also make this tool distinctive from most tracking tools which track users on the server-side, client-side tracking technology is used to obtain user data more directly and naturally. JavaScript, and HTML image technologies are used for the client-side tracking task.
Single-pixel image is used as one major part of client-side tracking in this tool. The tracking program can be triggered by any browser (with image downloading function) running on almost all kinds of operating systems on the client side. It runs when the page is downloaded. The other tracking program sits on the server-side. The user data is sent to the server-side servlet once the program starts. Therefore, the user has no knowledge of this program running at the background.
5. TRAFFIC DATA ANALYSIS MODEL
In e-commerce, users’ navigational behavior indicates their steps through the online buying process [83]. Therefore, analyzing tracked navigational data is rapidly becoming one of the most important activities for any business on the Web. On the other hand, from the analysis of what the online users do, the business knows how its site is being used.
The anonymity of online users means that the tracked data about the users’ navigational behavior are of little use or meaning if the following three major problems cannot be solved.
First, any data should be related to a unique user; second, all the data related to a unique user should be sorted in sessions; and third, determine how the users navigate around this site. The analytical results of these three issues are the common focus of all businesses for the purpose of marketing or site management. In Web data mining, these three problems areas are called user identification, session identification, and path analysis, respectively.
5.1. User Identification
To identify a unique online user is a hard task. The existence of local caching, corporate firewalls and proxy servers contributes to the complexity of this task.
Normally, local caching (e.g., the user’s browser’s caching), allows a user to get a requested page from its browser’s caches if the page already exists in the cache. If the local caches exist, when the user clicks “back” to return to a visited page, this request is not passed to the Web server, and the proxy cannot log this event. But with the improved single-pixel method, this event can still be tracked and, thus, this does not represent a significant problem.
IP address is the most commonly used method to identify an online user, but proxy servers and firewalls raise some challenges to this method. A lot of online users come from corporate networks. Most corporate networks today are behind firewalls or use proxy servers. In this context, a proxy server is a computer which is set up and stands between an organization’s Intranet and the Internet. Only the proxy server’s IP address, which hides all computers’ real IP addresses on the Intranet, can be seen publicly by computers outside the organization. When the computers inside the Intranet are started, the proxy server manages and dynamically assigns the organization’s IP addresses to them. Also, the proxy server manages organization’s Intranet’s connectivity. With a proxy server, a computer outside the proxy server sees the requests or responses from any computer on the Intranet as originating from the proxy server’s IP address and uses that IP address to communicate; on the other hand, the proxy records the dynamically assigned IP addresses of all the computers on the Intranet, and routes the requests or responses from the outside computers to the inside destination computers [91].
A firewall is a collection of components placed between the company’s intranet and the Internet. It may be part of a proxy server or a router. The purpose of a firewall is to prevent unwanted users from accessing computers within an organization’s intranet. At the same time it allows inside users to access the Internet. A firewall can be configured to allow or disallow specific external IP addresses to access some or all of the organization’s resources, such as the organization’s HTTP Web servers, FTP servers, telnet servers, etc [91]. Like a proxy server, the firewall can prevent making public individual computers’ IP addresses inside the firewall to computers outside the firewall. Instead, all requests and responses from the computers inside the firewall would appear to the computers outside the firewall to come from the same IP address.
Even with the improved single-pixel approach, to uniquely identify a user simply by the IP address is impossible or at least is a very inaccurate way. Some other methods should be used to deal with this problem.
Cookie technology and dynamic URL with an embedded session identifier have been widely used by Web sites to identify unique users [64], although they both are not as powerful and effective in keeping users’ information as session control technologies. However, cookie technology is the basis of session technology, and we still track cookie value as a supportive approach to identify unique users if such values are available, while using user ID’s tracked in JavaScript code as the major measure to identify the unique users.
Since we have three sets of tracking procedures, we have more session data. When one approach does not work well, we still have another approach to collect data. Based on the rich data, we can identify a user in different ways once some measures are less effective. Moreover, our tool records data by page views instead of hits. This approach reduces the amount of work required to purge those unnecessary data in the process of identifying unique users.
Figure 4 shows the algorithm to identify whether two tracked records in the data warehouse are from the same user. Due to the characteristics of the Web environment, it is impossible for any algorithm to 100% precisely identify unique online users. This algorithm does not either. In some situations, for example, if a user browses a site with two different browsers on one computer at the same time and no cookies enabled, the tracked records A and B from the two browsers are regarded as from two users [92].
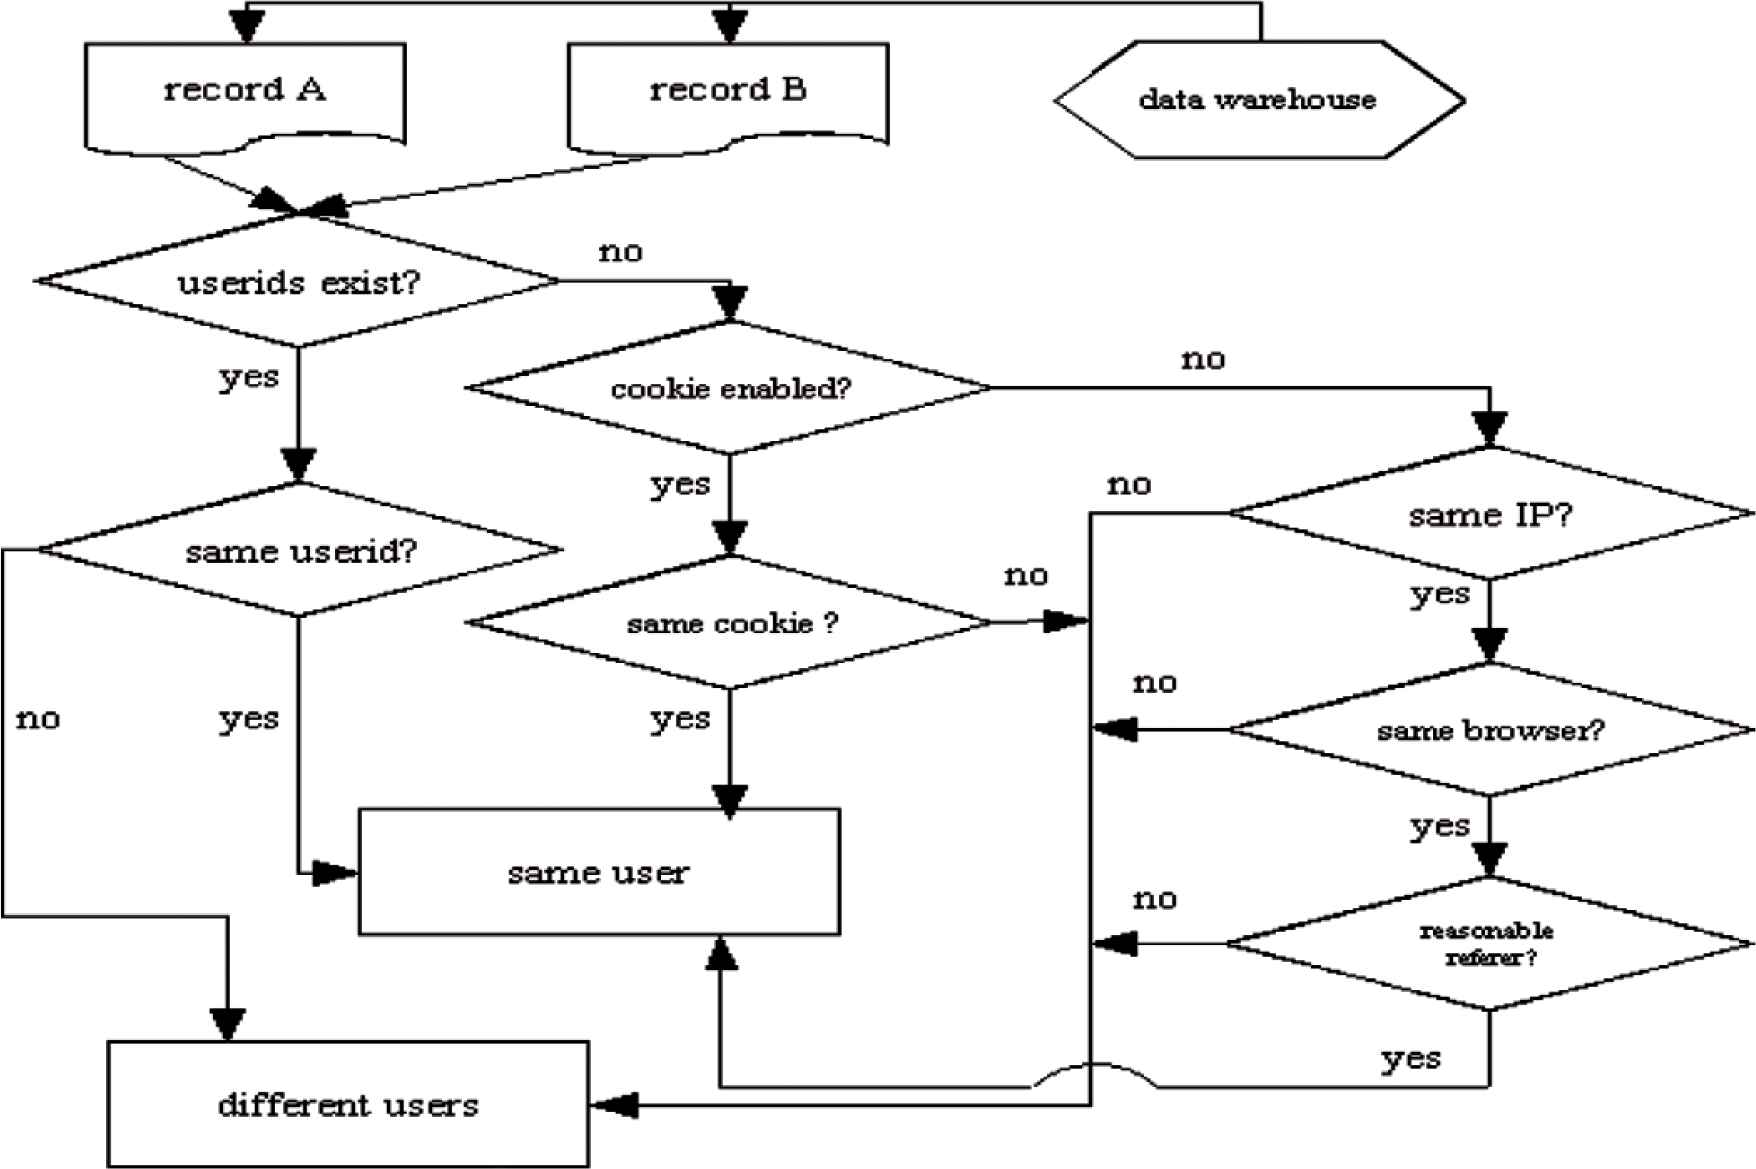
Identify unique users.
Another example of a challenge is that if a user leaves a site for a couple of hours and comes back. If the user’s browser is cookie disabled and no user ID is tracked, it is impossible to differentiate whether it is from two different users or one same user, though A and B show that they are from the same IP address, the same browser on the same operating system. However, this algorithm regards these two records as originating from two different users. This algorithm, however, based on most Web users’ regular behavior, can offer fairly accurate and valuable statistics of the traffic of the site over time.
5.2. Session Identification
A session is the span of the time that a user stays on a site during one visit. To any Web site, users can be new or returning ones. The data warehouse already has the data about all previous users. For a frequent user, the data are huge in size. Less meanings could be found from user’s data like these: Page (A) three times, Page (B) four times, Page (C) five times during three visits. But if we divide these data into three sessions, {A, B, C}, {A, B, B, C, C}, and {A, B, C, C}, we can know exactly what the user browsed during each of the past three visits. The purpose of the session identification process is to group all activities of a user based on each visit of the user.
Every time a user visits a web site, the user spends different lengths of time in each visit. This situation raises the difficulty to define the length of a session.
Generally, most commercial Web products use 30 min [93] as a default timeout or 25.5 min based on empirical data according to Cooley et al. [92]. Using these values as a guide offers a way to session division, although, sometimes, the actual length of the timeout can vary with the actual usage of different sites. In this paper, the length of a standard session is 30 min.
Figure 5 shows the algorithm for identifying sessions. In this algorithm, we use a list structure to keep each session data, although other data structures could also be used to keep session data. Each session is a node on the list. Each session consists of a vector which includes one or more records. After completion of identifying sessions, the original data become nodes of the list which is linked and sorted by the access time. This data organization technique facilitates the later search and analysis process.
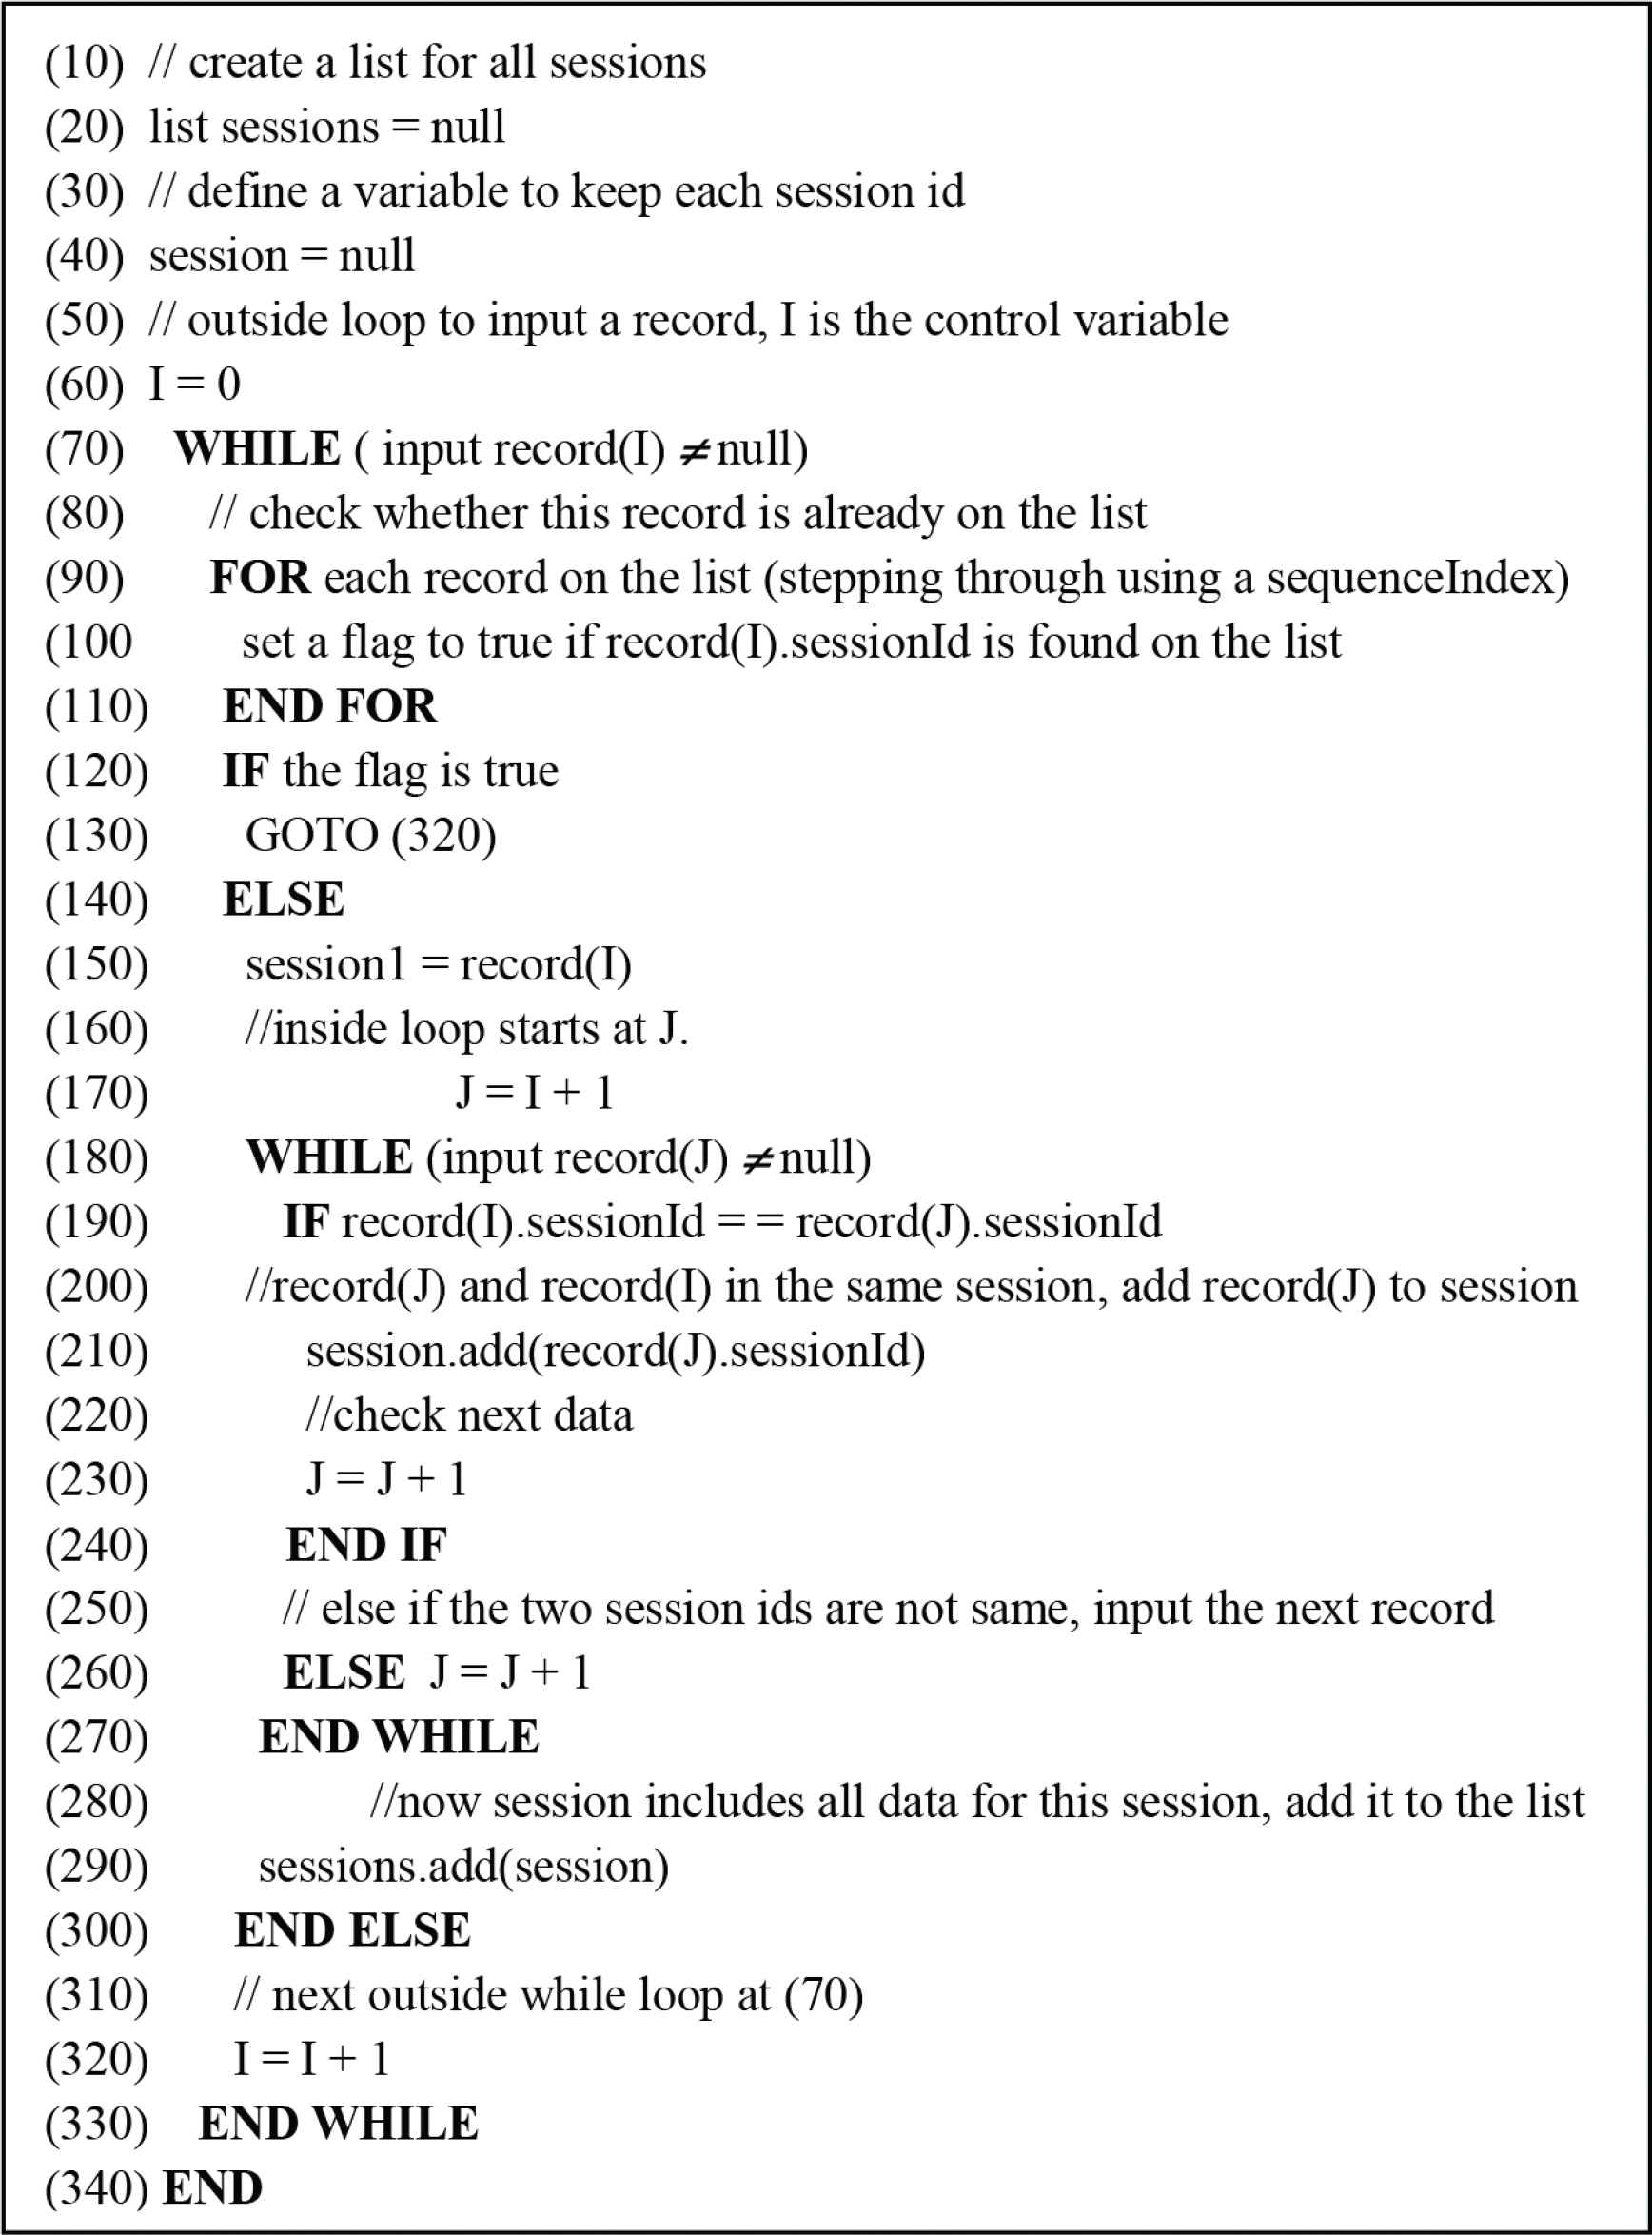
Algorithm for session identification.
Through user and session identification processes, all the original tracked data are now grouped according to different users and sessions. From these processed data, we can derive some simple facts about the users, such as which pages a user browsed, when, etc. To get more information about the users, we must know how they navigate through the site, where they come, and exit the site.
5.3. Path Analysis
Path analysis is a technique, based on the analysis of the users’ navigational patterns, to understand how the users navigate through a web site [1]. It also sheds light into the site structure and helps locate trouble spots of the site [84] Unlike a regular Web site where most users navigate following random patterns, e-commerce sites share a lot of common features in their site structures so that shoppers can easily view product catalogue, add to or remove products from shopping cart, and make payment. For example, most sites have catalogue pages (for showing products), shopping-cart or basket operation pages (for adding or removing products), check-out page (for payment), and payment confirmation page (for payment confirmation). Therefore, for most e-commerce sites, each of them has at least one expected typical path which leads its users to navigate through the site and achieve a purchase process with a high level of effectiveness, which means ease and ability to provide users with impulse purchase opportunities during browsing and attract and retain more customers.
A practical business goal of path analysis is to understand why some shoppers abandoned the buying process and leave before making a purchase. Focusing on the entry- and exit-URL, we can find or assume the answers to the above question. Normally, the expected entry-URL is the first page of the site such as index.html, home.html, etc.; the exit-URL is the payment confirmation page. A single shopper’s data can not reflect something very meaningful. But if a lot of shoppers leave before going to make payment, this may suggest they do not like what they put into their shopping carts, or perhaps some pages on their way to make payment are running too slowly [84].
Basic path analysis is based on checking both referrers and site topology to support user identification [92]. Advanced path analysis can be used to achieve more complex tasks such as serving as a basis of personalization [46] or recommendation systems. One of such examples is to predict HTTP requests [48], which is based on path profiles and recommends an URL with a high probability to the user before the user makes such a request. A lot of analyses have applied sequential pattern discovery techniques [41,42] to discover frequent path patterns. In this section, we develop a data structure and an algorithm to find the frequent navigational paths.
For the advanced analysis, we must know which paths exist and how many times a path occurred. To efficiently reflect these two requirements for a path, we use the record data structure, which is similar to that in Sunil and Doja [51] and shown in Figure 6, to represent a node of the path tree.
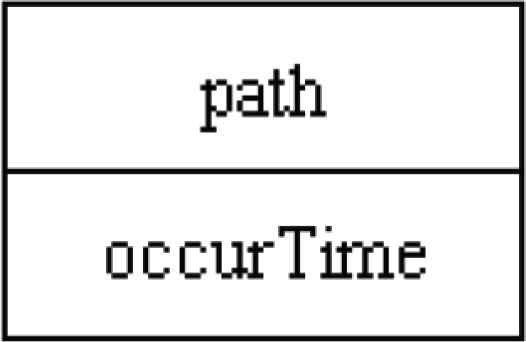
Data structure for a node in the path tree.
In this data structure,
- i.
“occurTime” is an integer, which means the number of occurrences of this path. Its default value is 0.
- ii.
“path” denotes a path which is already in the tree.
The current version of HTTP allows a Web client to pass almost everything in the parameter field when using the GET method and the attached information forms an essential part of the URLs. For example, when searching for “hello” using “Google”, after the search, the URL on the result page of the search becomes:
“http://www.google.ca/search?hl=en&ie=UTF-8&oe=UTF-8&q=hello&meta=”.
Some parameters are attached to the original URL “http://www.google.ca”. However, on the Web, most of the attached parameters to URLs serve no purpose other than tracking the users’ sessions [94]. They are of less use for analyzing paths. Since in the path analysis, for example, we are interested only in knowing whether a client used “Google”, not what the client searched. Although no agreement about whether or not keeping parameters to URLs in data mining has been reached, in this research, we ignore all parameters.
After processing the parameters in all URLs, we use the following shorthand notation, p <i>| i ≥ 0, to represent a URL to facilitate comparison and store process of URLs. Suppose a user has browsed the following five URLs in a session:
http://www.yahoo.com (p1)
http://www.yahoo.com (p1)
http://user.auctions.shopping.yahoo.com/showcase/fathersday03 (p4)
We assign each URL a same letter and a unique integer (for example: p1, p2, p3, p4) to represent a URL string. If a URL appears twice (for example, p1) in a session, that string (p1) appears twice too.
In this way, the above session can be represented as a string array {p1, p2, p1, p3, p4} which in fact represents all the URLs the user browsed in that session. One benefit of this kind of data structure is that we can easily apply string operations to differentiate and show paths in a straightforward way. For example, if we know a path is from page 1 to page 2, we can use p1p2 to represent it; on the other hand, a path of p1p3p4 can be straightforwardly interpreted as the path starts from page 1 to page 3, and then to page 4.
The tree structure is an efficient and straightforward way to store non-linear data like paths. Figure 7a shows the pseudo-code of the algorithm to build a path tree while Figure 7b shows an example of such a tree based on the data from one user’s session using Figure 7(a).
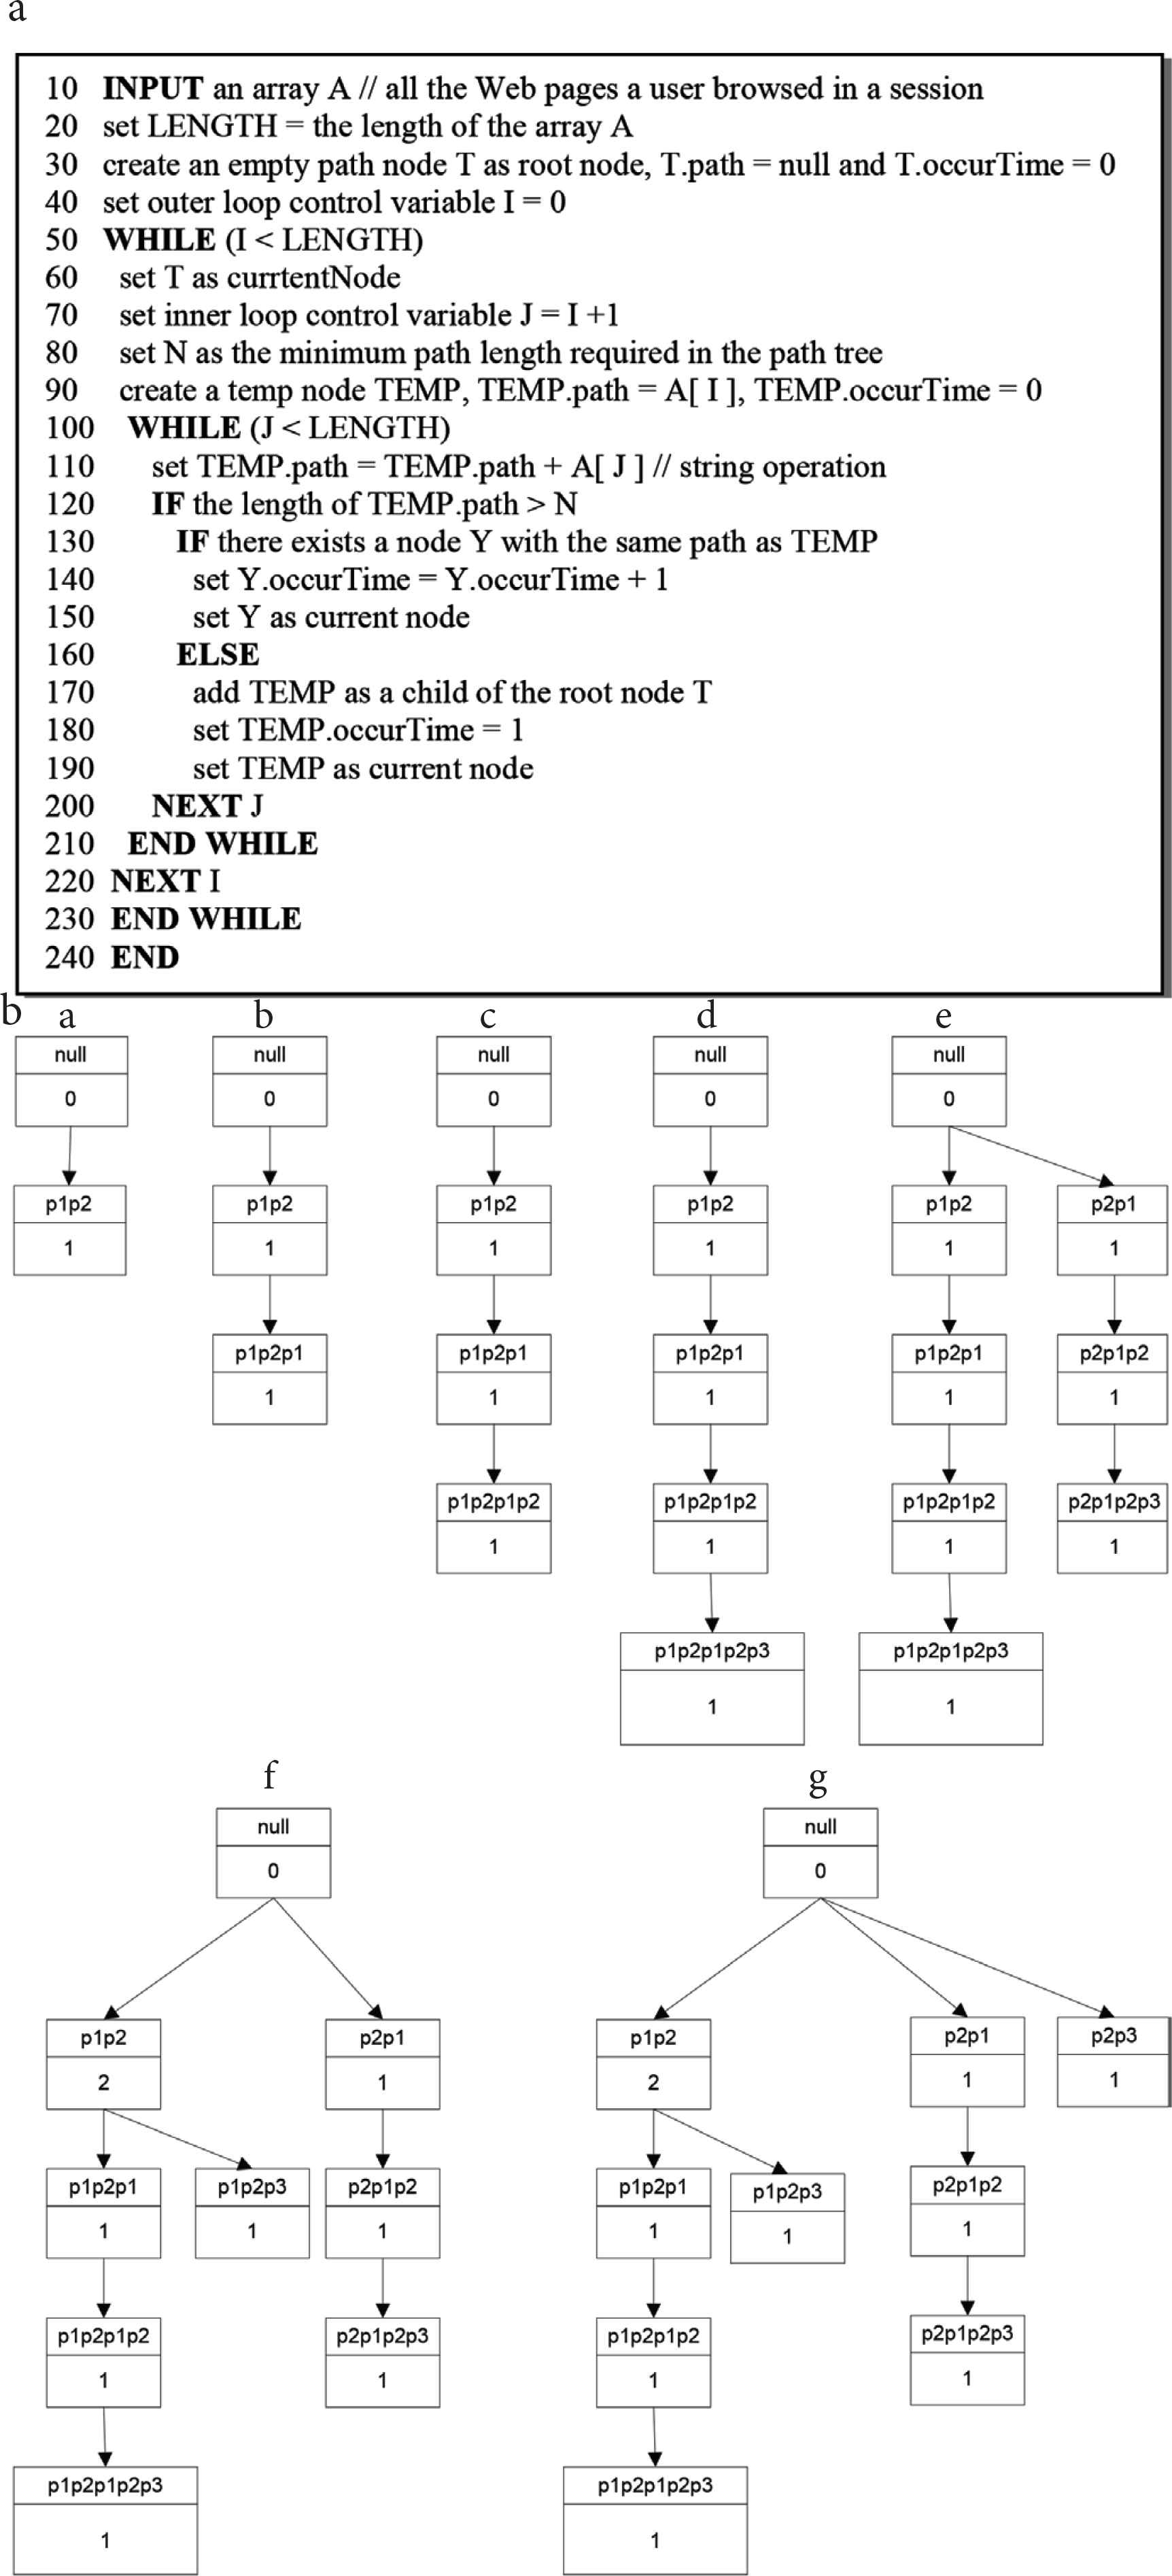
(a) An algorithm to build a path tree. (b) Figure 7(b) a – g are the path trees resulting from the step by step application of Figure 7(a). The final path tree is shown in Figure 7(b) g.
5.4. Clustering User Transactions
Clustering is the process of grouping similar objects. As a result, each cluster is a set of similar objects [95]. The basic data in a clustering operation consists of a number of similarity judgments on a set of objects. This mechanism helps us apply clustering to mine information from Web traffic data.
To apply clustering method to our data analysis, we need to define a user session in another way as in most Web usage mining literature, such as Mobasher et al. [94].
Definition:
A User Session File and a User Session
A user session file includes all sessions of a user. A user session P = {p1, p2,…,pn} can be thought of as one transaction of n page views (i.e., n pages can be represented in one transaction P), or n transactions of single page view (i.e., one transaction includes n pages), where p1, p2, … pn are URLs browsed in that session.
Any Web page can be categorized as a content page, navigational page which leads a user to the content page, or mixed. Based on a page’s category, a user session which includes one or more pages can be divided into one or more small transaction sets [92]. To simplify our analysis, we assume that each user session is viewed as a single transaction and those session files with low support references (for example, not more than two URLs) are filtered and discarded. This can remove the noise from the data and improve space and speed of later analysis [94].
After identifying all users and all session files for a given Web site, we can obtain the following set U, which contains all unique URLs and a set T which contains m user transactions. That is,
In this way, all the user transactions can be mapped into an n × m matrix of URLs. Each transaction is a row in this matrix. We use binary weights to represent whether or not a URL is included in a transaction ti. The following example shows a 3 × 4 dimensional matrix which represents a set of three transactions, T = {t1, t2, t3} and a set of four unique URLs, U = {url1, url2, url3, url4}.
| url1 | url2 | url3 | url4 | |
|---|---|---|---|---|
| t1 | 1 | 0 | 0 | 1 |
| t2 | 1 | 1 | 1 | 0 |
| t3 | 0 | 1 | 0 | 1 |
To find similarity between two transactions, we have to find the distance between them. Since each transaction can be regarded as a vector in the above matrix, it is a straightforward way to find the distance between two transactions by measuring the cosine value of the angle between two edges – two vectors. The cosine value is zero if two transactions have no URLs in common and one if the two transactions are identical. In other situations, the cosine value is an intermediate value. If the value is closer is to one, the two transactions are more relevant. The cosine formula is shown as follows:
To decrease the dimension of our transaction matrix, like what we presented in path analysis, we do not consider those “unimportant” transaction files.
After calculating all the distances, we obtain a new (n − 1) × (n − 1) dimensional matrix which consists of all distances. Each element of this matrix is a float value between 0 and 1 inclusive. This matrix forms the basis of our clustering.
Many clustering algorithms are available for clustering operations, such as the k-means algorithm [95]. Although we use simple distance clustering in our implementation, we show the approach to apply k-means algorithms on our data source – the distance matrix. To achieve this, we can create a set S of transaction clusters. S = {s1, s2, …, sr}. Each element of S is a set of user transactions and represents a group of users with similar navigational patterns.
Instead of creating a mean vector in each cluster as in Mobasher et al. [94], we go back to each transaction file and compute the percentage of each URLs occurrence times in each cluster. This way is straightforward and much simpler. To decrease the dimension of each cluster, we can set a threshold percentage to keep only those important transactions which are of high percentages.
These clusters can be used to analyze users’ interest. For example, suppose a user has browsed the following pages: url1, url3, url5. If there exists a cluster {url1, url3, url5, url9, url2}, we can assume that, like other users in the cluster, this user may also be interested in url9 and url2. Moreover, if the percentage of url9 is higher than url2 in the cluster, then url9 can be recommended to this user in a simple Web recommendation system, though most recommendation systems do more analysis before such a recommendation is made.
5.5 Formal Specification
In the design of this tool, we use a formal method which is based on mathematical theory, especially discrete mathematical theory, and notations. Set theoretical notations are used to describe structural components, while predicate logic is used to describe requirements. In the specification, any requirement is described by two predicates: pre- and post-condition. The pre-condition for a requirement asserts what must be true before any operation implementing the requirement is invoked while the post-condition asserts what must be true after any operation that implements the requirement is finished. Figure 8 shows an example of the specification for a process to add an entry into a database.
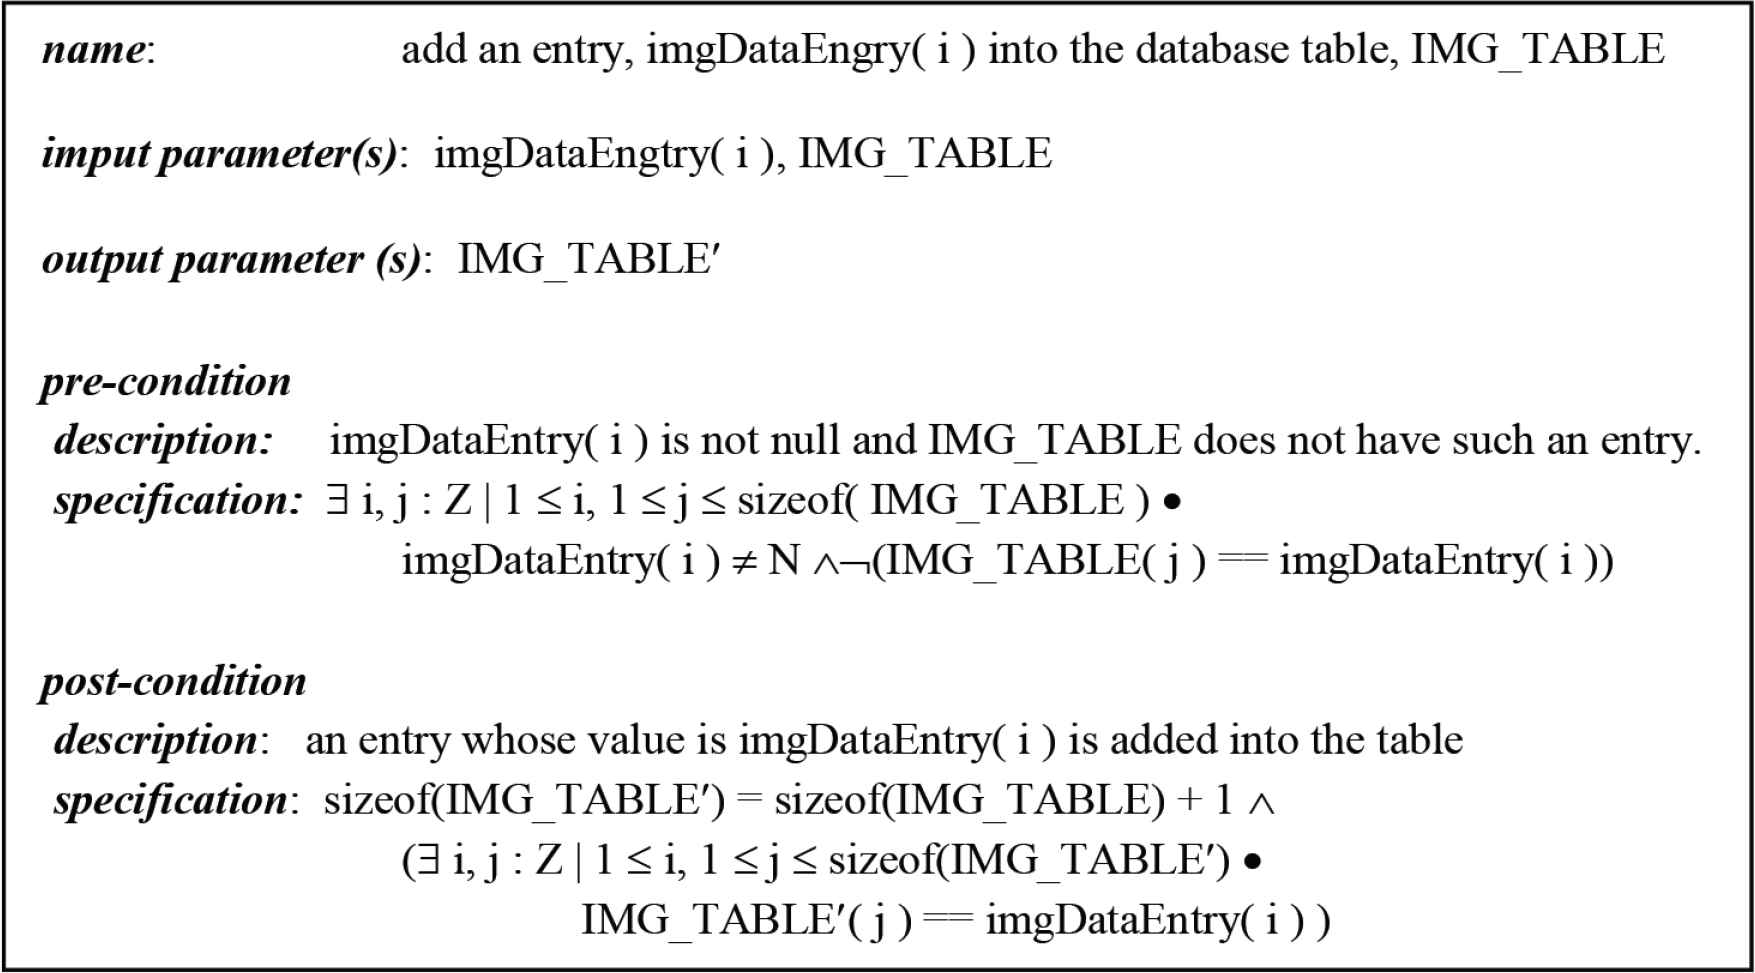
A specification for a process to add an entry into a database.
Since formal methods provide abstract and precise descriptions of system properties, as a result, using formal methods in the software development can remove ambiguity, help clarify and understand the system properties based on appropriate formal reasoning [96–98].
6. IMPLEMENTATION
Our implementation environment consists of Java/JavaScript programming language, Tomcat (version 4.1.27) built-in Web server, and Microsoft SQL Server 2013 database server tools, and a testing site with nine pages, including both static and dynamic pages. We tested the traffic tracking and analysis tool on a local host. Figure 9 shows a three-tier architecture deployment of the tracking and analysis application.
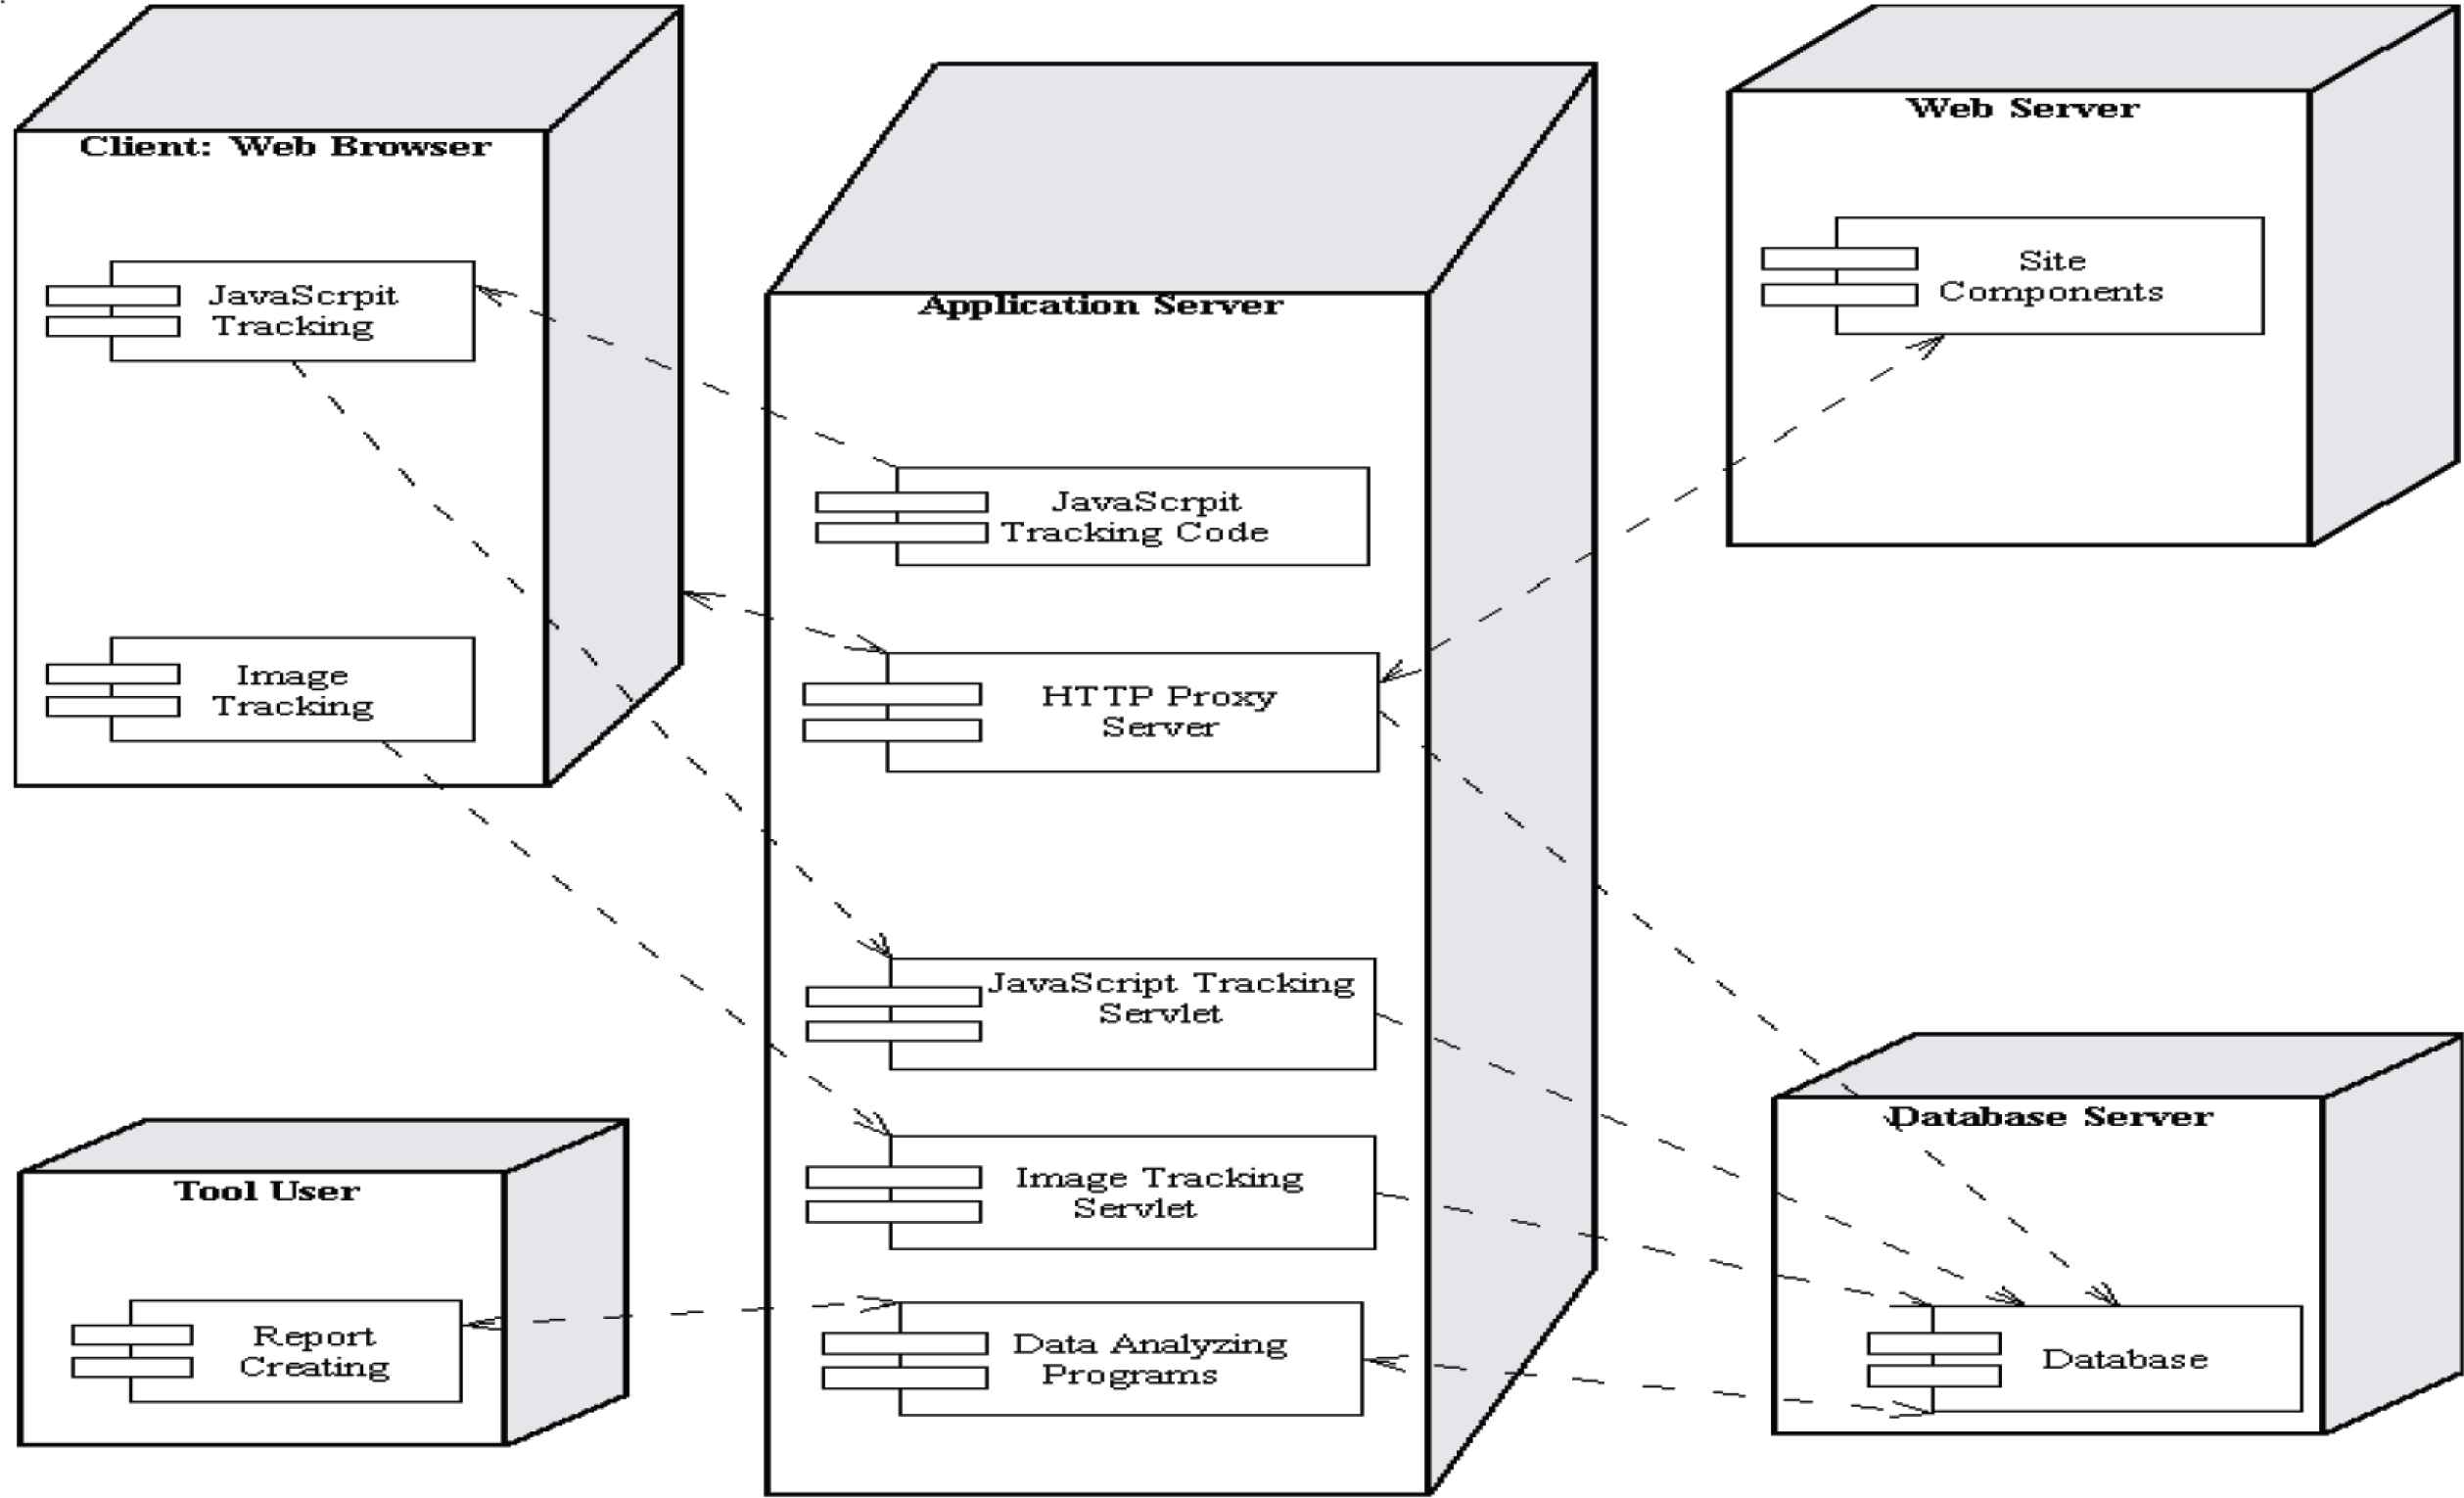
Deployment diagram.
In this architecture, the first tier, known as presentation tier, mainly the Web browser, includes client-side control such as user input validation; the second tier, known as the application server, provides the business processes and data operations; the third tier stores the data.
The three-tier architecture is advantageous because (i) modifying or replacing any tier component is easy without affecting the other tiers, (ii) it offers better load balancing because of separation of the application and database functionality; and (iii) more security policies can be enforced on the server tiers because of the separation of the client and server.
6.1. Major Strategies for Traffic Tracking
The Web server is set up to listen on the port 8080 while the tracking proxy server listening on the port 80, so all requests to the port 80 (default for Internet connection) will go to port 8080.
We used external JavaScript files instead of embedding a lot of code on each page. This approach simplifies code management for both the page source and JavaScript tracking. In particular, for dynamic pages, it is hard to put a lot of code on the output pages. Also, since we can use as much code as possible in an external file, this makes our approach more powerful.
A dynamic page is created by a servlet instead of a real page in the improved single-pixel image tracking. In this way, we can easily set up the values of the headers (the expires header, the cache control header, and HTTP-EQUIV META Tags) of the response page so that the created page is not cached by the users’ browsers. Also, since we use the image-downloading event to trigger the tracking servlet directly, as a result, no JavaScript is needed for this approach. In addition, using servlet technology makes session control for tracking very powerful.
6.2. Implementation Results
In this section, we use snapshots to show the results for user tracking and analysis which is done based on the tracked data.
Figure 10 shows the user changed the value in the second form, which triggered the JavaScript code to capture data from all form inputs. Item 1 and 2 show that the user deleted the default value of the province input box and typed “M” and “B” successively. Item 3 shows the user moved the mouse out. Dynamic pages are widely used not just for e-commerce sites alone. Figure 11 shows that JavaScript tracking also works well for dynamic pages. The displayed page, page 8, is dynamically created by a servlet based on the user’s request.
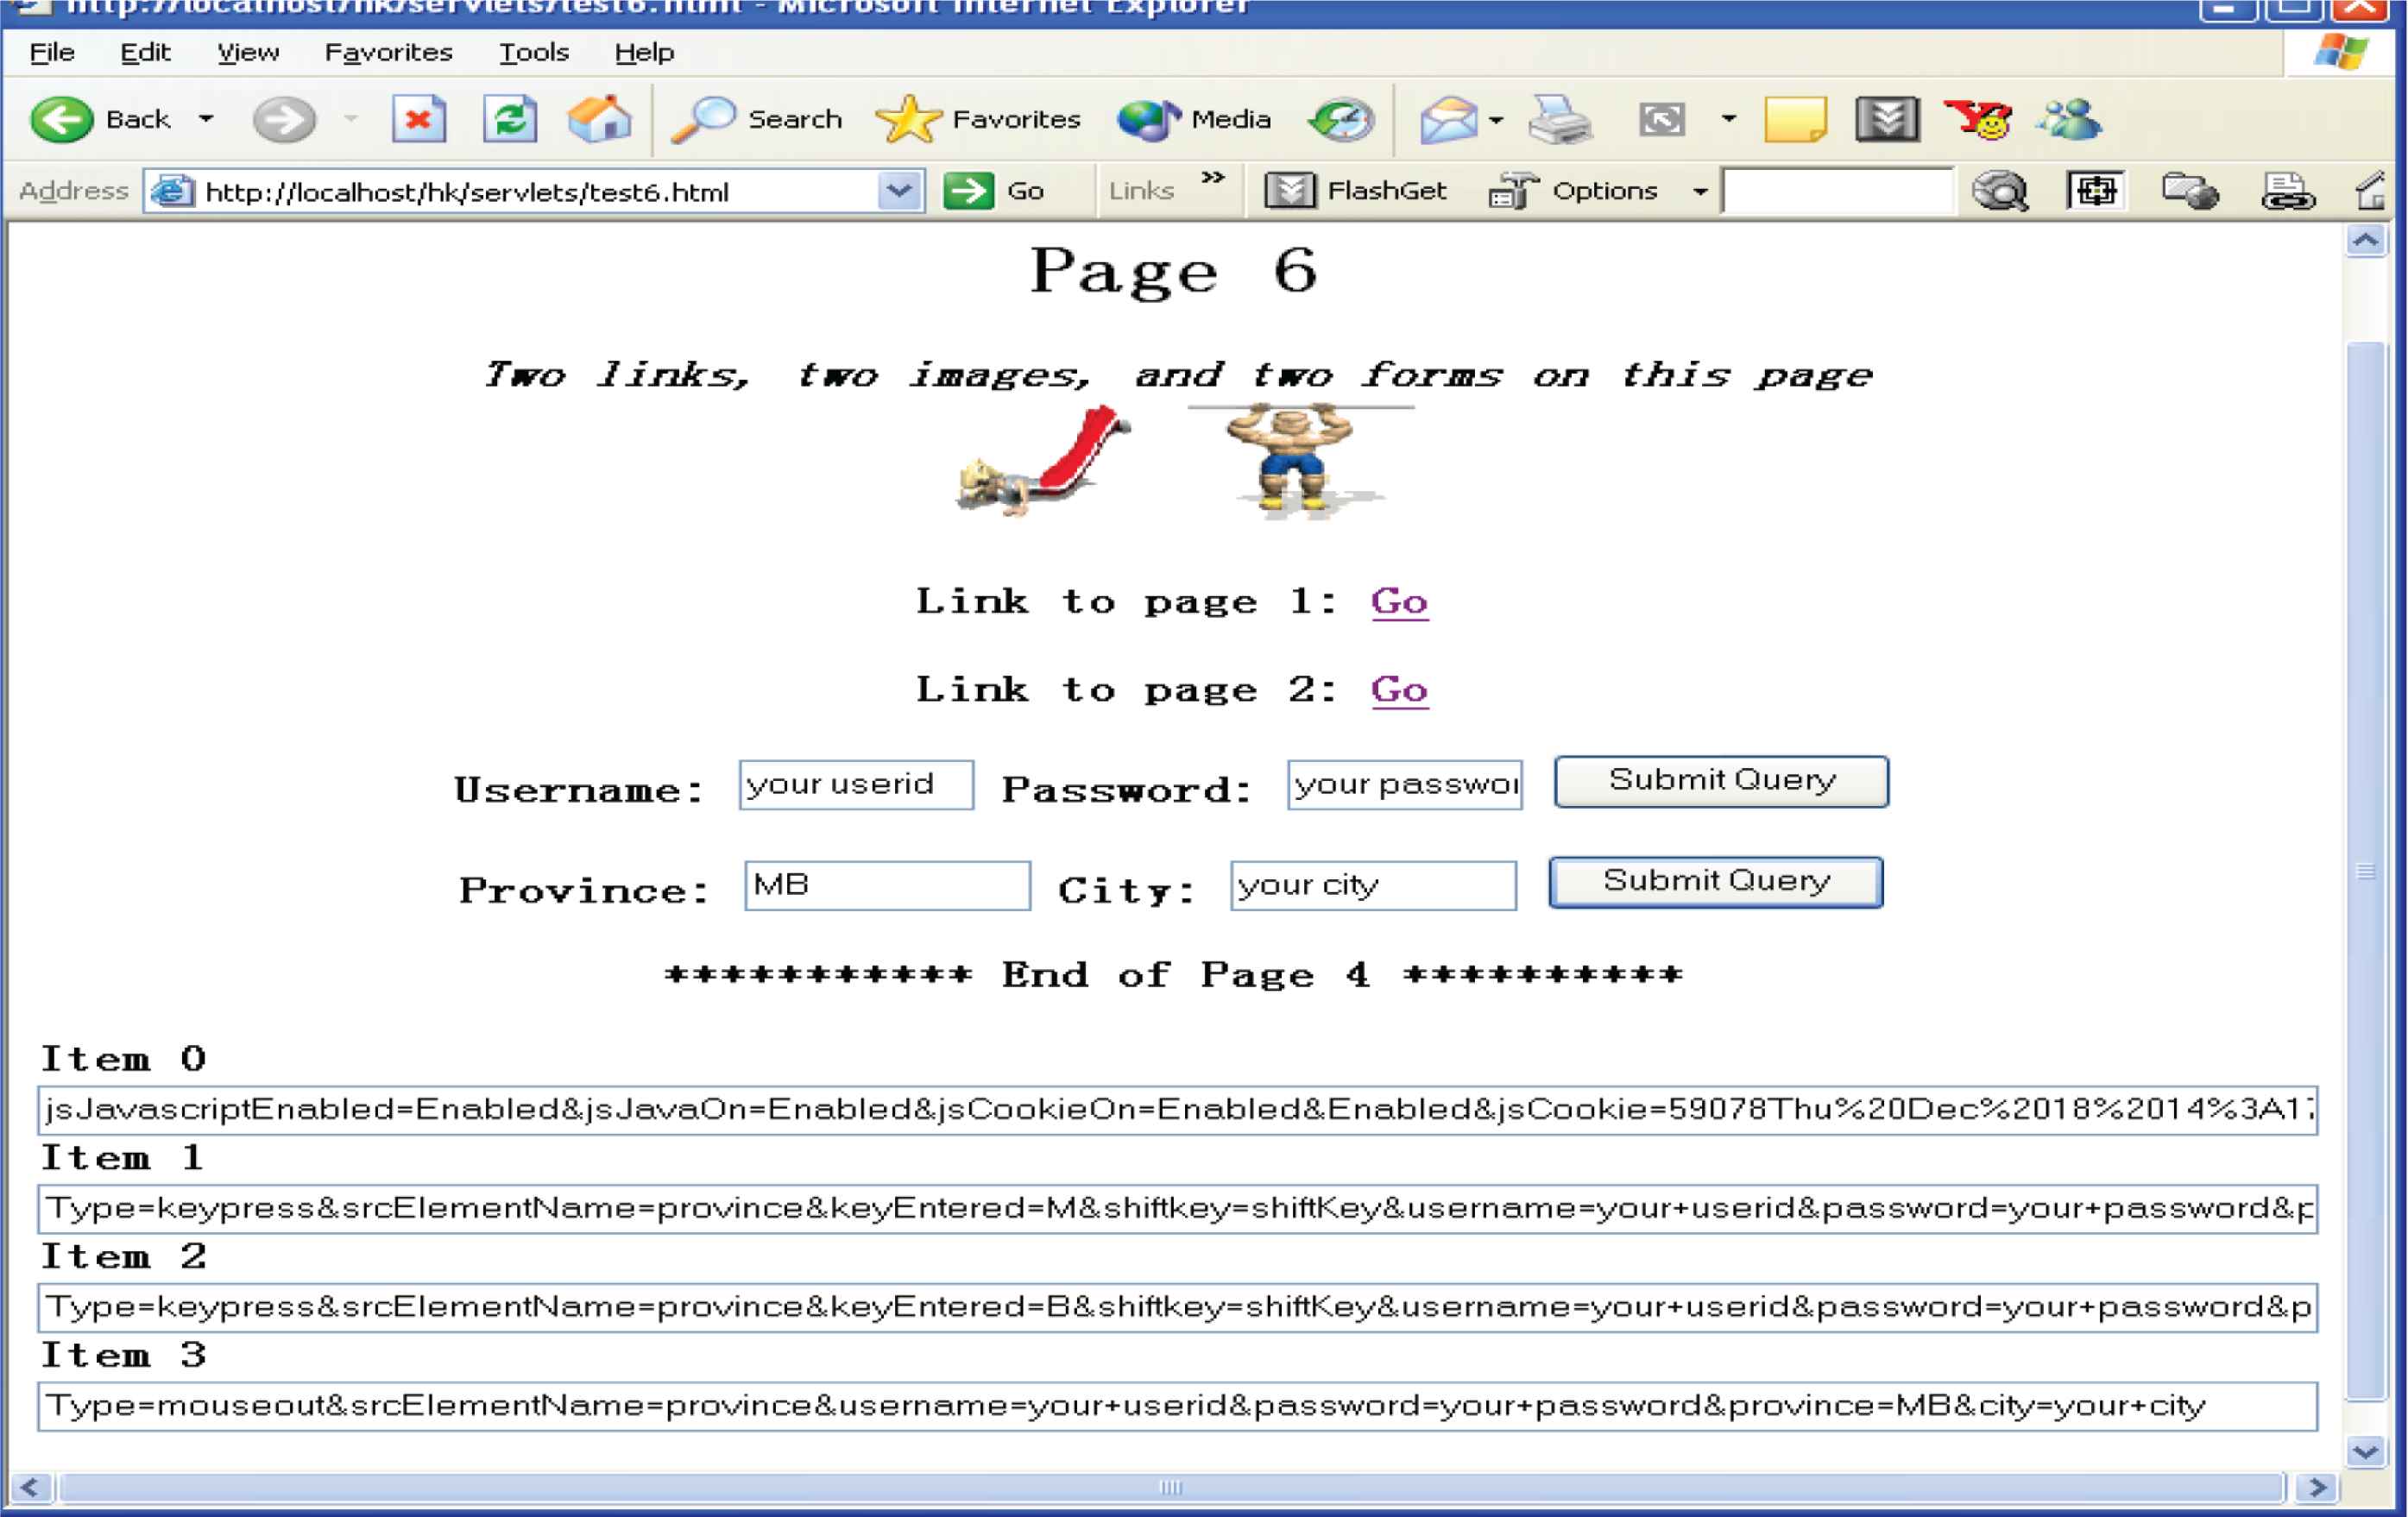
JS tracking for MSIE browsers: multiple forms.
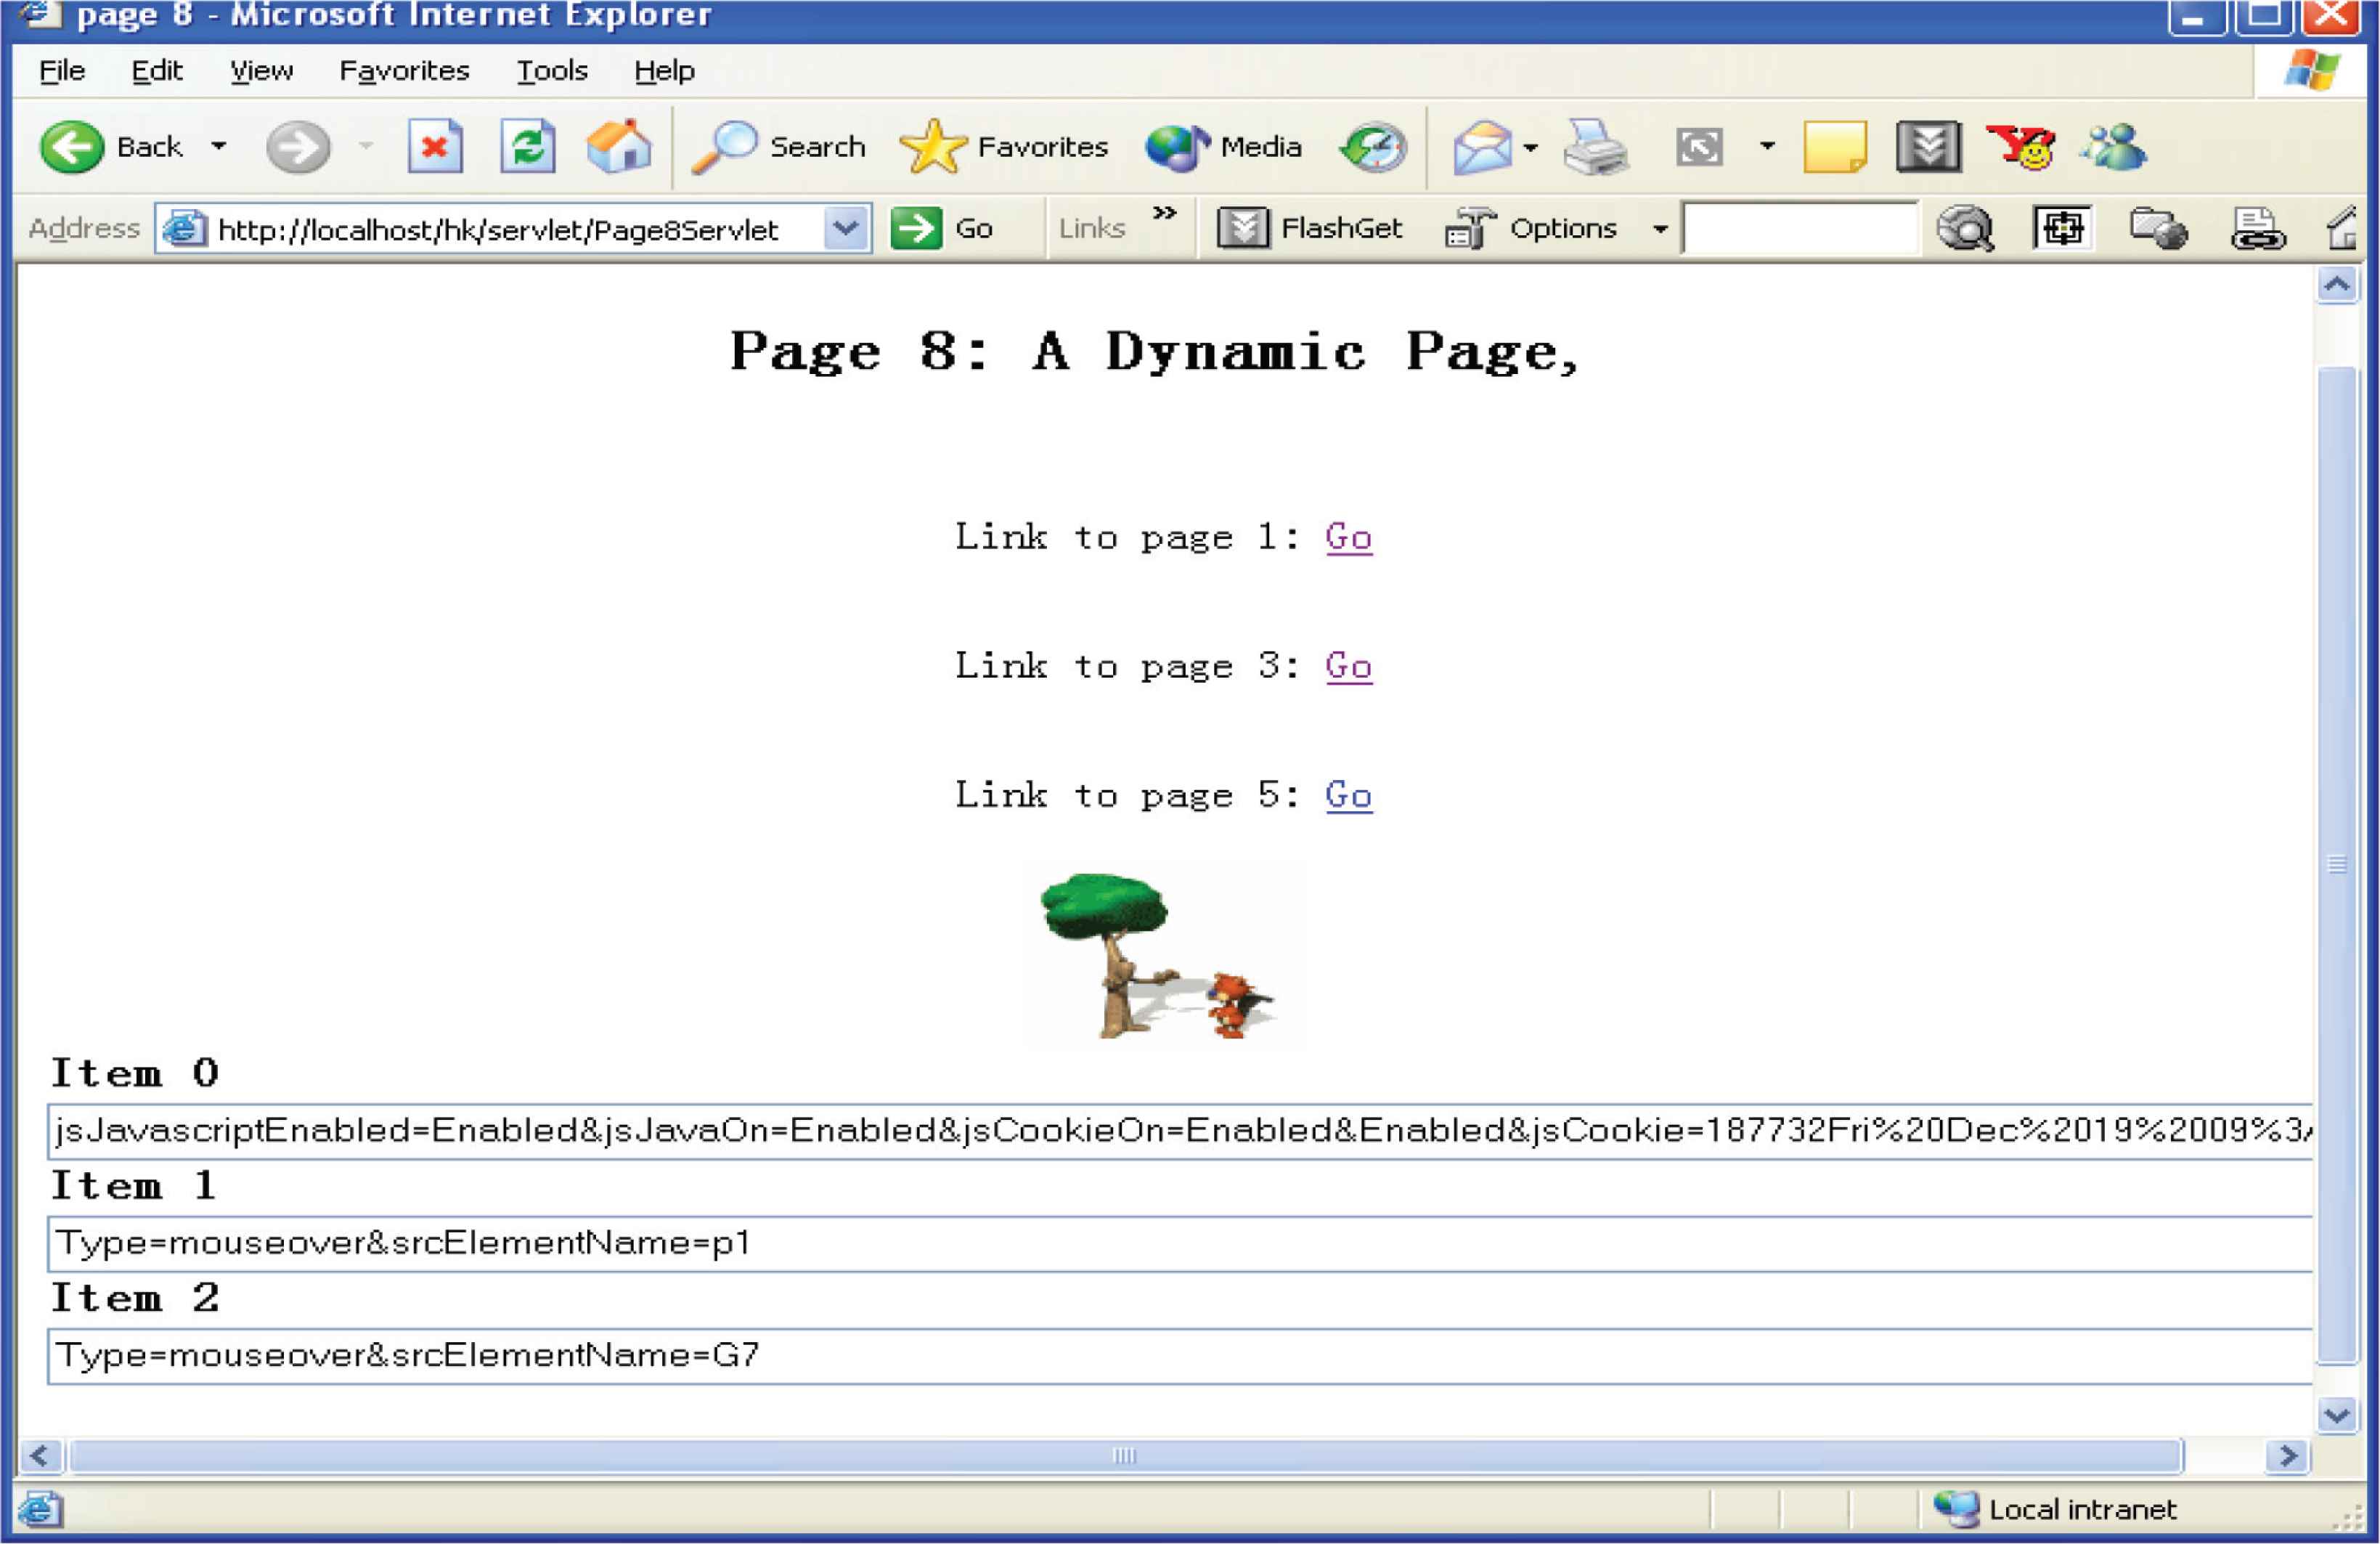
JS tracking for MSIE browsers: dynamic page.
Although only a small number of Internet users use the Netscape browser, a very small size compared with majority MSIE/Edge users [99,100], we demonstrate that the JavaScript tracking can track the NS user events on any web page. Figures 12 and 13 show the NS browsers display the same behavior as the MSIE/Edge browsers no matter the type of page, whether it is static or dynamic page.
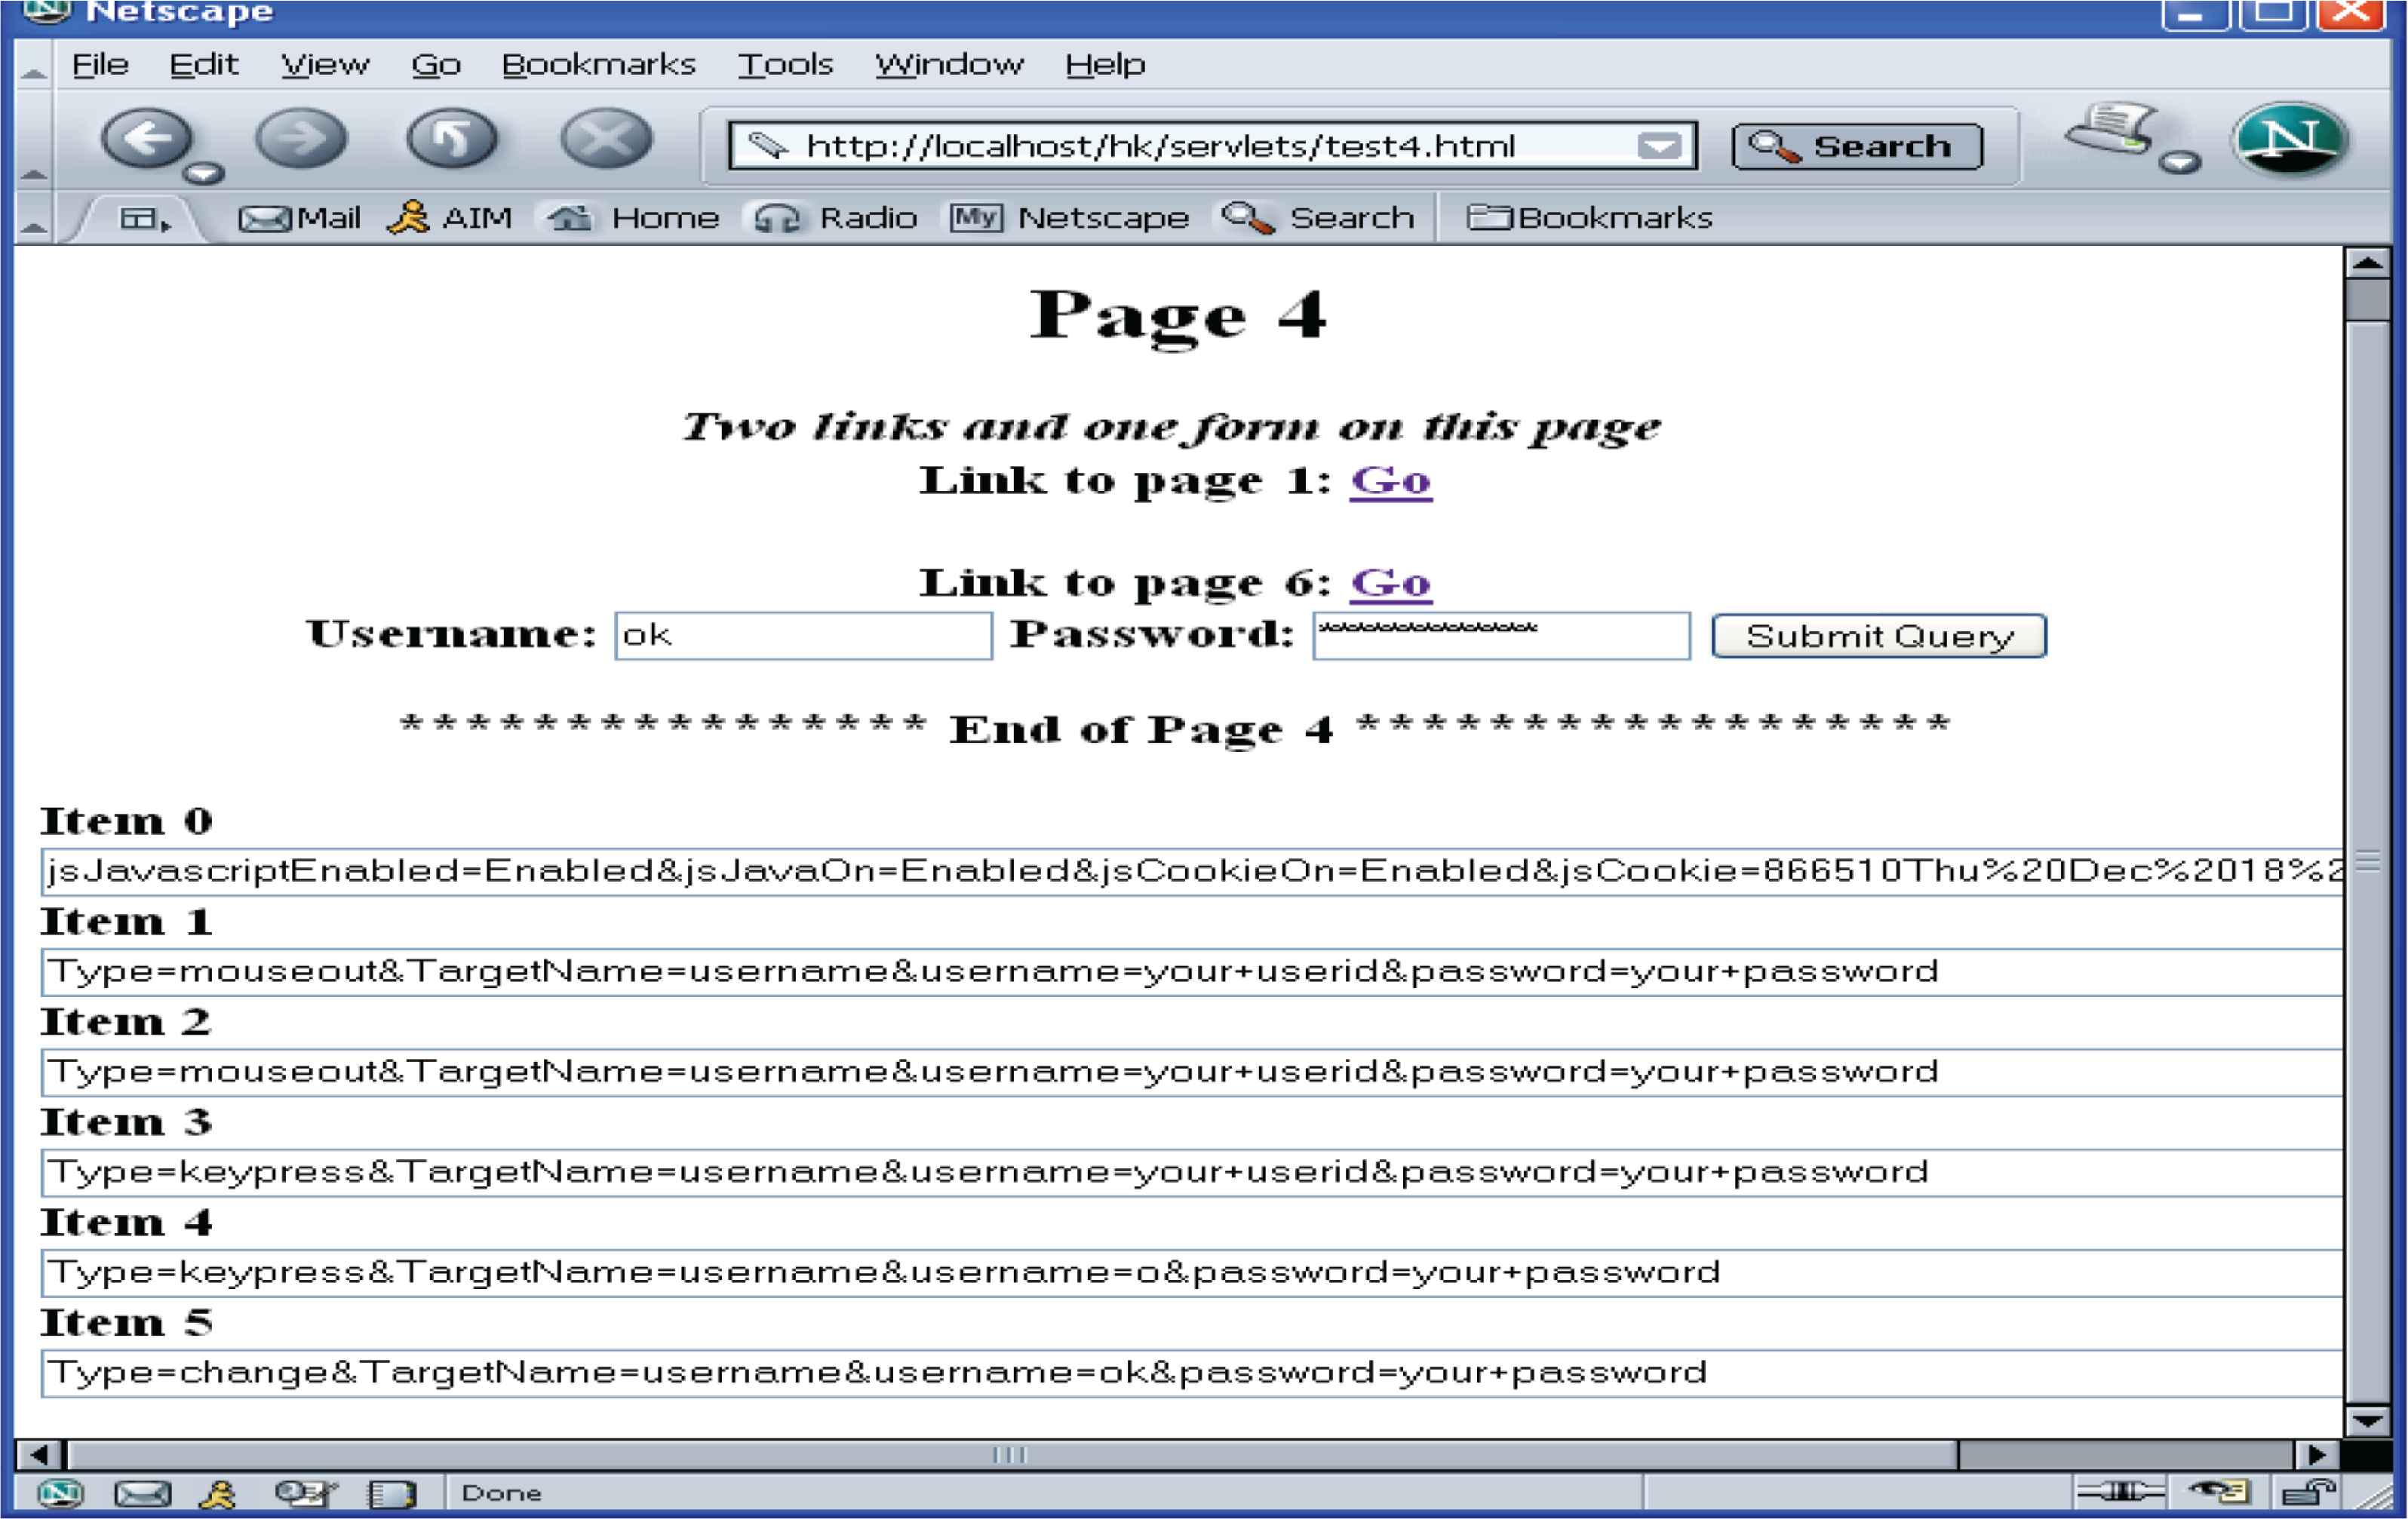
JS tracking for NS browsers: tracking form data.
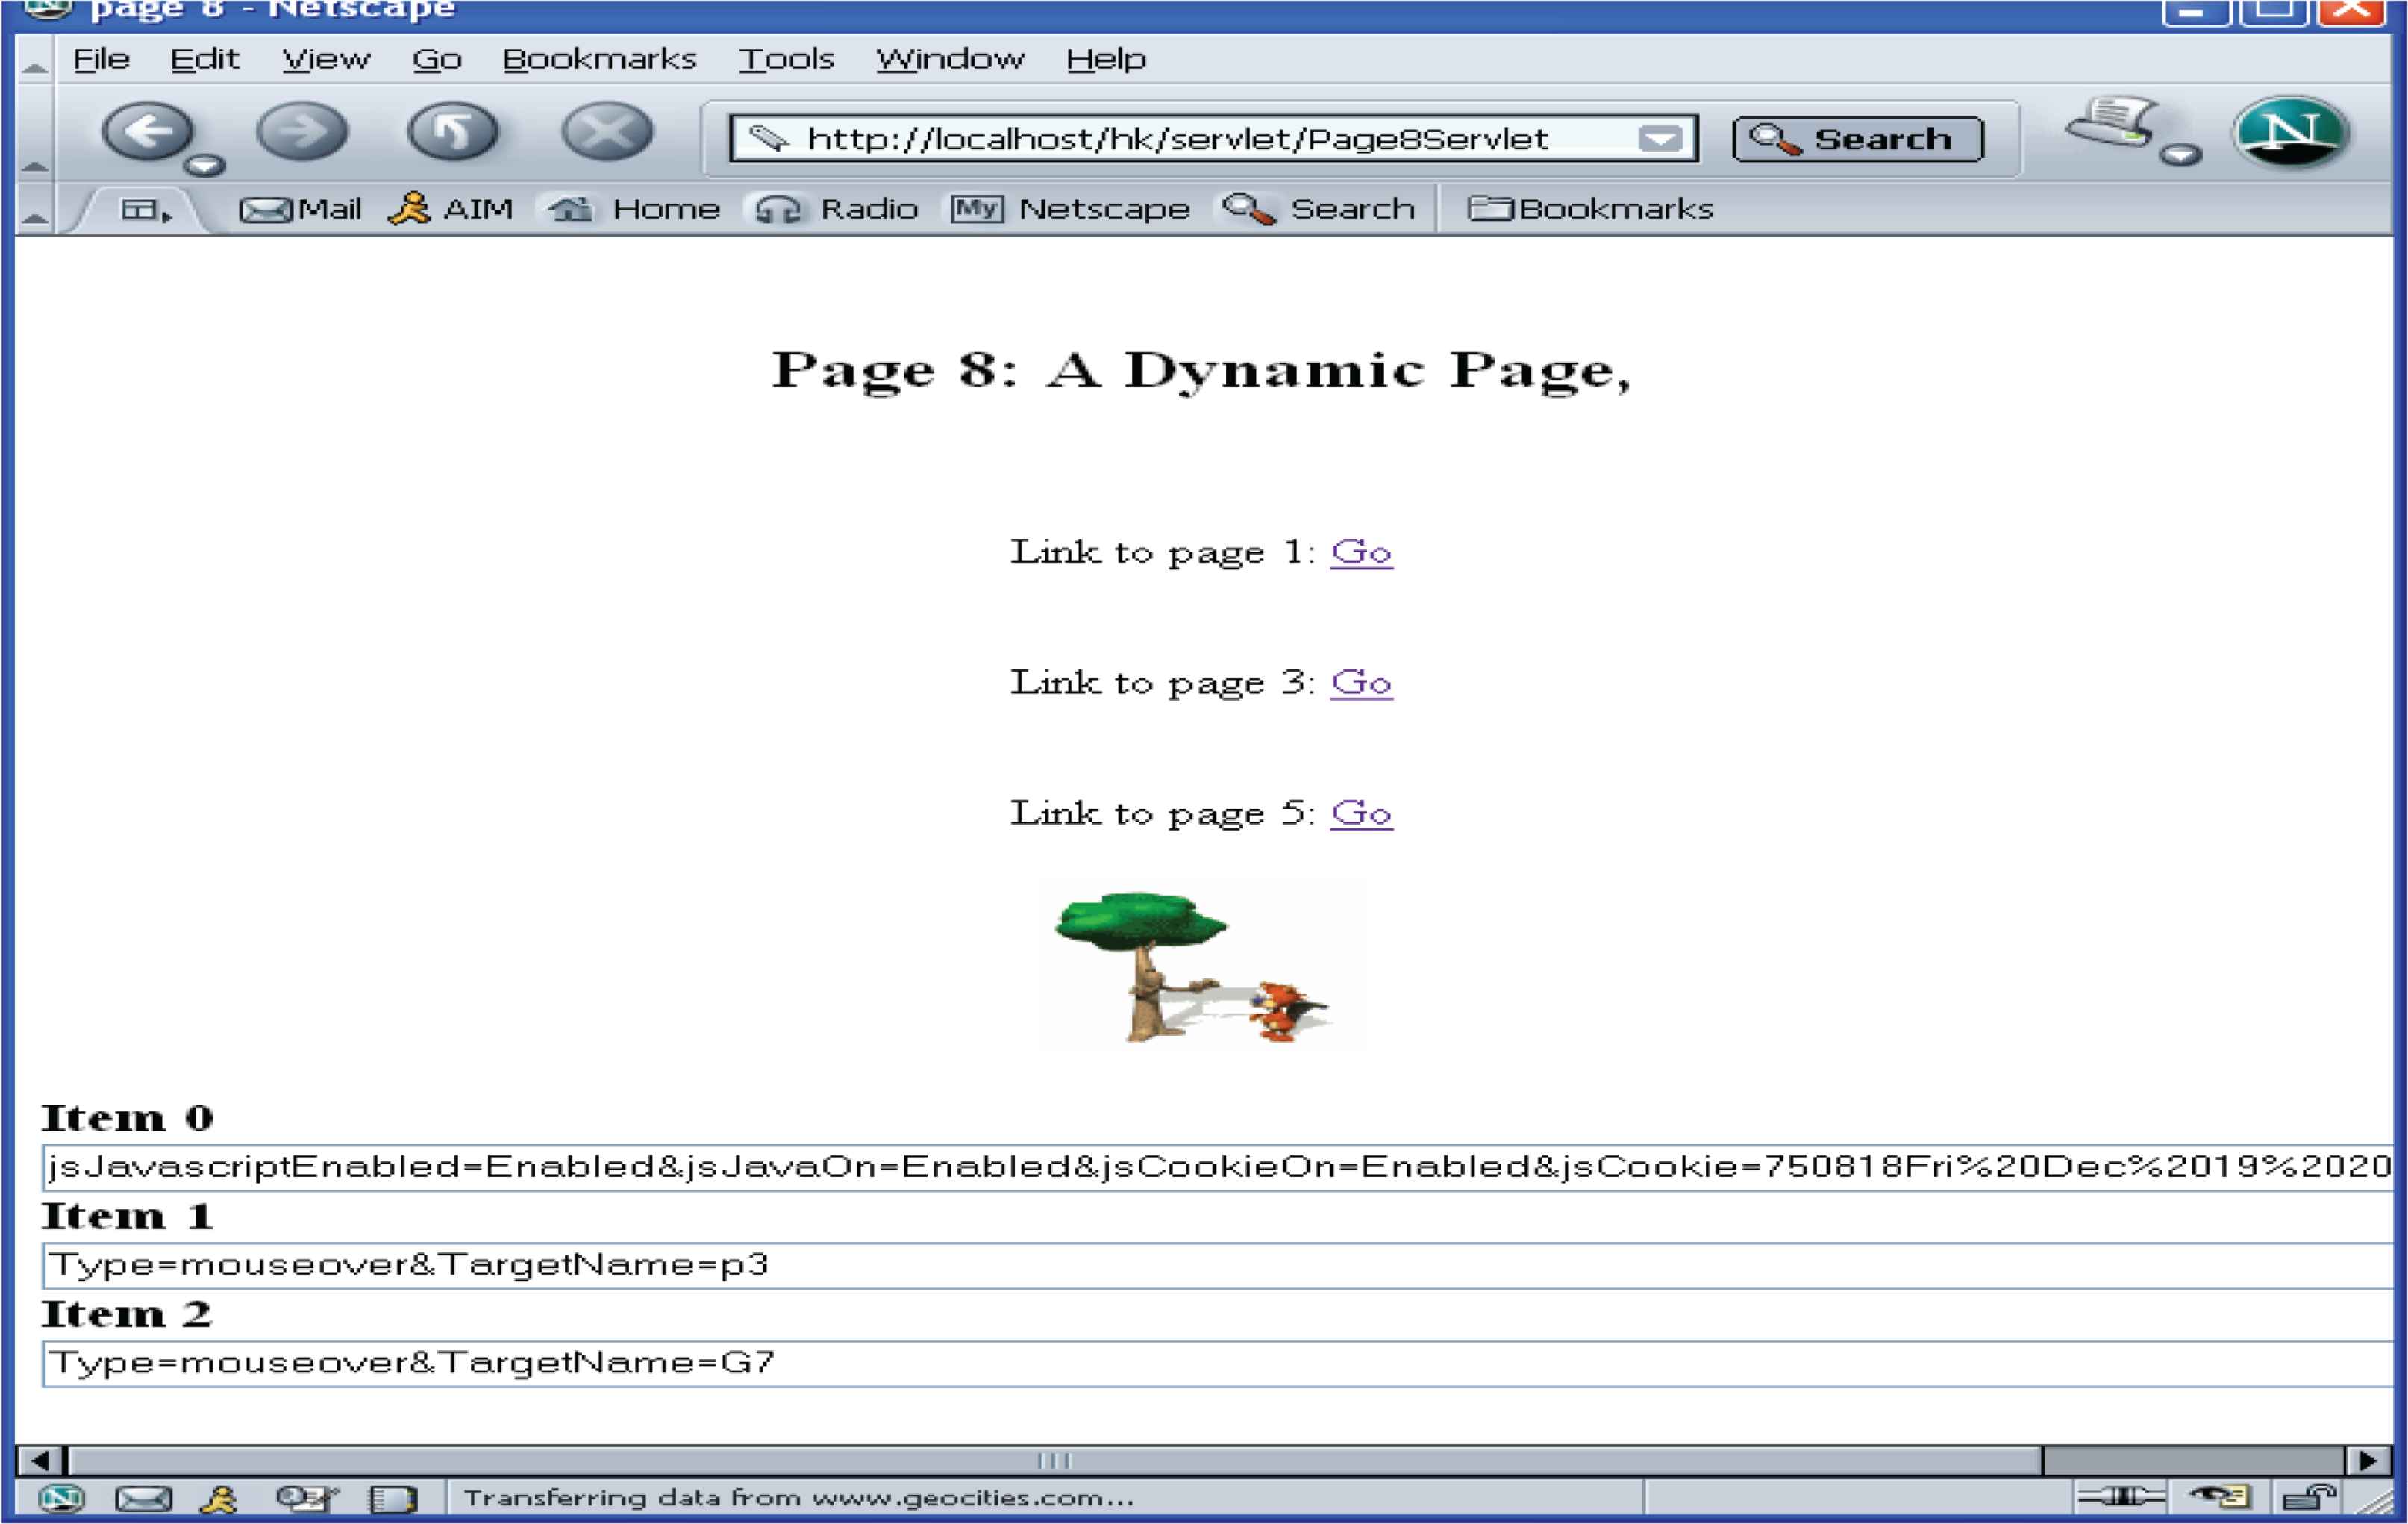
JS tracking for NS browsers: dynamic page.
Figure 14 shows the data tracked by the proxy server approach. Most tracked data are similar to those in a typical Web log file.
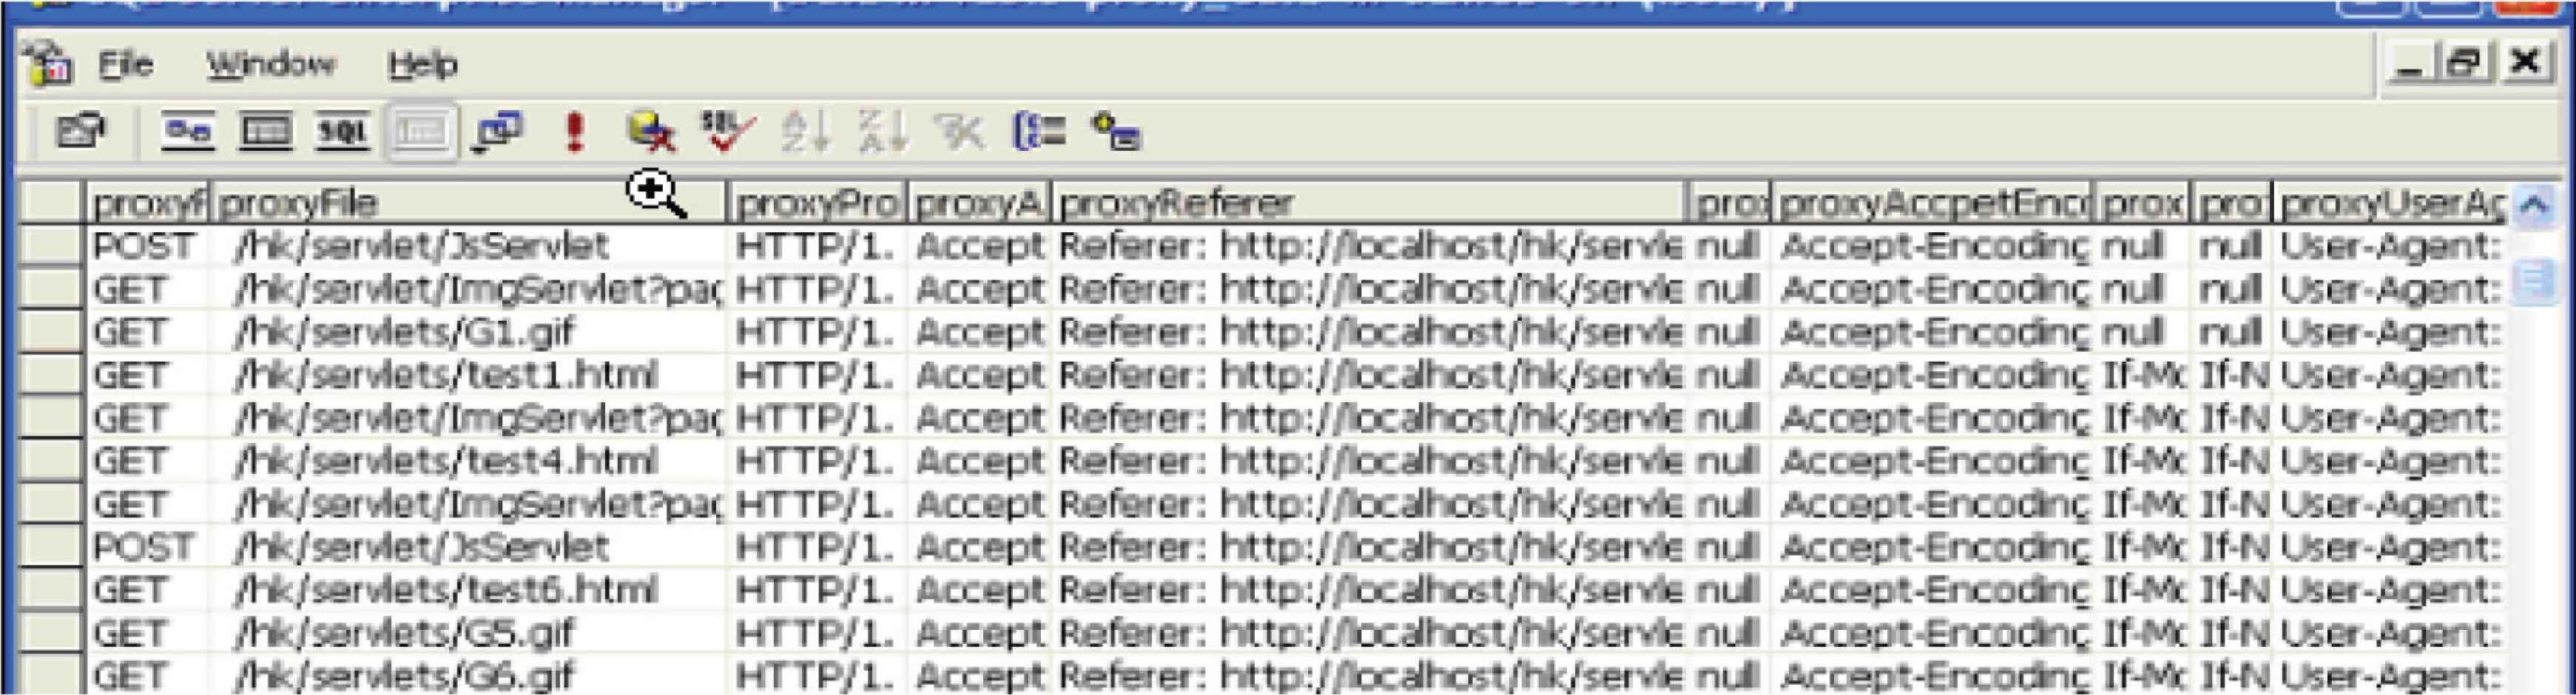
HTTP proxy server tracking data.
Figure 15 shows the data in all users’ sessions tracked by the improved single-pixel images. This approach can track the complete pages, including the “back” and “forward” events.
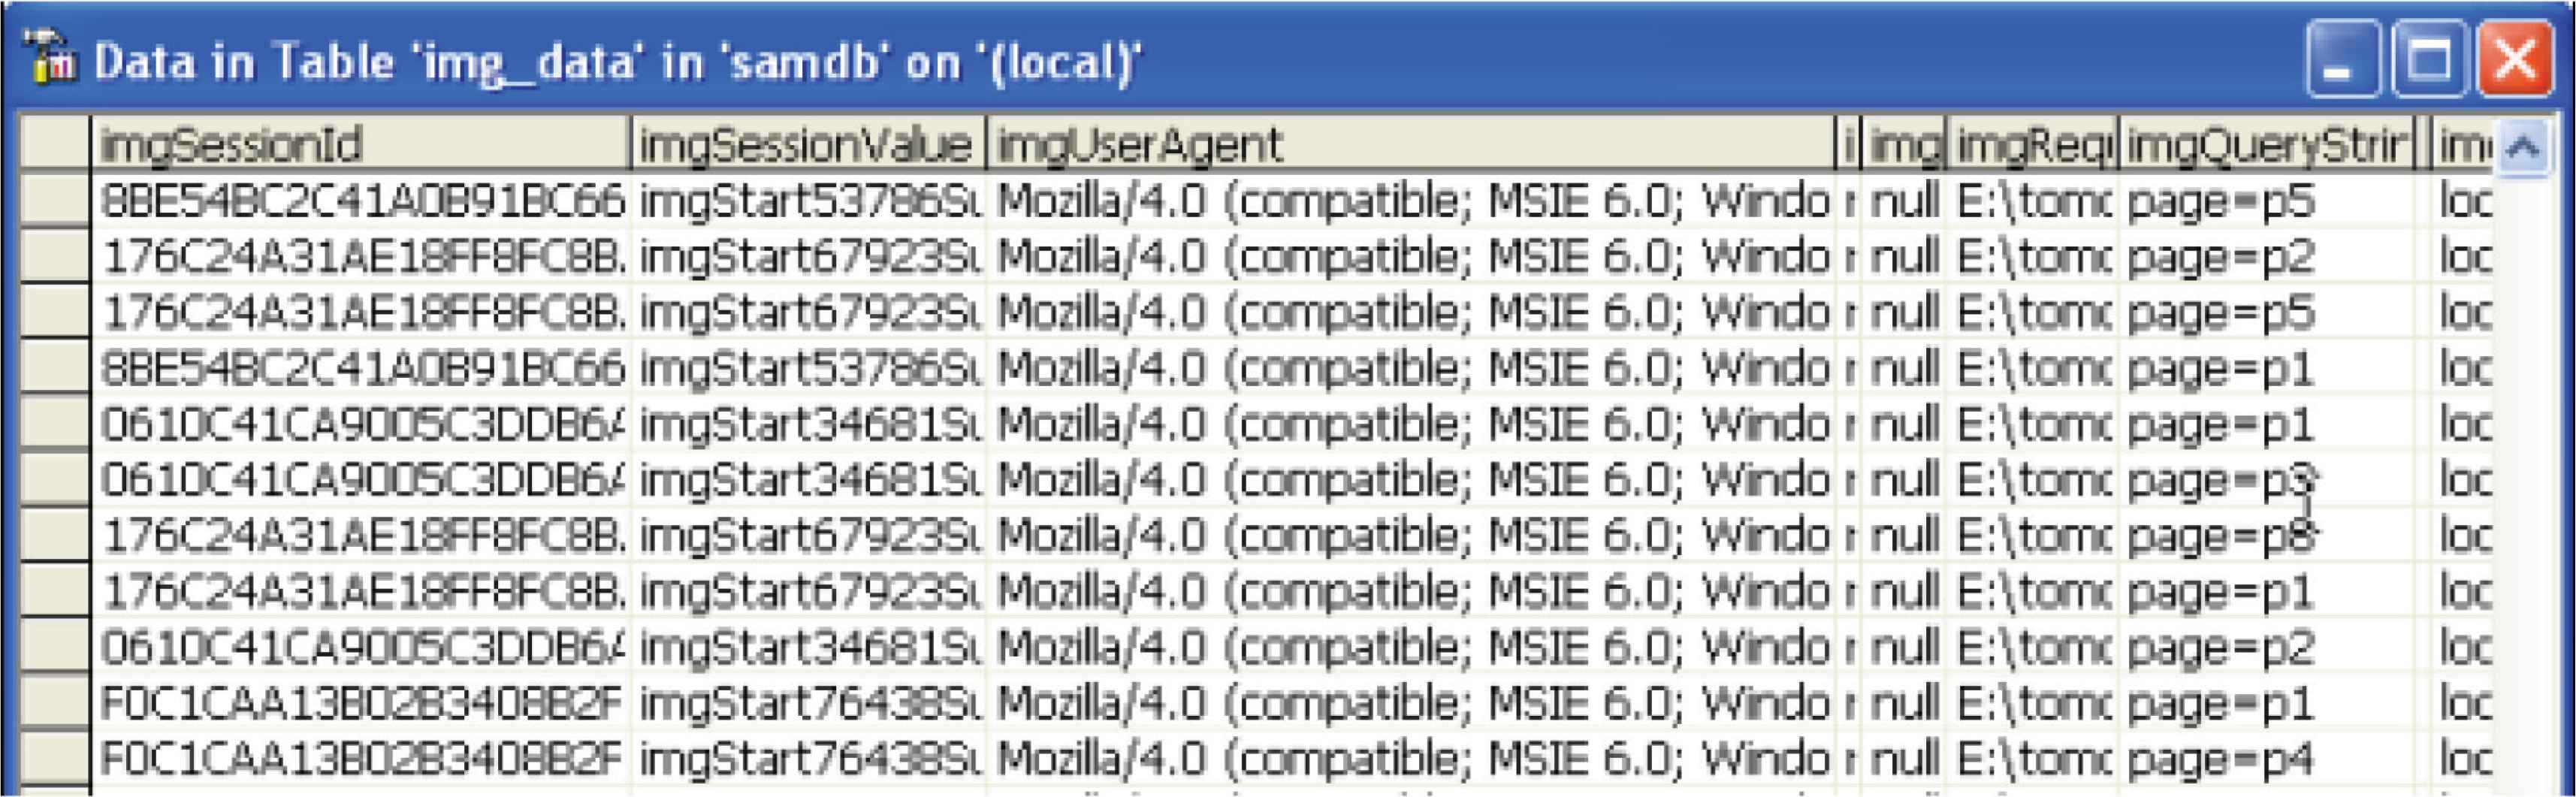
All data tracked by single-pixel image.
- •
Basic Analysis: Which browsers and operation systems are the most common? How many visitors visited this Web site? From where are the visitors coming? Which page is most frequently requested?
Answers to the above basic questions can be obtained from mathematical and statistical approaches based on the tracked data. Figures 16–19 show the results respectively. Almost all Web traffic analysis tools can report such information.

User operation environment.

Visitors to this site.
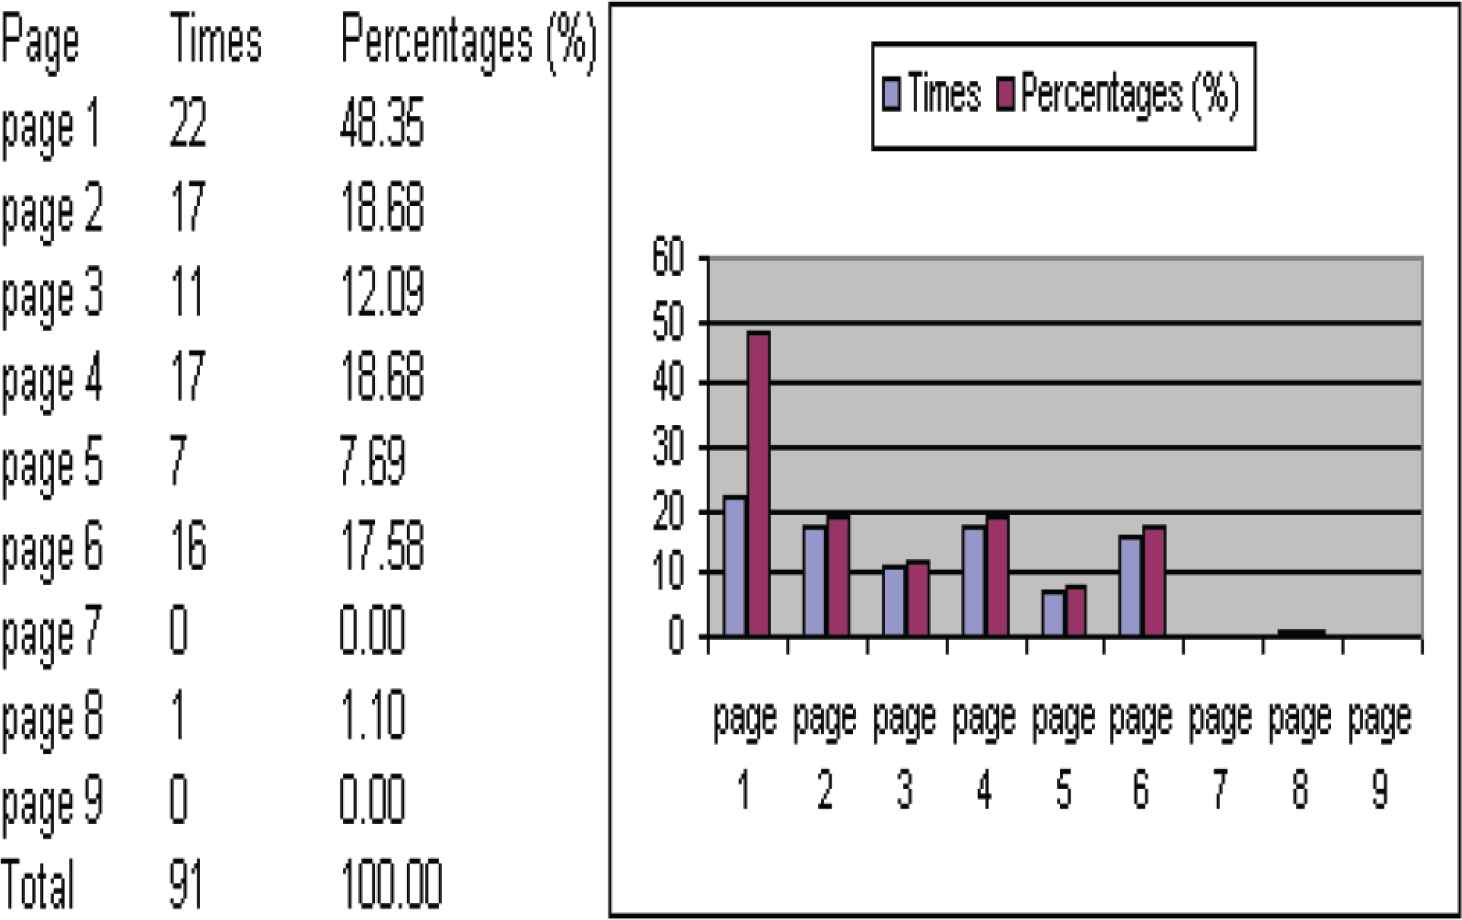
Referrer pages.
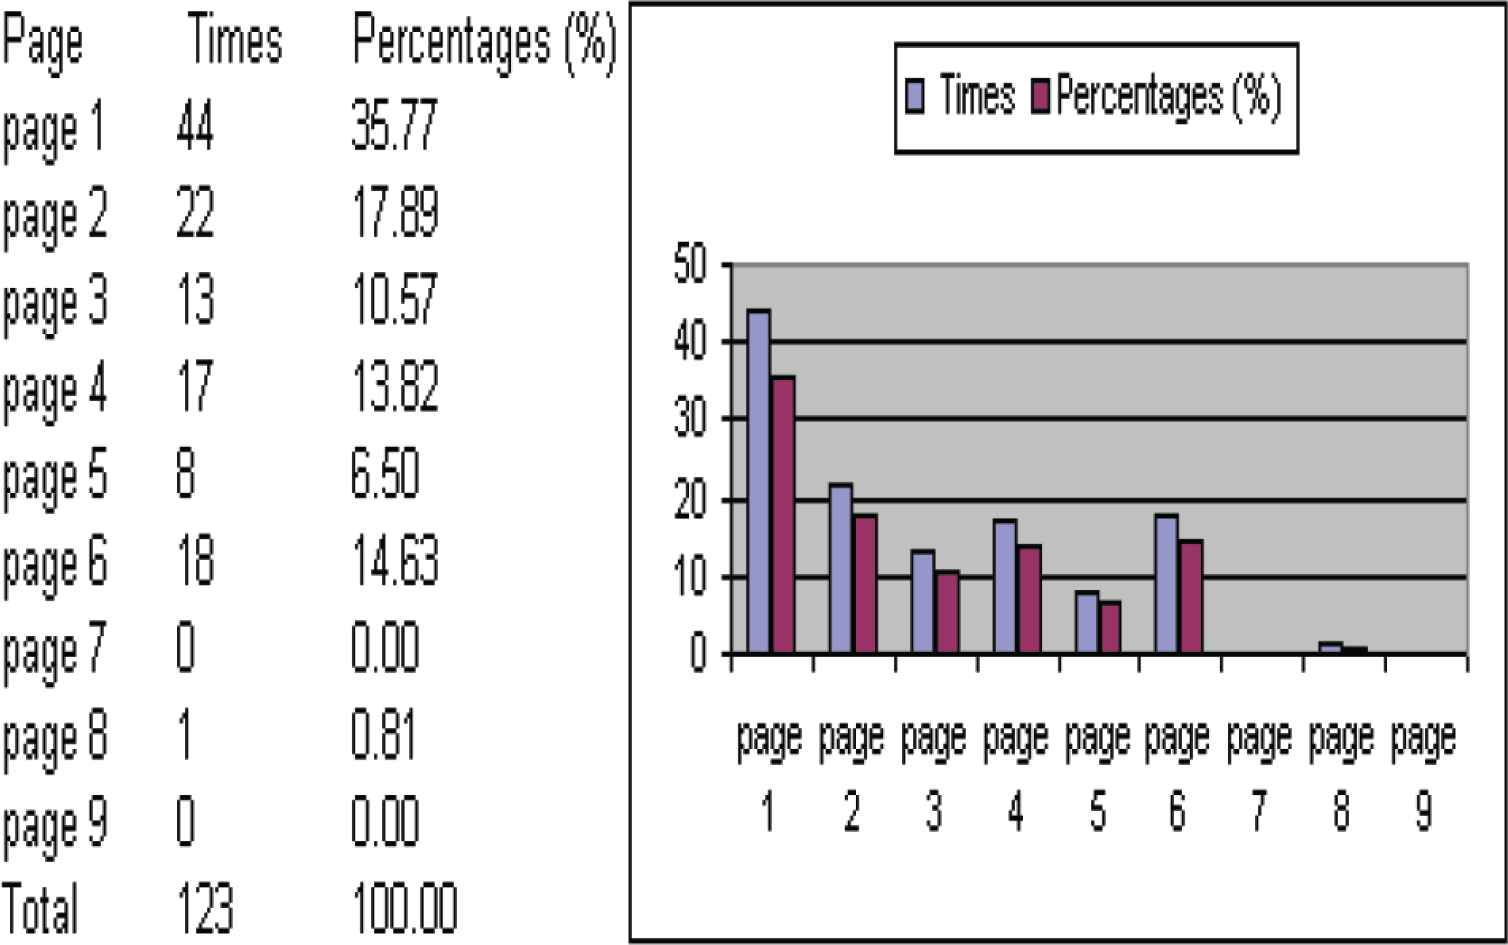
Requested times for each page.
- •
Advanced Analysis: Who has same interest as User 1? How do people navigate through this site? Which path is used most frequently? Which path leads to more purchases?
Answers to these questions can only be obtained from advanced analysis. Figure 20 shows the process to find the user group for those having same interest as User 1. Figure 21 describes users’ navigational behavior. We can easily find the answer to the above question 2 from this path analysis model. The answer to question 3 can be obtained from the path tree if we know which page is the confirmation page for a purchase.
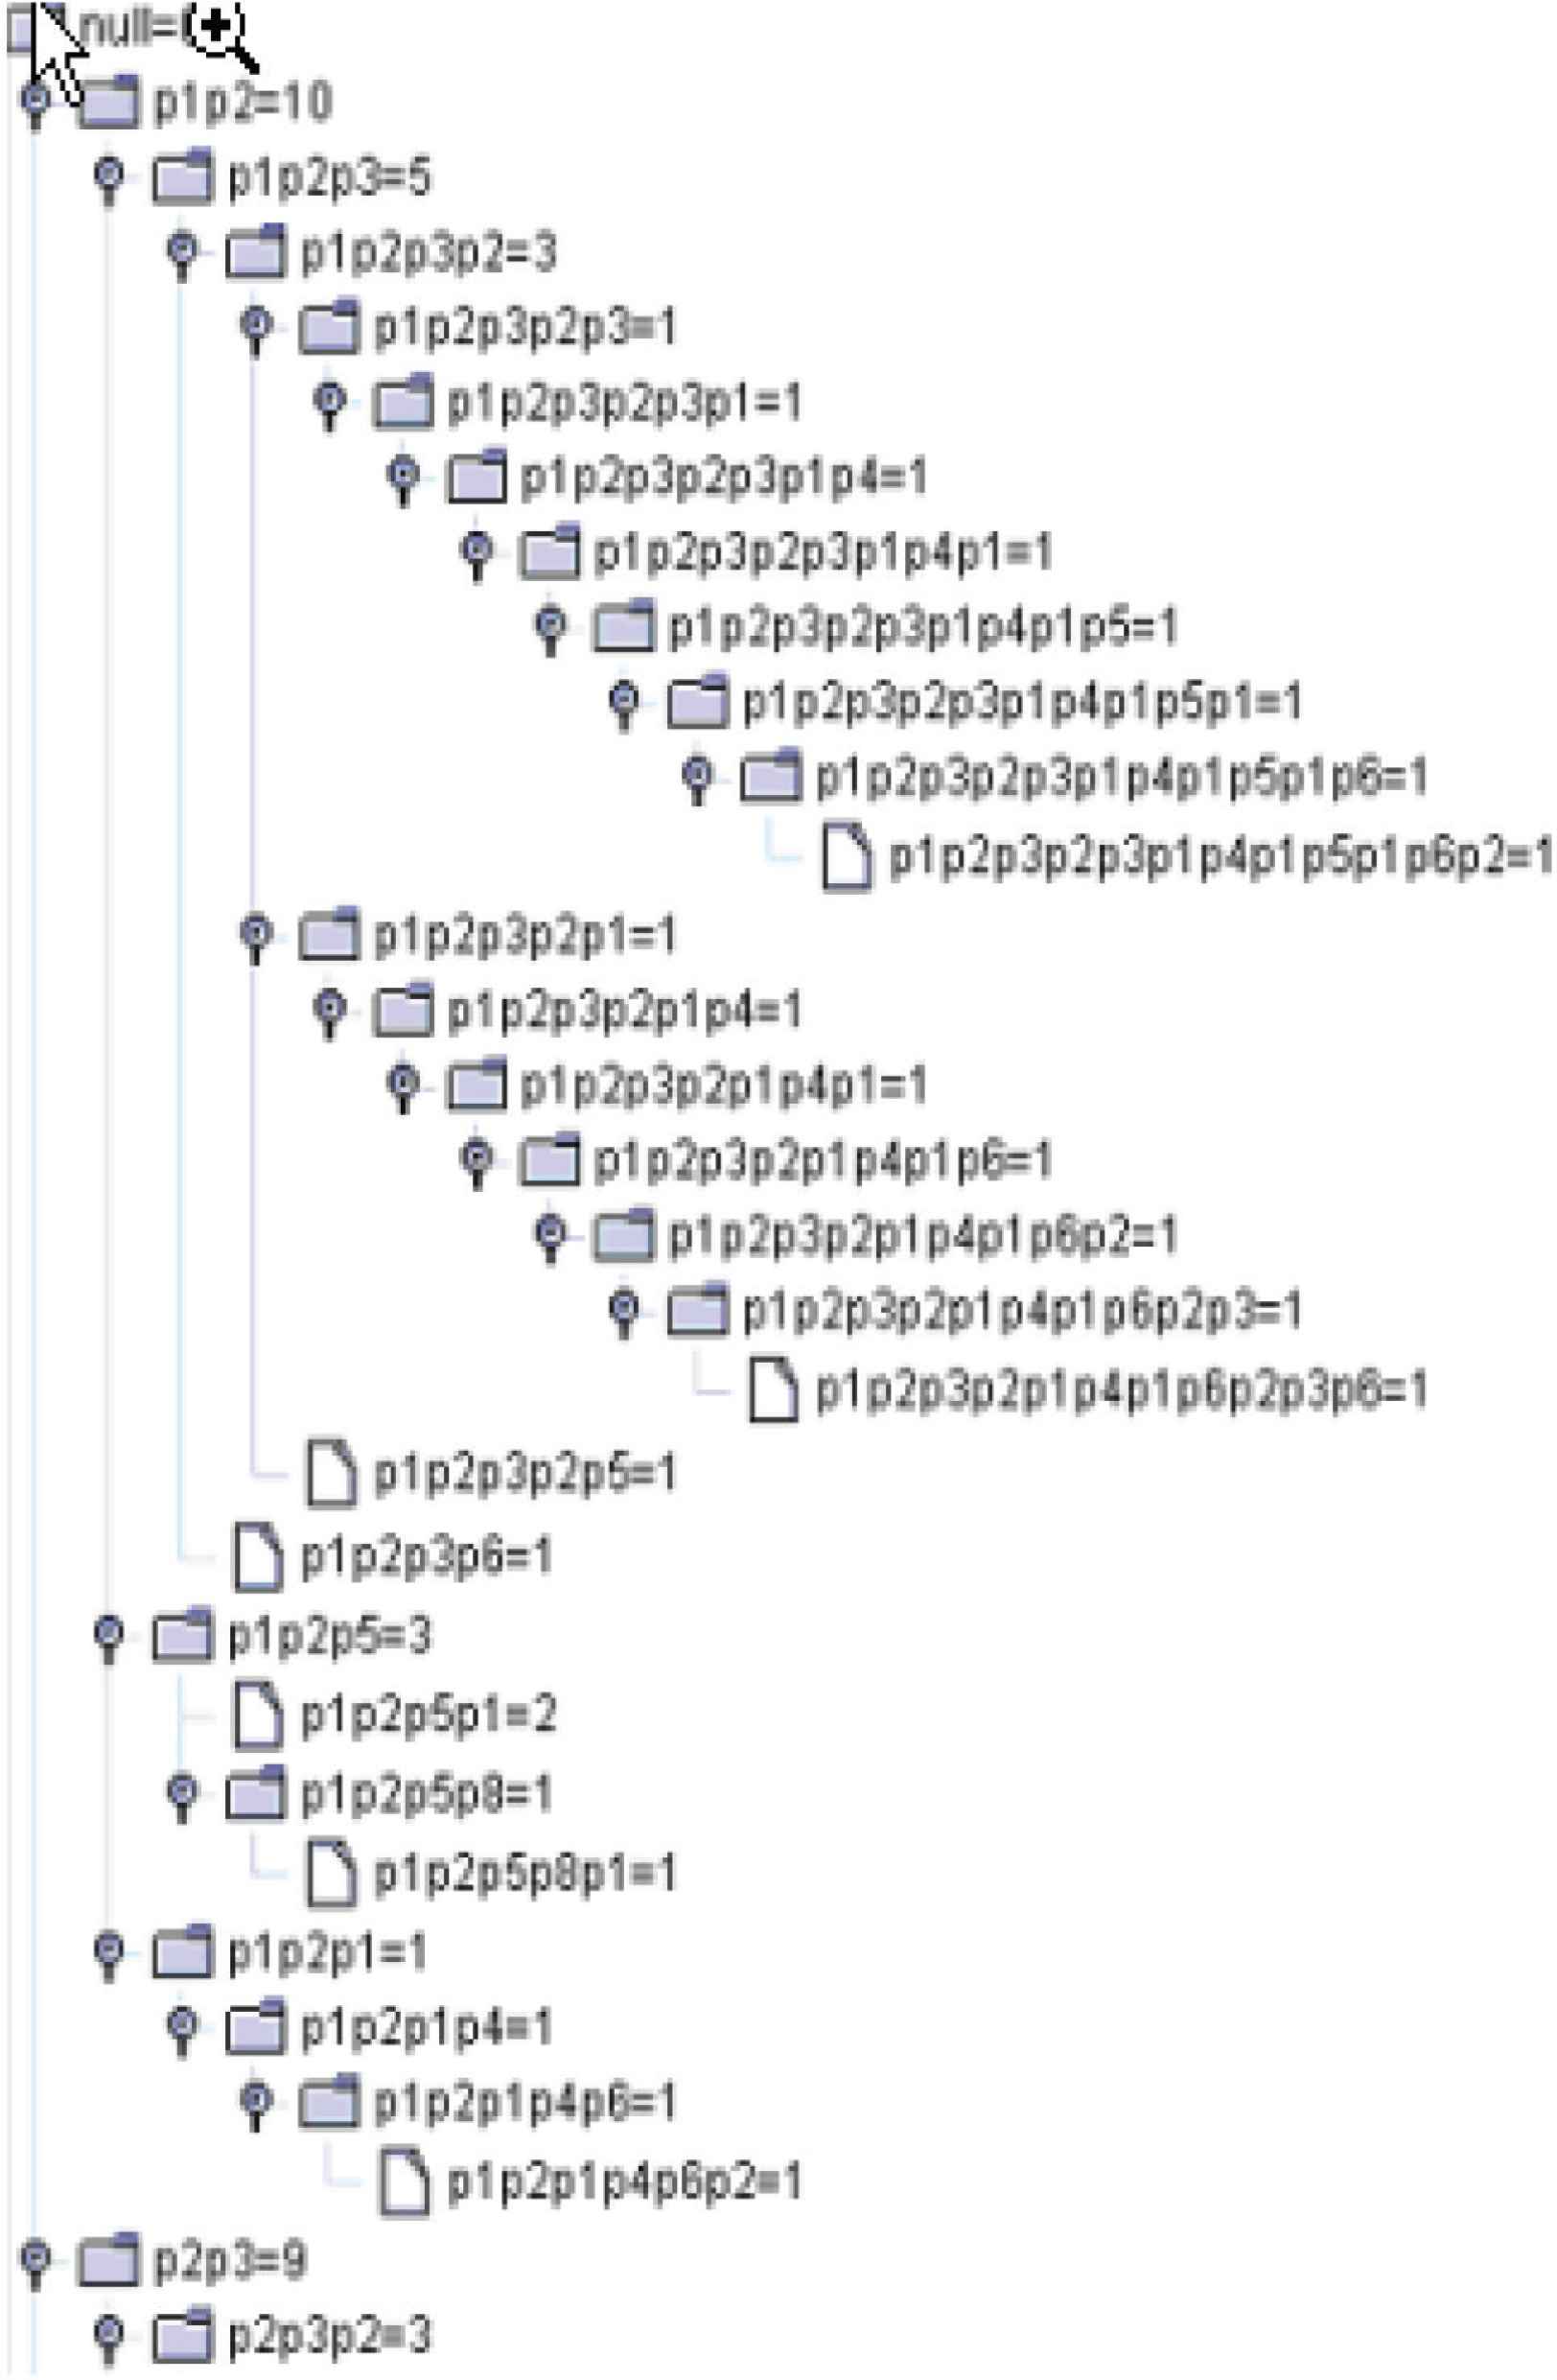
User clustering.
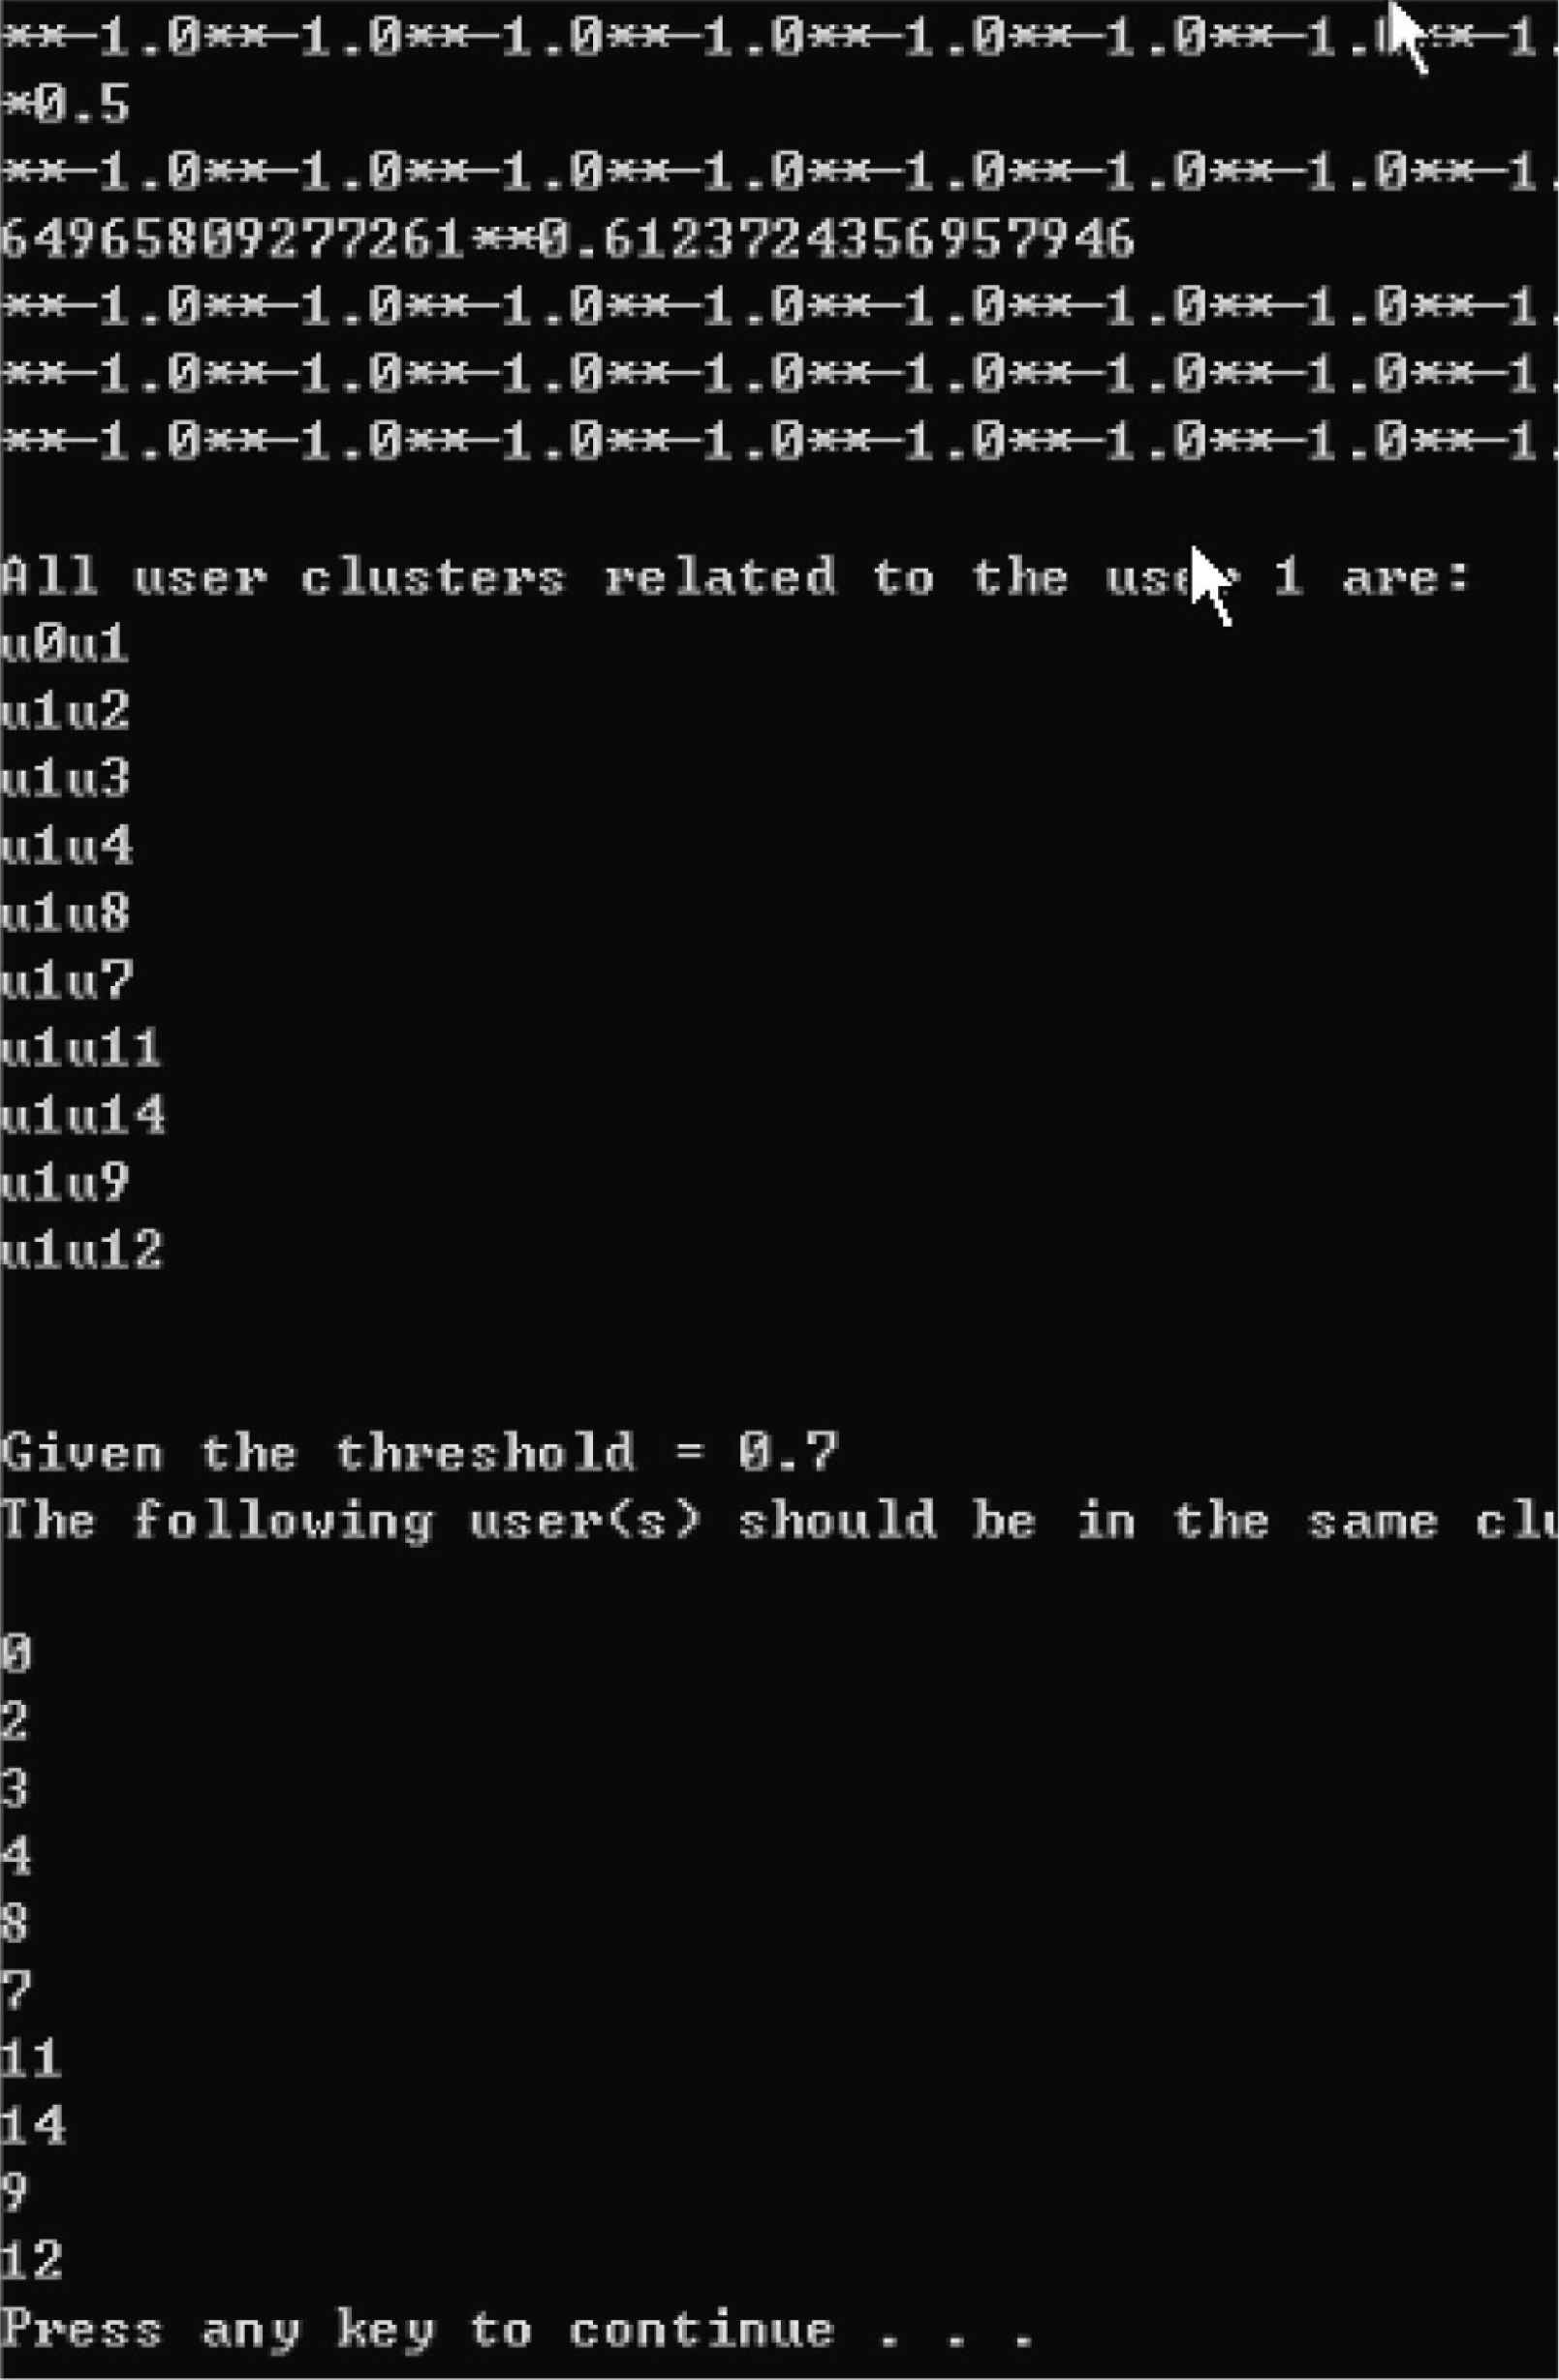
Path analysis: path tree.
7. CONCLUSION AND FUTURE WORK
This paper introduces the design and development of a tracking and analysis model/tool for the effective management of e-commerce transactions. This tool is targeted toward helping e-commerce organizations know more about their users in order to develop efficient marketing strategies.
The contributions of our work include:
- 1.
The combination of three tracking approaches (i.e., improved single-pixel approach, JavaScript approach, and HTTP proxy server) allows a user to be tracked always by at least one approach.
- 2.
The improved single-pixel approach has more distinctive advantages over the general single-pixel technique, which requires JavaScript support in the user’s browser. The improved single-pixel approach does not require JavaScript support to function.
- 3.
Two main features make the JavaScript approach more effective and different. First, it can track most keyboard and mouse events of online users. The user of this tool can configure what kinds of events about a user should be tracked. Second, it is capable of tracking any form input on the page.
- 4.
The improved single-pixel and JavaScript approaches are designed to work on both static and dynamic Web pages.
- 5.
In both the improved single-pixel approach and JavaScript approach, using Java servlet technology allows these approaches to be more compatible with many platforms than CGI programs which most tools use. In addition, Java servlet session control enables an easy control of users’ sessions. Using Java servlet session technology results in a comparatively simple process of analyzing the tracked data later.
- 6.
In addition to the basic analysis, advanced analysis such as path tree model and user clustering are developed based on the tracked data.
This paper is helpful for designers and developers of e-commerce applications because it highlights some key fundamental and/or pragmatic challenges in the development of e-commerce traffic tracking applications. Therefore, examining the design process, operational efficiency and effectiveness is clearly important because we are able to understand, apply, and promote notable design principles, processes, and practices to overcome the identified challenges.
This study of the design issues in e-commerce traffic tracking systems development deals with issues that ultimately affect the overall system quality and hence the factors that affect customer satisfaction of e-commerce website. Thus, this paper has both academic and practical implications for e-commerce website management, design, and performance enhancement.
In particular, we focused on three broad main challenge areas, namely: (a) how technologies, frameworks, and architectures influence and cause e-commerce applications developers to take certain premature and undesirable design decisions, (b) the interactivity and complexity of e-commerce applications which requires developers to provide several models rather than a single model for the same problem, and finally (c) impact of existing quality assessment criteria for e-commerce traffic tracking applications design.
We plan to extend this work in several directions by addressing the following:
- 1.
Use a realistic e-commerce site to test this tool. Although implementation of this tool achieved its expectation, we realize a software can behave very differently from testing results when it is used in a real environment.
- 2.
Develop recommendation and personalization [89] framework based on path analysis, page content analysis, and cluster analysis. For example, suppose we find from the path analysis that the page 3 (i.e., p3) usually follows a path p1p2. We can recommend, therefore, page 3 to a user when the user has finished browsing p1p2. Another way to do personalization is to combine path analysis with user clusters. We can recommend user B’s path to user A if A and B are in the same group.
- 3.
Extend the proxy server to handle other protocols, such as https.
Web traffic analysis tools can enhance a Web site’s efficiency through the analysis of the users’ data, although more and more people are concerned about privacy issues today. To address privacy concerns in a user friendly way, the users should know what is being tracked about them. Also, the tracking process should not interrupt the users’ normal navigation so the tracking is done in the background. To keep the tracking open to the users, the Web server should be configured to communicate with the users’ browsers. A user’s browser can be configured to request a Web site’s privacy policy, store the user’s privacy preferences and check these preferences against the site policy before any processing. If the Web site’s privacy policy does not match those preferred by the user, the user will be warned or advised [101]. In this way, the user has the choice whether he/she can be tracked, what data can be tracked and how the tracked data can be kept and used.
We agree with Singh [102] that the proliferation of new data sets and introduction of massive data migration capabilities disrupts existing business models and ecosystems and businesses must embrace data analytics and statistical reasoning to make decisions that improve efficiency, risk management and profits. From using granular data to personalize products and services to scaling digital platforms to match buyers and sellers, businesses use business analytics to enable and enhance better, faster and facts based decision making.
CONFLICTS OF INTEREST
The authors declare they have no conflicts of interest.
ACKNOWLEDGMENT
We thank the anonymous review panel for their helpful suggestions that enriched this version of the paper.
Footnotes
For additional details, interested readers should see: Sylvanus A. Ehikioya and Shenghong Lu, “Traffic Tracking Analysis for E-commerce”, Technical Report #: TR-04-06, Department of Computer Science, University of Manitoba, Winnipeg, MB, Canada R3T 2N2, March 2004. Number of Pages: 31.
A detailed analysis of the evolution of Web analytics is available here.
REFERENCES
Cite this article
TY  - JOUR
AU  - Sylvanus A. Ehikioya
AU  - Shenghong Lu
PY  - 2020
DA  - 2020/05/25
TI  - A Traffic Tracking Analysis Model for the Effective Management of E-commerce Transactions
JO  - International Journal of Networked and Distributed Computing
SP  - 171
EP  - 193
VL  - 8
IS  - 3
SN  - 2211-7946
UR  - https://doi.org/10.2991/ijndc.k.200515.006
DO  - 10.2991/ijndc.k.200515.006
ID  - Ehikioya2020
ER  -