
A Fuzzy Quality Function Deployment Approach for Differentiating Cloud Products
- DOI
- 10.2991/ijcis.11.1.79How to use a DOI?
- Keywords
- Cloud computing; product design; fuzzy logic; quality function deployment, analytic network process; sustainability
- Abstract
Cloud computing is defined as an on-demand large-scale distributed network to provide and realize computational resources. This flexibility expectation of cloud products forces cloud service providers (CSPs) to tailor their products to the needs of their customers. The framework in this paper proposes a fuzzy logic-based decision support tool for CSPs guiding them in differentiating their cloud offerings for different customer profiles. The tool aims to replicate human reasoning process by making use of fuzzy logic as a computational intelligence framework. The quality function deployment (QFD) approach in the tool systematically handle the product design process. The applicability of the proposed framework is shown using a real life cloud product design scenario with three customer profiles.
- Copyright
- © 2018, the Authors. Published by Atlantis Press.
- Open Access
- This is an open access article under the CC BY-NC license (http://creativecommons.org/licences/by-nc/4.0/).
1. Introduction
The main thrust of cloud computing is to provide on-demand computing services with high reliability, scalability and availability in a distributed environment.1 Despite its several definitions, the most cited cloud computing definition is the one of National Institute of Standards and Technology: “Cloud computing is a model for enabling convenient on-demand network access to a shared pool of configurable computing resources (e.g., networks, servers, storage, applications, and services) that can be rapidly provisioned and released with minimal management effort or service provider interaction.2” It is seen as a new wave in the field of information technology. Refs. 2–4 differentiate cloud services and create three classes: SaaS (Software as a Service), PaaS (Platform as a Service) and IaaS (Infrastructure as a Service). Although in cloud computing, everything may be treated as a service (XaaS), in this research, we will concentrate on designing cloud services provided as IaaS. IaaS involves processing, storage, network and other fundamental computing resources that cloud customers utilize to deploy and run operating systems and software.
According to Ref. 5, public cloud services market will grow 17.2% in 2016 to total $208.6 billion. This growth is expected to peak in 2017 to 18% and to plateau or slightly decrease through 2020 to a growth of 14.7%. The highest grow is expected to come from IaaS. Amazon Web Services (AWS) has been the leader in the cloud infrastructure services market since 2006. In one of the recent studies, AWS and Microsoft are considered as leaders, Google is considered as visionary and IBM, VMware, etc. are considered as niche players.6 Ref. 7 states that AWS has the 31% of market share, followed by Microsoft with 11%, IBM with 7%, and Google with 5% in Q2 2016, respectively.
The potential benefits of cloud services can be achieved by adopting the right product. The growth in the number of cloud computing users has led different CSPs to offer a variety of cloud products. Hence, in literature, numerous research concentrate on the user’s perspective for selecting the most suitable product in respect to their requirements. However, the challenge that the CSPs meet for designing/offering a variety of cloud products for a huge pool of customers is even harder. The design of any customized product must correspond to users’ requirements to reach their expectations and these expectations does not necessarily converge. As a cloud product is exactly a customized product, its design process needs to follow the same steps. The success of AWS, that has been the global market leader for so long, may be attributed to their vast variety of offerings. On the other hand, having too many comparable options is mentally draining since each one must be weighed against each other. According to overchoice theory, as the number of choices increases and passes a certain point, people start to feel more pressure and get confused.8 This constitutes our motivation to propose an intelligent cloud service design process in order to come up with services matching needs of diverse customer profiles without overcomplicating the selection process. Furthermore, the highly competitive cloud market together with the increasing pricing pressure necessitates a product of high quality with a cost conscious design. Also, as the intensity of cloud usage increases along with the need to save maximum possible amount of resources, the importance of sustainability increases. More and more CSPs have been caring for sustainability and especially for energy efficient computing initiatives, which complicates the matter further. In one of our recent works, we have proposed a decision support tool for ranking CSPs considering only customers’ quality-related criteria.9 The proposed framework has taken into account a single customer profile and has used this input together with the CSPs’ performance values to rank the cloud service offerings. In a succeeding work, we have proposed a decision support tool for producing cloud services considering three conflicting criteria; quality, cost and sustainability.10 The difference between the former and the latter studies is that the latter focuses specifically on the design process of CSP, while the former aims to support the selection decision of customer. However, the latter study still used a single customer profile and overlooked the ambiguous nature of the customers’ judgments. In this paper, we intend to build a comprehensive decision support framework for CSPs in designing the most satisfactory product regarding different customer profiles considering quality alongside with cost and sustainability and also make use of fuzzy set theory to deal with subjective judgments of customers.11 Doing so, we exploit QFD approach, a common methodology, which intends to satisfy customers’ needs (CNs).
QFD methodology starts with the development of the house of quality (HOQ). HOQ uses customer feedbacks as input which are expressed as needs. It transforms this knowledge into product attributes, which represent technical attributes of a product. During the transformation process of CNs into the product technical requirements (PTRs), relationships between CNs and PTRs, and correlation among CNs and PTRs need to be resolved. This transformation enables obtaining the importance weights of PTRs. Thus, most important characteristics to address customers’ concerns are identified. The gathering of this knowledge necessitates delicate handling of user feedback, usually expressed in user’s own words in a natural language. In this paper, the vague nature of this knowledge has been overcome by using linguistic values represented by fuzzy numbers. It is believed that this will avoid oversimplification of a complex problem. Here, the weights are procured utilizing analytic network process (ANP).12 ANP is a generalization of Saaty’s analytic hierarchy process (AHP), which is a universally adopted multi-criteria decision support tool.13 In most of the cases, the interaction and dependence of higher level elements on lower level elements complicate building a hierarchy for most of the real life decision problems. In this context, ANP and its supermatrix technique is introduced as an extension of AHP that can handle more complex decision structures14, 15. Although ANP framework has the ability to examine more elaborate interrelationships, it does not take into account the uncertainty associated with decision makers’ judgments. Besides, the subjective judgments have strong influences in the ANP-based decisions. In decision making literature, deterministic/probabilistic sensitivity analysis, Bayes theorem, Dempster-Shafer theory, fuzzy set theory, and grey theory are among the commonly used approaches to deal with uncertainty. There are four classes of uncertainties: i. Vagueness, when information is naturally graded, ii. Imprecision, when the available information is not specific, iii. Ambiguity, when information leads to several possible interpretations, and iv. Inconsistency, when two or more information cannot be true at the same time.16 In our case, the decision makers’ evaluations, generally, do not have sharp cutoff points, preferences are vague and have diversified meanings. Using precise numbers may oversimplify subjectivity. In order to overcome these shortcomings, fuzzy sets theory is used.
The main contribution of the recommended tool is that it enables CSPs to consider distinct and mostly contradicting issues simultaneously. Focusing only on the quality issues may satisfy customers, but it could hurt the profitability of the provider, if the cost of providing the service in long term is somehow neglected. Moreover, CSPs need to improve their chances of continuity in long term by responsively managing and maintaining their business resources. The proposed approach balances these three design goals (quality, cost and sustainability) for different customer segments (regular end-users, academic institutions, commercial institutions, etc.).
The paper is structured as follows. Section 2 outlines similar research in academic literature. The methodologies practiced in the framework are briefly presented in Section 3, while Section 4 gives step by step explanation of QFD-based decision support tool and its application. Section 5 displays the results of the case study and the concluding remarks with future works are offered in Section 6.
2. Related Work
In one of the recent studies on the cloud service selection problem, the authors have proposed a model by combining the feedback coming from cloud users and objective performance analysis from a trusted third party.17 In this work, the authors have applied a fuzzy simple additive weighting system. Ref. 18 has focused to select the preferable SaaS product in terms of functionality, architecture, usability, vendor reputation and cost. Their research is mainly based on subjective assessment, and they have made use of the AHP approach. Another research whose objective is to guide service consumers and providers in analyzing available Web services relies on fuzzy TOPSIS approach.19 The authors have ranked available alternative Web services with fuzzy opinions according to group preferences. Ref. 20 has designed a framework (“Cloudgenius”) specifically for Web server migration to the cloud and defined a model and related factors for automating the decision making process. Their framework is based on AHP similar to the one in Ref. 14. The work that has more common traits with our study is the Ref. 21. In this work, the authors have first determined cloud key performance factors (KPIs). They have used AHP for assigning weights to features. Ref. 22 is another research that concentrate on selecting the suitable SaaS software package. Their ANP-based model considers both the intangible and tangible criteria by taking the interdependence and feedbacks into consideration.
These related works generally have the objective of selecting the most appropriate cloud product given the customer priorities. However, the proposed framework in this paper introduces an analytical approach for cloud service design. Ref. 21 has stated that they will extend their proposed quality model with non-quantifiable QoS attributes and deal with variations in attributes by applying fuzzy sets. In this paper, we used their attribute set. We then obtained a customer-oriented product design by additionally considering the dependencies among attributes using ANP, which was omitted in Ref. 21 due to the choice of AHP. Besides quality issues, we introduced the concept of cost conscious and sustainability conscious design. We wanted to show that a complete design should satisfy all stakeholders; not only the customers, but also the CSPs and the environmental agencies. As planned by Ref. 21, we made use of fuzzy sets in order to deal with the complexity and vagueness of the problem on hand.
In related literature, there are various research incorporating QFD and fuzzy ANP methodologies into different problem domains.23, 24, 25 The basic idea of the proposed framework in this paper is that it integrates customer feedback into cloud service design by considering distinct and contradicting goals simultaneously. Initial step for this procedure is to differentiate customers into profiles regarding their common expectations. The QFD methodology then identifies the interrelationships among customer feedback and the interrelationships among technical attributes. The technical attributes are CSPs’ tools to modify the current product offering. In this manner, attributes that may be ignored (i.e. having little or no meaning to customer) are identified. Then, along with quality expectations, cost and sustainability are incorporated into the decision making process.
3. The Methodologies
3.1. Quality function deployment (QFD)
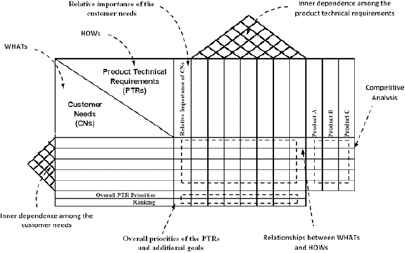
QFD methodology is a strategic knowledge management tool that brings together customer reactions and the product development process. Numerous information from various functional business units are brought together in QFD. The ultimate goal is to use these data to build a profitable and satisfactory product/service. QFD framework has a systematic approach to convert customer feedbacks to meaningful design-related knowledge. QFD methodology mainly stands on matrix operations. In each step of QFD, various information inputs are transformed to various outputs through matrices, where each step’s output becomes the input of the following one.26 QFD starts with an initial matrix, called house of quality (Figure 1). The essential eight elements of HOQ can be outlined as:
- (i)
Customer needs (CNs) (WHATs). These are the customers’ phrases where they describe their expectations from the service/product. They are usually called ‘voice of the customer’.
- (ii)
Product technical requirements (PTRs) (HOWs). These are the measurable technical/design characteristics which help companies to respond to CNs. They are usually called ‘voice of the company’.
- (iii)
Relative importance of the CNs. Simultaneously handling all the input coming from the customers is usually quite complicated. Eliminating insignificant CNs is chosen as a solution to this problem. Therefore, insignificant CNs needs to be eliminated.
- (iv)
Relationships between CNs and PTRs. These relationships constitute the core part of the HOQ. They define to what extent each PTR affects each CN resulting in importance values of CNs in terms of PTRs.
- (v)
Inner dependencies among the CNs. At this stage, the interactions among the CNs are found out. The predicted results can be utilized to measure how much and whether or not CNs supports each other.
- (vi)
Inner dependencies among the PTRs. Similar to the inner dependencies among CNs, the inner dependencies among PTRs are calculated and placed in the roof of HOQ.
- (vii)
Competitive analysis. This step is crucial when both defining a marketing strategy and creating a sustainable competitive advantage. It incorporates competitor’ performances into the decision process of CSPs when defining improvement directions.
- (viii)
Overall priorities and performance values of PTRs. The performance values of PTRs and additional goals are considered to form the final ranking of the PTRs.
House of quality
3.2. Analytic Network Process
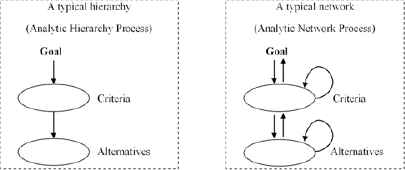
ANP is accepted as an extension to the analytic hierarchy process. AHP separates a complex problem into several levels so that they constitutes a hierarchy.13 Each element in this hierarchy is assumed to be independent. Although AHP merges both qualitative and quantitative perspectives into a decision problem, it is not able to handle the interconnections and inner dependencies among decision factors at the same hierarchy level.27 For this purpose, ANP approach is developed, including networks instead of hierarchies (Figure 2).12 Hence, ANP can deal with the cases where there is interdependence among the alternatives and criteria.
Representation of AHP and ANP structures
Customers’ needs obtained as part of the QFD methodology are usually expressed in linguistic terms. Thus, vague and ambiguous data has to be translated. Fuzzy set theory as proposed by Ref. 28 defines the necessary elements to deal with the uncertainty due to imprecision and vagueness. Therefore, in this paper fuzzy ANP methodology is applied. Although the existence of many approaches in the literature that show how to apply fuzzy set theory to incorporate linguistic variables into calculations, due to simplicity of the calculations, we have used Chang’s fuzzy extent analysis in this paper.29 Accordingly, an object set X = {x1, x2, ⋯,xn} and a goal set G = {g1, g2, ⋯, gm} is defined. Extent analysis is performed taking each object and repeating the procedure for each goal resulting in m fuzzy triangular values:
The linguistic scale and corresponding triangular fuzzy numbers are illustrated in Table 1 based on Saaty’s scale.13 The parameter Ɵ is taken as 1.
| Fuzzy Number | Membership function |
|---|---|
|
|
(1, 1, 2) |
|
|
(x-1, x, x+1 ) for x = 2, 3, 4, 5, 6, 7, 8 |
|
|
(8, 9, 9) |
Linguistic scale and corresponding fuzzy numbers
Stepwise representation of extent analysis is given as follows30:
Step 1. The value of fuzzy synthetic extent with respect to the ith object is calculated as,
The details of the necessary fuzzy operations are explained in Ref. 29 and Ref. 30.
Step 2. The degree of possibility of M2, (l2, m2, u2) ≥ M1(l1, m1, u1) is defined as:
Step 3. The degree possibility for a convex fuzzy number to be greater than k convex fuzzy numbers is defined by
If d′(Ai) = minV(Si ≥ Sk), then for k = 1,2,3,⋯, n; k ≠ i, the corresponding weight vector can be calculated as follows:
Step 4. The last step calculates the normalized weight vectors:
4. Research Framework
In the proposed decision support framework, CSPs need to incorporate customer perspective in terms of quality expectations along with their own perspective in terms of sustainability and cost. The aim is balancing design preferences in a simple and systematic way. The research methodology is based on the model in Ref. 31. In that research, the authors use ANP with the QFD in order to recommend improvement goals for PTRs. Ref. 31’s case study considers improving the design of a pencil. They incorporate customer feedback into the decision and design process. Then, they make use of a goal programming approach that takes into account all cost, extendibility and manufacturability dimensions. They build only one HOQ matrix to obtain a customer-oriented design, whereas in this paper we formed three HOQ matrices, one for customers’ and the remaining two for CSPs’ satisfaction, respectively. We then combine their results in order to obtain the most convenient cloud product both from customers and CSPs’ perspectives. In other words, three HOQ matrices are used, one for the quality, one for the cost and another one for the sustainability goal.
Similar to Ref. 31, ANP is applied to prioritize design criteria. The strength of dependencies among the criteria are evaluated using pairwise comparisons. The influences of criteria on other ones are represented via a matrix, called a supermatrix. It is raised to powers until it converges to a limiting matrix with the overall priorities of the elements.32 This research uses the following supermatrix representation31:
w1: A vector representing the impact of the goal,
W2: A matrix denoting the impact of the CNs on each of the PTRs,
W3 and W4: The matrices representing inner dependencies of the CNs and PTRs, respectively.
We used fuzzy extent analysis methodology to convert fuzzy numbers into corresponding crisp weights and placed them in respective matrices.
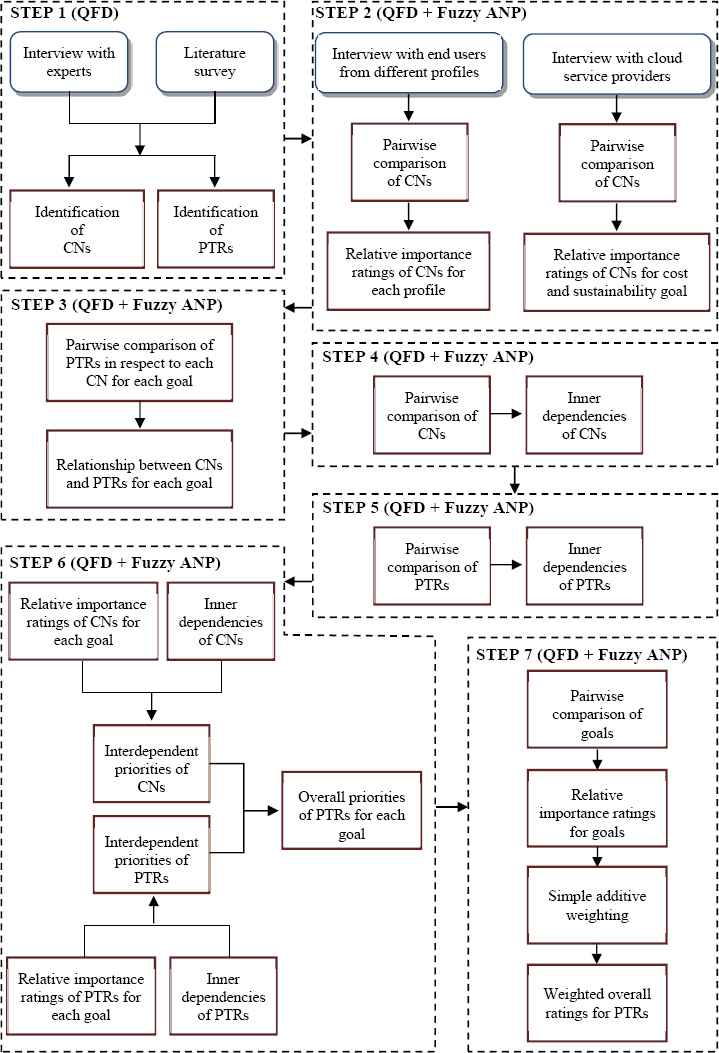
The supermatrix representation given in (1) defines a network with two clusters (criteria and alternatives) besides the goal. Instead of raising the supermatrix to limiting powers, a matrix manipulation approach33 can be employed to obtain overall priorities of the elements. The approach suggests that, by multiplying W3 with w1, the vector of interdependent priorities of the CNs (wC) and by multiplying W4 by W2, the matrix of interdependent priorities of the PTRs (WA) can be obtained. Overall priorities of the elements (WANP) is the result of the multiplication of WA with wC. These weights correspond to the importance ratings for PTRs. Since this research combines three different goals, the same calculations are repeated three times with different aims. At the end, we obtained three sets of weights representing quality, cost and sustainability views. The preference of the CSP towards these views is calculated using pairwise comparisons. Finally, the overall weight vector of PTRs is computed using simple additive weighting approach. Figure 3 depicts the main steps and their precedence.
Cloud product design framework
Step 1. The proposed design framework starts by defining the customer needs that represent the perceptions of customers regarding the product/service and are expressed using customer’s own phrases. Then, the product technical requirements that represent the resources used to fulfill the CNs are defined.
Step 2. As customer needs are usually too diverse to deal with simultaneously, they have to be rated in order to determine the most important ones. These ratings will reflect the order of preference. Herein, as suggested by the ANP methodology, pairwise comparisons are implemented. For obtaining crisp weights we used fuzzy extent analysis. The result is w1 the vector. We differentiated cloud customers into three different profiles. Therefore, at this stage different w1 vectors representing different customer profiles are calculated. Since there are three separate goals (quality, cost and sustainability) in our decision framework, the w1 vector is calculated three times, each time with the respective goal.
Step 3. This step involves the identification of the degrees of relative importance of PTRs with respect to each CN. In other words, whether or not and how much a PTR affects a CN is determined. Doing so, we assume that there is not any dependence among PTRs. The result of this step is given as W2. Similar to the calculations for w1, W2 is calculated three times in order to reflect the effect of the different goals.
Step 4. In real life scenarios, the interactions are too complex to assume independence among the CNs. ANP is applied as the means to determine the interactions among CNs. Similarly; pairwise comparisons are used to obtain W3.
Step 5. Similar to CNs, PTRs may affect each other. Therefore, the inner dependencies among them need to be determined. The results obtained using ANP is represented as W4.
Step 6. At this stage, CNs need to be transformed into measurable PTRs. For this transformation, the interdependent priorities of CNs (wC) and the interdependent priorities of PTRs (WA) are calculated. WA and wC are then combined to obtain the overall priorities of PTRs for each respective goal.
Step 7. The proposed product design framework tries to balance three distinctive goals (quality, cost, and sustainability). Therefore, the CSP’s preference towards these goals have to be determined. Herein, pairwise comparisons are once again utilized. The resulting relative importance weights are combined with overall priorities of PTRs for each goal with simple additive weighting approach. Building the hierarchy structure of cloud service with CNs and PTRs is a one-time effort and remains the same until there is a necessity for changing the set of CNs and PTRs.
The most time consuming step is the pairwise comparisons. The Miller’s Law states that the number of objects that an average human can handle in short term memory is 7±2.34 Hence, when making pairwise comparisons, at most 9 comparisons are made. Fuzzy logic facilitates decision makers’ work when making pairwise comparisons, since it resembles to human reasoning.
5. Empirical Analysis
In our demonstrative example, we aim at showing how the technical specifications of cloud products should be attuned according to different customer profiles. The data used in the example is based on the work of Ref. 21. They intended to select the best CSP among Amazon EC2, Windows Azure and Rackspace, considering only their quality aspects. Our previous study that used only a single profile made use of the same data set as well.10
Step 1. The CNs are specified using the first level QoS attributes defined in Ref. 21, since they established a comprehensive list. We utilize their attributes and classify quality-related attributes as CNs and performance related attributes as PTRs (Table 2).10 Their explanations are given in more detail in Ref. 21.
| Customer Needs (CNs) | Product Technical Requirements (PTRs) |
|---|---|
| CN1: Accountability | PTR1: Accountability performance |
| CN2: Capacity | PTR2: CPU capacity |
| CN3: Elasticity | PTR3: Memory capacity |
| CN4: Availability | PTR4: Disk capacity |
| CN5: Service stability | PTR5: Mean time taken to expand/contract serv. capacity |
| CN6: Serviceability | PTR6: Availability |
| CN7: On-going cost | PTR7: Upload time |
| CN8: Serv. response time | PTR8: CPU stability |
| CN9: Security | PTR9: Memory stability |
| PTR10: Free support | |
| PTR11: Type of support | |
| PTR12: Virtual machine cost | |
| PTR13: Inbound data cost | |
| PTR14: Outbound data cost | |
| PTR15: Storage cost | |
| PTR16: Service response time range | |
| PTR17: Service response time average value | |
| PTR18: Security performance |
List of customer needs and product technical requirements
Step 2. The relative importance of the CNs for the quality goal are determined by asking the following question: ‘Which CN should be emphasized more in establishing the most satisfactory cloud product?’. The challenge at this stage is that usually CSPs have to deal with the expectations of extremely different customer profiles (for example, a firm of 900 employees vs. a start-up business of two buddies). As differentiated customer requirements, we define three customer profiles (Table 3). The first one is the profile that Ref. 21 used in their case study. They randomly determined weights of customer needs. The second profile represents a scientific community. The importance weights for this profile are identified based on an interview with the head of the IT department of our university. The third profile represents a medium-sized established commercial organization, whose importance weights are calculated by taking the average of the results obtained from two CIOs of two medium-sized software development firms. For this demonstrative case study, the points of views of two CIOs are found sufficient; but a totally independent study may be done to determine and evaluate these criteria as a future work.
| Customer Profiles | Description |
|---|---|
| Profile 1 | Ref. 21; weights of CNs are determined randomly. |
| Profile 2 | Scientific community (i.e. university) |
| Profile 3 | Commercial organization (i.e. medium-sized firm) |
Three different customer profiles
The resulting weights after applying Chang’s fuzzy extent analysis for different profiles are illustrated in Figure 4. We can observe differences among weights, especially for CN1, CN2, CN3, CN8 and CN9. For instance, the weight of capacity (CN2) is 6% for profile 1, 29.5% for profile 2 and is considered ignorable (0%) for profile 3. This is an indicator of how different customer expectations could be.
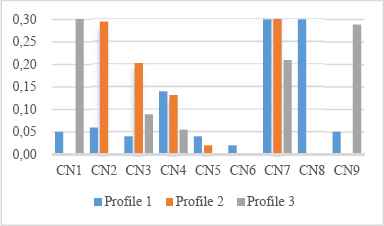
Relative importance weights of CNs of different customer profiles for the quality goal
The relative importance of the CNs for the cost and sustainability goals are determined by asking the same questions. However, as these goals represent CSPs’ perspectives, we get in touch with a CTO from a CSP and let him make the pairwise comparisons. The resulting weights are given in Table 4 and Table 5. The results reveal that the three most important CNs affecting the cost of the cloud product are ‘on-going cost’, ‘security’ and ‘capacity’. The three most important CNs affecting the cloud product in terms of sustainability are ‘elasticity’, ‘on-going cost’ and ‘availability’.
| w1 | (0.000 0.193 0.000 0.033 0.000 0.000 0.361 0.095 0.318)T |
Relative importance weights of CNs for the cost goal
| w1 | (0.000 0.000 0.354 0.204 0.048 0.129 0.265 0.000 0.000)T |
Relative importance weights of CNs for the sustainability goal
Step 3. Assuming that PTRs are independent, they are compared with respect to each CN considering different goals in mind. One example of questions is: ‘What is the relative importance of CPU stability when compared to upload time on controlling service stability?’. Table 6 summarizes the relative importance of PTRs for all the CNs for the quality goal in mind (W2). The same calculations are done for the remaining goals (cost and sustainability).
| W2 | CN1 | CN2 | CN3 | CN4 | CN5 | CN6 | CN7 | CN8 | CN9 |
|---|---|---|---|---|---|---|---|---|---|
| PTR1 | 1.000 | 0 | 0 | 0 | 0 | 0 | 0 | 0 | 0 |
| PTR2 | 0 | 0.449 | 0 | 0 | 0 | 0 | 0 | 0 | 0 |
| PTR3 | 0 | 0.351 | 0 | 0 | 0 | 0 | 0 | 0 | 0 |
| PTR4 | 0 | 0.200 | 0 | 0 | 0 | 0 | 0 | 0 | 0 |
| PTR5 | 0 | 0 | 1.000 | 0 | 0 | 0 | 0 | 0 | 0 |
| PTR6 | 0 | 0 | 0 | 1.000 | 0 | 0 | 0 | 0 | 0 |
| PTR7 | 0 | 0 | 0 | 0 | 0.365 | 0 | 0 | 0 | 0 |
| PTR8 | 0 | 0 | 0 | 0 | 0.403 | 0 | 0 | 0 | 0 |
| PTR9 | 0 | 0 | 0 | 0 | 0.232 | 0 | 0 | 0 | 0 |
| PTR10 | 0 | 0 | 0 | 0 | 0 | 1.000 | 0 | 0 | 0 |
| PTR11 | 0 | 0 | 0 | 0 | 0 | 0 | 0 | 0 | 0 |
| PTR12 | 0 | 0 | 0 | 0 | 0 | 0 | 0.878 | 0 | 0 |
| PTR13 | 0 | 0 | 0 | 0 | 0 | 0 | 0 | 0 | 0 |
| PTR14 | 0 | 0 | 0 | 0 | 0 | 0 | 0 | 0 | 0 |
| PTR15 | 0 | 0 | 0 | 0 | 0 | 0 | 0.122 | 0 | 0 |
| PTR16 | 0 | 0 | 0 | 0 | 0 | 0 | 0 | 0.500 | 0 |
| PTR17 | 0 | 0 | 0 | 0 | 0 | 0 | 0 | 0.500 | 0 |
| PTR18 | 0 | 0 | 0 | 0 | 0 | 0 | 0 | 0 | 1.000 |
Column eigenvectors with respect to each CN for the quality goal
Step 4. This step comprises the identification of the inner dependencies among the CNs. A possible question at this stage is: ‘Given the CN, availability, which CN contributes availability more, and how much more?’ yielding to the inner dependence matrix given in Table 7. We computed the normalized crisp weights using fuzzy extent analysis. The resulting column eigenvectors are summarized in Table 8 (W3).
| Availability | Availability | Serviceability | Service response time | Security |
|---|---|---|---|---|
| Availability | 1 |
|
|
|
| Serviceability |
|
1 |
|
|
| Service response time |
|
|
1 |
|
| Security |
|
|
|
1 |
The inner dependence matrix for ‘availability’ CN
| W3 | CN1 | CN2 | CN3 | CN4 | CN5 | CN6 | CN7 | CN8 | CN9 |
|---|---|---|---|---|---|---|---|---|---|
| CN1 | 1.000 | 0 | 0 | 0 | 0 | 0 | 0 | 0 | 0 |
| CN2 | 0 | 0.946 | 0 | 0 | 0 | 0 | 0 | 0 | 0 |
| CN3 | 0 | 0 | 0.678 | 0 | 0 | 0 | 0 | 0 | 0 |
| CN4 | 0 | 0 | 0 | 0.499 | 0 | 0 | 0 | 0 | 0 |
| CN5 | 0 | 0 | 0 | 0 | 0.616 | 0 | 0 | 0.384 | 0 |
| CN6 | 0 | 0 | 0 | 0.383 | 0.384 | 0.692 | 0 | 0. | 0 |
| CN7 | 0 | 0.054 | 0.322 | 0 | 0 | 0.308 | 1.000 | 0 | 0 |
| CN8 | 0 | 0 | 0 | 0.118 | 0 | 0 | 0 | 0.616 | 0 |
| CN9 | 0 | 0 | 0 | 0 | 0 | 0 | 0 | 0 | 1.000 |
The inner dependence matrix of CNs
Step 5. In this step, we determine the inner dependencies among the PTRs similar to Step 4 and obtain W4 (Table 9).
| W4 | PTR1 | PTR2 | PTR3 | PTR4 | PTR5 | PTR6 | PTR7 | PTR8 | PTR9 | PTR10 | PTR11 | PTR12 | PTR13 | PTR14 | PTR15 | PTR16 | PTR17 | PTR18 |
|---|---|---|---|---|---|---|---|---|---|---|---|---|---|---|---|---|---|---|
| Accountability (PTR1) | 1.000 | 0 | 0 | 0 | 0 | 0 | 0 | 0 | 0 | 0 | 0.140 | 0 | 0 | 0 | 0 | 0 | 0 | 0 |
| CPU capacity (PTR2) | 0 | 0.491 | 0 | 0 | 0.308 | 0 | 0 | 0.077 | 0 | 0 | 0 | 0.345 | 0 | 0 | 0 | 0 | 0 | 0 |
| Memory capacity (PTR3) | 0 | 0 | 0.673 | 0 | 0 | 0 | 0 | 0 | 0.177 | 0 | 0 | 0.152 | 0 | 0 | 0 | 0 | 0 | 0 |
| Disk (PTR4) | 0 | 0 | 0 | 0.399 | 0 | 0 | 0 | 0 | 0 | 0 | 0 | 0 | 0 | 0 | 0.366 | 0 | 0 | 0 |
| Mean time taken to expand or contract the service capacity (PTR5) | 0 | 0 | 0 | 0 | 0.692 | 0 | 0 | 0 | 0 | 0 | 0 | 0 | 0 | 0 | 0 | 0 | 0 | 0 |
| Availability (PTR6) | 0 | 0 | 0 | 0 | 0 | 0.946 | 0 | 0 | 0 | 0 | 0 | 0 | 0 | 0 | 0 | 0 | 0 | 0 |
| Upload time (PTR7) | 0 | 0 | 0 | 0 | 0 | 0 | 1.000 | 0 | 0 | 0 | 0 | 0 | 0 | 0 | 0 | 0 | 0 | 0 |
| CPU stability (PTR8) | 0 | 0 | 0 | 0 | 0 | 0.054 | 0 | 0.612 | 0 | 0 | 0 | 0 | 0 | 0 | 0 | 0.149 | 0.149 | 0 |
| Memory stability (PTR9) | 0 | 0 | 0 | 0 | 0 | 0 | 0 | 0 | 0.483 | 0 | 0 | 0 | 0 | 0 | 0 | 0.113 | 0.113 | 0 |
| Free support (PTR10) | 0 | 0 | 0 | 0 | 0 | 0 | 0 | 0 | 0 | 0.816 | 0 | 0 | 0 | 0 | 0 | 0 | 0 | 0 |
| Type of support (PTR11) | 0 | 0 | 0 | 0 | 0 | 0 | 0 | 0 | 0 | 0 | 0.486 | 0 | 0 | 0 | 0 | 0 | 0 | 0 |
| VM cost (PTR12) | 0 | 0.330 | 0.327 | 0.202 | 0 | 0 | 0 | 0.311 | 0.340 | 0 | 0.374 | 0.503 | 0 | 0 | 0 | 0 | 0 | 0 |
| Inbound data cost (PTR13) | 0 | 0 | 0 | 0 | 0 | 0 | 0 | 0 | 0 | 0 | 0 | 0 | 1.000 | 0 | 0 | 0 | 0 | 0 |
| Outbound data cost (PTR14) | 0 | 0 | 0 | 0 | 0 | 0 | 0 | 0 | 0 | 0 | 0 | 0 | 1.000 | 0 | 0 | 0 | 0 | |
| Storage cost (PTR15) | 0 | 0 | 0 | 0.399 | 0 | 0 | 0 | 0 | 0 | 0 | 0 | 0 | 0 | 0 | 0.634 | 0 | 0 | 0 |
| Service R. T. range (PTR16) | 0 | 0.128 | 0 | 0 | 0 | 0 | 0 | 0 | 0 | 0 | 0 | 0 | 0 | 0 | 0 | 0.304 | 0.304 | 0 |
| Service R.T. average (PTR17) | 0 | 0.051 | 0 | 0 | 0 | 0 | 0 | 0 | 0 | 0.184 | 0 | 0 | 0 | 0 | 0 | 0.434 | 0.434 | 0 |
| Security performance (PTR18) | 0 | 0 | 0 | 0 | 0 | 0 | 0 | 0 | 0 | 0 | 0 | 0 | 0 | 0 | 0 | 0 | 0 | 1.000 |
The inner dependence matrix of PTRs
Step 6. The overall priorities of the PTRs (WANP) are calculated using matrix manipulations as explained in Section 4. The results reveal the diversified nature of potential customers and its effect on the product requirements (Figure 5).
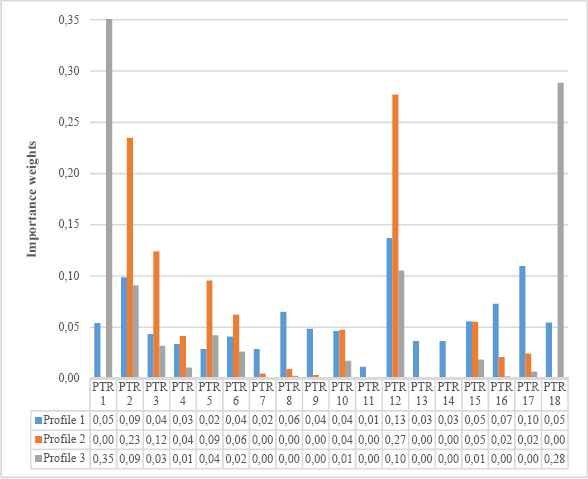
Overall priorities of PTRs for the quality goal with different profiles
The main objective of our proposed framework is to guide CSPs in designing their cloud offerings. Thus, the overall ratings of PTRs serve for this purpose. They point out the specifications of the product on which the CSPs have to concentrate their efforts in order to satisfy the needs of their customers. For instance, for commercial organizations (Profile 3) ‘accountability’ (PTR1), and ‘security performance’ (PTR18) seem to be considerably more important compared to Profile 1 and Profile 2. On the other hand, for a scientific community, ‘VM cost’
(PTR12) and ‘CPU capacity’ (PTR2) are more decisive attributes. Therefore, CSPs have to attune their offerings accordingly.
The overall priorities of PTRs for cost and sustainability goals are calculated using the same matrix manipulations. The resulting weights are given in Figure 6. The first row represents the importance weights of product technical requirements when just quality goal is considered (profile 1), while the second and third rows represent the importance weights when the cost and sustainability goals are considered, respectively. The analysis results point out that the most important cost-oriented cloud service requirements are ‘security performance’, ‘VM cost’ and ‘CPU capacity’ and most important sustainability-oriented cloud service requirements are ‘time’, ‘VM cost’ and ‘CPU capacity’.
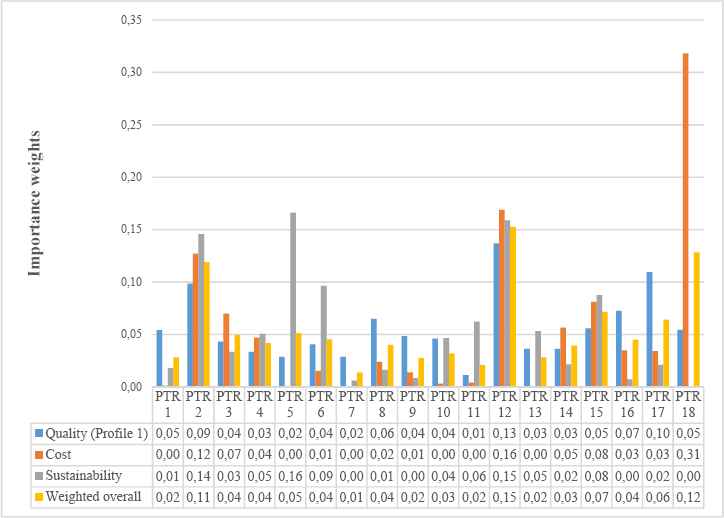
Overall priorities of PTRs for different goals
Step 7. The CSP’s attitude towards quality, cost and sustainability is determined using pairwise comparisons by the same CTO consulted for the previous calculations. The resulting relative importance ratings for each goal are summarized in Table 10. According to the ratings, quality attribute is considered more important than cost and sustainability with a weight of 43.9%. For another decision maker with different priorities, cost or sustainability could become more important.
| Goals | Relative importance ratings |
|---|---|
| Quality | 0.439 |
| Cost | 0.329 |
| Sustainability | 0.233 |
Relative importance ratings for quality, cost and sustainability goals
The overall ratings for PTRs are calculated using simple additive weighting by combining overall ratings of PTRs for each goal. Since there are three different profiles for the quality goal, for the sake of simplicity, only the first profile is depicted. In a real life scenario, CSPs could attach different weights for different customer profiles and may use simple additive weighting to obtain an overall rating for the quality goal or simply provide different service offerings for each customer profile. The last row in Figure 6 summarizes the unification of different views with the weighted overall ratings of PTRs for the first customer profile. The results reveal that overall the most meaningful cloud service attribute is ‘VM cost’, followed by, ‘security performance’ and ‘CPU capacity’ for a customer with the first profile and CSPs own cost and sustainability preferences.
We believe that simultaneously considering different goals has brought new directions to the product design process.
Figure 7, depicts the effect of different customer segments on the weighted overall ratings of PTRs. According to the findings, if the CSP wants to satisfy an academic institution as a customer, it should start paying attention to ‘VM cost’, ‘ CPU capacity’ and ‘security performance’. The results are effectively the same as for the first profile. However, the relative weights (%21.41 versus %15.26 for ‘VM cost’) and their orders are different. Similarly, a commercial institution as a customer have different priorities and as a result, CSP should form a product focusing on these attributes; ‘security performance’, ‘accountability’ and ‘VM cost’ followed by the remaining attributes in a descending importance.
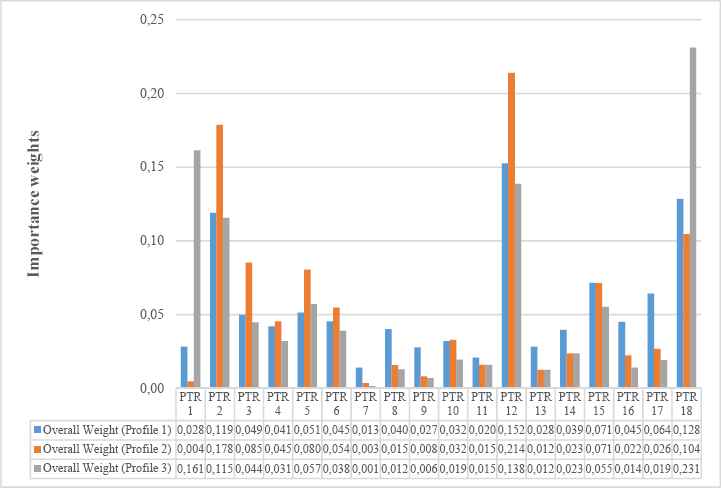
Overall weighted priorities of PTRs for different profiles
As the last analysis, we focus on the impact of fuzzy set theory usage on the results. In Figure 8, we compare the overall weights of the PTRs of a customer with Profile 1 in two different frameworks: The one, where only crisp numbers are used10, and the other where fuzzy triangular numbers are used. When we rank in terms of priorities, the first three PTRs are the same in both model; however there are quite a lot differences in the remaining 15 PTRs. The main benefit of incorporating fuzzy set theory into decision making process is to deal with the vagueness of the subjective judgments of various DMs. We believe the use of fuzzy set theory was necessary, since DMs were reluctant and/or unable to express their judgments using exact numbers.
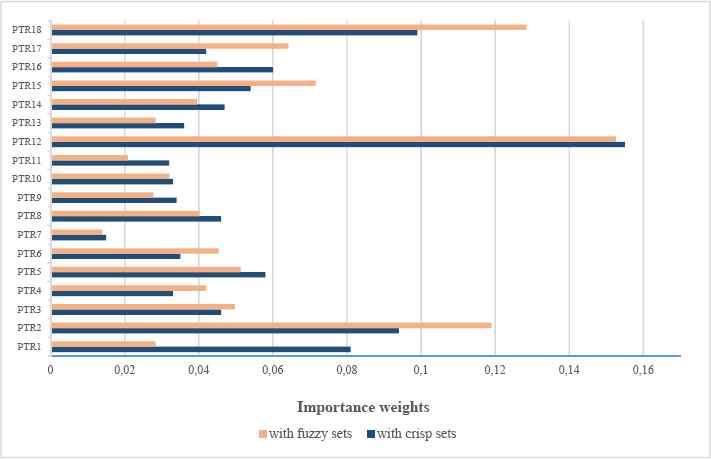
Comparison of overall weighted priorities of PTRs
6. Conclusion
In this paper, we proposed a product design decision support framework that incorporates different perspectives simultaneously. Undoubtedly, a successful cloud product should be able to satisfy its prospective customers in terms of quality merits it possesses. The identified customer needs for different customer profiles are the means for this purpose. However, this design also incorporates the price of the product (CN7 – ongoing cost), which is an essential quality attribute. Apart from customers, the same product should be able to satisfy its CSP. We think that two of the attributes perfectly capable of representing the CSPs’ perspective are the cost and the sustainability. The cost view aims to obtain a cost-effective product. Sustainability is a relatively new term that tries to achieve environmentally conscious and less resource consuming products and services. Sustainability is usually seen as a necessity for being a good corporate citizen. If the service provider is able to design a cost-oriented product, the result may a reduced price for the services provided. However, this perspective may ignore the customer expectations during the design phase. Hence, we tried to balance these different perspectives. We believe that if a CSP is able to consolidate these perspectives in its cloud offering when serving different customer segments by forming appropriate products, it will gain a competitive advantage in the cloud market. The relations between these goals/perspectives are presented using relative weights. These weights are used to prioritize the design process (Table 10). If the cloud service provider is inclined to satisfy customers, quality perspective should have a higher rating, which is the case in the demonstrative example. If the cloud service provider wants to build a product with low cost, then cost aim should have a higher rating. Hence, these ratings could be used to define a marketing strategy (build a product for low cost or build a product with differentiation in mind).
As a solution, we preferred QFD as the decision support tool, which examines customers’ needs of different profiles and transform this subjective information into measurable product attributes. The end result is a tailored product for different customers. Herein, QFD provides a systematic procedure to associate various sources of input, both subjective (i.e. customer expectations and sustainability measures), and objective (i.e. product attributes and cost analysis results). Then, ANP is used for the pairwise comparisons required by QFD to deal with dependence issues, which are inevitable in such a complex decision problem. In all of the steps of the evaluation process, we applied fuzzy logic to deal with vague and imprecise information. We used Chang’s fuzzy extent analysis to determine the final weights as crisp numbers. In this way, the subjective nature of the product design process has become a computationally systematic procedure.
As a future work, both the list of CNs and PTRs may be enhanced based on Cloud Service Measurement Index Consortium’s measurement indexes35 and ISO/IEC 25010:2011 standard. For the cost of the cloud product, we used comparative analysis to rate technical requirements; but a detailed analysis reflecting the dollar value of technical requirements could prove more useful. It is possible to apply the proposed framework to different services classes (XaaS) on condition of changing the evaluation criteria set.
Acknowledgements
This research has been financially supported by Galatasaray University Research Fund, with the project number [13.402.006].
References
Cite this article
TY  - JOUR
AU  - S. Emre Alptekin
AU  - Gülfem Isiklar Alptekin
PY  - 2018
DA  - 2018/05/10
TI  - A Fuzzy Quality Function Deployment Approach for Differentiating Cloud Products
JO  - International Journal of Computational Intelligence Systems
SP  - 1041
EP  - 1055
VL  - 11
IS  - 1
SN  - 1875-6883
UR  - https://doi.org/10.2991/ijcis.11.1.79
DO  - 10.2991/ijcis.11.1.79
ID  - Alptekin2018
ER  -