
Fuzzy Logic Based Cross-Layer Design for Image Transmission in Wireless Sensor Networks
- DOI
- 10.2991/ijcis.11.1.67How to use a DOI?
- Keywords
- fuzzy logic; cross-layer design; quality of service; wireless multimedia sensor networks
- Abstract
The evolution of wireless multimedia sensor networks (WMSN) has opened the door to a wide range of applications such as telemedicine, surveillance, and intrusion detection. However, the delivery of multimedia content over wireless sensor networks requires maintaining the quality of service demands of the applications as well as the resource constraints of the network. This has motivated the design of cross-layer architectures as a promising solution for efficiently meeting the quality of service requirements and the resource constraints in WMSN. In this paper, a cross-layer design for image transmission, using fuzzy logic, is proposed to provide quality of service guarantees and efficient resource utilization in WMSN. The proposed cross-layer design takes into consideration the trade-off between the network performance and the quality of received images by exploiting the information exchange between different layers in the protocol stack. The simulation results demonstrate that the proposed approach can efficiently improve the network performance in terms of packet loss, delay, and energy consumption, while maintaining an acceptable level of quality of the received images.
- Copyright
- © 2018, the Authors. Published by Atlantis Press.
- Open Access
- This is an open access article under the CC BY-NC license (http://creativecommons.org/licences/by-nc/4.0/).
1. Introduction
A wireless sensor network (WSN) is a system that consists of resource-constrained sensor nodes, deployed randomly or manually, to carry out a certain task in a region of interest. The introduction of the complementary metal–oxide–semiconductor (CMOS) multimedia devices such as cameras and microphones and the ability to integrate these devices over low-power and low-cost sensor nodes have led to the emergence of wireless multimedia sensor networks (WMSN).1 As a result, several multimedia applications over WSN such as environment monitoring, telemedicine, surveillance, intrusion detection, and traffic monitoring have been developed.2 However, these applications have strict quality of service (QoS) requirements such as bandwidth, delay, and loss rate, in addition to the quality of perceived data.
Providing QoS in WMSN is a challenging task due to the resource limitations in the sensor nodes. Several research works have focused on providing QoS guarantees along with reducing the energy consumption in WMSN. Moreover, recent studies have demonstrated the efficiency of adopting cross-layer design in improving the network performance and meeting the QoS requirements of the WMSN applications.3,4 Compared to the traditional layered design, the cross-layer design allows communication and information exchange between different layers, in order to jointly optimize the network performance. Therefore, a number of cross-layer designs have been proposed in order to improve QoS in WMSN. These designs focus on either improving one or more parameters such as bandwidth, delay, data loss, and energy consumption,5–8 or enhancing the quality of received images or video.9,10
In this work, a cross-layer design for image transmission in WMSN, using fuzzy logic, is proposed. Unlike existing approaches, the proposed design aims at meeting both the QoS requirements and resource constraints in WMSN, while maintaining the quality of received images.
Fuzzy logic has been used in many WSN related aspects such as routing, clustering, and power optimization.11–13 In the proposed cross-layer design, to improve the delay, data loss, and energy consumption, a fuzzy logic controller is employed to adapt the data rate, at the application layer, to the network conditions according to feedback information from the network and physical layers. The data rate is adjusted by dynamically changing the spatial resolution of the transmitted images. Adapting the images or video resolution to the network conditions has been proven to improve the overall network performance as well as the perceptual quality of transmitted images or video, especially at low bit rates.14–17 The proposed adaptive control scheme aims at making the application more responsive to the dynamic changes in network conditions, while maintaining an acceptable level of visual quality.
The rest of the paper is organized as follows. Section 2 reviews the related research work. Section 3 presents the proposed cross-layer design and the fuzzy inference system. Section 4 provides performance evaluation and discusses the simulation results, and Section 5 concludes the paper.
2. Related Work
Several research works have reported the efficiency of the cross-layer design in supporting the QoS requirements of multimedia applications in WMSN. These works have considered one or more of the QoS metrics such as the end-to-end delay, data loss, energy consumption, and the quality of received images or video.
In Ref. 5 a cross-layer approach was proposed using the network and MAC layers to improve the delay and throughput in WMSN. In this approach, each node determines the quality level of the next hop in order to select the best route to the sink node. The quality level here is a function of the channel quality, data rate, and buffer size of the next hop. MAC frame retransmission counts, inter frame spacing, and backoff intervals are used to determine the quality of the communication channel.
A cross-layer protocol, called XL-WMSN, was proposed in Ref. 6 to improve the QoS according to the application requirements. To enhance the delay and energy consumption, the protocol provides interaction between the network, MAC, and physical layers using dynamic duty cycle, delay-aware routing, and energy-aware admission control. The interaction between the network, MAC, and physical layers was exploited in Ref. 7 to improve the energy consumption, delay, and bandwidth in underwater acoustic sensor networks.
While the aforementioned approaches showed an enhancement in the bandwidth, delay, or energy consumption, they did not consider the quality of the received data.
In Ref. 8 a cross-layer sensor fuzzy-based image transmission (SUIT) protocol that provides congestion control in WMSN was proposed, using the application, transport, network, and MAC layers. The aim of SUIT is to deliver more video frames with less delay and energy consumption by decreasing the image quality. It monitors the ratio of incoming to outgoing packets within a time window, the number of contenders of neighbor nodes, and the buffer occupancy of the next-hop node. In case of congestion, SUIT adapts the video frame rate at the source node according to the level of congestion and decreases the quality of the frames at the intermediate nodes by dropping some packets of the frames. Compared to other congestion control techniques, SUIT showed better performance in terms of energy consumption, frame loss, and frame latency; however, the average quality of the received frames for SUIT was lower than the other techniques.
A cross-layer approach was proposed in Ref. 9 using the application, network, and MAC layers to improve the quality of the transmitted video over WSN. The proposed method exploits information about the available bandwidth, end-to-end delay, and residual energy of the routing paths to select the appropriate path. It also uses selective packet dropping when the required bandwidth is larger than the available bandwidth, in which packets with the less important data are discarded causing degradation in the quality of perceived video.
In Ref. 10 an adaptive cross-layer framework for video transmission over WSN is proposed. It selects the video encoding parameters at the application layer according to the wireless channel condition at the physical layer. It also drops the less important packets when congestion occurs. Simulation results showed that the proposed framework improves the video quality at different wireless channel conditions; however, it did not consider the energy consumption and lifetime of the network.
On the other hand, many studies considered adapting the images or video resolution to the network conditions in order to improve the overall network performance as well as the perceptual quality of transmitted images or video. For instance, in video transmission, data rate can be adjusted to the network conditions by dynamically changing the spatial resolution (frame size) or temporal resolution (frame rate) of the video. In Ref. 14 it was reported that down-sampling the video, prior to compression, and then up-sampling, after decompression, can achieve better visual quality compared to that achieved by direct compression at high resolution for low bit rate.
A fuzzy adaptive spatial video transcoder (FAST) for wireless video transmission was proposed in Ref. 15. The fuzzy logic controller, in adaptive manner, evaluates the suitable spatial transcoding filters based on the delay and signal-to-noise ratio, and accordingly the spatial resolution of the video is adjusted to fit the display of the mobile device. The simulation results showed improvements in the jitter and perceptual quality of the transmitted video that employs spatial transcoding.
In Ref. 16 a mobile video streaming system is proposed to cope with the requirements of video streaming applications in mobile and cellular devices using the concept of spatial resolution adaptation. The proposed system aims at achieving a trade-off between the image quality and power consumption based on a given bit rate.
In Ref. 17 a dynamic resolution control approach was proposed to improve the QoS for video streaming in wireless local area networks. The amount of video traffic is adjusted by changing the temporal resolution of the video at the source nodes. The destination node calculates the multimedia receiving rate periodically and sends it back to the source node in order to adjust the video resolution before transmission. Accordingly, the source node chooses a temporal resolution from among 20, 10, and 5 media units (video frames) per second (mu/sec). The initial transmission rate is assumed 20 mu/sec, which is decreased by one step based on a pre-specified threshold value. When the receiving rate becomes higher and exceeds another threshold value, the source increases the resolution by one step.
3. The Proposed Cross-Layer Design
In this section, a fuzzy logic based cross-layer design for image transmission over WMSN is introduced. The system architecture is first presented and then the fuzzy inference system is described.
3.1. System architecture
The system uses a cross-layer approach to exchange information between the layers of the protocol stack. In the proposed design, the application layer needs to be aware of the information in the network and physical layers in order to adjust the data rate according to the network delay, packet loss, and residual energy of the sensor nodes. The application layer at the source node is responsible of generating images with different resolutions to adjust the data rate. The suitable resolutions are determined in the sink node based on information about the packet loss, delay, and residual energy collected from the network and physical layers. The sink node uses a fuzzy logic controller to determine the suitable resolutions that should be used by the source nodes. Fig. 1 shows the proposed cross-layer architecture and the information flow between the different layers. As shown, the application layer adjusts the resolution of the images using packet loss and delay information from the network layer, and residual energy information from the physical layer. The fuzzy logic controller uses this information to estimate the suitable resolution that should be used by the application layer as explained in the next section.
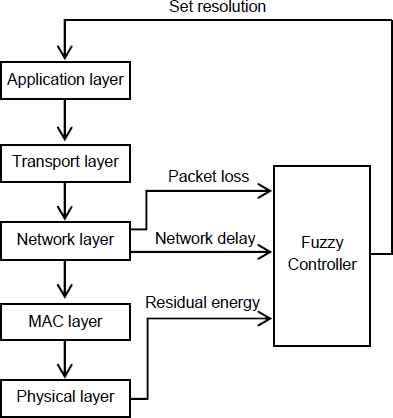
The proposed cross-layer architecture.
3.2. Fuzzy inference system
The fuzzy controller module shown in Fig. 1 represents the core of the proposed approach, which is the fuzzy inference system (FIS). As shown in Fig. 2, the proposed FIS is designed based on the Mamdani model, which mainly consists of three units: fuzzifier, inference engine, and defuzzifier. The FIS has three inputs and one output. The inputs represent the average residual energy in the network, the average network delay, and the average packet-loss rate. The output of the FIS determines the suitable image resolution that should be used by the application. The system was conceived in the light of many experiments applied to different scenarios with different conditions. The inputs and the output are the fuzzy variables of the FIS, which are represented by their corresponding fuzzy sets. As shown in Fig. 3 through Fig. 6, triangle and trapezoid shapes were used to model the fuzzy sets of the FIS variables. These linear shapes were selected because they provide the adequate representation of the expert knowledge and at the same time simplify the process of computation significantly. Moreover, Fig. 3 through Fig. 6 show that the universe of discourse of each variable of the four fuzzy variables is normalized as a percentage between 0 and 100. This was used in order to make the proposed FIS generic and suitable for any network scenario. The normalization was performed by dividing the absolute value of a given variable over the range (the difference between the maximum and minimum values) of the same variable.
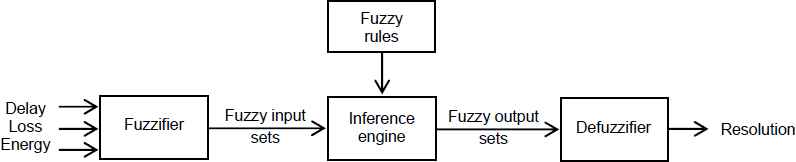
The fuzzy inference system.
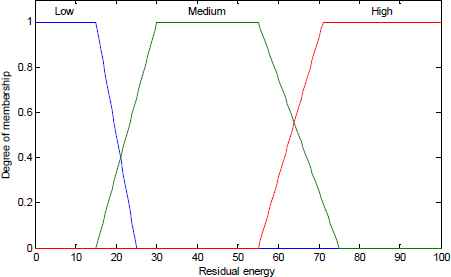
Membership functions of residual energy fuzzy input.
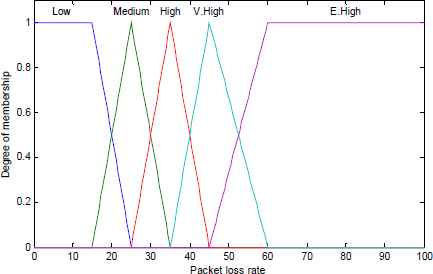
Membership functions of packet loss rate fuzzy input.
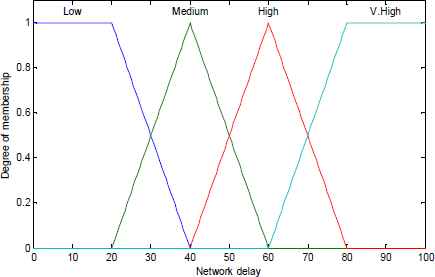
Membership functions of network delay fuzzy input.
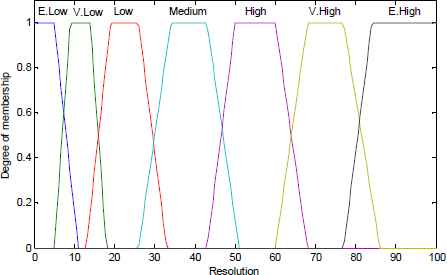
Membership functions of image resolution fuzzy output.
The fuzzifier module in the FIS converts the crisp values of the inputs to the corresponding fuzzy sets. In this step, fuzzy membership functions are applied to the system inputs to specify the degree of membership for the input crisp values. The second step is to take the fuzzified inputs and apply them to the system fuzzy rules. Each fuzzy rule is represented as IF-THEN statement. If there are more than one input in the antecedent part of the IF statement, the fuzzy sets of the corresponding inputs are combined together using the ‘AND’ operator. After that, the output of the fired rules is aggregated to a single fuzzy set. The last step in the FIS is the defuzzification by which the aggregated output set is converted into a single numerical value to represent the output of the system. There are several difuzzification methods, and the most popular one is the center of gravity (CoG) method, which is considered in this work. This method is aiming at finding the central point of the aggregated output mass by integrating the area to represent the output numerical value. This value is then mapped to the corresponding resolution, as explained later in this section.
Fig. 3 shows the membership functions of the average residual energy for three fuzzy sets: low, medium, and high. The degree of membership values was set based on experimentation and showed consistency with other related works.18 Fig. 4 shows the membership functions of the average loss rate for five fuzzy sets: low, medium, high, very high, and extremely high. These functions were selected based on different scenarios and network conditions, taking into consideration the effect of loss rate on the quality of received images.19 Fig. 5 shows the membership functions of the average network delay for four fuzzy sets: low, medium, high, and very high. This classification was considered according to other studies aiming at reducing the network congestion using the delay factor as an indicator of congestion.19 The average delay was normalized based on the delay factor, which is the ratio of the average delay to the maximum delay. The fuzzy sets are separated by 20% increments, which is sufficient to capture the relative increase of delay caused by the network conditions.19
Fig. 6 shows the membership functions of image resolution as a fuzzy output. The fuzzy sets are symmetrically divided to form seven sets ranging from extremely low to extremely high, where each fuzzy set represents a set of resolutions. After applying the CoG method, the output of the FIS becomes a crisp value between 0 and 100. This value is mapped to one of 31 different resolutions ranging from 50×50 to 350×350, as shown in Table 1. For example, if the output value of the resolution from the FIS is between 0 and 9.6, it is considered as extremely low and mapped to one of three resolutions: 50×50, 60×60, or 70×70.
| Resolution | Range | Resolution | Range | Resolution | Range |
|---|---|---|---|---|---|
| 50×50 | [0.0, 3.2] | 160×160 | [35.2, 38.4] | 270×270 | [70.4, 73.6] |
| 60×60 | [3.2, 6.4] | 170×170 | [38.4, 41.6] | 280×280 | [73.6, 76.8] |
| 70×70 | [6.4, 9.6] | 180×180 | [41.6, 44.8] | 290×290 | [76.8, 80.0] |
| 80×80 | [9.6, 12.8] | 190×190 | [44.8, 48.0] | 300×300 | [80.0, 83.2] |
| 90×90 | [12.8, 16.0] | 200×200 | [48.0, 51.2] | 310×310 | [83.2, 86.4] |
| 100×100 | [16.0, 19.2] | 210×210 | [51.2, 54.4] | 320×320 | [86.4, 89.6] |
| 110×110 | [19.2, 22.4] | 220×220 | [54.4, 57.6] | 330×330 | [89.6, 92.8] |
| 120×120 | [22.4, 25.6] | 230×230 | [57.6, 60.8] | 340×340 | [92.8, 96.0] |
| 130×130 | [25.6, 28.8] | 240×240 | [60.8, 64.0] | 350×350 | [96.0, 100] |
| 140×140 | [28.8, 32.0] | 250×250 | [64.0, 67.2] | ||
| 150×150 | [32.0, 35.2] | 260×260 | [67.2, 70.4] |
Resolution mapping table.
Table 2 shows the 60 different rules that are used in the FIS. Each rule takes the following form:
IF (Residual energy is A) AND (Network delay is B) AND (Packet loss is C) THEN Resolution is Z
| Residual energy | Network delay | Packet loss | Resolution | Residual energy | Network delay | Packet loss | Resolution |
|---|---|---|---|---|---|---|---|
| High | Very High | Extremely High | Low | Medium | Medium | Extremely High | Very Low |
| High | Very High | Very High | Medium | Medium | Medium | Very High | Low |
| High | Very High | High | High | Medium | Medium | High | Medium |
| High | Very High | Medium | Very High | Medium | Medium | Medium | Medium |
| High | Very High | Low | Extremely High | Medium | Medium | Low | High |
| High | High | Extremely High | Low | Medium | Low | Extremely High | Very Low |
| High | High | Very High | Medium | Medium | Low | Very High | Low |
| High | High | High | High | Medium | Low | High | Medium |
| High | High | Medium | Very High | Medium | Low | Medium | Medium |
| High | High | Low | Extremely High | Medium | Low | Low | High |
| High | Medium | Extremely High | Low | Low | Very High | Extremely High | Extremely Low |
| High | Medium | Very High | Medium | Low | Very High | Very High | Very Low |
| High | Medium | High | High | Low | Very High | High | Low |
| High | Medium | Medium | Very High | Low | Very High | Medium | Medium |
| High | Medium | Low | Extremely High | Low | Very High | Low | High |
| High | Low | Extremely High | Low | Low | High | Extremely High | Extremely Low |
| High | Low | Very High | Medium | Low | High | Very High | Very Low |
| High | Low | High | High | Low | High | High | Low |
| High | Low | Medium | Very High | Low | High | Medium | Medium |
| High | Low | Low | Extremely High | Low | High | Low | High |
| Medium | Very High | Extremely High | Very Low | Low | Medium | Extremely High | Extremely Low |
| Medium | Very High | Very High | Low | Low | Medium | Very High | Very Low |
| Medium | Very High | High | Medium | Low | Medium | High | Low |
| Medium | Very High | Medium | Medium | Low | Medium | Medium | Medium |
| Medium | Very High | Low | High | Low | Medium | Low | High |
| Medium | High | Extremely High | Very Low | Low | Low | Extremely High | Extremely Low |
| Medium | High | Very High | Low | Low | Low | Very High | Very Low |
| Medium | High | High | Medium | Low | Low | High | Low |
| Medium | High | Medium | Medium | Low | Low | Medium | Medium |
| Medium | High | Low | High | Low | Low | Low | Medium |
Fuzzy system rules.
4. Performance Evaluation
The performance of the proposed system is evaluated using four performance metrics, namely the packet loss rate, network delay, energy consumption, and the quality of received images. Packet loss rate is measured as a percentage of the lost packets with respect to the transmitted packets. Network delay is measured as the time it takes to transfer a packet from the sender to the receiver. Energy consumption is affected by several operations: data acquisition or image capturing, wireless transmission, which consumes more energy than any other operation, and data processing at the application layer including image resizing and compression before transmission. All these operations are considered when calculating the energy consumption. The image quality is measured by the peak signal-to-noise ratio (PSNR), which is defined as:
A set of experiments representing different network scenarios were conducted, and the effect of using different image resolutions on the performance metrics was studied. In this section, first, the proposed approach of using adaptive resolution is compared with the conventional method of using fixed resolution. Then, a comparison with existing methods is presented.
In the simulation experiments, more than one simulator was used to cope with the various operations performed by the sensor nodes such as image capturing, resizing, compression, and transmission, taking into account the time and energy consumed during each operation. The Castalia/OMNET++ network simulator,20–21 the XEEMU power simulator,22 and the IJG JPEG library23 were used to simulate the required operations. The JPEG library was used to resize and compress the images before transmission and the XEEMU simulator was used to compute the processing delay and power consumption during compression and resizing operations.
In the simulation, three network scenarios differing in the number of source and relay nodes were considered to cover different conditions that the network may face. Accordingly, three experiments were conducted, in which different performance metrics were measured using various image resolutions. The simulation parameters used in the experiments are shown in Table 3.
| Parameter | Value |
|---|---|
| Network area coverage | 200×200 m2 |
| Number of nodes | 50 nodes |
| Packet size | 256 bytes |
| Images transmission intervals | 10–70 sec |
| Communication range | 30 m |
| Routing protocol | GPSR |
| MAC protocol | TMAC |
| Initial energy | 50 J |
| Simulation time | 350 sec |
The simulation parameters.
In the first experiment, five nodes representing 10% of the total nodes were selected as sources and uniformly distributed around one sink node, which is located in the middle of the region of interest. The source nodes capture the images continuously at different time intervals and send them to the sink node through the relay nodes. The experiment was performed first using different fixed resolutions (350×350, 250×250, and 150×150), and then using an adaptive resolution controlled by the proposed cross-layer scheme. In the second and third experiments, 10 nodes and 20 nodes representing 20% and 40% of the total nodes were selected as sources, respectively, aiming at simulating the network with more data and congestion. In each experiment, the effect of increasing the amount of data in the network, by increasing the number of source nodes, was studied.
Fig. 7 through Fig. 10 show the effect of using different image resolutions on the packet loss, network delay, network lifetime, and the quality of received images; respectively, using different scenarios with different number of source nodes: (a) five source nodes, (b) 10 source nodes, and (c) 20 source nodes. As shown, in all three scenarios, sending images with higher resolution (i.e., 250×250 and 350×350) can flood the network with large amount of data, which causes more packet losses and delay due to network congestion, and consumes more energy on transmitting and processing data, and hence reduces the network lifetime. On the other hand, using lower resolution (i.e., 150×150) has less effect on the network performance but it affects the overall quality of the received images. Note that when increasing the number of source nodes, in the second and third scenarios, more data is injected in the network causing more congestion and hence more packet losses, delay, and energy consumption. Moreover, the overall quality of the received images is reduced.
Average packet loss rate using fixed and adaptive resolution for different number of source nodes.
Average network delay using fixed and adaptive resolution for different number of source nodes.
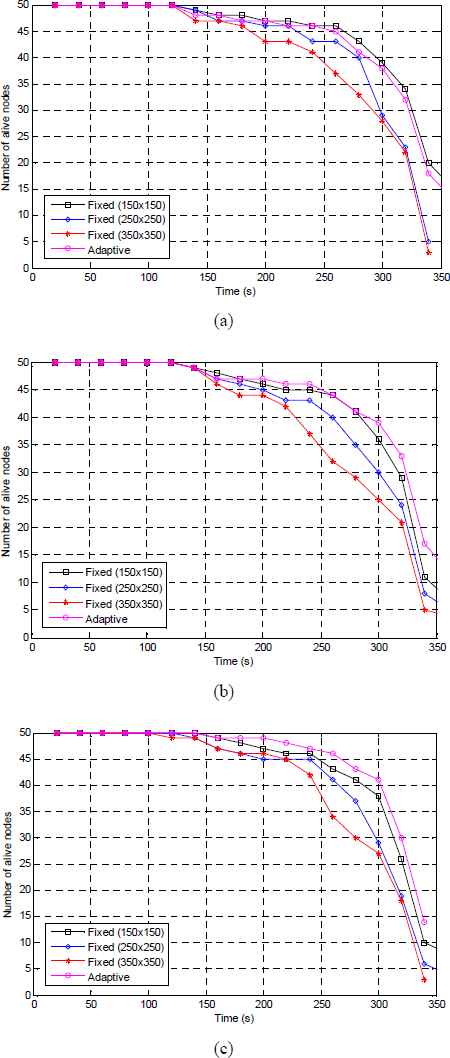
Network lifetime using fixed and adaptive resolution for different scenarios: (a) 10% source nodes, (b) 20% source nodes, and (c) 40% source nodes.
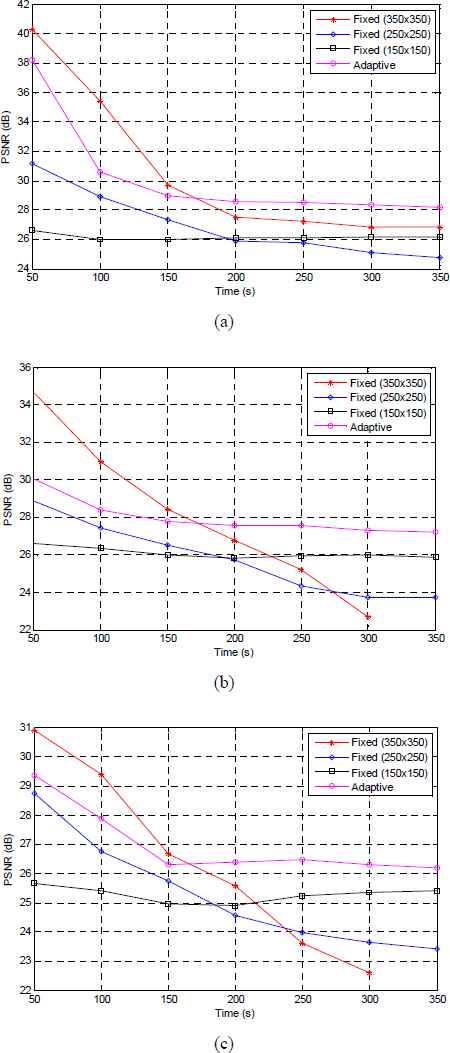
Average PSNR of received images using fixed and adaptive resolution for different scenarios: (a) 10% source nodes, (b) 20% source nodes, and (c) 40% source nodes.
The results in Fig. 7 through Fig. 10 also show the behavior of the proposed scheme. As shown, the proposed approach achieved better results, in all scenarios, in terms of image quality. The reason is that the proposed system controls the amount of data injected in the network according to the network conditions by changing the image resolutions accordingly. Table 4 shows the resolutions of the transmitted images and their percentages in the three network scenarios. In the first scenario, the network was less congested, and according to the selected resolutions in Table 4, the average image resolution was 212×212, while in the second and third scenarios, where the network was more congested, the average resolution was 171×171 and 169×169, respectively. It is noteworthy that 37% of the images in the first scenario were transmitted with resolutions larger than or equal to 240×240, and 34% of the transmitted images in the third scenario had resolutions larger than or equal to 180×180. As a result, the proposed scheme has achieved better performance than the conventional method using fixed high resolution (250×250 and 350×350), and comparable performance to the conventional method using fixed low resolution (150×150), while maintaining the overall quality of the received images.
| Resolution | Percentage | ||
|---|---|---|---|
| 10% source nodes | 20% source nodes | 40% source nodes | |
| 350×350 | 4% | 2% | 2% |
| 330×330 | 4% | 0% | 0% |
| 300×300 | 5% | 0% | 0% |
| 290×290 | 2% | 0% | 0% |
| 280×280 | 2% | 0% | 0% |
| 270×270 | 2% | 0% | 0% |
| 260×260 | 4% | 1% | 0% |
| 250×250 | 5% | 0% | 0% |
| 240×240 | 9% | 0% | 0% |
| 230×230 | 4% | 0% | 1% |
| 220×220 | 4% | 4% | 6% |
| 210×210 | 2% | 0% | 9% |
| 200×200 | 4% | 6% | 3% |
| 190×190 | 4% | 6% | 5% |
| 180×180 | 4% | 4% | 8% |
| 170×170 | 33% | 37% | 4% |
| 160×160 | 2% | 18% | 23% |
| 150×150 | 11% | 5% | 13% |
| 140×140 | 0% | 14% | 10% |
| 130×130 | 0% | 4% | 17% |
| 120×120 | 0% | 0% | 1% |
Resolutions of transmitted images and their percentages for different network scenarios.
In the following, a comparison of the proposed approach with the dynamic resolution control (DRC) scheme in Ref. 17 and the conventional method of using fixed resolution is presented. Using the same network scenarios described earlier, the behavior of the three schemes under different network conditions was compared. A fixed resolution of 200×200 was considered to represent the behavior of the conventional scheme, which is the closest resolution to the average resolutions achieved by the proposed approach as shown in Table 4. In DRC, the source node can choose among three resolutions, specifically, 350×350, 250×250, and 150×150. Initially, the resolution is assumed 350×350 and is decreased by one step based on a threshold value. The source node increases the resolution by one step when another threshold value is reached.
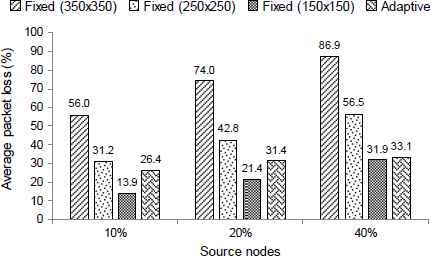
Fig. 11 shows the average packet loss for different number of source nodes using the three schemes. As shown, the proposed approach achieved lower loss rate compared to DRC in all scenarios, and to the conventional method in the second and third scenarios. In the first scenario, the proposed scheme was able to send images with resolution higher than 200×200 (Table 4), which causes a slight increase in the packet loss compared to the conventional scheme.
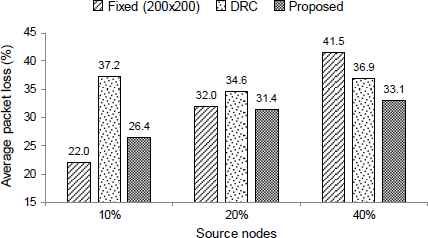
Comparison of packet loss rate for different number of source nodes.
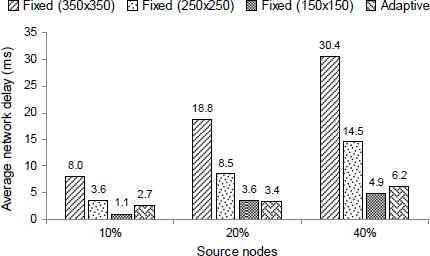
Fig. 12 shows the average network delay for different number of source nodes using the three schemes. As shown, the proposed approach has lower delay compared to the conventional and DRC schemes in the first and second scenarios, while in the third scenario the delay is slightly higher than that of DRC.
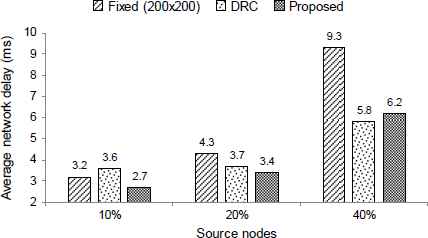
Comparison of network delay for different number of source nodes.
Fig. 13 shows the number of alive nodes as a function of time for different number of nodes. As shown, the proposed approach outperforms the other two schemes in all scenarios. The results demonstrate that the proposed approach was able to exploit the network conditions and send images with suitable resolutions according to the residual energy and conditions of the network.
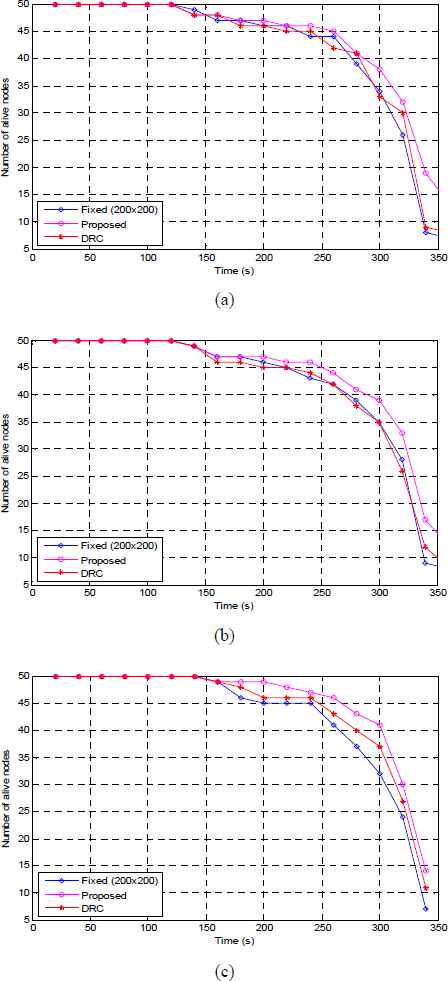
Comparison of network lifetime for different scenarios: (a) 10% source nodes, (b) 20% source nodes, and (c) 40% source nodes.
Fig. 14 shows the average PSNR of the received images for different number of source nodes. As shown, the quality of the received images using the proposed approach is better than that of the conventional and DRC schemes, due to the smooth transition in image resolution according to the network conditions.
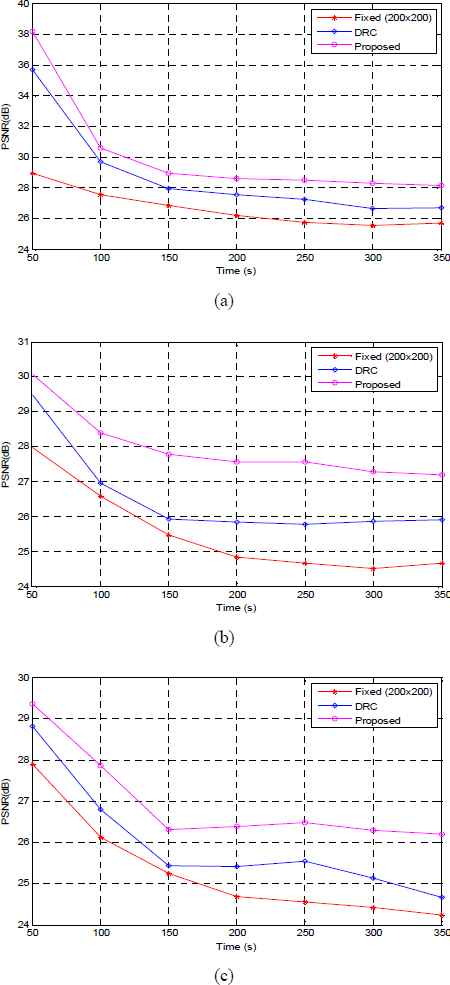
Comparison of received image quality for different scenarios: (a) 10% source nodes, (b) 20% source nodes, and (c) 40% source nodes.
5. Conclusion
In this paper, a fuzzy logic based cross-layer design for image transmission over wireless sensor networks was proposed. The cross-layer design exploits the information exchange between the application, network, and physical layers to provide quality of service guarantees and efficient resources utilization, while maintaining an acceptable level of quality of the received images. The proposed system dynamically changes, through a fuzzy logic controller, the resolution of the images being transmitted in order to control the amount of data injected in the network, according to the underlying network conditions. The performance of the proposed system was evaluated under different network scenarios. The simulation results showed that the proposed cross-layer approach has better performance, compared to other schemes, in terms of energy consumption, packet loss, network delay, and the quality of the received images.
References
Cite this article
TY  - JOUR
AU  - Moad Mowafi
AU  - Omar Banimelhem
AU  - Yosef Taher
PY  - 2018
DA  - 2018/03/27
TI  - Fuzzy Logic Based Cross-Layer Design for Image Transmission in Wireless Sensor Networks
JO  - International Journal of Computational Intelligence Systems
SP  - 882
EP  - 893
VL  - 11
IS  - 1
SN  - 1875-6883
UR  - https://doi.org/10.2991/ijcis.11.1.67
DO  - 10.2991/ijcis.11.1.67
ID  - Mowafi2018
ER  -