
A Cooperative Network Interdiction Model and Its Optimization Solution Algorithm
- DOI
- 10.2991/ijcis.11.1.41How to use a DOI?
- Keywords
- Multi-objective optimization; Evolutionary algorithm; R-Interdiction median problems with fortification; Network interdiction; Network-based systems
- Abstract
Service disruptions due to deliberate sabotage are serious threats to supply systems. To alleviate the loss of accessibility caused by such disruptions, identifying the system vulnerabilities that would be worth strengthening is a critical problem in the field of Critical Infrastructure Protection (CIP). Today’s supply systems tend to be attacked in a cooperative manner. A set of facilities of an infrastructure system would be struck by several attackers cooperatively to create the worst-case disruptions. In this case, the conventional critical infrastructure protection approach based on R-Interdiction Median models with Fortification (RIMF) does not work well because it does not consider the cooperative manner among attackers. To handle the problem, a Bi-objective Probabilistic Interdiction Median Model with Cooperative Attacks (BICA) is proposed in this work. It is formulated as a bi-objective nonlinear optimization model and solved by a modified multi-objective evolutionary algorithm. Experiments verify the high interdiction losses of disruptions caused by cooperative attacks without any protection. Compared with the conventional model, the experimental results show that the BICA model can model the cooperative attacking problem effectively and that its evolutionary-based algorithm can solve the model efficiently.
- Copyright
- © 2018, the Authors. Published by Atlantis Press.
- Open Access
- This is an open access article under the CC BY-NC license (http://creativecommons.org/licences/by-nc/4.0/).
1. Introduction
An infrastructure system refers to delivery or service networks that are essential to the economic and societal well-being of a nation.1 Once critical components (i.e., links or nodes) in the networks produce failures due to external events (e.g., terrorist attacks, sabotages), it will result in severe and debilitating influences on national defense, economic security and psychological well-being.2 The network interdiction (NI) problem concentrates on the influences of components’ removal on network performance. It can be used to assess the potential risks and losses and then identify the system vulnerabilities or critical components.
Critical components refer to the key assets that have damage and can result in the severe degradation of the system’s functioning and performance. In reality, they can be instantiated as bridges, tunnels, power plants, warehouses and emergency stations.3 Based on the network-based system of interest, interdiction scenarios in which elements (nodes or arcs) become disabled will be examined and analyzed. For different requirements, different objectives could be considered in the evaluation of an interdiction pattern, such as the shortest path,4,5 the maximal flow,6,7 and the connectivity between the origins and destinations.8 Thus, we will concentrate on the interdiction patterns that lead to the greatest losses and identify the interdicted components in these patterns as system vulnerabilities to focus on when designing protection plans.
One common assumption in these studies is that all attackers are identical, having the same ability to destroy the targets, and that they take actions individually without any interactions. To the best of our knowledge, no existing network interdiction models have considered a cooperative attack among different types of attackers. Nevertheless, in reality, cooperation among heterogeneous attackers is a common attack technique. Through cooperation, each member can use his or her own strengths, by which more complex but effective attacks can be accomplished, and more serious disruptions can be caused. For example, the salvo method of firing multiple missiles has become an effective countermeasure to survive interceptors.9 Another example is the cooperation of multiple UAVs as a team to enable new operational paradigms to achieve better team performance.10 To increase the success probability of attacking system components, the cooperation among different types of attackers in network interdiction models can achieve better and more practical identification of system vulnerabilities. Due to the uncertainty of the result of an attack, i.e., the probability that a component will be disrupted by the attack can be increased by the attackers’ cooperation, each strike can be formulated as a stochastic event. The large number of possible cooperative techniques increases the complexity of the solutions. As a result, comparing the traditional network interdiction models, the consideration of the attack uncertainty and the modeling of the cooperative effects bring challenges to the models and solutions.
In this paper, we introduce the cooperative techniques of different attackers into network interdiction models and propose a Bi-objective Probabilistic Interdiction Median model with Cooperative Attacks (BICA). In the model, the probability of successfully disrupting a target is determined by both internal factors and external factors. Here, the internal factors refer to the characteristics of each individual attacker that cannot be influenced by other attackers, and the external factors refer to the external conditions that can be influenced by all of the attackers through cooperation. For each attacker, we use the attributes internal probability and cooperative probability to describe its attack power associated with the internal factors and the cooperative engagement capability (CEC) in dealing with the external factors, respectively. The internal factors can refer to the weapons equipped on the UAV attackers, the personal abilities of the human attackers, or the defense of the targets. The evaluation of internal probability should be based on the capability of the weapons or the background of the human attackers. The external factor can represent the weather, the terrain, or the observability of the targets, and the evaluation of the cooperative probability should be based on the resolution of the equipped sensors or the efficiency of information sharing. In general, the model considers a system that is composed of facilities and customers. The facilities provide goods or services to the customers. Assume there are intelligent attackers with the intent to strike the facilities. These attackers are heterogeneous and have their own internal probabilities and cooperation probabilities. The solution to the model is to find the best strategy of cooperative attacks that may cause the greatest losses and then identify the facilities that could be interdicted under this strategy as vulnerabilities.
In a BICA model, the commander who manages the intelligent attackers should create a strategy that considers the tradeoff of both the “benefits” and “costs”.11 A bi-objective model considers the “benefits” and “costs” of the attacking actions at the same time. One objective describes the budget required when the attackers follow a specific strategy, and the other objective determines the severe attacking strategy that produces the greatest expected system loss. To solve the BICA model, we propose a similarity-based mating scheme based on the Multi-Objective Evolution Algorithm,12 which can identify intelligent solutions with moderate computational complexity. The computational experiments show that the proposed model and its solution algorithm can create greater disruptions with more concentrated assignment, compared with the models and solutions that do not consider cooperative attacks.
The remainder of this paper is organized as follows. Section 2 reviews the related works, including both the stochastic and multi-objective network interdiction models. Section 3 provides the description and formulation of the BICA model. Section 4 presents an evolutionary algorithm for the model solution, which is based on a non-dominated sorting genetic algorithm, named NSGA-II. The experimental results are presented and analyzed in Section 5. Finally, the conclusions are provided in Section 6.
2. Related work
A network interdiction (NI) problem can be described as an optimization of a figure-of-merit related to the network by arranging the current attackers. Since the introduction of the first interdiction model,6 network interdiction has become a common theme in the exploration of system vulnerabilities. According to the specific requirement, different objective functions are considered in subsequent works. For example, Refs. 8, 13, and 14 built interdiction models with distinct objectives, i.e., to maximize the shortest path, to minimize the survivability and to maximize (or minimize) the system flow, respectively. Most existing work concentrates on arc interdiction,7,13,14,16 whereas studies discussing node interdictions have also been conducted in the last decade. A comprehensive survey of NI models with different types of formulations and objectives can be found in Refs. 17 and 18.
Ref. 17 innovatively introduced a class of interdiction problems called the R-Interdiction Median problem (RIM) to identify the critical facilities for which failures can result in the largest post-attack weighted distances. Subsequently, the RIM model was applied in multi-level models for the identification of protection strategies or the design of resilient systems against interdiction.19–23 Recent studies tend to focus on the practical use of RIM-based models. For example, Refs. 24 and 25 attempted to apply interdiction models to the protection of a rail intermodal terminal network and road against flooding, respectively. Compared with arcs interdiction models, the interdiction of critical nodes in a network can produce more serious effects. The RIM model discusses the reassignment process after interdiction, which is more practical in common systems such as supply chains with a resilience mechanism. In this paper, the RIM model is used as our baseline model.
Based on the success probability of interdiction, the research of NI can be divided into two series, Deterministic Network Interdiction (DNI) and Stochastic Network Interdiction (SNI). Ref. 7 reviewed earlier DNI models. In this paper, we will review the related literature about SNI. NI with uncertain success dates back to 1999.3,26 For facility systems based on RIM, Ref. 3 considered the uncertainty of the disruption of facilities, and they assumed there is only a single intensity level of disruption in an interdiction scenario. Their work was extended by Ref. 27 with the assumption that the working probability was related to the intensity level of the attacks. The problem is called the Stochastic Interdiction Median problem with disruption Intensity Levels (SIMIL). In our previous work, we modeled the interdiction problem considering both probabilistic attacking and probabilistic protections.28 Additionally, the situations involving both intentional attacks and random disruptions were also examined. Refs. 29 and 30 extended the work of probabilistic protection by relaxing three assumptions, i.e., single-level protection, perfect protection, and binary-state capacity. Additionally, except for the success uncertainty of attacking or protection, other forms of uncertainties have also been discussed. For example, Ref. 31 discussed the uncertain number of attackers, and Ref. 32 attempted to identify critical evacuation facilities involving a stochastic evacuation traffic flow assignment.
Conventional interdiction models only consider a single optimization criterion and cannot manage diverse requirements with multiple competing objectives and multiple alternative solutions. Therefore, some researchers have begun to concurrently contemplate different optimization criteria. For example, Ref. 11 introduced a bi-objective maximum-flow network-interdiction problem, which has two objectives, i.e., minimizing total interdiction cost and minimizing maximum flow. They identified optimal solutions through a sequence of single-objective problems solved using Lagrangian relaxation and a specialized branch-and-bound algorithm. Ref. 33 presented a multi-objective optimization algorithm for the shortest path interdiction when considering two objectives: maximization of shortest-path length and minimization of the interdiction strategy cost. Ref. 34 provided a multi-objective robustness model to balance the distance before failure, the distance after failure and the number of facilities to open. They decomposed the model into three sub-problems that were solved sequentially.
However, there is no existing work fully modeling the impacts of cooperation techniques in network interdiction models. In this work, we propose a bi-objective nonlinear optimization model considering both the cooperative techniques among attackers and the attack uncertainty results. The model and its solution algorithm will be presented in the following sections.
3. BICA Model
3.1. Problem descriptions and assumptions
The BICA model is based on a traditional RIM based model.17 The model considers systems with a certain number of facilities and customers, and each customer has its own quantity of demands for goods or services from its closest facility. It models the behaviors of several attackers who attempt to disrupt facilities in the system. Originally, each customer is served by its closest facility. Once being struck, a facility may become interdicted, losing the ability to provide services. Additionally, we assume that after interdiction, a customer will be reassigned to its next closest available facility if its previous supplier was interdicted. The performance of the whole supply system is measured by the weighted serving distances considering all of the facilities and customers.
In the problem, there are a certain number of heterogeneous attackers who intend to strike the facilities, and each attacker can strike one or no target (i.e., facility). Once a facility is interdicted, it will not be able to provide goods or services for any customer. Each attacker has two types of abilities in an attacking task. One is related to its individual characteristics that will not influence or be influenced by the other attackers. This ability can be interpreted as the “attack power.” The other is its cooperative engagement capability (CEC), which indicates the contribution this attacker can provide while cooperating with other attackers. We use the term internal probability to quantify the former ability and the term cooperation probability to quantify the latter ability. Specifically, we assume each attacker has its own attributes of internal probability and cooperation probability in destroying or interdicting the target facility. As a result, the description of the cooperation effect is shown as follows.
Cooperation Effect. Suppose m attackers cooperatively strike a facility, and let
Thus, the probability of the target being destroyed can be calculated by
If an attacker k is not cooperating with other attackers, then the probability that the attacker k can destroy the target is calculated by
From Eq. (1), we see how the internal probability and cooperation probability influence the success probability that an attacker k will destroy the target. The internal probability
Let us use an example to further illustrate the idea. As shown in Figure 1, there is a supply system with four facilities (F1~F4) and four customers (C1~C4). The detailed information of the system, including the demand quantities of the customers and the distance between each facility-customer pair, are presented in Table 1. Suppose there are two attackers denoted as r1 and r2, and Table 2 shows their internal probability and cooperation probability. Table 3 lists the expected weighted serving distance under each attack strategy. ObjC and ObjNC denote the distances with and without considering cooperation, respectively. Assume that both r1 and r2 attack F1. In the context of cooperation, the success probabilities of r1 and r2 are 1 and 0.2, respectively. Therefore, the failure probability of F1 is 1×0.8+0×0.2+1×0.2=1, and the value of ObjC is 1×3+ 1×1+1×1+1×1=6. On the other hand, if cooperation is not considered, r1 and r2 cannot deal with the environmental factors together. In this case, the failure probability of F1 is 0.2×0.8+0.8×0.2+0.2×0.2=0.36, and the value of ObjNC is 1×(3×0.36+1×0.64)+1×1+1×1+ 1×1=4.72. In considering cooperation or not, distinct interdiction strategies should be adopted for optimizing objective values. Without considering the impacts of cooperation, the attackers tend to focus on different targets to cause the greatest expected losses. However, if cooperation is considered, attacking the same facility may achieve more benefits, and the system losses can be more severe. Therefore, considering cooperation manners, the traditional interdiction models are not effective. Specific strategies should be designed to identify the system vulnerabilities and evaluate the potential losses.
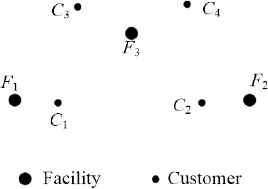
The topology of a supply system
| demand | distance | |||
|---|---|---|---|---|
| F1 | F2 | F3 | ||
| C1 | 1 | 1 | 5 | 3 |
| C2 | 1 | 5 | 1 | 3 |
| C3 | 1 | 2 | 6 | 1 |
| C4 | 1 | 6 | 2 | 1 |
Details of the supply system
| r1 | r2 | |
|---|---|---|
| internal probability | 1 | 0.2 |
| cooperation probability | 0.2 | 1 |
Information on each attacker
| r1 | r2 | ObjC | ObjNC | r1 | r2 | ObjC | ObjNC | r1 | r2 | ObjC | ObjNC |
|---|---|---|---|---|---|---|---|---|---|---|---|
| F1 | F1 | 6 | 4.72 | F1 | F2 | 4.8 | 4.8 | F1 | F3 | 5.04 | 5.04 |
| F2 | F1 | 4.8 | 4.8 | F2 | F2 | 6 | 4.72 | F2 | F3 | 5.04 | 5.04 |
| F3 | F1 | 5.04 | 5.04 | F3 | F2 | 5.04 | 5.04 | F3 | F3 | 6 | 4.72 |
All the possible results of attacks
The objective of the BICA model is to identify the most disruptive attacking strategy, i.e., identify the critical components that are vulnerable to potential threats. The interdiction of the components can cause the worst-case loss. The loss is measured by the expected weighted distance considering all the serving lines.
3.2. The formulation of a BICA model
According to above analysis, the formulation of a BICA model is presented in detail as follows.
Parameters:
the number of facilities in the system before interdiction the number of attackers the number of customers existing in the system the demand of the customers the distance between customeri and facilityj the internal probability of the kth attacker the cooperation probability of the kth attacker the penalty adjustment factor of the customers served by the dummy facility the cost of the action of the kth attacker the set of attackers to be appointed to strike facilities
Decision Variables:
if the kth attacker is assigned to facility j, xkj=1; otherwise, xkj=0
We use the set X to denote the set of all decision variables. Additionally, in the formulation of BICA, there are several auxiliary variables for which values will be fixed by the constraints.
Auxiliary Variables:
the probability that facility j becomes interdicted the probability that facility j becomes interdicted only considering the action of attacker k. That is to say, it denotes the probability that an attacker k destroys facility j if attacker k is assigned to facility j.
Then, the bi-objective nonlinear formulation of the BICA is shown as follows:
Formulas (3)–(9) construct the bi-objective nonlinear BICA model. The two optimization objectives are given by (3) and (4), for which the expressions are (5) and (6), respectively. The first objective function f1(X) expresses the cost of conducting the attack strategy X, whereas the second objective function f2(X) represents the benefit achieved by conducting the attack strategy X, i.e., the expected weighted serving distance after interdiction. In the second objective function, the probability of facility j being interdicted, denoted by βj, is calculated by (7), where ρkj represents the success probability that attacker k strikes facility j. As described before, ρkj is calculated by (8), which involves the internal probability of an attacker k, i.e.,
Based on the above optimization programming model, a decision solution X1 is determined to dominate another solution X2 if one of the two following conditions is satisfied.
1) f1 (X1) ≤ f1 (X2) and f2 (X1) > f2 (X2) or 2) f1 (X1) < f1 (X2) and f2 (X1) ≥ f2 (X2).
If both conditions are violated, solution X1 does not dominate X2, and X2 is said to be non-dominated by X1. The solutions that are non-dominated within the solution space are called Pareto optimal, and the set of all of the Pareto optima is called the Pareto-optimal set PFtrue.35 Because of the limitation of computational resources, it is impractical to enumerate the solution space to obtain PFtrue for large-scale instances. Therefore, in the next section, we utilize a multi-objective evolutionary algorithm to obtain the Pareto set PFknown as the approximation of PFtrue.
4. The solution algorithm
Most approaches developed for multi-objective programming models can be broadly classified into enumerative approaches and multi-objective evolutionary algorithms (MOEAs). Although exhaustive enumeration can guarantee the identification of the Pareto-optimal set, it is time-consuming when the solution space is large. Comparatively, MOEAs can not only manage non-linear constraints and multiple objectives,33 but they can also efficiently obtain quasi-solutions of combinational optimization problems for which the solution space is large.36 Accordingly, since the first MOEA,37 increasingly efficient and effective algorithms have been developed. In this paper, we propose a similarity-based mating scheme-based evolutionary algorithm to solve the BICA model. The algorithm is designed based on a non-dominated sorting genetic algorithm, named NSGA-II.12,38
The solution process can be presented as follows.
- Step 1.
(Input) Let popsize, pm, pc, and gene denote the population, the mutation rate, the crossover rate, and the number of generations, respectively. Initialize the counter, i.e., set counter =1.
- Step 2.
(Initialization) Randomly generate the individuals in the original population, y1, y2,...,ypopsize.
- Step 3.
(Evaluation) Calculate the values of the multiple objectives at each individual, and let
- Step 4.
(Evolution) Execute an evolution process that consists of tournament selection, crossover, and mutation to generate a child population.
- Step 5.
(Combine and Fill) Combine the original population and child population into a whole, and recalculate the individuals’ ranks and crowding distances. Then, set counter = counter+1.
- Step 6.
Execute the main loop until counter reaches the value of gene.
In the process, each individual or chromosome yi is encoded by the form
In the Evolution step, the binary tournament selection operator38 is performed. Two candidates are selected randomly from the current population competition according to ranks and crowding distances. Two rounds of candidate selection are required to fill a population, and in each round, individuals cannot be selected repeatedly. Additionally, a crossover operator with the similarity-based mating scheme is used in the algorithm. One of the two parents is the most extreme solution, which is selected from the set denoted by Pe. Then, the most similar solution to the first parent is selected from the set denoted by Ps as another parent. Third, mutation occurs at a certain probability, changing one of the codes in the chromosome.
5. Computational experiments
In this section, we conduct a series of experiments to explore the effectiveness and efficiency of the evolutionary algorithm. Additionally, the influences caused by the cooperative attacks on the model are empirically studied. In Section 5.1, we introduce the experimental setup, and the results are presented and analyzed in Sections 5.2 and 5.3.
5.1. Experimental setup
The experiments in this paper were processed on a PC with an Intel 2.4 GHz processor and 4 GB of RAM. The code is programmed in C#. In the experiments, two categories of parameters need to be configured. The first category is the parameters related to the model including the data sets, such as the number of facilities p, the number of attackers m, the penalty factor θ, the internal probability and the cooperation probability of each attacker k (i.e.,
Our experiments are conducted on two data sets, which are widely used in the interdiction literature:
Swain.39 Fifty-five population centers in Washington. D.C.
London Ontario.40 Locations of 150 gasoline stations and fire stations in London (Ontario), and the distances are based upon a road network.
The settings of the parameters are listed as follows.
p: 5~15 for Swain and 5~30 for London.
m: 8~10.
θ: 10 times the maximum distance between the facilities and customers.
vk: without loss of generality, we set the value of all attackers to be 1, i.e.,
αk1, αk2: to ensure the diversity of attackers, we set
To explore the cooperation among the heterogeneous attackers, we defined four types of attackers (see Table 4) whose individual success probability are the same. That is to say, for each type of attacker,
| type | 1 | 2 | 3 | 5 |
|---|---|---|---|---|
| internal | 0.4 | 0.5 | 0.8 | 1 |
| cooperation | 1 | 8 | 0.5 | 0.4 |
Four types of attackers
For a non-cooperative situation, this problem is the same as the MRPIM problem (27Losada et al., 2012) for which the results can be directly obtained by CPLEX 12.2.
There are six parameters for the solution algorithm, i.e., pm, pc, opsize, gene, |Pe| and |Ps|. Without sacrificing generalizability, we set pm = 0.99, pc = 0.99, popsize = 1000, gene = 200, and |Pe| =5, |Ps| =5.
5.2. Performance analysis
To date, different performance metrics have been proposed to evaluate the Pareto sets from different aspects, e.g., the closeness, diversity and convergence of solutions.41 Usually, high degrees of closeness and diversity are desired as well as good convergence. In this paper, we adopt three metrics, which are the Hyperarea Ratio (HR, see Ref. 42), Generational Distance (GD, see Ref. 42), and Inverted Generational Distance (IGD, see Ref. 43). HR measures the closeness and diversity of a Pareto set. GD and IGD measure the convergence and diversity, respectively. Because the final solutions are discrete, and the two objective values are not uniform, we conclude that the closest solution in the Pareto-optimal set to a solution in the Pareto set is the one with the same first objective value. The gap between the second objective values can serve as the corresponding minimum Euclidean distance. For IGD, if such a solution cannot be found in the Pareto set, the Euclidean distance is set as positive infinity. According to distinctive implications of the three metrics, if the HR value is close to 1, the Pareto set has a high degree of closeness and diversity. If GD and IGD have a small value, the Pareto set has a good convergence.
We run the solution algorithm 50 times for each instance and then examine the performance metrics. In terms of the 50 outcomes of each metric (i.e., HR, GD and IGD), we compute the mean and the variance, which are shown in Table 5. The mean time is the mean value of the total execution time.
| data set | p | m | enumeration time(s) | performance | ||||||
|---|---|---|---|---|---|---|---|---|---|---|
| mean time(s) | HR | GD | IGD | |||||||
| mean | variance | mean | variance | mean | variance | |||||
| Swain | 5 | 8 | 31.191 | 44.3315 | 1 | 0 | 0 | 0 | 0 | 0 |
| 5 | 9 | 187.271 | 43.6763 | 1 | 0 | 0 | 0 | 0 | 0 | |
| 5 | 10 | 1202.814 | 44.0098 | 0.99989 | 0.00029 | 0.80571 | 2.11137 | 0.83927 | 2.17768 | |
| 6 | 8 | 147.181 | 46.9492 | 1 | 0 | 0 | 0 | 0 | 0 | |
| 6 | 9 | 1108.352 | 43.4929 | 1 | 0 | 0.03578 | 0.06031 | 0.14549 | 0.31951 | |
| 6 | 10 | 8022.058 | 47.6871 | 1 | 0 | 0 | 0 | 0 | 0 | |
| 7 | 8 | 573.109 | 51.4808 | 1 | 0 | 0 | 0 | 0 | 0 | |
| 7 | 9 | 4482.172 | 45.4536 | 1 | 0 | 0.01145 | 0.02604 | 0.00809 | 0.02275 | |
| 7 | 10 | 33923.17 | 51.4371 | 0.99997 | 0.00011 | 0.06251 | 0.24867 | 0.06349 | 0.24902 | |
| 8 | 8 | 742.713 | 54.9091 | 1 | 0 | 0 | 0 | 0 | 0 | |
| 8 | 9 | 12385.87 | 53.5150 | 0.99998 | 8.5616E-05 | 0.03908 | 0.16269 | 0.03908 | 0.16269 | |
| 8 | 10 | 64905.66 | 46.6050 | 0.99998 | 0.00010 | 0.03716 | 0.23548 | 0.03716 | 0.23548 | |
| London | 5 | 8 | 80.350 | 73.7660 | 1 | 0 | 0 | 0 | 0 | 0 |
| 5 | 9 | 556.452 | 72.7254 | 0.99996 | 0.000153559 | 15.63982 | 61.81118 | 15.63982 | 61.81117 | |
| 5 | 10 | 4535.722 | 72.8395 | 0.99983 | 0.000325334 | 97.68436 | 180.69078 | 106.06250 | 197.15513 | |
| 6 | 8 | 448.986 | 80.9766 | 1 | 0 | 0 | 0 | 0 | 0 | |
| 6 | 9 | 3915.782 | 72.3730 | 1 | 1.5103E-05 | 0.82060 | 4.0201025 | 0.82060 | 4.02010 | |
| 6 | 10 | 26136.46 | 78.9455 | 0.99937 | 0.00081 | 169.88703 | 216.61021 | 173.07795 | 219.37812 | |
| 7 | 8 | 1751.402 | 85.7358 | 1 | 0 | 0 | 0 | 0 | 0 | |
| 7 | 9 | 13921.30 | 77.4360 | 0.99996 | 2.9620E-05 | 7.05049 | 5.36480 | 7.29178 | 6.21147 | |
| 7 | 10 | 93424.19 | 84.5503 | 0.99946 | 0.00071 | 89.23399 | 126.40800 | 110.31025 | 143.06806 | |
| 8 | 8 | 2038.269 | 94.3406 | 1 | 0 | 0 | 0 | 0 | 0 | |
| 8 | 9 | 24279.43 | 82.6280 | 1 | 0 | 0.02416 | 0.04832 | 0.02918 | 0.05836 | |
| 8 | 10 | 228499.8 | 84.4277 | 1 | 4.4729E-05 | 1.40494 | 7.78721 | 1.40494 | 7.78721 | |
The performance of the algorithm.
From the results, we can observe that for large-scale instances, which take a great amount of time to enumerate and then examine the candidates one by one, the algorithm can solve them within 100 seconds. Additionally, the mean value and variance of HR shows that the algorithm can obtain a quasi-optimal solution set. The performance of the set is adequate with large mean values and small variances of HR. There are only limited instances for London that have both large means and variances of GD and IGD. This may be caused by one poor solution in the Pareto set.
5.3. Results with or without considering cooperation
We consider the cooperative and non-cooperative situations with different types (refer to Section 5.1) and quantities (m = 8, 9, 10) of attackers for Swain and London. The comparative results for the Swain data set and the London data set are shown in Figure 2 and Figure 3, respectively. In each subfigure, the lines with different marks indicate the trends of expected weighted distances with an increase in attackers. The red points indicate a cooperative situation, and the black squares indicate a non-cooperative situation.From the figures, we observed that the operation costs after cooperative attacks are significantly greater than those after non-cooperative attacks. The gaps between them are increased with the increasing number of the participating attackers. This indicates that the severity of cooperative attacks grows if more attackers take action.
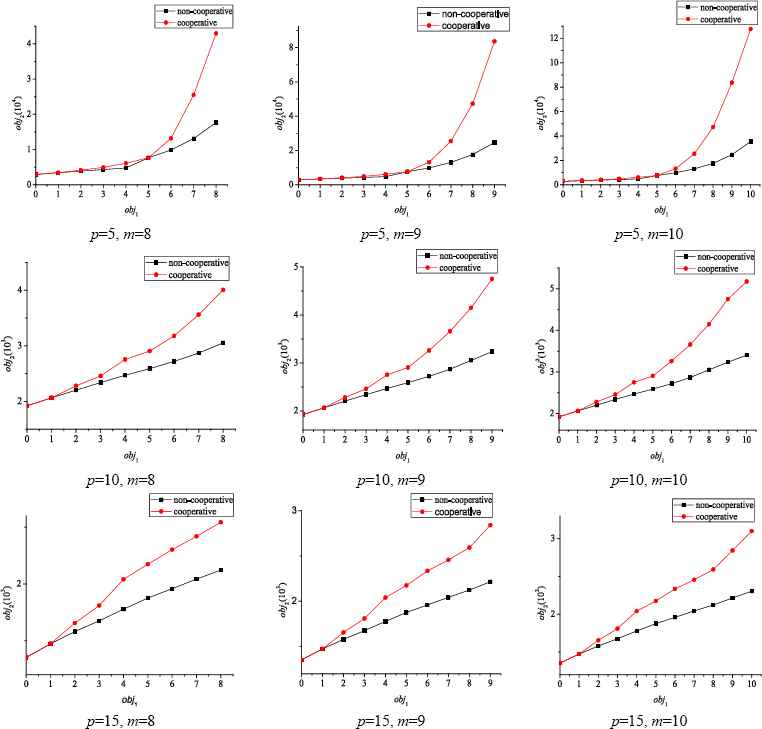
The influence of cooperation for Swain.
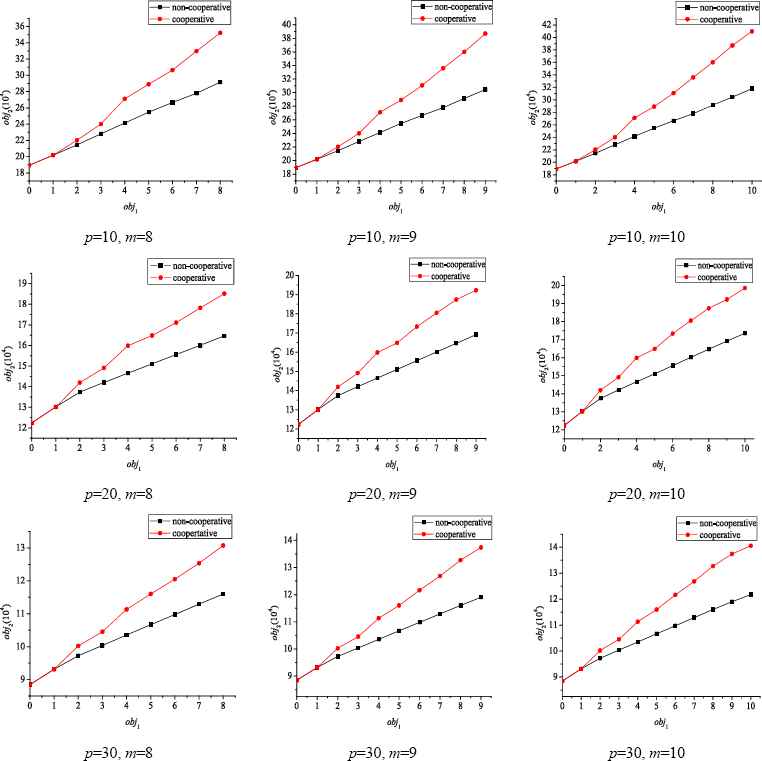
The influence of cooperation for London.
We further compare the trends of the two lines. The growth of the operation costs after non-cooperative attacks is slight if one more attacker is involved. However, the operation cost after cooperative attacks grows rapidly if multiple attackers are involved in the strike upon the same facility. For example, for the setting p = 5 and m = 10 in Figure 2, the second objective value changes from 9 to 10. It is obvious that the increase in operation costs (i.e., the first objective value) under cooperative attacks is much larger than those under non-cooperative attacks. The cooperative attacks result in more severe interdictions than non-cooperative ones.
To further examine the influence of cooperation on attacking strategies (i.e., the assignment of the available attackers), we suppose that there are 10 attackers. Figure 4 shows the number of the attackers assigned to each facility under cooperative and non-cooperative attacks. In each subfigure, the horizontal axis represents the facility index, and the vertical axis represents the number of attackers assigned to the corresponding facility. From Figure 4, we find that attackers tend to be gathered to some facilities in cooperative attacks compared with non-cooperative attacks. For example, in the subfigure where p = 15 for Swain, the 10 attackers are assigned to 5 facilities in the cooperative situation, whereas these attackers are assigned to 7 facilities in the non-cooperative version. In other words, more single attacks appear in non-cooperative attacks. This phenomenon indicates that compared with non-cooperative attacks, some facilities are more vulnerable under cooperative attacks, which is more helpful in identifying critical facilities. Furthermore, in terms of the cooperative situations in Figure 4, we show the detailed assignments of attackers in Table 6 considering different values of p for Swain or London. The combinations of attackers striking each facility are on a regular basis. The attackers with a smaller internal probability and larger cooperation probability likely collaborate with those with larger internal probability and smaller cooperation probability. For example, attackers 1 and 7 take actions cooperatively in Swain. The internal probability of attacker 1 is 0.4, and the cooperative probability is 1, whereas attacker 7 has the internal probability of 1 and the cooperative probability of 0.4. If there exists a single attack (e.g., for London), the task is usually performed by attackers in which both the internal probability and the cooperative probability are not small, such as attacker 2 or 10.
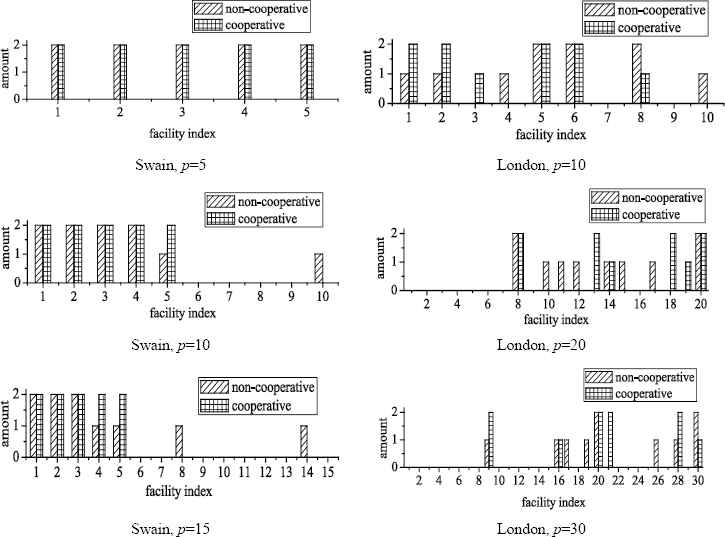
The influence of cooperation on attacking strategies (i.e., the assignment of the available attackers)
| data set | p | facility index | attacker index | p | facility index | attacker index | p | facility index | attacker index |
|---|---|---|---|---|---|---|---|---|---|
| Swain | 5 | 1 | 4, 9 | 10 | 1 | 4, 9 | 15 | 1 | 5, 8 |
| 2 | 5, 8 | 2 | 5, 8 | 2 | 4, 9 | ||||
| 3 | 1, 7 | 3 | 3, 10 | 3 | 3, 10 | ||||
| 4 | 2, 6 | 4 | 1, 7 | 4 | 1, 7 | ||||
| 5 | 3, 10 | 5 | 2, 6 | 5 | 2, 6 | ||||
| London | 10 | 1 | 6, 7 | 20 | 8 | 1, 8 | 30 | 9 | 4, 5 |
| 2 | 3, 9 | 13 | 3, 9 | 16 | 10 | ||||
| 3 | 10 | 14 | 2 | 20 | 1, 8 | ||||
| 5 | 4, 5 | 18 | 4, 5 | 21 | 6, 7 | ||||
| 6 | 1, 8 | 19 | 10 | 28 | 3, 9, | ||||
| 8 | 2 | 20 | 6, 7 | 30 | 2 | ||||
Combination of the assignment of attackers in cooperative situations.
6. Conclusions
In this work, we study the impacts of attackers’ cooperation on the network interdiction, and the new network interdiction problem is described as a bi-objective probabilistic interdiction median problem with cooperative attacks. It is formulated as a bi-objective nonlinear model and solved by the modified multi-objective evolutionary algorithm based on NSGA-II. The results of the computational experiments show that the model and the solution algorithm can solve the problem effectively. Based on the experiments, we can observe that cooperative attacks bring greater interdiction effects with more concentrated assignment, compared with non-cooperative attacks. In addition, the combinations of the assignment of attackers are similar.
References
Cite this article
TY  - JOUR
AU  - Min He
AU  - Guang-Xun Du
AU  - Xiaoyi Zhang
AU  - Zheng Zheng
PY  - 2018
DA  - 2018/02/19
TI  - A Cooperative Network Interdiction Model and Its Optimization Solution Algorithm
JO  - International Journal of Computational Intelligence Systems
SP  - 560
EP  - 572
VL  - 11
IS  - 1
SN  - 1875-6883
UR  - https://doi.org/10.2991/ijcis.11.1.41
DO  - 10.2991/ijcis.11.1.41
ID  - He2018
ER  -