
Energy-Efficient Acoustic Violence Detector for Smart Cities
- DOI
- 10.2991/ijcis.10.1.89How to use a DOI?
- Keywords
- Violence Detection; Audio Processing; Feature Selection; Computational Cost
- Abstract
Violence detection represents an important issue to take into account in the design of intelligent algorithms for smart environments. This paper proposes an energy-efficient system capable of acoustically detecting violence. In our solution, genetic algorithms are used to select the best subset of features with a constrained computational cost. Results demonstrate the viability of the system, thanks to the low cost that some violence features require, making feasible the implementation of the proposed method in a nowadays low power microprocessor.
- Copyright
- © 2017, the Authors. Published by Atlantis Press.
- Open Access
- This is an open access article under the CC BY-NC license (http://creativecommons.org/licences/by-nc/4.0/).
1. Introduction
Violence continues being a latent conflict in actual society. Recent researches show that 35% of women around the world have suffered physical or sexual violence during their lives1 and 43% of women from the European Union declared suffering psychological violence at least once.2 This fact makes violence detection and prevention to represent an important issue to take into account in the design of intelligent algorithms for smart environments. In this sense, violence can be detected through audio and video surveillance. Some works in the literature treat this problem using both audio and video processing,3,4,5 and the results obtained with the combination of those sources seems to be efficient.
Main disadvantages of video can be found in terms of computational cost, intrusiveness and poor coverages. Some authors have evaluated computational cost using core hours as metric.6 Furthermore, audio and video have been tested both in separate and together ways in the literature.7 Their conclusions show that the system works properly using just audio source. When video information is added the performance improves slightly, but computational cost increases in a big way. Besides, an audio-based system is economic in terms of €/m2.
In the literature we can find other proposals where audio is used to detect violence by itself,8 since violent situations are commonly accompanied by signs like arguments, shouts or an increase in the volume of the conversation. However, most of the studies up to now have been done with pretended violence from films or games, which are not applicable to real violence situations.9
In order to implement real-time audio surveillance systems in wide areas, the need of energy-efficient processing nodes arises. An energy-efficient real-time system has the restriction of consumption when it is implemented in some place where it is working in an autonomous way. In this scenario, the computational cost, related to the clock frequency of the processing units, is an important factor to take into account, and the control of the computational cost of the violence detection system is mandatory.
Bearing this in mind, this paper proposes a real-time implementation of an energy-efficient system capable of detecting a violent situation in smart environments. Since the system has to work in an autonomous way, computational cost is strictly constrained, and there is a need to find a reduced set of features. In this sense, genetic algorithms are proposed to solve the constrained feature selection process, allowing a good tradeoff between performance and computational cost.
This paper is structured as follows. First, Section 2 introduces the implemented classification system, describing the feature extraction (Subsection 2.1), the computational cost evaluation (Subsection 2.2) and the feature selection process using genetic algorithms (Subsection 2.3). Then, Section 3 describes the results, including the description of the database, the validation method employed and the discussion of the results. To sum up, Section 4 presents the conclusions.
2. The Acoustic Surveillance System
The proposed system has the objective of studying solutions for audio-based violence detection in real environments and in real time, where the system has to take a decision every T seconds. The steps of the proposed acoustic surveillance system, shown in Figure 1, are being explained in detail in the following sections.
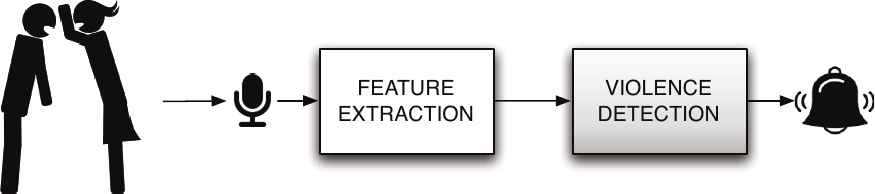
Proposed system.
2.1. Feature extraction
There are several audio features that could exhibit a good discrimination capability for the problem at hand.8,10 This section includes a brief description of the most interesting features for violence detection.
Most of the features tend to analyze some time statistics over the evaluation of a measurement along the time to get useful information from the audio. So, in order to evaluate/extract the features, the audio segments of T seconds are divided into M frames of L samples with an overlap of S%. By default, the statistics applied to these measurements are typically the mean and the Standard Deviation (SD), although for some particular measurements more specific statistics are used.
All measurements can either be taken in the time domain or in the frequency domain. For notation purposes, let us assume xim is the i-th audio sample of the m-th time frame (i = 1,…,L and m = 1,…,M), and Xkm is the k-th frequency component for the m-th time frame of the Short-Time Fourier Transform (STFT), evaluated applying a windowed Discrete Fourier Transform (DFT) to the m-th time frame.
The features considered in this paper are:
- •
The Mel-Frecuency Cepstral Coefficients (MFCCs), which are a set of perceptual parameters commonly used in speech recognition,10 calculated from the spectrum. They provide a compact representation of the spectral envelope. Perceptual analysis emulates human ear non-linear frequency response by creating a set of filters on non-linearly spaced frequency bands.11
In the case of violence detection and considering a sampling frequency of 22,050 Hz, N = 25 cepstral coefficients are calculated,12 so that there will be 25 different MFCCs per frame, denoted MFCCnm, n = 1,…,25.
- •
The Delta Mel-Frequency Cepstral Coefficients (ΔMFCCs), calculated as the time difference of standard MFCCs in two different time frames,10 so that ΔMFCCnm = MFCC(n+1)m − MFCC(n−1)m.
- •
The Pitch, related to the fundamental frequency, determines the tone of the speech. It can be used to distinguish a person from another.11 In this paper we estimate the pitch for every frame, evaluating the main peaks of the autocorrelation of the error of a linear predictor with P = 10 coefficients.10
- •
The Harmonic Noise Rate (HNR) quantifies the purity of the speech in every frame. It measures the relationship between the harmonic energy produced by the vocal cords versus non-harmonic energy present in the signal.10
- •
The Ratio of Unvoiced time Frames (RUF), is related to the presence or absence of clear or strong speech in the analyzed audio. It is obtained dividing the number of time frames with detected pitch by the total number of frames.12
- •
The Short Time Energy (STE) is the energy of the short speech segment,
- •
The Energy Entropy (EE) expresses abrupt changes in the energy level of the audio signal. It is useful for detecting violence due to rapid changes occurring in the tone of voice.8 To evaluate this measurement, each time frame of L samples is divided into B blocks, and the energy of each block is then measured. So, EE for the m-th time frame can be evaluated using
- •
The Zero Crossing Rate (ZCR) is one of the most widely used time-domain audio features.8 It is determined by dividing the number of sign changes by the total length of the frame, so that
- •
The Spectral Rolloff (SR) is calculated in the frequency domain and is defined as the frequency kc(m) below which c% of the magnitude distribution of STFT coefficients are concentrated for the m-th frame, so that
- •
The Spectral Centroid (SC) is defined as the center of gravity of the magnitude spectrum of the STFT,14 so that
- •
The Spectral Flux (SF) represents the spectral change between successive frames,8 and is determined using
2.2. Computational Cost Evaluation
A energy-efficient real time system has the restriction of consumption when it is implemented in some place where it is working in an autonomous way, for instance working with a solar powered source. In this scenario, computational cost is an important aspect to consider if we want to control the consumption the node has.
In order to calculate the computational cost of our system, the number of flops that each feature requires has been calculated determining the number of Floating Point Operations Per Second (FLOPS).15 The number of flops is related to the power consumption. To put this in perspective, if the system has to work autonomously and is powered by a small solar cell of 1 dm2 which spends 1 W/dm2, and having a minimum average of 2.5 hours of sun per day (a typical value in several winter in regions such as Spain), the average total power will be 100 mW. Low power processors, such as the ARM-Cortex-M4, typically consumes around 0.2 mW/MHz which, assuming a relationship of 1 FLOP per Hertz, gives us an idea of the amount of FLOPS that are going to be available for this kind of devices.16
The number of FLOPS of our system depends on the set of selected features, so it must take into account which ones are used for a specific design. To evaluate the impact of each feature in the selection process, we have carried out a detailed analysis of the computational cost in terms of FLOPS required to implement an energy-efficient violence detection system.
Thus, the cost of each feature has been evaluated and we propose the above equations with the objective of generalize the cost in function of some parameters explained below. As was stated above, the feature extraction process splits the audio frame of Nsamples (so that T = Nsamples/fs, being fs the sampling frequency) into M frames of L samples, with an overlap between them of S%, so that:
Some features such as pitch-based or MFCCs have more impact in cost than others due to the amount of flops needed. Furthermore, some features share some processing blocks that do not need to be replicated for different features. Considering the measurements described in the last section, we have identified four processing blocks that are shared along more than one measurement:
- •
The evaluation of the STFT is shared by the MFCCs, ΔMFCCs, the SR, the SC and the SF. Equation (2) represents the cost of the STFT matrix CS, in terms of operations per decision, in function of the main design parameters.
- •
The evaluation of the MFCCs is shared by both the MFCCs and the ΔMFCCs. Apart from the evaluation of the STFT, these features require some shared operations. The cost CM associated to these operations is expressed using equation (3) in function of N, the number of MFCCs computed.
- •
The evaluation of the pitch is also shared by the HNR and the RUF. Its cost CP can be determined using the next equation:
where P is the number of Levinson Coefficients. - •
At last, the evaluation of the energy is shared by the STE and the EE (which requires it to normalize the energy of each block), and its cost CE can be determined using equation (5)
We will use four binary variables bS, bM, bP and bE related to CS, CM, CP and CE (the number of operations associated to the described shared processing blocks) to determine whether the selected set of features does require the evaluation of one of the aforementioned blocks, respectively. The total number of operations can be expressed using equation (6):
To sum up, there are some features which are linked and depend on others, so that the computation of one allows to compute the others with practically the same cost. Because of that, we have been grouped measurements into 8 groups. These groups are: G1 (including MFCCs and ΔMFCCs), G2 (including Pitch, HNR, and RUF), G3 (STE), G4 (EE), G5 (ZCR), G6 (SR), G7 (SC) and G8 (SF). STE and EE have been evaluated separately because the cost of the EE is not insignificant respect to the one of the STE. Table 1 describes the groups, the number of features of each measurement, the values bS, bM, bP and bE and the additional cost Cf associated to each measurement, in function of the main design parameters of each feature.
| Group | Caract | No. feats | bS | bM | bP | bE | Additional cost (No. operations) |
|---|---|---|---|---|---|---|---|
| G1 | MFCCs | 50 | 1 | 1 | 0 | 0 | C1 = 0 |
| ΔMFCCs | 50 | 1 | 1 | 0 | 0 | C2 = N(M − 2) + 1 | |
| G2 | Pitch | 2 | 0 | 0 | 1 | 0 | C3 = 0 |
| HNR | 2 | 0 | 0 | 1 | 0 | C4 = 9M | |
| RUF | 1 | 0 | 0 | 1 | 0 | C5 = M | |
| G3 | STE | 2 | 0 | 0 | 0 | 1 | C6 = 0 |
| G4 | EE | 4 | 0 | 0 | 0 | 1 | C7 = M (⌊2L/B⌋ + 3B − 5) + 6B + 3 |
| G5 | ZCR | 3 | 0 | 0 | 0 | 0 | C8 = (6M + 1)(L − 1) |
| G6 | SR | 3 | 1 | 0 | 0 | 0 | C9 = M(5N + 8) + 2⌊M(L · S − 1)/3⌋ |
| G7 | SC | 2 | 1 | 0 | 0 | 0 | C10 = M (8N + L · S + 6) + L · S + 4 |
| G8 | SF | 2 | 1 | 0 | 0 | 0 | C11 = M (9N + 5) − 3N + 1 |
Dependence between grouped features.
2.3. Constrained selection of features
As was stated above, to control the computational cost of the violence detection system, there is a need to find a reduced set of patterns that allows a good performance with an energy-efficient implementation. For this purpose, genetic algorithms have been used in the paper.
Genetic algorithms are based on the principles of genetic and natural selection, allowing to obtain the best results for solving a problem.17 This method consists of exchanging randomly the features of the individuals of a population that constitute the possible solutions for the problem. In this way, the algorithm is able to resolve optimization problems.18 Specifically, our problem is to determinate which features are the best to be applied to violence detection without resulting in a high cost. For that reason, a cost constraint is applied when the features are selected. There are 121 features in total, but each individual only selects a subset of them in a way that total cost is below the fixed threshold. The adaptive function has the aim of maximize the probability of detection associated to a probability of false alarm for a given detection system. In this point, two different classifiers will be applied: The Least Squares Linear Detector and the simplified version of Least Squares Quadratic Detector. They are explained in detail in the literature.12
According to the previous parameter, the individuals will be ranked and only the best individuals survive and reproduce. The population is composed of 100 individuals, 10 of them will be chosen as parents, and they will generate the remaining 90 sons by crossover. After this, mutation changes a 4 percent of the genes. This process is repeated along 30 generations and the whole process is repeated 10 times to avoid local minima.
3. Results
In order to validate the proposed system, a set of experiments has been carried out using a database of audio files. These audio files have been divided in segments of T = 5 seconds length with a sampling frequency of fs = 22,050 Hz. Each frame is divided in windows of L = 512 length and S = 50% overlap between windows, resulting in a total of M = 430 frames per segment. Then feature extraction has been applied to obtain useful information from data. With the aim of selecting a reduced set of features, a genetic algorithm is used.
This algorithm has been applied using a constraint related to the cost available in the system. Specifically, different cost thresholds measured in “Maximum number of Mega Floating Operations Per Second” (MaxMFLOPS) have been applied (1, 3, 5, 10 and 15 MaxMFLOPS). This means that the sum of costs of the selected features has to be below this values. Once the best features have been selected, a specifically trained classifier aims at giving the final decision. Figure 2 shows a block diagram describing the process carried out in the experiments.
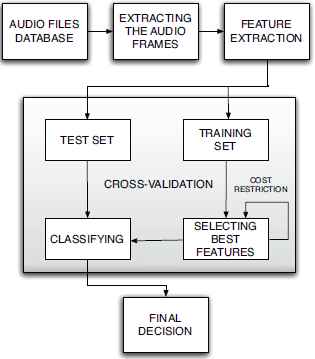
Block diagram of the experiments.
In general, the databases used in the state-of-the-art were not suitable for our problem, so we have used a novel database developed in a previous work.12 The main characteristics of the used database are shown in Table 2.
| Parameters | Value |
|---|---|
| Total duration | 27,802 s |
| Violent duration | 3,051 s |
| Percentage of violence | 10.97% |
| Number of audios | 109 |
| Minimum audio length | 15 s |
| Maximum audio length | 4,966 s |
Summary of the database.
Related to the implemented validation, a tailored version of k-fold cross-validation has been used in the experiments to avoid loss of generalization of the results. The data is divided in k subsets, so that each subset is used for testing and the remaining k − 1 are used for training. In our case, 109 folds with different size have been used, each fold containing data from a different audio file. In that way, we ensure that data from the same acoustic environment is not used both for training and testing at the same time, guaranteeing the generalization of the results.
As it was stated above, two genetic algorithms based feature selection strategies have been considered: the case of maximizing the probability of detection with a linear and with a quadratic detector. In each case, the same detector has been applied to classify. The probability of false alarm considered in the optimization process has been 10%. Figure 3 shows a comparative between the costs (measured in Mega-FLOPS) required by the eight groups of features. The cost necessary to calculate the Short Time Fourier Transform (STFT) is depicted in solid colour, while the additional cost of each feature group is painted with striped bars. For instance, if the STFT has been calculated because of the group G1 (MFCCs and ΔMFCCs), this cost can be saved in groups G6, G7 and G8 (spectral features). In the same way, in group G4 (EE) energy does not have to be calculated if group G3 (STE) is computed.
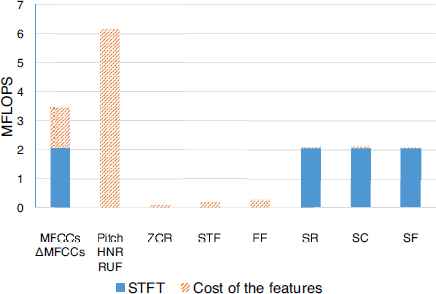
Cost of the different feature groups.
In view of the results, we can appreciate that group G2 (pitch, HNR and RUF) is the most computationally expensive group, overcoming 6 millions of FLOPS. Group G1 is also too expensive, but it will provide 100 features to the experiments, aside from the calculation of the STFT, used by other groups.
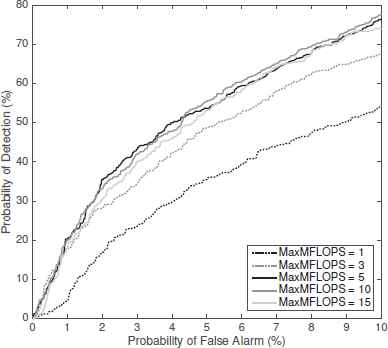
Now we will evaluate the effect of the limits in the computational cost available. Figure 4 shows the probability of detection obtained for low probabilities of false alarm (under 10%) and using the linear detector, evaluated for the different cost thresholds. The same is shown in Figure 5 using the quadratic detector.
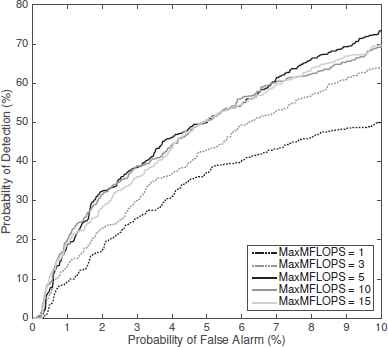
Probability of Detection for Linear Detector.
Probability of Detection for Quadratic Detector.
The behavior is similar in both cases. With low thresholds (1 MaxMFLOPS) the probabilities of detection obtained are poor (around 50-55% for 10% of false alarm). As we increase this threshold the results are considerably improved, reaching around 75-80% of detection with 5 MaxMFLOPS cost. However, this improvement does not continue for higher costs, so it makes no sense to spend more resources in this problem.
In order to demonstrate the high accuracy of the proposed system in terms of probability of detection, we are going to make a comparison between our method and the one proposed by J. Salamon.19. Applying that algorithm the results are around 65% of probability of detection for a probability of false alarm of 10%, which does not improve the ones obtained with the algorithm proposed in this experiment.
Now we will study which groups of features are more selected and useful. Table 3 displays the average cost employed, the probability of detection for a probability of false alarm of 10% and the percentages of appearance (selection rates) of the groups. It has been considered as appearance the selection of one or more features from the group.
| MaxMFLOPS | 1 MFLOPS | 3 MFLOPS | 5 MFLOPS | 10 MFLOPS | 15 MFLOPS | ||||||
| Classifier | Lin. | Qua. | Lin. | Qua. | Lin. | Qua. | Lin. | Qua. | Lin. | Qua. | |
| Average Cost (MFLOPS) | 0.4 | 0.4 | 2.6 | 2.6 | 3.9 | 3.7 | 9.8 | 8.3 | 10.0 | 8.8 | |
| Pd (Pfa = 10%) (%) | 50% | 54% | 64% | 67% | 74% | 76% | 69% | 78% | 70% | 74% | |
| Selection rate (%) | G1 (MFCC+ΔMFCC) | 0% | 0% | 0% | 0% | 100% | 100% | 100% | 100% | 100% | 100% |
| G2 (Pitch+HNR+RUF) | 0% | 0% | 0% | 0% | 0% | 0% | 99% | 76% | 100% | 82% | |
| G3 (STE) | 93% | 0% | 19% | 0% | 63% | 0% | 80% | 0% | 63% | 0% | |
| G4 (EE) | 100% | 100% | 100% | 100% | 97% | 92% | 73% | 89% | 95% | 96% | |
| G5 (ZCR) | 100% | 100% | 100% | 100% | 80% | 31% | 25% | 12% | 80% | 35% | |
| G6 (SR) | 0% | 0% | 100% | 100% | 98% | 98% | 93% | 98% | 97% | 99% | |
| G7 (SC) | 0% | 0% | 100% | 9% | 82% | 77% | 99% | 78% | 97% | 86% | |
| G8 (SF) | 0% | 0% | 6% | 98% | 49% | 57% | 41% | 63% | 41% | 70% | |
Cost, probability of detection and probability of appearance of the features groups.
At the beginning, the algorithm selects groups G3, G4 and G5 in practically 100% of the cases because of the low threshold imposed (1 MaxMFLOPS). When we increase this value to 3 MaxMFLOPS the spectral features appear. Furthermore, the MFCCs are selected with 5 or more MaxMFLOPS, and the pitch with 10 MaxMFLOPS. The case of 15 MaxMFLOPS allows the algorithm to select whatever it needs, because the sum of the total cost is lower than this value.
As it can be seen, there are some features that work better in the quadratic detector than in the linear one. Such is the case of group G8 (SF), where the difference between the appearance in both classifiers is always considerable. The opposite happens in groups G3 and G5. In fact, the appearance of group G3 in quadratic detector is always 0%.
Additionally, the importance of some features is reflected in the table. For instance, when group G1 -MFCCs and ΔMFCCs- appears (from 5 MaxMFLOPS onwards) its appearance is 100% in linear and quadratic detectors, while the appearance of the features that were selected previously is significantly reduced, like in groups G4 and G5. Because of that, MFCCs is an excellent group. The same does not happens to other expensive groups, such as group G2, which does not improve the results when it is selected (10-15 MaxMFLOPS).
4. Conclusion
The objective of this work is to develop a system capable of detect violent scenes in real time and in real situations. With this purpose, we have carried out different experiments related to audio analysis. The algorithms have been developed in order to maximize the probability of detection for low probabilities of false alarm, but subject to computational cost constraints.
The results derived from the experiments show that MFCCs are the best features for violence detection, both for linear and quadratic classifiers. Other features such as energy only show a good performance in linear classifiers and their cost is quite low compared to the rest.
Regarding to the classifiers, the results obtained are better in quadratic case (3-9% of difference respect to the linear one) for all cases with different cost thresholds. Higher cost implies better results, but a compromise of 5 MaxMFLOPS could be reached, since the results does not seem to be improved much from this value.
The cost (€/m2) of this audio-based system is relatively low. For instance, if we consider a typical range of 20 m2 per node and each node (e.g., Raspberry Pi) has a price around 100 €, the deployment costs would be around 5 €/m2.
To sum up, the experimental results show that it is viable to implement a real time system capable of detecting violence in an autonomous way. That is possible thanks to the low cost that some violence features need to be computed, which can be supported by nowadays low power microprocessors.
Acknowledgments
This work has been funded by the Spanish Ministry of Economy and Competitiveness (under project TEC2015-67387-C4-4-R, funds Spain/FEDER) and by the University of Alcalá (under project CCG2016/EXP-033).
References
Cite this article
TY  - JOUR
AU  - Marta Bautista-Durán
AU  - Joaquín García-Gómez
AU  - Roberto Gil-Pita
AU  - Inma Mohíno-Herranz
AU  - Manuel Rosa-Zurera
PY  - 2017
DA  - 2017/06/15
TI  - Energy-Efficient Acoustic Violence Detector for Smart Cities
JO  - International Journal of Computational Intelligence Systems
SP  - 1298
EP  - 1305
VL  - 10
IS  - 1
SN  - 1875-6883
UR  - https://doi.org/10.2991/ijcis.10.1.89
DO  - 10.2991/ijcis.10.1.89
ID  - Bautista-Durán2017
ER  -