
Layout of Urban Distribution Center Using Possibilistic Programming
- DOI
- 10.1080/18756891.2016.1256559How to use a DOI?
- Keywords
- City Logistics; Fruits and Vegetables Hall; Warehouse Design; Possibilictic Linear Programming; Linear Programming
- Abstract
Distribution centers, link supply chain to the customers. Layout of the distribution centers is very important in terms of product conservation at the required service level and delivering of products with minimum cost to the customer from distribution centers. Therefore, the layout design of distribution centers should be handled with a smart decision system. In this study, the layout design of a fruits and vegetable hall, which is a kind of urban distribution center, is investigated for two different scenarios: (1) assignments of the brokers to the stores and (2) assignments of the products to the stores. The study suggests the most suitable allocation models for the inner layout of distribution center. In the first phase, the requirements of the mathematical model to develop the decision making system for the layouts of distribution center that will be determined. In the second phase, allocation models will be developed and solved for fruits and vegetables halls in Istanbul.
- Copyright
- © 2016. the authors. Co-published by Atlantis Press and Taylor & Francis
- Open Access
- This is an open access article under the CC BY-NC license (http://creativecommons.org/licences/by-nc/4.0/).
1. Introduction
Survival of corporations, in the global market, is related with providing of dynamic market demands with the minimal cost and on time by effective supply chain management. Providing of market demands with the minimums cost and within the on time are important for the corporations. And also, they hopes increase their profitability and efficiency. Increasing competition forces the companies to create more effective supply chains basing on management and engineering.1
A typical supply chain consists of multiple agents, such as suppliers, production facilities, warehouses, distribution centers and points of sales. Especially distribution center is one of the most important rings in terms of providing on time delivery, minimum cost and expected service quality. Besides, the layout of the distribution centers is very important for storage of the goods and distribution to the customers with a high service quality.
Distribution centers occupy an important position in the supply chain; such centers store products, and retrieve products from storage to fulfill customer orders. Warehousing is the essence of the businesses for companies such as wholesale distributors. Since warehousing activities are intensive, even small improvements can achieve significant savings. One costly way of increasing the warehousing productivity is through novel distribution center design. It is also possible to increase the productivity by less radical methods including changing the warehousing activities, such as receiving, order picking and shipping.2
In the past decade, researches show us there has been increasing attention to provide better services with minimum cost using distribution center (DC). Researches on examining the DC in the literature are explained below.
Chen et al.2 studied on the problem of constructing order batches for distribution centers using a data mining technique. Xing et al.3 studied on the location adjustment model of the store area in distribution center. Avittathur et al.4 developed a model for determining DCs’ locations considering the impact of the central sales tax. Yang et al.5 investigated the logistics distribution centers location problem under fuzzy environment from another point of view, in which setup cost, turnover cost and demand of each customer are supposed to be fuzzy variables.
Distribution centers have a vital importance among the supply chain network and their layouts come into prominence for transporting the goods to customers with minimum total cost and time. While constructing a distribution center facility, sophisticated plans should be consider to assure comprehensive and long term strategies. Tanyas6 explains issues for the layou t planning of the distribution center as follows:
- •
Handling, storage, packaging and other logistic activities that includes value added services should be considered in the layout planning.
- •
Usage time of vehicles from receiving to delivery should be minimized in distribution centers.
- •
The products should be delivered to customers with minimum transportation and handling operations.
- •
The products should be located according to the their characteristics
- •
Investment costs like building, plumbing, equipment, etc. should be minimized.
- •
Labor, energy, and operating costs etc. should be minimized.
- •
Support services such as safety, cleaning, auxiliary materials, accommodation etc. should be provided at lowest cost.
- •
The layout should be flexible considering expansion possibilities.6
Distribution center layout, which is a specific type of facility design problem, is constituted by assigning products or brokers to predetermined locations efficiently. However, this assignment problem includes many external affects, especially in distribution centers located in cities, which are named as urban distribution centers. For instance, irregular layout affects the urban traffic directly with truck and pickup queues at the neighborhood of urban distribution center. A typical example of urban distribution centers is Fruits and Vegetable Wholesale Market Hall (F&VM).
The layout of a F&VM is related with sponsors and founders of the hall, retailers, wholesalers, truck drivers and pickup drivers. Truck and pickup drivers want to decrease the total duration between entrance and leaving span in the F&VM and retailers want to see more exhibits of the wholesalers in a short time. Since the most of the products are perishable and delicate in F&VMs, their handling operations should be minimized to not damage them. Besides, the environmental effects on the products should be considered throughout the process. Local governments, sponsors and founders of the hall are interested in the low investment cost which includes building, materials and equipment to be used, while fulfilling the requirements of the users. The operating and supporting costs should also be minimized while providing a contemporary working environment. Although the expanding opportunities of a hall are mostly related with the location selection decisions and neighborhood of it, layout also should be designed considering these future necessities.
In addition to the above-mentioned stakeholders who are directly affected from the layout of F&VM, city residents can be affected badly due to the high-density traffic, visual pollution, environmental pollution etc. A F&VM layout with inadequate designed parking areas, storage areas, cold storage warehouses, supporting facilities, loading/unloading platforms and docks causes truck and pickup queues in front of the hall docks or environmental pollution due to the rotten products and wastes. As a result, objectives and constraints mentioned above should be considered in the design phase of a hall. Determining the relative locations and the sizes of warehouses and the exhibition areas is very important. Relations of the products, which can be affected from each other, should be considered while calculating the indoor and outdoor requirements. Also by using statistical data, retailers, who are the customers of the F&VMs, may be classified to the groups with respect to the product group that they intended to buy. Thus, a cellular layout can be designed by providing the aim of short walking time for the retailers in the hall. 7
In this study, we established a decision support system for layout decision of an urban distribution center. The methodology used for F&VM is developed for allocation of products and brokers to the warehouses and exhibition areas.
2. Possibilistic Linear Programming
In this study, we use Possibilistic Linear Programming (PLP) methodology to solve the proposed mathematical models. Some example studies in the literature related the PLP are explained below.
Assadipour and Razmi8 investigated the problem of inventory lot-sizing and supplier selection for an assembly system where the supplier available capacities are assumed as ambiguous dynamic parameters. In study a particle swarm optimization was used to achieve the overall satisfactory compromise solution.
Vahdani et al9 focused on a logistics network which includes multi-suppliers, collection centers, transfer stations, treatment stations, and products. They proposed a multi-objective mathematical programming model that minimizes the total costs including the fixed costs for opening facilities and transportation costs between facilities; minimizes the distance between each waste-generating facilities and transfer stations; maximizes the distance between treatment and disposal stations and customer zones; and maximizes the sum of the reliability of coverage for the potential facilities which will be open by combining fuzzy possibilistic programming, stochastic programming, and fuzzy multi-objective programming.
Bouzembrak et al10 developed develop a possibilistic linear programming model for supply chain network design with imprecise inputs: market demands, supplied quantities, transportation costs, opening costs, treatment and storage costs are modelled as fuzzy numbers.
Ozgen and Gulsun11 studıed on a two-phase possibilistic linear programming approach and a fuzzy analytical hierarchical process approach. They combined those approaches to optimize two objective functions (‘‘minimum cost’’ and ‘‘maximum qualitative factors benefit’’) in a four-stage (suppliers, plants, distribution centers, customers) supply chain network in the presence of vagueness.
Niakan and Rahami 12 studied on a new multi-objective mathematical model to address a Healthcare Inventory Routing Problem for medicinal drug distribution to healthcare facilities. They applied a hybridized possibilistic method to cope with uncertainty. And an interactive fuzzy approach was considered to solve an auxiliary crisp multi-objective model and find optimized solutions
Tofighi et al13 studied on a two-echelon humanitarian logistics network design problem involving multi-plecentral warehouses and local distribution centers. They developed a novel two-stage scenario-based possibilistic-stochastic programming approach.
Dai et al14 developed an interval-fuzzy possibilistic programming (IFPP) method by integrating interval parameter programming (IPP), fuzzy possibilistic programming (FPP), and a fuzzy expected value equation within a general optimization framework.
An ambiguous datum is represented by a possibility distribution πij in PLP. A possibility distribution πij is defined by a fuzzy set with Aij representing a linguistic expression such as “about aij” as πij = µAij, where µAij is a membership function of Aij. A variable αij. restricted by a possibility distribution πij., is called a possibilistic variable. Zadeh15 studied on the generalized constraints related with the uncertainty situations as possibilistic, probabilistic, and heuristic constraints. In the possibilistic programming approach, a vague aspiration is represented by a fuzzy goal Gi. A possibilistic linear programming (PLP) problem with imprecise fuzzy coefficients can be stated as
The imprecise objective function with a triangular possibility distribution can be written as
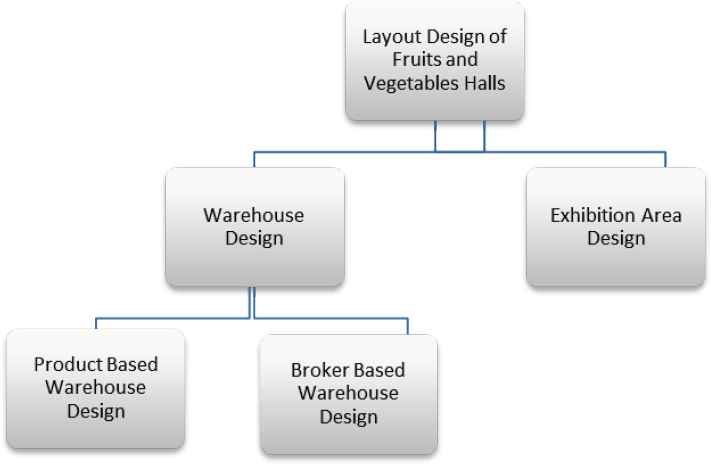
3. Layout Design Model of Warehouse And Exhibition Area in F&VM
The objective of this study is to minimize the summation of (1) vehicle loading-unloading time, (2) transportation time of the products from dock to the warehouse locations, and (3) customer’s walking time in the exhibition area of the F&VM. The mathematical model constituted to obtain a decision making system while designing a layout of F&VM. Two different layouts of distribution centers are investigated and two mathematical models are proposed for the “distribution center layout with an exhibition area and a single warehouse”.
The layout of urban distribution center is an important factor on navigation of the customers and movements of the products. These movements include unloading of the products from larger vehicle, loading them to the customers’ vehicle, and delivering them to the end user as soon as possible. Therefore, the layout design of a F&VM is more important than the architectural and esthetical aspects. While designing hall layout alternatives, integrated logistics activities should be taken into account such as, transportation, warehousing, packing, and value added services etc.7
Before this study, Tanyas et al.7 applied “Distribution center layout with an exhibition area and a single warehouse” for the Tuzla-Aydınlı F&VM in Istanbul, Turkey using Fuzzy Axiomatic Design, which is a multi-criteria decision-making technique. It was determined that the uncertainty of some data should be used in the creation of appropriate decision support systems.
As a result of discussions with experts, the minimization of the total navigation time of customers, long vehicles and trucks in the hall are main performance criteria for the layout of F&VM. The accepted structure of the layout consists of two separate parts: the exhibition areas where small part of fruits and vegetables are exhibited and the warehouse building where the all remaining products are stored. Each long vehicle parks at the specific area reserved for them near the warehouses, and products are transferred to warehouses by forklifts. On the other hand, customers walk around the exhibition areas for buying fruits and vegetables and then load products to their vehicles by forklifts. Customers park their small vehicles to parking areas reserved for them.
Considering these situations, we proposed two alternative warehouse layouts: (1) product based warehouse design and (2) broker based warehouse design. Since the customers’ total walking time in exhibition area and the handling operations in the warehouse do not affect each other, we figured out the problems as two separate models. As a result, three models are applied for three problem separately: (1) exhibition area design problem, (2) product based warehouse design and (3) broker based warehouse design.
The used data related with the amount of products delivering to each brokers, distances between points of loading-unloading areas and reserved warehouse, and distances between starting point and exhibition areas are given as fuzzy (∼) parameters. Therefore, to represent this fuzziness in the solution process, problems are modeled with Possibilistic Linear Programming (PLP) methodology. Notations used in the models are given below.
The alternative layout design for distribution center
- i:
set of brokers i = 1,2, … ,I
- j:
set of product types j = 1,2, … ,J
- k:
set of reserved warehouse areas k = 1,2, … , K
- l:
set of exhibition areas l = 1,2, … ,L
- xijk:
The amount of product j assigned to reserved warehouse area k for broker i (kg)
- xil:
1 if broker i is assigned to exhibiton area l, 0 otherwise
- yik:
1 if broker i is assigned to reserved warehouse area k, 0 otherwise
- yjk:
1 if product j is assigned to reserved warehouse area k
Number of customers who walk around broker i
The distance from the starting point to the exhibition area l(m)
The distance from the unloading point of products to reserved warehouse area k(m)
The distance from reserved warehouse area k to the product loading point(m)
The amount of product j comes to broker i(kg)
- fcj:
The capacity of forklift which is used to transfer the product j from unloading point of products (kg/forklift)
- fsj:
The speed of forklift which is used to m move product
- ws:
Average human walking speed (m/minute)
- CPk:
Maximum capacity of warehouse k(m3)
- vj:
The volume of one unit of the product j(m3)

Distribution center layout with an exhibition area and a single warehouse
3.1. Exhibition area design (A1)
Mathematical model for designing the layout of the exhibition area, which is used for the appointment of brokers (tenants) and customers, is presented below. The entry points to exhibition area and the counts of customers walking around are given as fuzzified parameters in the model.
cip and dlp are the most pessimistic values and have very low probability of belonging to the set of available values.
cim and dlm are the most possible values and definitely belong to the set of available values. cio and dlo are the most optimistic values and have a very low probability of belonging to the set of available values. Figure presents these triangular possibility distributions.

Triangular possibility distributions for
The possibilistic objective functions that contain coefficients with triangular possibility distributions can be minimized by pushing
Lai and Hwang 17 approach, it is better to minimize zm, maximize zm - zo, mininize zp - zm together. According to, Lai and Hwang’s(1992) approach, it is better to minimize zm, maximize zm - zo, mininize zp -zm concurently.
The imprecise objective function, where
3.2. Warehouse Design
3.1.1. Broker Based Warehouse Design (A21)
Broker based warehouse design includes assignment process of each broker to determined warehouse areas. Exhibiton area is placed aside of the warehouse seperately, as well as product based warehouse design. The loading and unloading points, where vehicles are parked, are given in fuzzified form for the considered period.
3.1.2. Product Based Warehouse Design (A22)
Product based warehouse design includes assignment process of products which are grouped according to the rule of same type to the same warehouse area. Exhibition area is placed in another location from warehouse area again as well as product based warehouse design. The loading and unloading points, where vehicles are parked, are given as fuzzified parameters for considered period:
4. Case Study
The models which are developed for distribution centers are used for F&VMs. All the LP and PLP models are solved by using GAMS program and the results are compared. Each model is solved for small data and large (real world) data. The used data for first step is shown follows: number of brokers are 5, capacity of each warehouse is 595 m3.
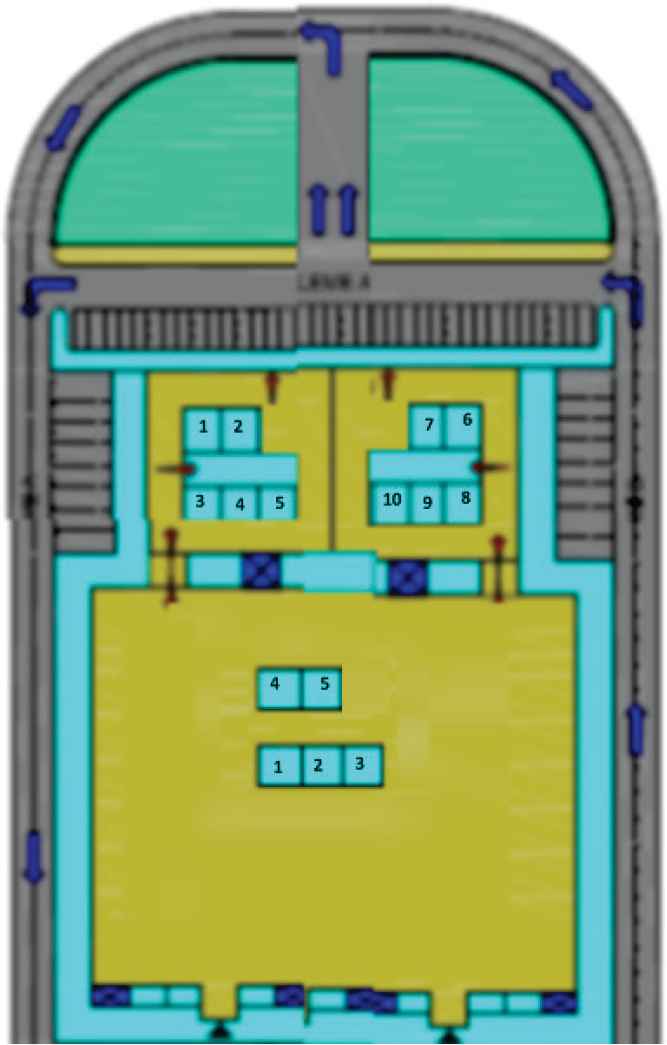
Distribution center project plan with exhibition area and single warehouse.
The amount of products delivering brokers are shown in Table 1.
| Brokers/Product Type | j1 | j2 | j3 | j4 |
|---|---|---|---|---|
| i1 | 2682 | 4839 | 858 | 705 |
| i2 | 2313 | 3942 | 523 | 704 |
| i3 | 1509 | 4077 | 229 | 694 |
| i4 | 1211 | 4418 | 671 | 512 |
| i5 | 1263 | 5210 | 366 | 487 |
Amount of Products Delivering Brokers
Each product has different volume. In Table 2, volume of products is shown:
| j1 | j2 | j3 | j4 |
|---|---|---|---|
| 0,002 | 0,002 | 0,001 | 0,002 |
Volume that is occupied of products
The number of customer that comes to each brokers are different. The numbers of customers are shown in Table 3.
| i1 | i2 | i3 | i4 | i5 |
|---|---|---|---|---|
| 43 | 32 | 41 | 32 | 39 |
Number of customer that comes to brokers
4.1. Linear programming model
In first step, the linear programming models are solved for exhibition area and two different layouts of warehouse using data. The assignment of brokers to exhibition areas and the assignment amounts of products for each broker can be found as follows in Table 4:
| Broker/ Exhibition Area | l1 | l2 | l3 | l4 | l5 |
|---|---|---|---|---|---|
| i1 | 1 | ||||
| i2 | 1 | ||||
| i3 | 1 | ||||
| i4 | 1 | ||||
| i5 | 1 |
Assignment of exhibition areas
In Table 5, assignment of the brokers and amount of the products to the warehouse areas are shown for the broker based warehouse design.
| Broker | Product Type/ Warehouse | k1 | k2 | k4 | k6 | k7 |
|---|---|---|---|---|---|---|
| i1 | j1 | 268 | ||||
| i1 | j2 | 483 | ||||
| i1 | j3 | 858 | ||||
| i1 | j4 | 705 | ||||
| i2 | j1 | 231 | ||||
| i2 | j2 | 394 | ||||
| i2 | j3 | 523 | ||||
| i2 | j4 | 704 | ||||
| i3 | j1 | 150 | ||||
| i3 | j2 | 407 | ||||
| i3 | j3 | 229 | ||||
| i3 | j4 | 694 | ||||
| i4 | j1 | 121 | ||||
| i4 | j2 | 441 | ||||
| i4 | j3 | 671 | ||||
| i4 | j4 | 512 | ||||
| i5 | j1 | 126 | ||||
| i5 | j2 | 521 | ||||
| i5 | j3 | 366 | ||||
| i5 | j4 | 487 |
A21 Broker based warehouse design
In Table 6, the assignment of brokers and the amount of products to the warehouse areas are shown for the product based warehouse design.
| Broker | ProductType/ Warehouse | k1 | k2 | k6 | k7 |
|---|---|---|---|---|---|
| i1 | j1 | 2682 | |||
| i1 | j2 | 4839 | |||
| i1 | j3 | 858 | |||
| i1 | j4 | 705 | |||
| i2 | j1 | 2313 | |||
| i2 | j2 | 3942 | |||
| i2 | j3 | 523 | |||
| i2 | j4 | 704 | |||
| i3 | j1 | 1509 | |||
| i3 | j2 | 4077 | |||
| i3 | j3 | 229 | |||
| i3 | j4 | 694 | |||
| i4 | j1 | 1211 | |||
| i4 | j2 | 4418 | |||
| i4 | j3 | 671 | |||
| i4 | j4 | 512 | |||
| i5 | j1 | 1263 | |||
| i5 | j2 | 5210 | |||
| i5 | j3 | 366 | |||
| i5 | j4 | 487 |
A22 Product based warehouse design
As a result of the calculating, minimum duration of rounding of large and small vehicles in hall are given as follows in Table 7:
| Minutes | |
|---|---|
| Exhibition Area | 161,63 |
| Broker Based | 179,17 |
| Product Based | 173,94 |
Total time for each layout
In second step, the problem is solved using real world data for 220 brokers and 260 warehouses. The total navigation time for the exhibition areas and the total loading and unloading times of products for the broker based and product based warehouse design are shown as follows in Table 8:
| Minutes | |
|---|---|
| Exhibition Area | 23968,09 |
| Broker Based | 20026,27 |
| Product Based | 14715,40 |
Total time for each layout using real world data
After comparing of the results, the most appropriate layout is determined as Product Based Warehouse Design for both small and large (real world) data.
4.2. Possibilistic Linear Programming Model
It is decided that the loading and unloading points of products, counts of customers and routing of customers in exhibition area are fuzzy. Therefore PLP is used for solving the problem.
Table 9 includes fuzzy data of the products which comes to the brokers. In this study, LP model is remodeled as a single goal using Zimmermann’s 18 fuzzy programming method. When the model is converted, in first phase, PIS and NIS of objective functions is calculated and then the linear membership function of these functions can be computed.
| mo | Broker/Product Type | j1 | j2 | j3 | j4 |
|---|---|---|---|---|---|
| i1 | 18 | 1406 | 11 | 85 | |
| i2 | 286 | 1477 | 11 | 99 | |
| i3 | 384 | 1078 | 7 | 256 | |
| i4 | 103 | 794 | 8 | 29 | |
| i5 | 327 | 1647 | 8 | 124 | |
|
|
|||||
| mm | j1 | j2 | j3 | j4 | |
|
|
|||||
| i1 | 2682 | 4839 | 858 | 705 | |
| i2 | 2313 | 3942 | 523 | 704 | |
| i3 | 1509 | 4077 | 229 | 694 | |
| i4 | 1211 | 4418 | 671 | 512 | |
| i5 | 1263 | 5210 | 366 | 487 | |
|
|
|||||
| mp | j1 | j2 | j3 | j4 | |
|
|
|||||
| i1 | 5501 | 8930 | 2318 | 792 | |
| i2 | 7869 | 5365 | 2218 | 947 | |
| i3 | 7243 | 7592 | 4152 | 969 | |
| i4 | 7666 | 5646 | 3300 | 903 | |
| i5 | 7831 | 7222 | 2709 | 754 | |
Amount of products which comes to brokers
Table 10 includes the distances from parking points to the warehouses for the large and small vehicle used for loading of products.
| Distances/Warehouses | k1 | k2 | k3 | k4 | k5 | k6 | k7 | k8 | k9 | k10 |
|---|---|---|---|---|---|---|---|---|---|---|
| dbo | 12,5 | 22,5 | 12,5 | 22,5 | 32,5 | 12,5 | 22,5 | 12,5 | 22,5 | 32,5 |
| dbm | 15 | 25 | 20 | 30 | 40 | 15 | 25 | 20 | 30 | 40 |
| dbp | 23,5 | 33,5 | 23,5 | 33,5 | 43,5 | 23,5 | 33,5 | 23,5 | 33,5 | 43,5 |
Parking points of large and small vehicle for loading of product
Table 11 includes the distances from parking points to the warehouses for the large and small vehicle used for unloading of products.
| Distances /Warehouses | k1 | k2 | k3 | k4 | k5 | k6 | k7 | k8 | k9 | k10 |
|---|---|---|---|---|---|---|---|---|---|---|
| dyo | 59,5 | 49,5 | 69,5 | 59,5 | 49,5 | 59,5 | 49,5 | 69,5 | 59,5 | 49,5 |
| dym | 69 | 59 | 79 | 69 | 59 | 69 | 59 | 79 | 69 | 59 |
| dyp | 100 | 90 | 110 | 100 | 90 | 100 | 90 | 110 | 100 | 90 |
Parking points of large and small vehicle for unloading of product
- •
- •
- •
Solve the multi-objective crisp objective functions with the crisp constraints.
- •
Calculate PIS and NIS using GAMS progrramming.
- •
Calculate the membership functions of the auxiliary objective functions.
- •
Construct the single-objective model with the aid of the membership functions and calculate the optimum satisfaction degree λ.
At first, PIS and NIS values are computed for each layout using small data. The results of PIS and NIS values of A1 is shown at Table 12.
| PIS | NIS | |
|---|---|---|
| z1 | 169,71 | 161,63 |
| z2 | 13,57 | 18,77 |
| z3 | 129,69 | 124,44 |
PIS and NIS values of A1
The objective function and new constraint for A21 are shown as follows:
| Brokers/ Exhibition Area | l1 | l2 | l3 | l4 | l5 |
|---|---|---|---|---|---|
| i1 | 1 | ||||
| i2 | 1 | ||||
| i3 | 1 | ||||
| i4 | 1 | ||||
| i5 | 1 |
The assignment of A1 using PLP
Second PIS and NIS values are computed for broker based warehouse design(A21). They are shown in Table 14.
| PIS | NIS | |
|---|---|---|
| z1 | 239,11 | 209,71 |
| z2 | 31,26 | 41,06 |
| z3 | 93,12 | 83,32 |
The PIS and NIS values for the assignment of brokers A21
The objective function and new constraint for A21 are shown as follows:
| Brokers | Product Type / Wholesalers | k1 | k3 | k4 | k6 | k8 |
|---|---|---|---|---|---|---|
| i1 | j1 | 2707,83 | ||||
| i1 | j2 | 4948,67 | ||||
| i1 | j3 | 960,17 | ||||
| i1 | j4 | 616,17 | ||||
| i2 | j1 | 2901,17 | ||||
| i2 | j2 | 3768,33 | ||||
| i2 | j3 | 720,17 | ||||
| i2 | j4 | 643,67 | ||||
| i3 | j1 | 2277,17 | ||||
| i3 | j2 | 4163,00 | ||||
| i3 | j3 | 845,83 | ||||
| i3 | j4 | 666,83 | ||||
| i4 | j1 | 2102,17 | ||||
| i4 | j2 | 4018,67 | ||||
| i4 | j3 | 998,67 | ||||
| i4 | j4 | 496,67 | ||||
| i5 | j1 | 2201,67 | ||||
| i5 | j2 | 4951,50 | ||||
| i5 | j3 | 696,83 | ||||
| i5 | j4 | 471,00 |
The assignment of A21 using PLP
After the calculation of A21, PIS and NIS values are computed for product based warehouse design(A22). The results are shown in Table 16.
| PIS | NIS | |
|---|---|---|
| z1 | 239,11 | 202,88 |
| z2 | 28,98 | 41,06 |
| z3 | 95,40 | 83,32 |
The PIS and NIS values for the assignment of products A22
The objective function and new constraint for A22 are shown as follows:
| Brokers | Product Type / Wholesalers | k1 | k2 | k3 | k4 |
|---|---|---|---|---|---|
| i1 | j1 | 2707,83 | |||
| i1 | j2 | 4948,67 | |||
| i1 | j3 | 960,17 | |||
| i1 | j4 | 616,17 | |||
| i2 | j1 | 2901,17 | |||
| i2 | j2 | 3768,33 | |||
| i2 | j3 | 720,17 | |||
| i2 | j4 | 643,67 | |||
| i3 | j1 | 2277,17 | |||
| i3 | j2 | 4163,00 | |||
| i3 | j3 | 845,83 | |||
| i3 | j4 | 666,83 | |||
| i4 | j1 | 2102,17 | |||
| i4 | j2 | 4018,67 | |||
| i4 | j3 | 998,67 | |||
| i4 | j4 | 496,6667 | |||
| i5 | j1 | 2201,67 | |||
| i5 | j2 | 4951,5 | |||
| i5 | j3 | 696,83 | |||
| i5 | j4 | 471 |
The assignment of A22 using PLP
Then total time for A22 is calculated as (222,04; 35,37; 89,01) minute and the satisfied value for the A22 is 0,51. The results are shown in Table 18.
| Layout type | z1 | z2 | z3 | λ1 |
|---|---|---|---|---|
| A1 | 164,23 | 17,37 | 125,93 | 0,68 |
| A21 | 223,80 | 35,96 | 88,43 | 0,48 |
| A22 | 222,04 | 35,37 | 89,01 | 0,47 |
The Total times for A1, A21, A22 using small data
In second step, the models are calculed using real world values. The used data in the case study is shown follows: number of brokers are 220, number of warehouse 260 and capacity of each warehouse is 595 m3.
The model is calculated using real world values and the results is shown as follows in Table 19.
| Layout type | z1 | z2 | z3 | λ1 |
|---|---|---|---|---|
| A1 | 25631,30 | 1181,34 | 28714,90 | 1,00 |
| A21 | 24818,31 | 1266,92 | 14732,07 | 0,52 |
| A22 | 22271,08 | 1059,96 | 14123,47 | 0,54 |
The Total times for A1, A21, A22 using real world data
The results show us that most appropriate layout is selected as A22 with minimum total time and 0,54 satisfied values.
5. Conclusions
In this study, it is aimed to find the most appropriate assignment of products/brokers to warehouse and exhibition areas for developing a decision making system on urban distribution center layout. The main objective is to minimize the total walking and driving distances in the market hall. The exhibition area layout and two different warehouse area layouts are optimized together in the study. The models were developed for two different wholesale market hall layouts using LP and PLP methodologies. The same data was used to solve LP and PLP models using GAMS programming. There are no big differences between A21 and A22 considering the total time for small sized data. A22 layout which has min total time is decided as most appropriate layout for PLP model using small sized data and LP model using real world data.
When this study is compared with other studies in literature, superiorities of the proposed models are as follows:
- •
In the previous studies related to the distribution center, layout areas are not examined by dividing them into two types as exhibition and warehouse areas. In this study, these two problems have been solved in an integrated way. (the proposed models of integrating these two problems are solved in a way)
- •
We have not found any study about “according to product placement” for the fruits and vegetable halls layout in literature. In this study, we proposed a new layout design for the fruits and vegetables halls as the product based warehouse design. In additon to this, we compared two different layout designs (product based and broker based) and proposed the most appropriate alternative for the fruits and vegetables halls.
- •
In the proposed models, if total amount of products that comes to the broker, exceeds store capacity in warehouse area reserved for the broker, the products are assigned to the warehouse areas according to store capacity, respectively. According to the constraint, product quantities that exceed the capacity of the store is assigned to a different store.
In future studies, the number of the brokers, the products and the vehicle types may be increased. Since the product types are affected from the seasonal changes, this factor may be included in the model and two different layouts may be offered for the two terms of the year. On the other hand, layout decisions may change according to the location. Therefore, layout and location selection problems may be modelled integratedly. And alternative layout types in different locations around the city may be compared concurrently.
References
Cite this article
TY  - JOUR
AU  - Nurgul Demirtas
AU  - Umut R. Tuzkaya
AU  - Mehmet Tanyaş
PY  - 2016
DA  - 2016/12/01
TI  - Layout of Urban Distribution Center Using Possibilistic Programming
JO  - International Journal of Computational Intelligence Systems
SP  - 1068
EP  - 1081
VL  - 9
IS  - 6
SN  - 1875-6883
UR  - https://doi.org/10.1080/18756891.2016.1256559
DO  - 10.1080/18756891.2016.1256559
ID  - Demirtas2016
ER  -