
Exploitation of a Medium-Sized Fuzzy Outranking Relation Based on Multi-objective Evolutionary Algorithms to Derive a Ranking
- DOI
- 10.1080/18756891.2016.1204122How to use a DOI?
- Keywords
- Multi-criteria Decision Analysis; Outranking Relations; Multi-objective Evolutionary Algorithms; Ranking Procedures
- Abstract
We present a multi-objective evolutionary algorithm to exploit a medium-sized fuzzy outranking relation to derive a partial order of classes of alternatives (we call it RP2-NSGA-II). To measure the performance of RP2-NSGA-II, we present an empirical study over a set of simulated multi-criteria ranking problems. The result of this study shows that RP2-NSGA-II can effectively exploit a medium-sized fuzzy outranking relation. Finally, we present a real-case study for ranking the municipalities of the state of Guanajuato, Mexico by their levels of marginalization.
- Copyright
- © 2016. the authors. Co-published by Atlantis Press and Taylor & Francis
- Open Access
- This is an open access article under the CC BY-NC license (http://creativecommons.org/licences/by-nc/4.0/).
1. Introduction
The multi-criteria ranking problem arises when a finite set of alternatives A = {a1,a2,…,am} needs to be evaluated by several criteria G = {g1,g2,…,gn} to derive a partial preorder on A that reflects the priority of each alternative. Multi-Criteria Decision Analysis (MCDA) is an activity with a diversity of approaches, methods and techniques, which helps Decision Makers (DMs or DM for a unique Decision Maker) to solve this type of problem1. In the outranking approach of MCDA for the ranking problem, no prior information regarding the structure of the set of alternatives is known and the aim lies in constructing and understanding this structure. Within MCDA, the methods related to the outranking approach are attractive and suitable for ranking problems due to their simplicity2. Usually, these methods are performed in two main steps. First, a pairwise comparison of the alternatives is made taking into consideration the evaluation criteria, to build one or several outranking relations. Normally, these outranking relations do not have remarkable mathematical properties such as completeness and/or transitivity. This is the reason for the second step, which addresses the intransitivities in the outranking relation to derive a ranking as close as possible to the original outranking relation.
Generally, exploiting a fuzzy outranking relation is a complex task. Several techniques to derive a ranking from a fuzzy outranking relation have been proposed in the literature of MCDA3–10.
Although some of these methods allow for building a transitive relation in an easy, fast and intuitive way, they have two main disadvantages 11,12:
- •
Oversimplification of the information in the outranking relation; thus, they do not fully respect the preferences of the DM.
- •
They lack a mechanism to detect and/or minimize the inconsistencies in the outranking relation, so do not adequately exploit the wealth of information. The most significant of the ranking methods based on choice or score functions is the pair-wise rank reversal effect 13.
In addition, most of these ranking approaches focus on ranking problems with small cardinality, which could be explored exhaustively by a real DM. Nevertheless, although certain approaches are able to consider larger sets of alternatives, many of them do not scale well due to complexity issues related to execution times and memory requirements. This is the case for optimization approaches (i.e., Slater-optimal ranking and ranking based on distances).
Because ranking is seen as a multicriteria decision analysis problem, it may be useful when considering larger MCDA ranking problem instances. Ranking may be used to reduce the larger preference-sets to a more manageable size by condensing and ordering the preferential information that is present in the original set of alternatives. A natural approach to extract preferential information from a medium-sized set of alternatives is to organize the set into classes that display certain properties. These properties may be derived from grouping the alternatives using preference relations. The application of a meta-heuristic approach is performed as an alternative to using traditional ranking procedures.
In the proposed ranking approach, to give meaning to a comprehensive model of preferences, the DM is mostly viewed as a mythical, inaccessible or vaguely defined person whose preferences can be used to enlighten the decision problem. The comprehensive model of preferences is only a system of preferences with which it is possible to work to bring forward elements of a response to certain questions14.
References 11 and 12 presented an approach that addresses the limitations of traditional methods by formulating the exploitation of the fuzzy outranking relation as a multi-objective combinatorial optimization problem and solving it by developing a Multi-objective Evolutionary Algorithm (MOEA). Although this approach has showed advantages over traditional ranking procedures, it was designed to address small-sized sets of alternatives to derive a total order or preorder of alternatives. References 15 and 16 presented an evolutionary approach following Refs. 11 and 12, which can handle medium-sized sets of alternatives to derive a partial order of classes of alternatives. This approach aims to find the closest anti-symmetric crisp outranking relation to the fuzzy outranking relation. Then, it applies a ranking procedure based on the repeated use of a choice function to derive a final ranking of the classes of alternatives. Although this approach showed positive results, the search space it explores is given by the set of all anti-symmetric crisp outranking relations from A. With the same purpose of exploiting a medium-sized fuzzy outranking relation to construct a recommendation for a multi-criteria ranking problem, Ref. 17 presents a MOEA based on Refs. 15 and 16 with the particular advantage that it integrates a partial preorder of alternatives into the optimization process performed by the multi-objective evolutionary algorithm. This last approach explores a search space given by the set of all partial orders of classes of alternatives from the set A.
The purpose of this paper is to detail, in a formal way, the MOEA presented in Ref. 17 and to present an empirical study to demonstrate its performance, a performance comparison with other MOEAs, and a new case study. The MOEA is a ranking procedure based on the hybridization of the reference point method with the non-dominated sorting genetic algorithm (NSGA-II); we call it RP2-NSGA-II, a MOEA procedure for grouping alternatives that are indifferent while also separating the classes that are strictly preferred to others or incomparable so that a partial order between them is found.
In RP2-NSGA-II, the reference point method is not applied in the classical way, (i.e., together with an achievement scalarising function18), but rather by establishing a biased crowding scheme. Solutions near the reference point are emphasized by the selection mechanisms. The modified crowded comparison operator prefers solutions that are closer to a specified reference point while preserving the order induced by the Pareto-dominance relation. The extent and the distribution of the solutions are maintained by an additional parameter σ. This parameter, controlling the spread range of the obtained solutions, is easy to configure.
In RP2-NSGA-II, the non-dominated sorting mechanism of NSGA-II is extended to accommodate preferences (reference point) as an additional criterion. Individuals are sorted based on this modified sorting mechanism. The preferences are incorporated a priori. With the supplied preferences, the search is gradually guided towards the region of interest of the DM.
Section 2 presents a way in which alternatives and classes of alternatives can be compared; in Sec. 3, we propose the RP2-NSGA-II procedure to exploit a fuzzy outranking relation of a medium-sized set of alternatives to derive a ranking. The empirical evaluation of RP2-NSGA-II and its comparison with other algorithms is presented in Sec. 4. Section 5 shows a real case study, and Sec. 6 presents some conclusions and discusses future research.
2. Modelling the Exploitation of a Fuzzy Outranking Relation
We present a way in which the exploitation of a fuzzy outranking relation in MCDA can be modelled. This is motivated by the definition given by Ref. 19 for the multicriteria ranking problem. We begin by defining a credibility calculus that is further used to model the indifference, preference and incomparability relations.
2.1. Credibility Calculus
The credibility calculus defined in this section is based on Refs. 20 and 21. The calculus contains two logical states: true and false. It is a Boolean calculus. Considering a set Π of propositional statements, we associate with them the credibility function η : Π → [0,1]. For example, given a proposition p ∈ Π, if η(p) = 1, then p is considered to be true, whereas if η(p) = 0, then p is considered to be false. All possible values of η between zero and one, show a lower or higher degree of credibility with respect to the truth of proposition p. To extract the Boolean statements with respect to the truth of preposition p, we attach a cutting level λ ∈ [1/ 2,1). This level is motivated by the fact that a larger value of the credibility function is required to validate the statement. Such fact, can be modeled with a crisp credibility function η* : Π → {0,1} defined as:
Let ¬ ∧ and ∨ denote the logical operators negation, conjunction, and disjunction, respectively. Consider a finite set Π of ground statements, the grouping brackets, and the basic logical operators negation, conjunction and disjunction. With these elements, we may generate the set E of all well-formed finite statements as:
The credibility denotation can be extended to all well-formed finite statements x, y ∈ E through:
2.2. Modeling the Preference Relations
Consider a set A = {a1,a2,…,am} of decision alternatives and
Let λ ∈ [0,1] be a cutting level that is associated with
- •
Indifference (IA): aiIAaj ↔ aiSAaj ∧ ajSAai
- •
Preference
- •
Preference
- •
Incomparability(RA): aiRAaj ↔ ai¬SAaj ∧ aj¬SAai
This 4-tuple
We may apply the credibility calculus and define the credibility of the IA,
Reference 23 defines the credibility degree of the indifference relation in a similar way. The relations IA,
2.3. Comparing Classes of Alternatives
The proposed approach of constructing the relation between two classes of alternatives is based on aggregating all the relations between the alternatives of the two classes. The preference relation that appears most frequently between the alternatives of two classes is selected as the preference relation between the two classes of alternatives. This approach has also been used in Ref. 24.
Let Pk (A) = {C1,C2,…,Ck} be a partition of A into k classes of alternatives.
We define the credibility of any preferential relation
Then, the crisp credibility degree
By definition of the ranking problem, the alternatives that are indifferent are grouped together, whereas those that are not indifferent are separated. By construction, the relation between any pair of classes is restricted to exclude the indifference relation IPk(A). Then, the relation between classes can either be of a preference in one direction or the other, or of incomparability. However, finding an alternative from Cq that is strictly preferred to one from Cr may put serious doubt on the fact that Cr OPk(A) Cq. Any two classes Cr and Cq are preferentially consistent if a preference relation can be expressed between them and no alternative from Cr is in a preference relation with any alternative from Cq, which contradicts the preference relation between the two classes. The search for a partial order of classes that hold this property is a difficult task, and in the outranking approach, most of the cases are impossible. Nonetheless, it is useful to reduce the number of such contradictions between the proposed relation between classes and the individual relations between the alternatives inside them.
3. Proposed Ranking Procedure RP2-NSGA-II to Exploit a Fuzzy Outranking Relation
The aim of RP2-NSGA-II, is to find the closest partial order of classes of alternatives
- (i)
If ai is indifferent to aj in
- (ii)
If ai is preferred to aj in
- (iii)
If ai is preferred to aj in
Because RP2-NSGA-II searches for a partial order of classes of alternatives close to
Given a fuzzy outranking relation
3.1. The MOEA RP2-NSGA-II
RP2-NSGA-II seeks the closest possible partial order of classes of alternatives
3.1.1. Representation of a potential solution in the ranking problem
An individual
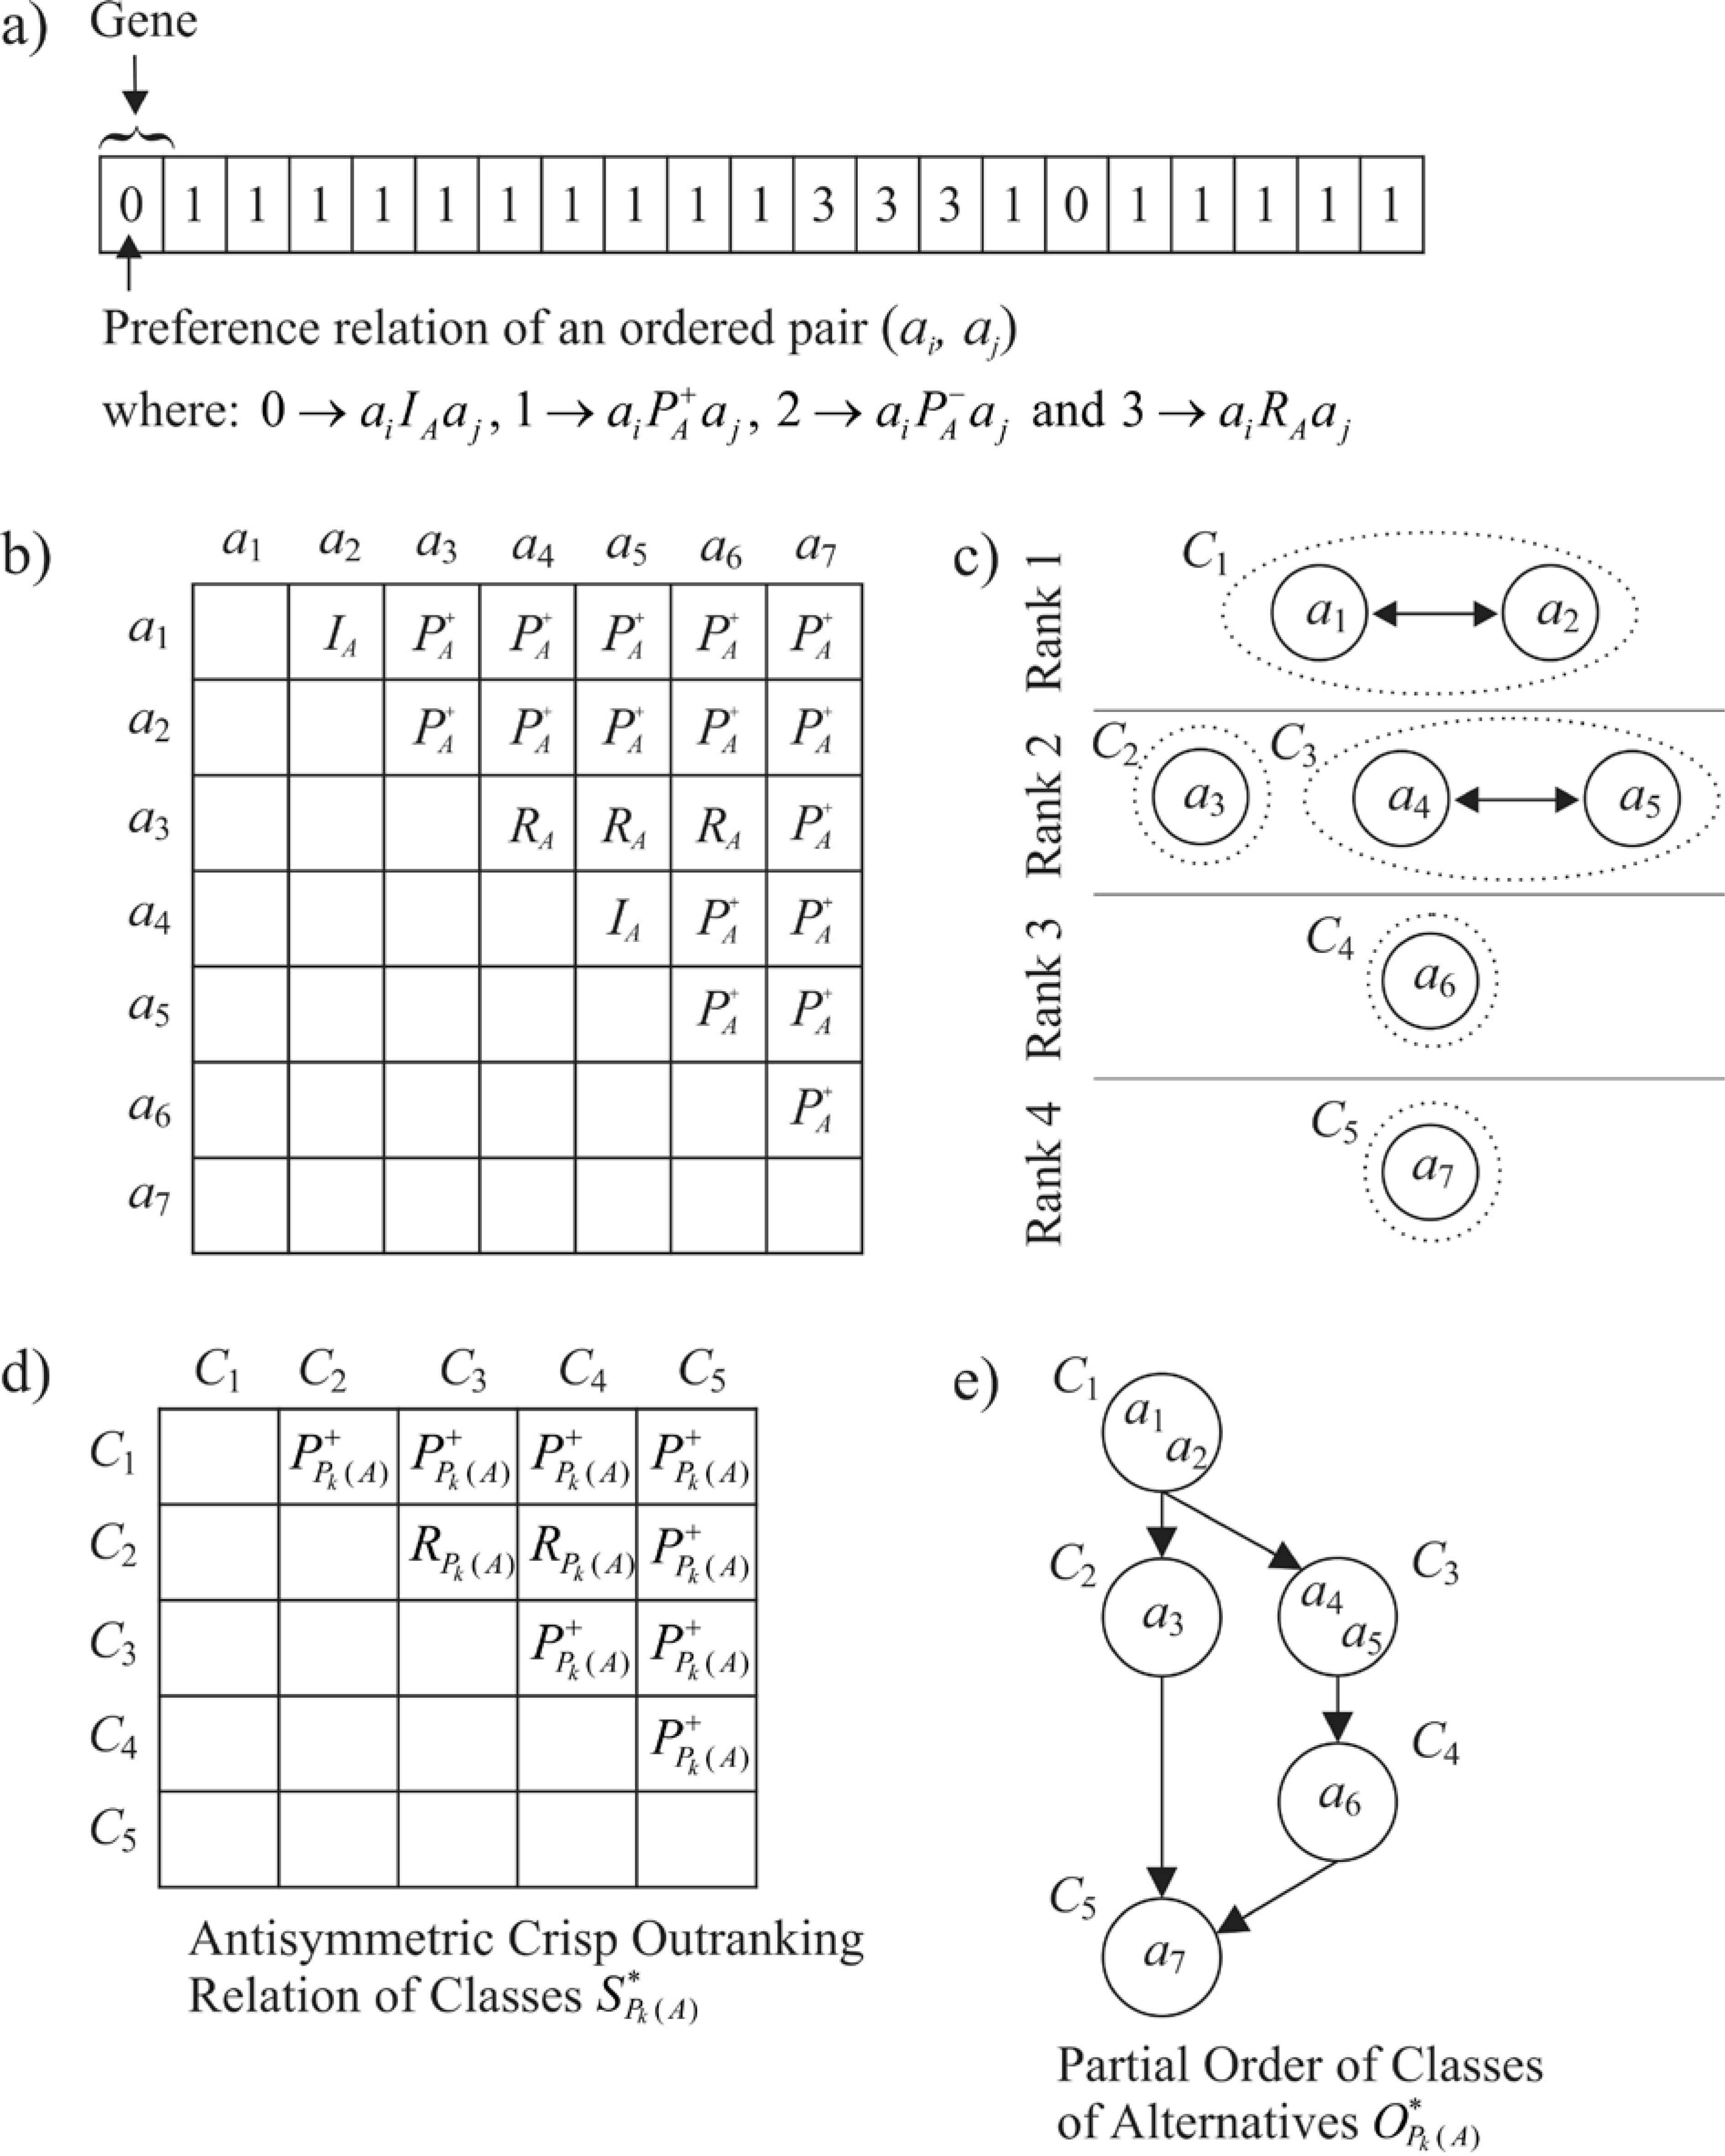
Representation and decodification of an individual
3.1.1.1. Decoding process to obtain a partial order of classes of alternatives
The decoding process to obtain a partial order of classes of alternatives
Step 1. From the crisp binary relation
Step 2. Using a Bread-First Search algorithm, identify the connected components within each rank. Each connected component represents a class of alternatives (see Fig. 1c). These connected components represent the partition of classes of alternatives Pk (A) = {C1,C2,…,Ck}.
Step 3. From
Step 4. Let
Step 5. Identify the classes in
Step 6. These classes, not preferred by anyone, are removed from
Step 7. Current rank r is incremented by one, this is r = r + 1.
Step 8. If
Once the decoding process is completed, a Hasse diagram can be drawn to represent the
3.1.2. Objective Functions
We now define objective functions that can be used to reflect the quality of a particular ranking result.
To compare individuals with different numbers of classes, we consider their fitness to be reflected by the degree with which each preference relation between two alternatives fits in the structure that the individual proposes. Ideally, all alternatives inside the same class are indifferent to each other, whereas those in different classes are not indifferent. If one class is preferred or incomparable to another, then all alternatives in the first class are preferred or incomparable to the alternatives of the second class. Furthermore, the degree of credibility of these relations is maximal.
3.1.2.1. Maximizing the cutting level
This approach considers the association of
A high λ − cut value reflects a high credibility of
Each individual
We would like to find potential solutions for which the credibility level λ is near one. This indicates the solution is more trustworthy. We call this objective the maximum cutting level objective.
3.1.2.2. The min cut objective
This objective function counts the alternatives that are not indifferent to each other in each class. The aim is to minimize these inconsistencies to form solutions that maximize the indifference inside each class.
3.1.2.3. The minimum pair-wise preference disagreement objective
From a given pair of classes of alternatives
fPk(A) and gPk(A) are minimized to come closer to a preferentially consistent partial order of classes of alternatives. This may be addressed as a multiobjective optimization problem.
3.1.3. The Multi-Objective Combinatorial Optimization Problem
Based on the objective functions defined previously, the multi-objective combinatorial optimization problem is formulated as follows:
Because there are not constraints with respect to how the alternatives have to be grouped together, which would in some way reduce the complexity of this problem, the only clear way of finding the true Pareto front, with respect to a particular fitness measure, is to consider the entire polytope of potential solutions. This means that all possible partitions Pk (A) of A need to be explored, leading to the selection of the best ones with respect to the considered fitness measures. Because the number of partitions of a set is equal to the Bell number, this approach to solving this problem is exponential in complexity.
Due to complexity issues related to the problem of ranking in MCDA, in RP2-NSGA-II, the decoding process to obtain a partial order of classes of alternatives
We present the remaining steps of the proposed approach below:
3.1.4. Initialization procedure
Typically, evolutionary algorithms begin with an initial population composed of N individuals. Each individual in the population represents a potential solution to a particular problem. Frequently, this population is randomly generated, which in our case does not result in favorable initial partitions because it is likely that the classes are mixed to a high degree.
The initialization procedure that this approach proposes is based on 26, which uses two algorithms: Prim’s algorithm27 and an extension of the K-means algorithm28. This procedure obtains initial spread solutions close to the Pareto front. Solutions with high connectivity grade are generated using the Minimum Spanning Tree (MST). At most, half of the population is generated using the MST. Solutions with good performance under the compactness are generated by the extension of the K-means algorithm.
3.1.4.1. Multi-criteria distance between alternatives
The distance d(ai,aj) among pairs of alternatives is essential for the initialization procedure of the population. This approach maintains the MCDA distance definition of Ref. 28, which is defined as follows:
In Eq. (18), Q is a 4-tuple
3.1.4.2. Generating solutions based on MST
To generate individuals for the initial population based on the Minimum Spanning Tree (MST), first, a dissimilarity D matrix is calculated by computing distances for ∀(ai,aj) ∈ A × A using Eq. (18). Once D is generated, Prim’s algorithm is used to find the MST.
The idea behind this procedure is to create a graph and detect its connected components. These connected components represent the partition Pk (A) = {C1,C2,…,Ck} of classes of alternatives that can be decoded to an individual genotype. Because the obtained MST corresponds to a solution with a single class, more solutions are generated by dividing the class into different numbers of classes. To do so, it is necessary to cut the links of the MST until the desired number of classes is reached. Special attention has to be paid to the selection of the link to cut. Cutting any link can produce undesirable results, i.e., could lead to the separation of “outliers” that could be part of a class26. To avoid this effect, the definition of “interesting links” is used, which involves the discovery of a real class structure. For a set of data, an interesting set of classes derived from the MST can be constructed as follows:
- (i)
All interesting links of MST are detected and sorted by their degree of interest in a list.
- (ii)
A set of classes is built using the ordered list: ∀n ∈ {0,..,min(I,[0.5· fsize]−1)}, where fsize is the total number of initial solutions.
- (iii)
A class Cn is generated by cutting the first interesting link n.
Once the partition on the set of alternatives Pk (A) is generated, Eq. (12) is used to deduce the antisymmetric crisp outranking relation
3.1.4.3. Generating solutions based on the K-means algorithm
By using the Prim’s algorithm, only half of the initial population is generated. To complete this population, an extension of K-means is used. This algorithm generates classes of decision alternatives in terms of MCDA, as described in the following steps:
- 1.
Generate the initial partition Pk (A) = {C1,C2,…,Ck} of the set of alternatives A: randomly select k alternatives as the initial centroids (c1,c2,…,ck) for the k classes. Then, assign each alternative ai ∈ A to the class Cl with the nearest centroid cl (e.g., min d(ai,cl)).
- 2.
Update the centroid for each class Cl ∈ Pk (A) through a profile Q(rl) defined as:
whereThe centroid cl of class Cl is defined as a fictitious alternative rl.
- 3.
Assign each alternative ai ∈ A to the class Cl whose cl centroid has the minimal distance to it d(ai,cl).
- 4.
Repeat steps 2 and 3 until the partition Pk (A) no longer changes or a certain number of iterations have been performed.
This procedure is performed to obtain different numbers of classes of alternatives k ∈ {2,..,fsize − min(IA,[0.5· fsize]−1)}. At most, half of the population is generated by the K-means algorithm. With the resulting partition Pk (A), it is necessary to deduce the antisymmetric crisp outranking relation
3.1.5. Crossover and Mutation Operators
The uniform crossover29 is used because it is unbiased with respect to the ordering of genes and can generate any combination of alleles from the two parents in a single crossover event30.
For the mutation operator, a modified version of the Uniform Mutation is employed. The Uniform Mutation operator requires a single parent and produces a single offspring. This operator randomly selects a gen pr from the individual
3.1.6. Preference incorporation in NSGA II
Most approaches in the evolutionary multi-objective optimization literature concentrate mainly on adapting an evolutionary algorithm to generate an approximation of the Pareto frontier. However, this does not solve the problem. We present an idea previously introduced in the literature31–33: incorporate into NSGA II the DM’s preferences, expressed as a set of solutions assigned to ordered categories. In RP2-NSGA-II, we modified the NSGA II to include selective pressure toward non-dominated solutions that belong to the Region of Interest (ROI).
Along with convergence to the Pareto-optimal set, it is also desired that an evolutionary algorithm maintains a good spread of solutions in the obtained set of solutions. The original NSGA II used the crowded-comparison approach, which maintains sustainable diversity in a population by controlling crowding of solutions in a deterministic and prespecified number of equal-sized cells in the search space.
To solve the multi-criteria ranking problem using NSGA II, it is not necessary to search the entire Pareto optimal set Ptrue or the associated Pareto front PFtrue because many of the non-dominated solutions are not of interest to the DM. In RP2-NSGA-II, we use the strategy of attempting to find in each NSGA II generation the most promising and attractive solutions for the DM, which in our case are those individuals
Based on this strategy, the proposed method attempts to evolve a population toward the true restricted Pareto frontier
The true restricted Pareto frontier
In RP2-NSGA-II, we use a modified crowded-comparison approach to identify a small, privileged subset of the Pareto front
Fixed Aspiration Point distance: To identify the solutions surrounding the fixed aspiration level (fPk (A), gPk (A)), with
The Center of Mass of a group of points is defined as the weighted mean of the points’ positions. The weight applied to each point is the point’s mass. ‖•‖∞ is the maximum holder metric. Note that
For each solution i in rank r, calculate the distance count d _ fali using the following equation:
This quantity serves to measure the proximity of solution
The d _ fali -distance computation requires sorting the population according to each objective function value in ascending order of magnitude.
After all population members in the set are assigned a distance, we compare two solutions by their extent of proximity with the fixed aspiration level. A solution with a smaller value of this distance measure is, in some sense, less crowded and closest to the fixed aspiration point. This value is what we compare in the fixed_Aspiration_Point-Comparison Operator described below.
Crowded-Fixed_Aspiration_Point (C-FAP)-Comparison Operator: The C-FAP-comparison operator (≺n) guides the selection process at the various stages of the algorithm toward the Region of Interest of the Pareto optimal front. Assume that every individual
- 1.
Non domination rank (irank),
- 2.
Crowding distance
- 3.
FAP to distance
We define a partial order ≺n as:
Between two solutions with different non-domination ranks, we prefer the solution with the lower (better) rank. Otherwise, if both solutions belong to the same front, then we prefer the solution that is closest to the FAP or is located in a less crowded region and is equal to the FAP.
The ROI of the Pareto front for the DM is reached using the FAP comparison procedure, which is used in tournament selection and during the population reduction phase.
4. Empirical Evaluation
The aim of this empirical evaluation is to analyze how the RP2-NSGA-II performs when solving ranking problems with different structures and sizes. We attempt to capture essential MOEA characteristics and analyze any interesting observations resulting from the experiment execution and result analysis. To achieve this goal, a set of simulated fuzzy outranking relations were randomly generated in such a way that for a given λ − value, there is a partial order (i.e., a reflexive, antisymmetric and transitive preference relation) of classes of alternatives without inconsistencies, that is, the objective functions fPk (A) and gPk (A) are equal to zero. Thus, RP2-NSGA-II was executed to exploit each of the generated fuzzy outranking relations and was evaluated with respect to whether it was successful in finding the best solution.
In addition, we exploited the simulated instances problems with other evolutionary approaches with the aim to have a comparison point to analyse the performance of the RP2-NSGA-II and to discuss its advantages (or disadvantages). The first approach is a ranking procedure based on the MOGA-H15; as the RP2-NSGA-II is an extended version of it, a second approach is the use of the original NSGA-II with random initialization and using the original crowded comparison operator; a third approach is the R-NSGA-II31, which uses one, or several, reference points to guide the search to a specific region(s) of the Pareto’s front. This allowed us to compare the quality of the solution with the RP2-NSGA-II with other approaches in the literature.
4.1. Generating the Simulated Fuzzy Outranking Relations
The construction of the set of simulated fuzzy outranking relations was performed using an instances generator developed in the C programming language. Algorithm 1 shows the general procedure to simulate each of the fuzzy outranking relations. The fuzzy outranking relations were generated based on a previously simulated ranking with different sizes and structures of a medium-sized set of alternatives with the indication that the rankings were consistent with the fuzzy outranking relation, i.e., each simulated instance of the ranking problem is a fuzzy outranking relation constructed in such a way that, for a given interval of lambda values, λ′ (λ′ = λ ± ε, λ ≥ 0.5 and 0 < ε << 1), there is a partial or complete order of classes of alternatives without inconsistencies (Appendix A presents a general outline of this algorithm.).
This evaluation was performed on a combination of different numbers of alternatives and different numbers of classes. Table 1 shows the values for the input parameters of Algorithm 1 used to generate the simulated fuzzy outranking relations for this study (F1: number of alternatives and F2: number of classes). For each combination of the two defined factors with their respective levels (4 levels in F1 and 5 levels in F2, 20 combinations in total), 100 fuzzy outranking relations were generated to obtain 2,000 in all.
| Input: Number of classes of alternatives NC and number of alternatives NA. |
| Output: Fuzzy Outranking Relation |
|
Instances generator algorithm
| Factors | Levels |
|---|---|
| F1: Number of alternatives | 15, 30, 45, 60 |
| F2: Number of classes | 3, 5, 7, 9, 11 |
Factors considered in the empirical study.
4.2. Response Variable
The response variable defined to analyze RP2-NSGA-II is the number of solutions that it finds per combination (F1,F2). Each combination (F1,F2) has 100 different fuzzy outranking relations. For each run i of RP2-NSGA-II on a single fuzzy outranking relation, we define an auxiliary binary variable xi (F1,F2) which takes a value of one if the algorithm finds the best solution or zero otherwise. Therefore, the response variable
4.3. Results
The stochastic nature of the evolutionary algorithms could lead to a good (or bad) result due to chance. To minimize this error and to obtain results with statistical significance, we exploited all 100 fuzzy outranking relations per combination (F1,F2) with each of the evolutionary approaches (RP2-NSGA-II, MOGA-H, NSGA-II, R-NSGA-II) ten times using the parameter values shown in Table 2.
| RP2-NSGA-II | R-NSGA-II | NSGA-II | MOGA-H | |
|---|---|---|---|---|
| # of generations | 1000 | |||
| Population size | 40 | 50 | ||
| Crossover probability | 0.9 | 1 | ||
| Mutation probability | 0.005 | |||
| Lambda range values | [0.60, 0.85] | |||
Note: For the R-NSGA-II, We set the reference point to (0,0) and the ε value to control the extent of the obtained solutions near the reference point to 0.0001.
Parameters for the MOEAs
4.3.1. RP2-NSGA-II Study
In this section, we evaluated and describe the performance of the RP2-NSGA-II on the simulated problems.
Table 3 shows some descriptive statistics for the results of the evaluation for the ten runs of each set of combinations (F1, F2). Figure 2 depicts boxplots for the number of solutions found in the ten repetitions for each set of combinations.
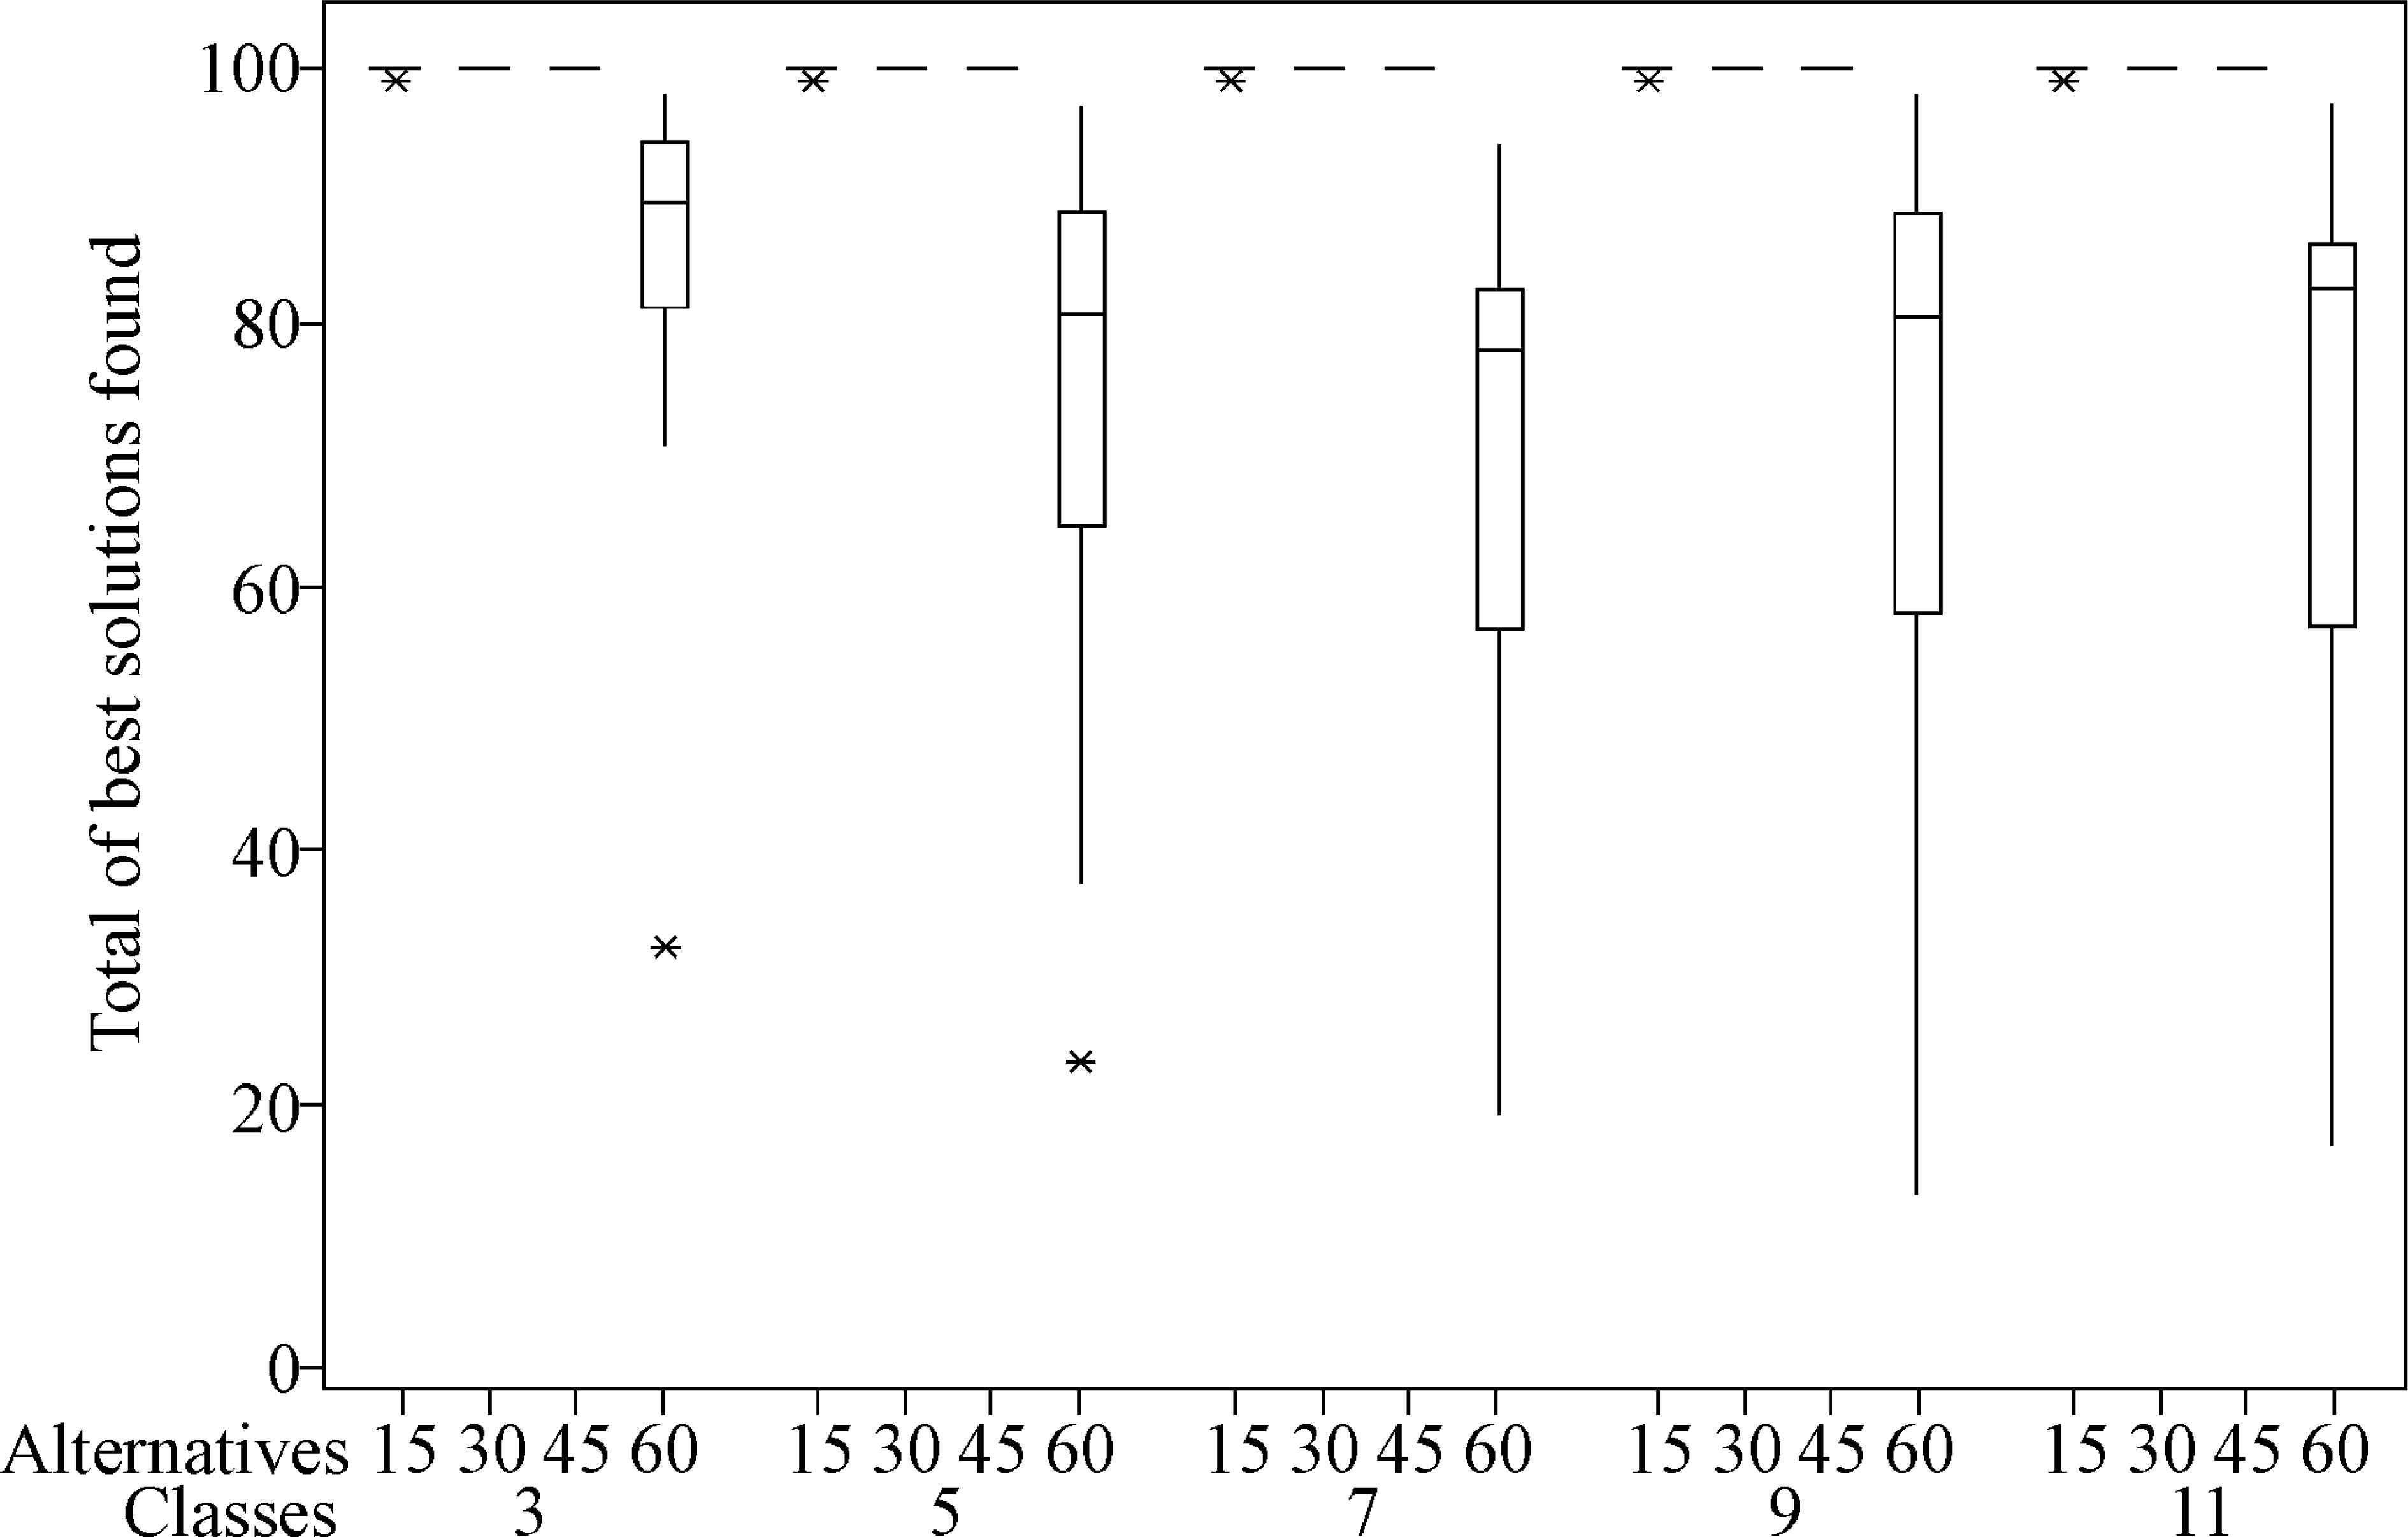
Boxplots for the total of best solutions found in the ten runs for each set of F1 and F2 combinations (asterisks in this graph represent outliers in the results).
| Class | Alts. | Mean | StDev | Min | Med | Max |
|---|---|---|---|---|---|---|
| 3 | 15 | 99.9 | 0.3 | 99.0 | 100.0 | 100.0 |
| 30 | 100.0 | 0.0 | 100.0 | 100.0 | 100.0 | |
| 45 | 100.0 | 0.0 | 100.0 | 100.0 | 100.0 | |
| 60 | 83.5 | 19.7 | 32.0 | 89.5 | 98.0 | |
| 5 | 15 | 99.9 | 0.3 | 99.0 | 100.0 | 100.0 |
| 30 | 100.0 | 0.0 | 100.0 | 100.0 | 100.0 | |
| 45 | 100.0 | 0.0 | 100.0 | 100.0 | 100.0 | |
| 60 | 73.1 | 24.2 | 23.0 | 81.0 | 97.0 | |
| 7 | 15 | 100.0 | 0.0 | 100.0 | 100.0 | 100.0 |
| 30 | 100.0 | 0.0 | 100.0 | 100.0 | 100.0 | |
| 45 | 100.0 | 0.0 | 100.0 | 100.0 | 100.0 | |
| 60 | 68.4 | 24.9 | 19.0 | 78.0 | 94.0 | |
| 9 | 15 | 99.9 | 0.3 | 99.0 | 100.0 | 100.0 |
| 30 | 100.0 | 0.0 | 100.0 | 100.0 | 100.0 | |
| 45 | 100.0 | 0.0 | 100.0 | 100.0 | 100.0 | |
| 60 | 70.3 | 29.0 | 13.0 | 81.0 | 95.0 | |
| 11 | 15 | 100.0 | 0.0 | 100.0 | 100.0 | 100.0 |
| 30 | 100.0 | 0.0 | 100.0 | 100.0 | 100.0 | |
| 45 | 100.0 | 0.0 | 100.0 | 100.0 | 100.0 | |
| 60 | 71.3 | 27.7 | 17.0 | 83.0 | 97.0 | |
Mean, standard deviation (StDev), min value (Min), median (Med) and max value (Max) for the ten runs of the sets of combinations F1 and F2. Descriptive statistics for the ten runs of each number of classes (Class)-alternatives (Alts) combinations.
Figure 2 shows that RP2-NSGA-II had excellent results for all class sizes with 15, 30 and 45 alternatives. In all of these sets, RP2-NSGA-II found all of the solutions in each of the ten runs (for the sets of 15 alternatives and 3, 5 and 9 classes, we can see outliers resulting in a mean of 99.9; in one of the ten runs for these cases, RP2-NSGA-II found 99 solutions). For the case of 60 alternatives (all classes’ size), the results were not as good. For this particular case, RP2-NSGA-II shows a mean number of solutions of 83.5, 73.1, 68.4, 70.3 and 71.3 for 3, 5, 7, 9, and 11 classes, respectively.
The size of the classes does not affect the performance of RP2-NSGA-II, but the number of alternatives does to affect the performance.
To test the statistical significance of this hypothesis, we compare across the groups of classes and across the groups of alternatives using the Kruskal-Wallis H-Test with a significance level of α = 0.05. We formulate the following hypothesis for different numbers of classes:
- •
H0: The distributions of the results are equal across all groups of class size.
- •
Hα: At least one of the distributions of the results differs.
The hypothesis to test for different numbers of alternatives is:
- •
H0: The distributions of the results are equal across all groups of numbers of alternatives.
- •
Hα: At least one of the distributions of the results differs.
Tables 3 and 4 show the results for the Kruskal-Wallis H-Test for both comparisons.
| Classes | N | Median | Av. Rank |
|---|---|---|---|
| 3 | 40 | 100 | 102.1 |
| 5 | 40 | 100 | 99.5 |
| 7 | 40 | 100 | 100.1 |
| 9 | 40 | 100 | 99.2 |
| 11 | 40 | 100 | 101.6 |
| Overall | 200 | 100.5 | |
H = 0.08 DF = 4 P = 0.999
H = 0.13 DF = 4 P = 0.998 (adjusted for ties)
Kruskal-Wallis Test for the number of best-known solutions found in ten runs for the sets of 3, 5, 7, 9 and 11 classes.
| Alternatives | N | Median | Av. Rank |
|---|---|---|---|
| 15 | 50 | 100 | 122.5 |
| 30 | 50 | 100 | 127 |
| 45 | 50 | 100 | 127 |
| 60 | 50 | 82 | 25.5 |
| Overall | 200 | 100.5 | |
H = 112.14 DF = 3 P = 0.000
H = 186.00 DF = 3 P = 0.000 (adjusted for ties)
Kruskal-Wallis Test for the number of best-known solutions found in ten runs for the sets of 15, 30, 45 and 60 alternatives.
For the case of the groups of classes, the Kruskal-Wallis H-Test shows that there is no statistically significant difference (p-value > 0.05) in the results across different numbers of classes. This result suggests that there is sufficient evidence to conclude that the size of the classes does not affect the performance of the MOEA. For the case of the groups with different numbers of alternatives, the Kruskal-Wallis H-Test shows that there is a statistically significant difference (p-value < 0.05) in the results for at least one of the groups; thus, we reject the null hypothesis that the number of alternatives does not affect the performance of the MOEA. Figure 1 shows that the group of alternatives that differs is the one with 60 alternatives. Hence, we did not consider a post-hoc pairing analysis to determine which of the groups made the difference.
MOEAs Comparison Study
For each test problem, the four rankings derived by using the four ranking procedures were analyzed with the following method. The method (denoted as “Rate 1”, “Rate 2”, “Rate 3” and “Rate 4” in Table 5) aimed to record the number of times each of the four rankings, derived from RP2-NSGA-II, R-NSGA-II, NSGA-II and MOGA-H, respectively, were different from the reference ranking (error rate). That is, when two rankings are compared, this rate would be equal to zero if the two rankings are identical, otherwise it would be equal to one (i.e., it is binary valued). For instance, in Table 5, when the RP2-NSGA-II method is used with 60 alternatives and three classes, “Rate 1” is equal to 16.5, which means that 16.5% of the simulated problems with 60 alternatives and three classes were different from the reference ranking when using such method. The error rates obtained using the reference sets provide an estimation of the generalized performance of the methods measuring their ability to provide correct recommendations on the ranking of alternatives.
| Classes | Alternatives | Rate 1 | Rate 2 | Rate 3 | Rate 4 |
|---|---|---|---|---|---|
| 3 | 15 | 0.1 | 97.6 | 100 | 0 |
| 30 | 0 | 94.9 | 100 | 0 | |
| 45 | 0 | 99.1 | 100 | 0 | |
| 60 | 16.5 | 100 | 100 | 0.3 | |
| 5 | 15 | 0.1 | 100 | 100 | 2.4 |
| 30 | 0 | 100 | 100 | 0.5 | |
| 45 | 0 | 100 | 100 | 0.5 | |
| 60 | 26.9 | 100 | 100 | 0.9 | |
| 7 | 15 | 0 | 100 | 100 | 58 |
| 30 | 0 | 100 | 100 | 5.2 | |
| 45 | 0 | 100 | 100 | 2.1 | |
| 60 | 31.6 | 100 | 100 | 4.4 | |
| 9 | 15 | 0.1 | 100 | 100 | 99.7 |
| 30 | 0 | 100 | 100 | 33.8 | |
| 45 | 0 | 100 | 100 | 8.3 | |
| 60 | 29.7 | 100 | 100 | 12 | |
| 11 | 15 | 0 | 100 | 100 | 100 |
| 30 | 0 | 100 | 100 | 74.1 | |
| 45 | 0 | 100 | 100 | 29.4 | |
| 60 | 28.7 | 100 | 100 | 20.5 |
Error rates for the four ranking procedures for different alternatives and classes.
The results in Table 5, show that the RP2-NSGA-II has lower error rates than the rest of the methods in all cases, except for the MOGA-H, which shows better results in the cases for 60 alternatives with any number of classes.
To test if the difference in the results for the ranking procedures is statistically significant and thus to determine if the RP2-NSGA-II ranking procedure has the best performance, a Wilcoxon signed-rank test with a significant level of α = 0.05 was used. Note that this test discarted the R-NSGA-II and NSGA-II procedures due their low performance and only focused on comparing the MOGA-H and the RP2-NSGA-II procedures, which showed positive results. In Table 5 the statistically best performer method, in each combination (F1,F2), is highlighted in bold face.
In general, the results of this statistical test show that RP2-NSGA-II has better performance than the MOGA-H in the majority of the reference sets. Given these results, the RP2-NSGA-II procedure can be considered the most efficient ranking method for deriving a ranking from a medium-sized valued outranking relation in cases where the assumptions for these techniques are met in the data under consideration.
In addition to this experiment, we exploited a sampling of the set of outranking relations with the distillation ranking procedure of ELECTRE III14. For the sampling, we randomly selected 9 outranking relations from each combination (F1, F2). In total, we had a sampling of 180 fuzzy outranking relations. For this test, from the 180 fuzzy outranking relations, the distillation ranking procedure generated only one ranking without inconsistencies, corresponding to a ranking with 3 classes, 30 alternatives and λ = 0.72.
5. Real Case Example
In this section, we present the application of RP2-NSGA-II to a real problem: ranking the municipalities of the State of Guanajuato, Mexico by their marginalization level. Marginalization is a problem that occurs in different regions of Mexico and is one of the causes of the socio-economic inequality in the country. Related social, economic and demographic indicators have forced the Mexican government to endorse the commitment to fight conditions that disadvantage certain population groups and certain regions of the country. In this example, the problem is addressed as a multi-criteria ranking problem using as evaluation criteria the socio-demographic indicators constructed by the Mexican National Population Council (CONAPO). From the ranking of the municipalities that we obtained with RP2-NSGA-II, we made a comparison with the ordered stratifications created by Ref. 34 to analyze the consistency of our results. Finally, we also obtained a set of rankings with the R-NSGA-II to make a comparative analysis with the solutions obtained with the RP2-NSGA-II.
5.1. Data Source
The data used in this study are part of the socio-demographic indicators constructed by CONAPO based on data obtained from the 2010 Census of Population and Housing for the 2010 marginalization index. The indicators from the CONAPO study (shown in Table 6) are used as evaluation criteria to model the marginalization level of the 46 municipalities of the State of Guanajuato (Table 7 lists these municipalities). Due to lack of space, the performance of the municipalities in each indicator (performance matrix) is omitted in this paper but can be found in Ref. 34.
| Label | Criterion |
|---|---|
| g1 | % Illiterate Population 15 years and older. |
| g2 | % Population with incomplete elementary school education, 15 years and older |
| g3 | % Occupants in dwellings without sanitation |
| g4 | % Occupants in dwellings without electricity |
| g5 | % Occupants in dwellings without running water |
| g6 | % Overcrowded dwellings |
| g7 | % Occupants in dwellings with only dirt floor |
| g8 | % Population in localities with less than 5,000 inhabitants |
| g9 | % People employed with income less than double minimum wage |
Indicator created by CONAPO and used as evaluation criteria.
| ID | Municipality | ID | Municipality |
|---|---|---|---|
| 1 | Abasolo | 24 | Pueblo Nuevo |
| 2 | Acámbaro | 25 | Purísima del Rincón |
| 3 | San Miguel de Allende | 26 | Romita |
| 4 | Apaseo el Alto | 27 | Salamanca |
| 5 | Apaseo el Grande | 28 | Salvatierra |
| 6 | Atarjea | 29 | San Diego de la Unión |
| 7 | Celaya | 30 | San Felipe |
| 8 | Manuel Doblado | 31 | San Francisco del Rincón |
| 9 | Comonfort | 32 | San José Iturbide |
| 10 | Coroneo | 33 | San Luis de la Paz |
| 11 | Cortazar | 34 | Santa Catarina |
| 12 | Cuerámaro | 35 | Santa Cruz de Juventino Rosas |
| 13 | Doctor Mora | 36 | Santiago Maravatío |
| 14 | Dolores Hidalgo | 37 | Silao |
| 15 | Guanajuato | 38 | Tarandacuao |
| 16 | Huanímaro | 39 | Tarimoro |
| 17 | Irapuato | 40 | Tierra Blanca |
| 18 | Jaral del Progreso | 41 | Uriangato |
| 19 | Jerécuaro | 42 | Valle de Santiago |
| 20 | León | 43 | Victoria |
| 21 | Moroleón | 44 | Villagrán |
| 22 | Ocampo | 45 | Xichú |
| 23 | Pénjamo | 46 | Yuriria |
The 46 municipalities of the State of Guanajuato, México.
5.2. Computations with the ELECTRE III- RP2-NSGA-II Methodology
As a first step, the fuzzy outranking relation was computed with the performance of the municipalities in each criterion using the ELECTRE-III aggregation procedure. The weights for the criteria were taken from the CONAPO study. For the Indifferent and Preference thresholds, we made an analysis to determine their values. We did not consider a Veto threshold, and the preference direction of the criteria was to minimize. Table 8 shows the values for these parameters.
| Criterion | Weight (W) | Indifference (q) | Preference (p) |
|---|---|---|---|
| g1 | 0.140 | 2.00 | 4.00 |
| g2 | 0.141 | 4.00 | 7.00 |
| g3 | 0.073 | 2.00 | 4.00 |
| g4 | 0.092 | 0.80 | 2.50 |
| g5 | 0.092 | 2.00 | 4.00 |
| g6 | 0.115 | 4.00 | 7.00 |
| g7 | 0.108 | 2.50 | 5.00 |
| g8 | 0.102 | 10.00 | 20.00 |
| g9 | 0.137 | 7.50 | 12.50 |
Values for the Weights (W) and the Indifference (q) and Preference (p) Thresholds.
After the fuzzy outranking relation was computed, we proceeded to exploit it with RP2-NSGA-II to find the closest partial order of classes to this model of preferences. Due to the stochastic nature of the evolutionary algorithms, the solutions found from different runs of the algorithm can vary in quality. Therefore, with the aim to find the best possible solution(s), we performed RP2-NSGA-II ten times with a number of generations of 1,000, a population size of 40, a crossover probability of 0.9, a mutation probability of 0.005 and a lambda value ranging from 0.60 ∼ 0.69. Then, we compared all of the solutions in the restricted Pareto front found by the algorithm in each of the runs to select the one with the lowest number of inconsistencies (sum of fPk (A) and gPk (A) objective values). In Table 9, we present the top five solutions with the lowest number of inconsistencies in this comparison. We selected solution 1, which had 137 inconsistencies and 7 classes, for the corresponding analysis.
| Solution | λ | fPk (A) | gPk (A) | fPk (A) + gPk (A) | #Classes |
|---|---|---|---|---|---|
| 1 | 0.69 | 68 | 68 | 136 | 7 |
| 2 | 0.69 | 79 | 62 | 141 | 7 |
| 3 | 0.68 | 66 | 75 | 141 | 7 |
| 4 | 0.68 | 77 | 68 | 145 | 7 |
| 5 | 0.67 | 70 | 78 | 148 | 7 |
Objective values, overall inconsistencies (fPk (A) + gPk (A)), and number of classes (#Classes) of the top five solutions with the lowest numbers of inconsistencies found by RP2-NSGA-II in the ten runs.
5.3. Analysis of the Results
As a result of this analysis, the selected solution has an inconsistency rate of 13.23% with respect to the crisp outranking relation
Figure 3 shows both rankings, including the coherence between rankings. In the ranking of RP2-NSGA-II, the first class, C1, groups all the municipalities from the “Very Low” and “Low” classifications from the CONAPO ranking, except for municipalities 2 and 18. The C2 class of RP2-NSGA-II only has municipality 18, which is in the “Low” classification of the CONAPO rankings. The municipalities in classes C3, C4, C5 and C6 of RP2-NSGA-II are in concordance with the “Medium” stratification of CONAPO. The municipalities in class C7 agree with the last two stratifications of “High” and “Very High” of the CONAPO ranking.
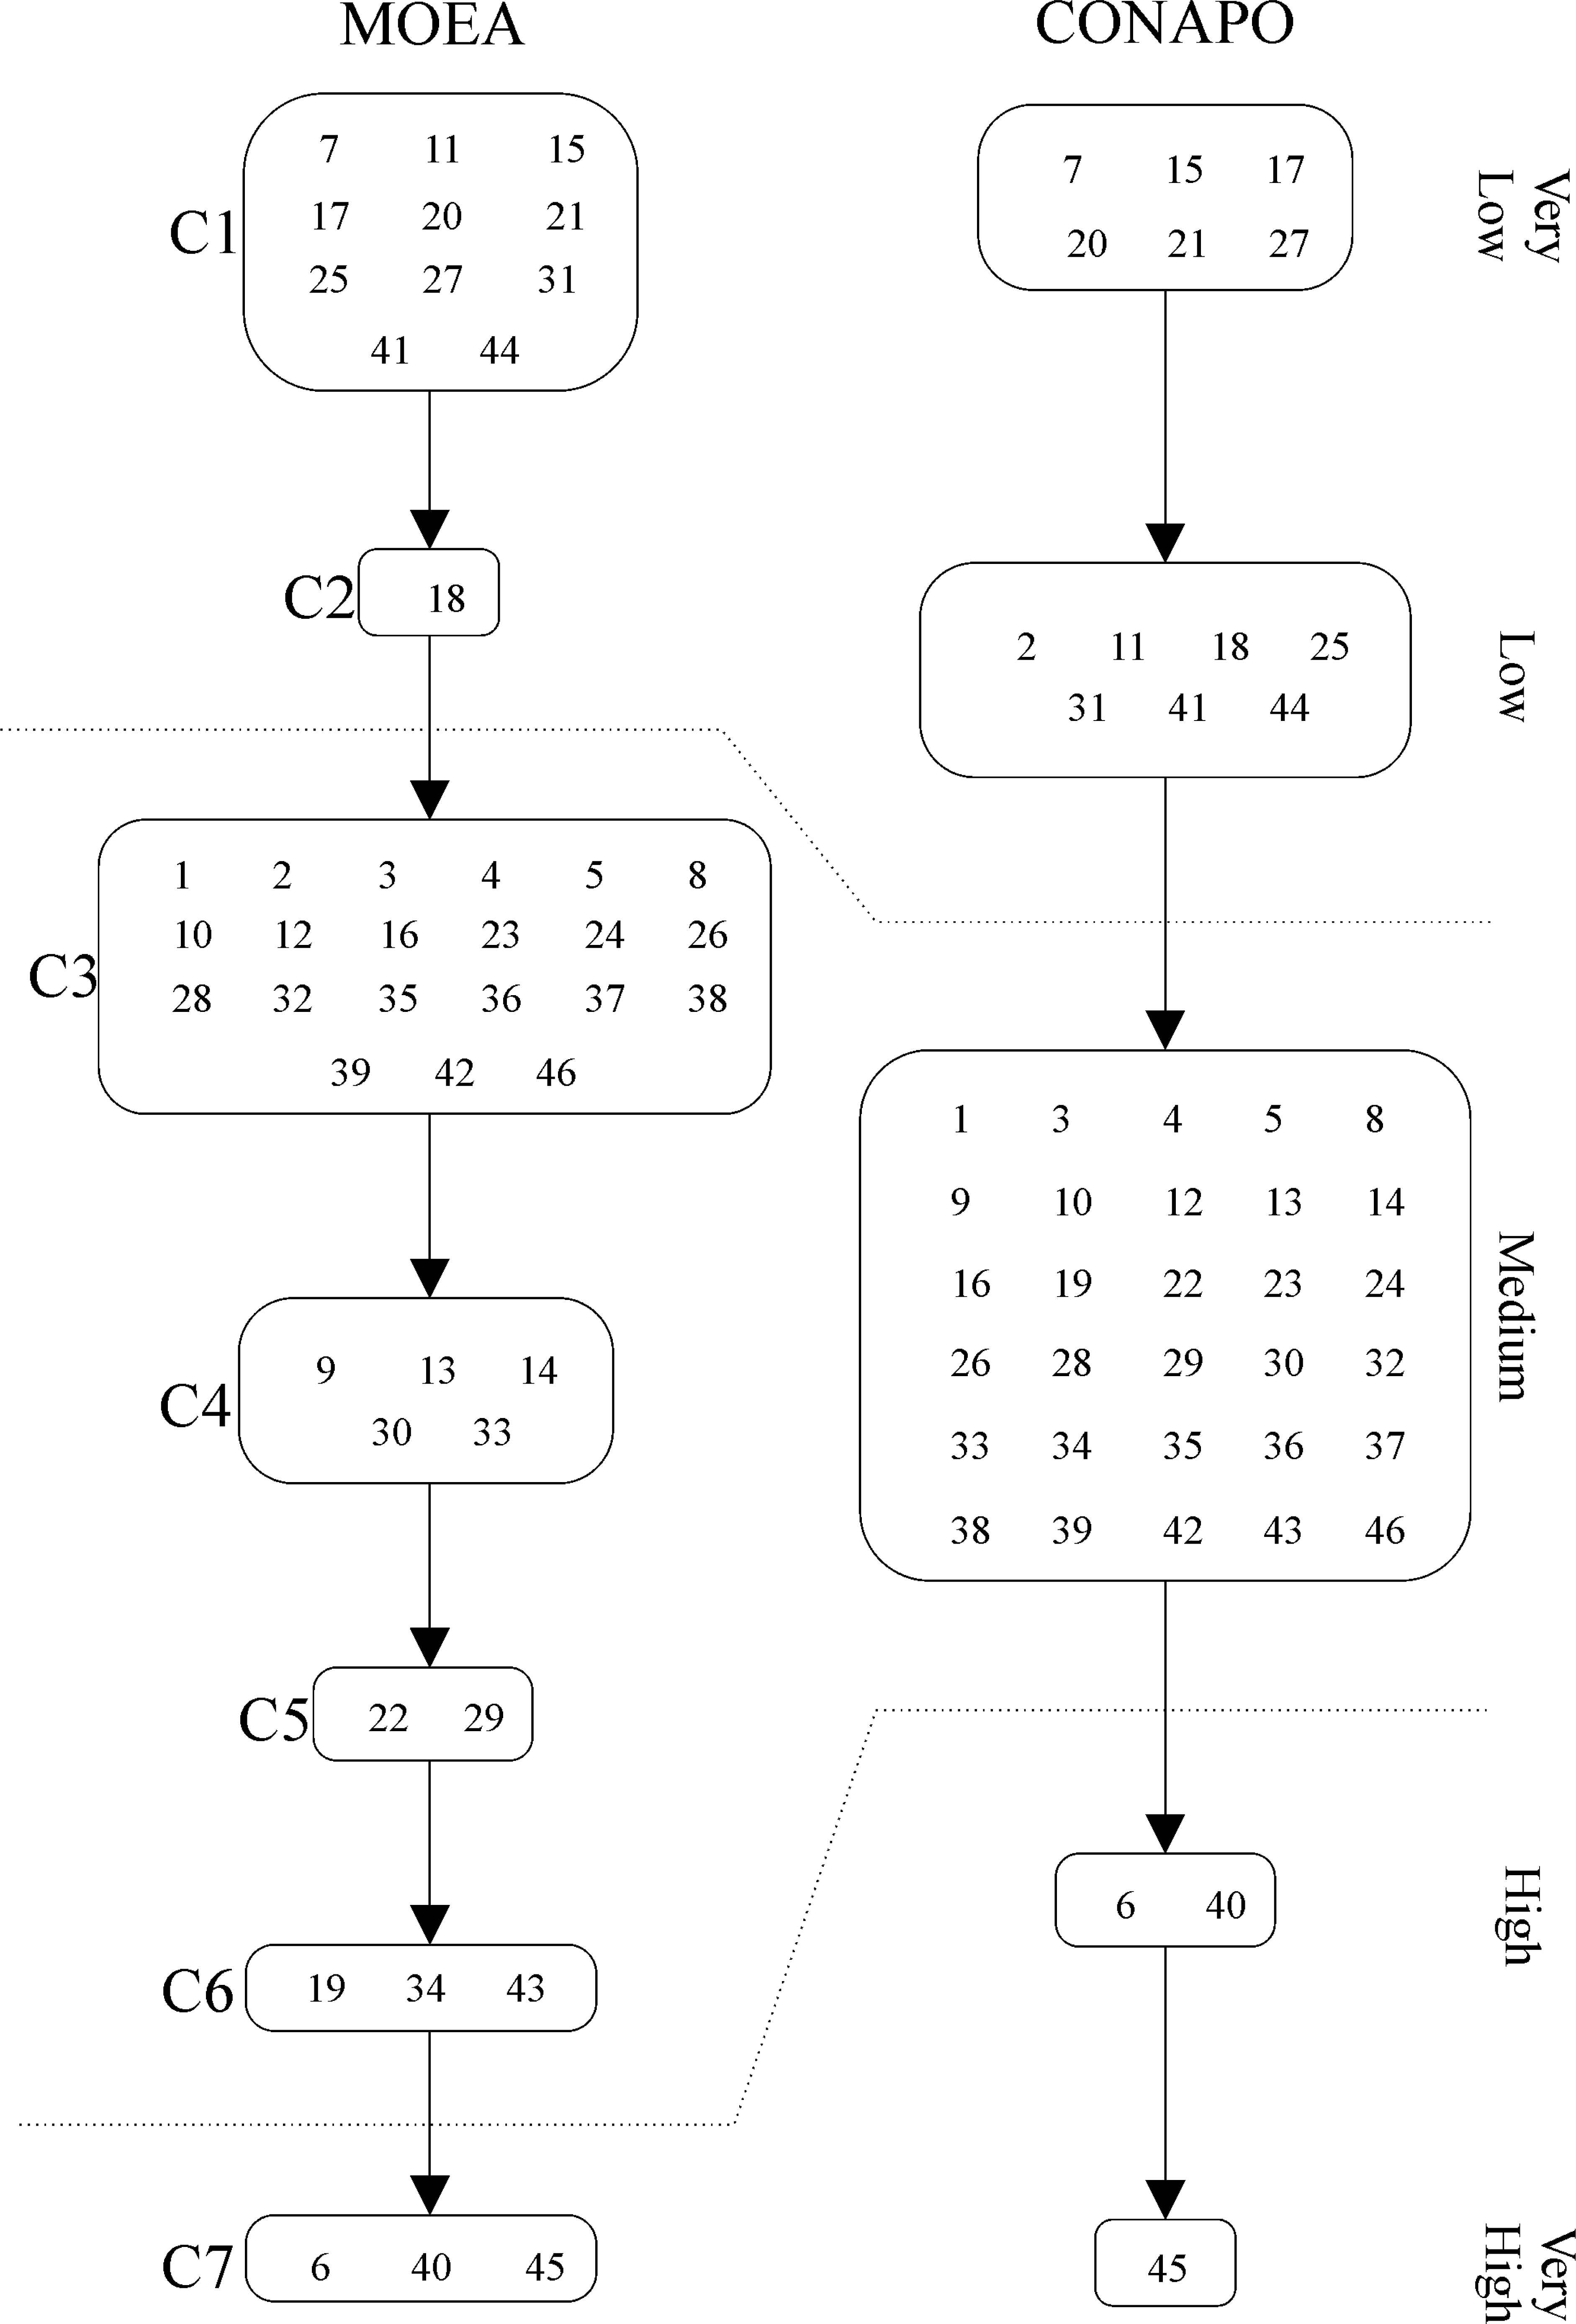
Classes of the MOEA RP2-NSGA-II (left) and stratifications created by CONAPO in ascending order of marginalization level. “C + number in subscript” identifies each class and each stratification has a label that indicates its marginalization level. Within brackets are the labels of the municipalities that belong to each class of stratification.
Additionally, in this analysis, the consistency of the ranking of CONAPO was evaluated using the objective functions defined in RP2-NSGA-II, considering the same outranking relation, with a lambda cut of 0.69 to evaluate the solution of the MOEA. From this evaluation, we obtained the values of fPk (A) =240 and gPk (A) =48, representing a total of 288 inconsistencies with respect to
5.4. Comparison against R-NSGA-II algorithm
In this section, we illustrate the distribution of the solutions of the RP2-NSGA-II, in the objective space, for the ranking of the municipalities of the State of Guanajuato, Mexico. We also, show the distributions for the R-NSGA-II results to make a comparison of both algorithms when looking to those solutions near the ROI.
For this comparison, we exploited the valued outranking relation obtained for the municipalities of the state of Guanajuato, México, ten times with the R-NSGA-II, using the same parameters used for the RP2-NSGA-II (number of generations of 1,000, a population size of 40, a crossover probability of 0.9, a mutation probability of 0.005 and a lambda value ranging from 0.60 ∼ 0.69) and an ε value of 0.0001. Then, from the set of non dominated solutions obtained in each of the ten executions, we obtained a final set of non dominated solutions to make the comparison with the results obtained with the RP2-NSGA-II. Figure 4 shows a general view, over the three objectives functions, of the non dominated solutions found with both methods. In this figure we can observe that most of the solutions, for both methods, were found with a lambda value of 0.69. In Fig. 5, we show a projection for two objective functions (fPk (A) and gPk (A)) for the λ − value of 0.69. In this projection we can see that the set of non dominated solutions of the RP2-NSGA-II dominates the set of non dominated solutions of the R-NSGA-II; we can also observe that the non dominated set of the RP2-NSGA-II has solutions closer to the ROI than the R-NSGA-II.
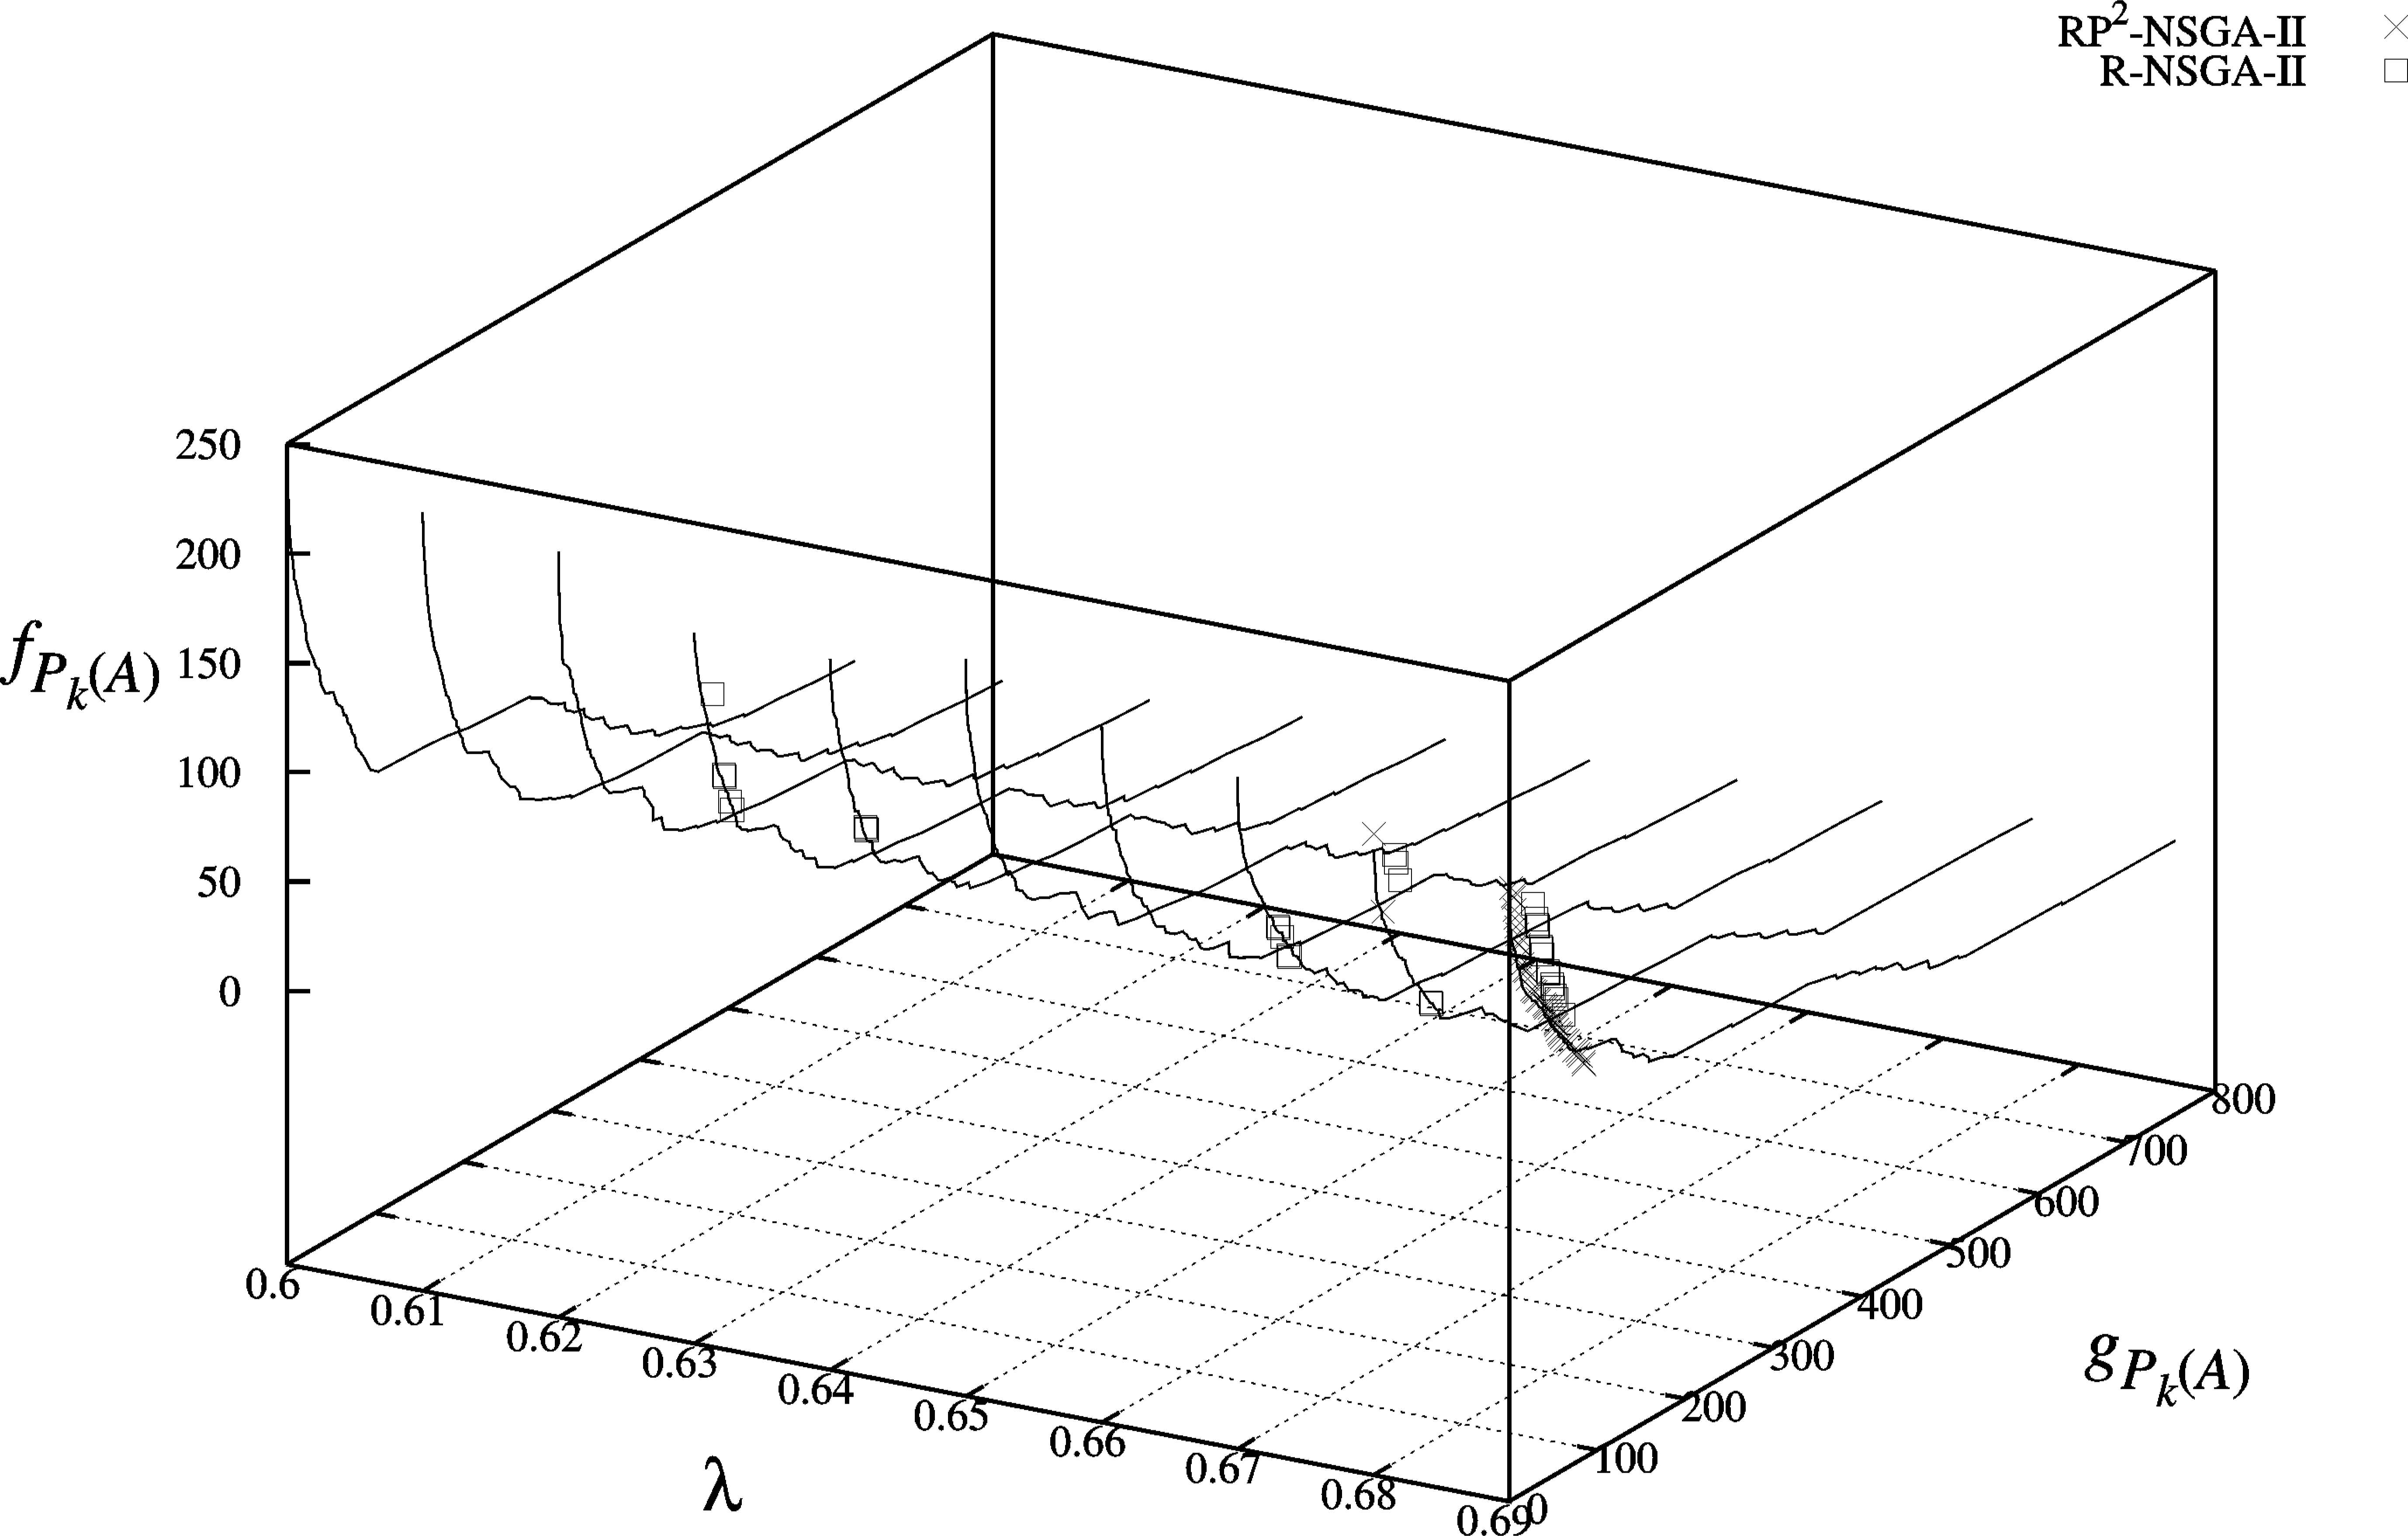
General view, over the three objectives functions, of the non dominated solutions found with the RP2-NSGA-II and the R-NSGA-II. The Pareto Fronts for each λ − value were obtained by executing the RP2-NSGA-II several times using the Crowding Comparison Operator in order to obtain a spread set of non dominated solutions in each lambda value. These Pareto Fronts are used only to have a reference of points (solutions) in the 3D space.
projection for two objective functions (fPk (A) and gPk (A)) for the λ − value of 0.69.
Table 10 shows the ten solutions in each non dominated set (R-NSGA-II and RP2-NSGA-II) showed in Fig. 5 with the lowest distance to the ROI. This distance is the Normalized Euclidean Distance (NED) used in Ref. 31 to measure the distance of one solution to the reference point. The NED was calculated using the following equation:
| R-NSGA-II | RP2-NSGA-II | ||||
|---|---|---|---|---|---|
| fPk (A) | gPk (A) | NED | fPk (A) | gPk (A) | NED |
| 52 | 94 | 2.1785 | 55 | 78 | 1.0235 |
| 50 | 98 | 2.1908 | 57 | 76 | 1.0243 |
| 54 | 92 | 2.1936 | 58 | 75 | 1.0251 |
| 49 | 100 | 2.1983 | 60 | 73 | 1.0274 |
| 44 | 107 | 2.2067 | 54 | 80 | 1.0312 |
| 45 | 106 | 2.2093 | 53 | 81 | 1.0314 |
| 38 | 116 | 2.2460 | 52 | 82 | 1.0319 |
| 37 | 119 | 2.2772 | 50 | 84 | 1.0337 |
| 36 | 120 | 2.2792 | 42 | 91 | 1.0412 |
| 33 | 130 | 2.3966 | 49 | 86 | 1.0431 |
The ten closest solutions to the ROI in each non dominated set (R-NSGA-II and RP2-NSGA-II) showed in Fig. 5.
6. Conclusions
This paper addressed the problem of multi-criteria ranking with a medium-sized set of alternatives. We formulated this problem as a multi-objective combinatorial optimization problem and proposed the RP2-NSGA-II procedure to solve it. The main objective in this paper was to propose an improved version of the MOEA presented in Ref. 15 that is capable of directly exploring a search space of partial orders of classes of alternatives instead of a search space of anti-symmetric crisp outranking relations from a medium-sized set of alternatives.
We proposed a representation of an individual for the evolutionary algorithm that can be decoded to form a partial order of classes of alternatives and studied the proposed RP2-NSGA-II by simulating several ranking problems with different sized sets and class structures.
The proposed RP2-NSGA-II is compared with the MOGA-H, NSGA-II, and R-NSGA-II algorithms on a set of simulated medium-sized ranking problems. The experiment results demonstrate that the proposed ranking procedure achieves good performances on the simulated ranking problems, and importantly outperforms the compared algorithms on finding the reference solutions. Based on the results from the empirical evaluation, we consider that this approach can be effectively used to exploit fuzzy outranking relations, with up to 60 alternatives to derive a ranking, which is highly consistent with the DM’s model of preferences.
In addition, the real case study we presented shows that we can apply the method with good results to problems where it is desirable to rank a medium-sized set of alternatives evaluated by multiple criteria under the outranking approach.
Appendix A.
References
Cite this article
TY  - JOUR
AU  - Juan Carlos Leyva López
AU  - Jesús Jaime Solano Noriega
AU  - Jorge Luis García Alcaraz
AU  - Diego Alonso Gastélum Chavira
PY  - 2016
DA  - 2016/08/01
TI  - Exploitation of a Medium-Sized Fuzzy Outranking Relation Based on Multi-objective Evolutionary Algorithms to Derive a Ranking
JO  - International Journal of Computational Intelligence Systems
SP  - 745
EP  - 764
VL  - 9
IS  - 4
SN  - 1875-6883
UR  - https://doi.org/10.1080/18756891.2016.1204122
DO  - 10.1080/18756891.2016.1204122
ID  - LeyvaLópez2016
ER  -