
A Novel Mechanism for Efficient the Search Optimization of Genetic Algorithm
- DOI
- 10.1080/18756891.2016.1144153How to use a DOI?
- Keywords
- Genetic algorithm; Adaptive Crossover; Adaptive Mutation
- Abstract
This paper proposes a Social Genetic Algorithm (SGA) that includes a transformation function that has ability to improve search efficiency. The SGA is different from the Traditional Genetic Algorithm (TGA) approaches, as it allows refinement of the TGA parameters for the selections of operators in each generation with two functions: optimization of crossover rate and optimization of mutation rate. In this paper, a new function that optimizes gene relationship has been introduced to advance the evolution capability and flexibility of SGA in searching complex and large solution space. Our proposed approach has been evaluated using simulation models. The simulation results have shown that SGA outperforms TGA in improving search efficiency. The contribution of the proposed approach is a dynamic and adaptive methodology, which has ability to improve efficiency.
- Copyright
- © 2016. the authors. Co-published by Atlantis Press and Taylor & Francis
- Open Access
- This is an open access article under the CC BY-NC license (http://creativecommons.org/licences/by-nc/4.0/).
1. Introduction
Selection, crossover and mutation are three GA’s operators used in the process of generating a set of solutions and then selecting an optimal one (Giddens, 1994; Kim and Cho 2015). Crossover is a process in which two selected individuals swap variables to produce two different individuals, which can then be added to the population. Crossover results in a random information exchange and each alternative solution created contains some of the characteristics of both parents (Moin et al., 2015). Mutation is a secondary operator in TGA and it has proven to be an essential component of the TGA paradigm (Long et al., 2015). After offspring have been produced, they are evaluated and may replace existing members in the population.
One of the key difficulties in TGA is to find equilibrium between exploitation and exploration in evolutions. Many studies have attempted to provide a better stability between them, but the equilibrium is not easy to achieve due to inversely associated factors i.e. selection pressure and population diversity (Fazlollahtabar et al., 2012; Tsai et al., 2008; Deep and Singh, 2015). Increasing population diversity will result in loss of selective pressure, whilst reducing selective pressure will increase the potential of exploration in the search space. Schaffer and Morishima (1987) introduced a mechanism of punctuated crossover in which distribution of crossover points is based on performance of the generated offspring and can identify the location of better crossover points. The outcome of this approach is better than the ones produced by other traditional crossover operators, but it effectively doubles the variable’s length.
The traditional optimization algorithms lack a dynamic adaptive mechanism to effectively search feasible solution pools and they also intend to adopt a fix structure in solution representation that leads to an inadequate efficiency in search. Most researchers use fixed crossover and mutation rates throughout the evolution process which could also hinder the search ability.
Considering these limitations in the traditional approaches, the proposed SGA is able to improve the efficiency of TGA evolution process. The improvement attributes to a novel transformation algorithm that is able to adaptively set crossover and mutation rates as well as optimizes gene relationships based on search states in each generation. This enhances the search capability and can be applied to optimize (Green Product Design; GPD) cost function by generating and evaluating different designs within affordable cost for the suppliers to meet dynamic market demands (Tsai et al. 2015). The rest of the paper is organized as follows. Section 2 presents literature review. Section 3 describes social genetic algorithm. Section 4 discusses simulation results of the proposed algorithm. Finally section 5 concludes the paper.
2. Literature Review
A chromosome is organized as a set of genes, which are sections of the chromosome representing individual variable (Schaffer and Morishima, 1987; Han et al., 2015; Wang 2015). It is therefore imperative to design a suitable structure of the chromosome. Individual chromosomes in population are given opportunities to reproduce, often referred to as reproductive trials for the production of offspring. The number of opportunities each individual has is proportion to its fitness, so the better individuals contribute more of their genes to the next generation. It is assumed that an individual having high fitness is due to the fact that it contains superior schemata (Ripon et al., 2007; Gibbs et al., 2008; Wang, 2015). As the composition of these genes significantly affects the TGA’s performance, an improper arrangement for the chromosome structure often results in poor performance (Schaffer, 1985).
Holland’s schema theorem (Holland, 1975) was the first attempt using formal descriptions to describe how a TGA works. A schema is a pattern of genes consisting of a subset of genes at certain positions in a chromosome (Moon, 1994). Schemata are also known as similarity subsets because they represent subsets of strings with similar patterns at certain fixed position. By passing more of these superior schemata on to the next generation, it increases the likelihood of finding better solutions. Schemata possess two essential properties: the order of the schema and its length.
The power of a TGA lies in it being able to find high-quality building blocks. These are schemata with short defining length consisting of bits which work well together, and they tend to lead to improved performance when they are incorporated into a chromosome (Schaffer, 1985). A successful coding scheme is one which encourages the formation of good building blocks by ensuring that related genes are close together in the chromosome, whilst there is only a little interaction between well separated genes (Rosca, 1995). However, when large numbers of interactions between genes are required or they cannot be avoided, Gibbs’s recommendations (Gibbs, 2008) should be taken into consideration in the design of the schemes to ensure that TGA performs well. In this research, we try to propose a transformation function to refine the chromosome structure in a dynamic adaptive TGA which conforms to Gibbs’s recommendations. Such a modification usually leads to an improvement in TGA’s search. The goal is to regain beneficial genes that were lost through poor selection of mates in the evolution process.
Alfaro et al. (2009) proposed an effective approach of adapting operator probabilities based on the performance of the operators. The conversion mechanism varies operator probabilities in proportion to the fitness value of strings created by the operators. The simulation results have shown a substantial improvement in the performance of a TGA. Hence, the dynamic demands for parameter settings have grown rapidly in recent years.
Eshelman et al. (1989) utilized a mechanism of mutation in which mutation rate is a dynamic parameter according to the Hamming distance between the parent solutions. The simulation outcomes have demonstrated significant improvements in TGA’s performance. Several researchers (Srinivas and Patnaik, 1994; Rosca, 1995) found that the crossover rate and mutation rate has great correlation with its fitness and the larger the crossover rate in combination with smaller mutation rate can get TGA better in search efficiencies (Thierens, 2007). They proposed different methods to determine the mutation rate specifically for each solution and maintain the exploration without affecting the exploitation properties. Hence, the study attempts to provide an interactive and analytic controller to find an optimal solution. It modifies the cost variable relationships and TGA parameters settings after each evolution according to the resulting fitness. In their research, they only carried out sensitivity analysis on either mutation rate or crossover rate in relation to fitness function, so they did not examine both rates at the same time due to lack of a transformation function to relate the behaviour of the rates to the outcome of fitness function.
We have designed a self-adjusting mechanism to enhance the versatility and generality of a TGA. The mechanism allows refinement of TGA parameters for the selections of operators in each generation (Tsai et al., 2008; Tsai et al., 2011). The parameters setting carried out by a transformation function are to tune the trade-off between exploration and exploitation in search space. The function varies the crossover and mutation rate at each evolving generation and their new rates are derived based on the assessment of the fitness value in order to prevent premature convergence. The transformation function uses evolution evidence, which includes the population diversity and the level of the parents’ fitness, to set TGA parameters dynamically on each generation. This function is the main body of Social Parameter Controller as part of the proposed SGA. The next section reports an overview on SGA with two controllers Social Parameter Controller and Social Relation Controller to optimize TGA social behaviors.
3. Social Genetic Algorithm
SGA can vary all of the process parameters in order to locate the global optimum in search space. However, an inherent problem of TGA is that much more time is wasted in tuning the parameter values (i.e. crossover and mutation rate). Hence, this research proposes a dynamic social function, which assists users in selecting optimal parameters for better solution of the problems. It attempts to balance the relationship between the exploration and exploitation search of TGA evolutions, which is aimed at improving the efficiency of TGA management. The main steps for TGA and SGA are summarized in Figure 1.
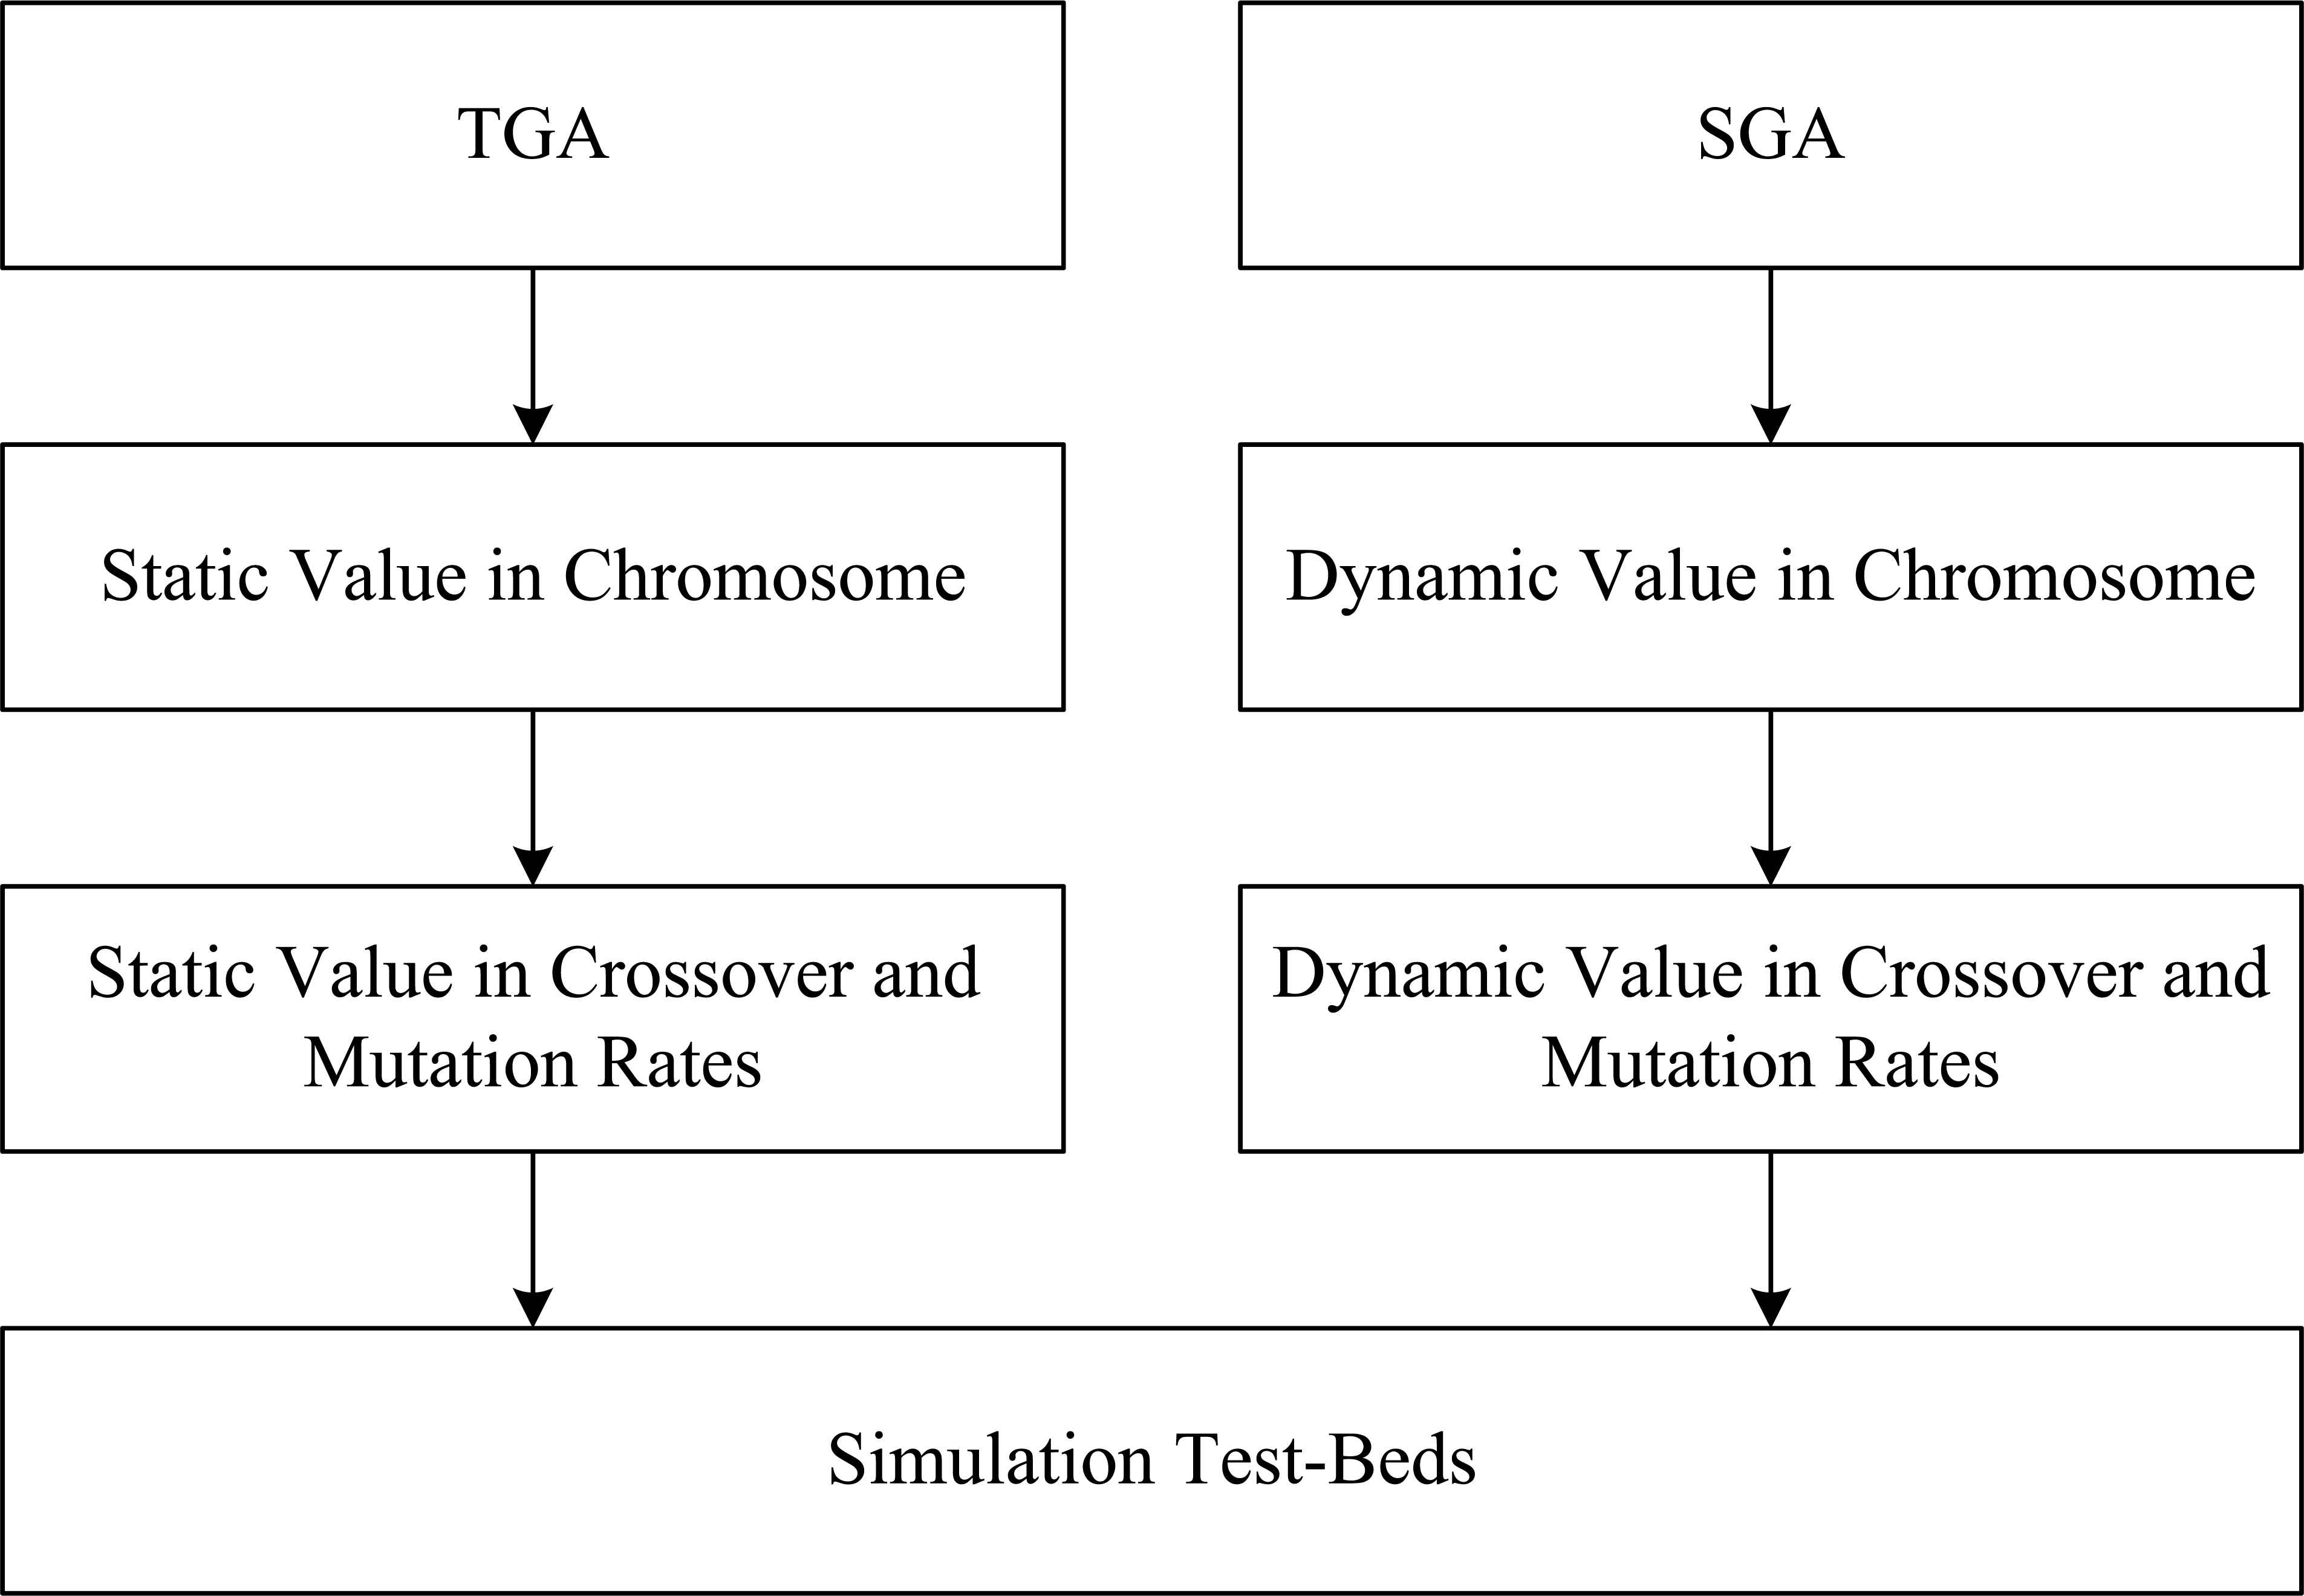
Process of TGA and SGA in simulation test-beds
3.1. Social-Parameter Controller for SGA Search Optimizer
The proposed SGA is able to optimize crossover and mutation rates to preserve beneficial factors in chromosomes. The preservation of beneficial cost variables is important, which are often necessary for complex problems with a rugged fitness landscape. It is therefore imperative to design an effective structure for modelling cost variables. Hence, the proposed approach employs dynamic social abilities and problem domain knowledge to adjust positions of related genes within variable structure. The transformation function in the Social Parameter Controller alters crossover and mutation rates in every evolution, and a new rate being established on a shifted fitness value. The algorithm applies evidence of shifted value, which presents the population diversity and the level of fitness deviation to manage TGA parameters. We also design an algorithm to optimize gene structure that is able to preserve positive building blocks. The detailed descriptions and analysis on Social Parameter Controller is omitted in this paper, as they can be found in our previous work (Tsai et al., 2008; Tsai et al., 2011). The next subsection will report Social Relation Controller, a new function in SGA.
3.2. Social-Relation Controller for SGA Search Optimizer
One of the main capabilities of the proposed mechanism is that it is capable of optimizing cost variables of fitness (cost) function by identifying their internal variables social-relations to form better chromosome structures in the evolution process (Han et al., 2015). Each cost variable in the fitness (cost) function is represented as strings to form part of chromosome, so a chromosome consists of a list of cost variables, which are also factors in the fitness function. It is necessary to group the important variables or critical factors of the fitness function together in the chromosome in order to identify and preserve beneficial ones.
We have designed a Social Relation Controller to automatically and systematically identify and preserve beneficial genes or cost variables. The controller includes three operations: Social Classification, Social Association and Social Sequencing to evaluate variables importance, give the appropriate weightings and reorder them. Social Classification Operation (SCO) evaluates the relative effect of each variable on the fitness (cost) function. Social Association Operation (SAO) assigns different weightings based on their relative effects. Social Sequencing Operation (SSO) optimizes the sequence of the cost variables to produce a refined chromosome structure to preserve positive building blocks (See Table 1). These three operations are invoked in sequence in each generation in the evolution process. After a number of generations, the controller is expected to preserve beneficial chromosomes. When the values of variables in the population are similar to each other, the evolution process converges. It means that parents and off-springs have similar chromosomes and an optimised solution is expected.
|
Process of Social-Relation operation
SCO evaluates the relative effect of each variable on the fitness function. It attempts to identify the beneficial variables within the cost variable structure in three steps. First, it calculates a ratio, called Affect Ratio (AR) of each variable, representing the relative fitness of the variables to the cost function (fitness function). It identifies and selects important variables based on the AR value of each variable. The second step sort the variables in descending order according to the AR values derived in Step 1.
The above fitness values derived from the SCO can be used in the next operation, SAO. The controller employs ratios of the fitness values to define the association relationships between variables. Step three is to divide variables into groups. Initially only two groups are designed to accommodate all variables. The important variables have higher AR. SAO uses AR values to re-sequence the order of variables as (V6, V4, V2, V3, V1, and V5). The control variables produce their ratio through the multiplication of their original variable ratios by the weights. After SCO and SAO have been carried out, it applies SSO to optimize the variable sequence of the cost variables to adjust the chromosome structure to preserve positive building blocks.
This approach employs the fitness ratios to sort the variables sequence within each variable according to descending order. Then SSO calculates the mean of the adjusted ratio and the control variable ratio to obtain a final fitness values for the variables for example V1, V5, and V3. After considering the importance of variables, the order of V6 and V3 and the order of V4 and V2 can be swapped, and the new sequence of their ratio is (V3, V2, V4, V6, V1, and V5); it shows that (V3) is the best one and (V5) is the worst one. Over a number of evolutions, the beneficial variables will be recognized and the positions will be fixed to produce a refined structure for the cost variables to adjust the chromosome structure to preserve positive building blocks. Table 2 illustrates using an examples the steps involved in Variable (Vi =1,…,n) Social-Relation operation.
|
An example of Social-Relation operation
After each cost variable has been refined, the evidence about fitness ratios for the variable social-ability and sub-variable societies can be collected. These can be used to assign weightings to individual objective functions, which have been ranked during the operations of TGA evolutions. This method presents an alternative approach to the refinement of cost variable structure based upon the building block theory (Schaffer, 1985; Rosca, 1995; Gibbs et al., 2008) to preserve beneficial cost variable.
4. Simulation Experiments
In this section, we will give an overview on the selected simulation test-beds and analyze the simulation results. Various benchmark functions (Fogarty, 1989; Giddens, 1994; Jason and Konstantinos, 2002; DeJong, 2007; Eiben et al., 2007) were adopted to test the TGA and the proposed SGA such as [T1-T8] unimodal functions in Table 3, and [T9-T16] multimodal functions in Table 4. T1 is a smooth, unimodal, continuous, and strongly convex function. T2 is a sharp and parabola function. T3 is a continuous, convex and unimodal function. T4 is a flat step function. It is also a unimodal function (Quadratic with Noise function), which is more complicated model than the previous functions. T5 is a three dimensional function: (continuous, convex, low-dimensional quadratic, unimodal function). T6 is a devilish two-dimensional function: (continuous, non-convex, low-dimensional quadratic, unimodal function). T7 is a five dimensional function that has flat step surfaces surrounded by discontinuities (discontinuous, non-convex, step, unimodal function). T8 is a 30 dimensional function that evaluation is modified by Gaussian noise: (continuous, convex, low-dimensional quadratic, unimodal function) (DeJong, 2007).
|
|
|
|
|
|
|
|
|
|
|
|
|
|
|
|
[T1-T8] functions are unimodal functions
|
|
|
|
|
|
|
|
|
|
|
|
|
|
|
|
[T9-T16] functions are multimodal functions
T9 is a DeJong Foxholes function that extended shaped basin has been frequently applied in evaluating the presentation/efficiency of optimization algorithms. T10 is a comprehensive optimal function (N-hump camel back function) (Eiben et al., 2007). T11 (Rastrigin function) is a continuous, convex and unimodal function that is a highly multimodal with the dispersed local minima (Jason and Konstantinos, 2002). T12 is a Griewank function with a global minimum value to zero. T13 is a famous multimodal function (Ackley’s Path function plot in X-Y axis from -30 to 30) (DeJong, 2007). T14 is a two dimensional function that has many local minimum: (continuous, non-convex, non-quadratic, two-dimensional function). T15 is a Rosenbrock function that is a non-convex function; the global minimum is inside a long, narrow, parabolic shaped flat valley. T16 is a many oscillations and peaks testing function which is difficult for hill-climbing techniques.
We have chosen parameters settings for our experiments in accordance with previous studies (Fogarty, 1989; Giddens, 1994; Jason and Konstantinos, 2002; DeJong, 2007; Eiben et al., 2007) and we were able to produce better simulation results for the TGA. Parameters in our experiments were set as follows (1): Population Sizes: 30, (2): Crossover rates: 0.85, (3): Mutation rate: 0.05, and (4): Generations: 150. The TGA and SGA were tested on three different groups of test-suite functions and the results are average outputs over 50 trials. (see Tables 5 and 6)
| TGA | SGA | ||
|---|---|---|---|
| Minimum | IR% | ||
| T1 | 0.0532500 | 0.0113520 | 78.68 |
| T2 | 4.7979530 | 0.7010180 | 85.38 |
| T3 | 35.0000000 | 32.9842900 | 5.75 |
| T4 | 12.2162300 | 11.4282500 | 6.45 |
| T5 | 0.0010000 | 0.0001000 | 90.00 |
| T6 | 0.0020000 | 0.0000100 | 99.50 |
| T7 | −4.0000000 | −4.0000000 | 00.00 |
| T8 | −3.5200000 | −3.7700000 | 7.10 |
| Mean | IR% | ||
| T1 | 1.5688650 | 0.0814150 | 94.81 |
| T2 | 5.7122530 | 3.7382520 | 34.55 |
| T3 | 36.2304900 | 35.1077500 | 3.10 |
| T4 | 16.9344300 | 14.0009700 | 17.32 |
| T5 | 0.0050000 | 0.0020000 | 60.00 |
| T6 | 0.0016000 | 0.0008000 | 50.00 |
| T7 | −3.1300000 | −3.4600000 | 10.54 |
| T8 | −2.0500000 | −3.2400000 | 58.05 |
| Maximum | IR% | ||
| T1 | 26.94588 | 1.76492 | 93.45 |
| T2 | 9.679126 | 13.90071 | −43.61 |
| T3 | 42.28102 | 37.5 | 11.30 |
| T4 | 40.26505 | 26.91952 | 33.14 |
| T5 | 0.02 | 0.0026 | 87.00 |
| T6 | 0.045 | 0.003 | 93.33 |
| T7 | −2.3 | −3.1 | 34.78 |
| T8 | −0.891 | −2.4 | 169.36 |
[T1-T9] test-beds are unimodal functions
| TGA | SGA | ||
|---|---|---|---|
| Minimum | IR% | ||
| T9 | 0.8065100 | 0.1217130 | 84.90 |
| T10 | 0.0000037 | 0.0000003 | 91.55 |
| T11 | 9.3071540 | 6.6021360 | 29.06 |
| T12 | 0.0003220 | 0.0000092 | 97.15 |
| T13 | 0.0266140 | 0.0117890 | 55.70 |
| T14 | 0.0010000 | 0.0010000 | 00.00 |
| T15 | 0.278013 | 0.736386 | −164.87 |
| T16 | 0.064051 | 0.102043 | −59.31 |
| Mean | IR% | ||
| T9 | 1.3769850 | 0.3270320 | 76.25 |
| T10 | 0.0000044 | 0.0000004 | 91.11 |
| T11 | 11.0838000 | 11.3969600 | −2.82 |
| T12 | 0.0235310 | 0.0000319 | 99.86 |
| T13 | 1.6230610 | 0.0144760 | 99.10 |
| T14 | 0.0020000 | 0.0015000 | 25.00 |
| T15 | 0.622548 | 1.596364 | −156.42 |
| T16 | 0.113383 | 0.284378 | −150.81 |
| Maximum | IR% | ||
| T9 | 3.192121 | 0.655709 | 79.45 |
| T10 | 0.00008553 | 0.00000772 | 90.97 |
| T11 | 23.79152 | 33.43348 | −40.52 |
| T12 | 0.631663 | 0.0004838 | 99.92 |
| T13 | 14.42809 | 0.288858 | 97.99 |
| T14 | 0.003 | 0.002 | 33.33 |
| T15 | 1.990089 | 5.021993 | −152.35 |
| T16 | 0.25251 | 0.449802 | −78.13 |
[T9-T16] test-beds are multimodal functions
The simulation results show that SGA performs better than TGA on (T1 and T5 and T6 and T8) unimodal functions. SGA performs similar results to TGA on (T2 and T3 and T4 and T7) functions.
The simulation results show that SGA achieves better performance on the high-dimensional functions than TGA (T9 and T10 and T12 and T13) functions. SGA performs similar results to TGA on (T11 and T14) functions. TGA performs better than SGA on (T15 and T16) functions. A powerful search model for exploration normally has ability to cope with multimodal functions. The results indicate that SGA is a strong exploration model and is particularly good at coping with unimodal functions and multimodal functions search environments. From our simulation results we can conclude that SGA outperforms the traditional TGA in this case.
5. Conclusions
The contribution of our proposed SGA is to design two novel controllers, which enable better selections of chromosome structure and TGA’s search parameters for searching optimization. The first controller is a social relation controller, which includes the transformation functions to identify the gene’s social-relation abilities of chromosome structure. It enables to select better gene structure to preserve positive building blocks for chromosome structure optimization. The second controller is an adaptive social-parameter controller, which enables to select the better parameters for TGA’s search. We verify the performance of our novel SGA functions comparing with the TGA in simulation testbeds successfully.
The SGA has been implemented as a prototype system and tested on simulation test-beds with different search landscapes formed by multimodal and unimodal functions. The results show that SGA performs better than TGA in non-linear and high-dimensional spaces. This is due to ability of our proposed methodology that systematically and effectively varies crossover and mutation rates as well as refines chromosome structures in TGA to achieve the better optimum. In future study, further experiments will be carried out by applying the proposed approach to wider applications such as Service-Oriented Computing (Immonen and Pakkala, 2014; Huber et al., 2014; Grolinger et al., 2014).
References
Cite this article
TY  - JOUR
AU  - Chen-Fang Tsai
AU  - Shin-Li Lu
PY  - 2016
DA  - 2016/01/01
TI  - A Novel Mechanism for Efficient the Search Optimization of Genetic Algorithm
JO  - International Journal of Computational Intelligence Systems
SP  - 57
EP  - 64
VL  - 9
IS  - 1
SN  - 1875-6883
UR  - https://doi.org/10.1080/18756891.2016.1144153
DO  - 10.1080/18756891.2016.1144153
ID  - Tsai2016
ER  -