
A Distributed Urban Traffic Congestion Prevention Mechanism for Mixed Flow of Human-Driven and Autonomous Electric Vehicles
- DOI
- 10.2991/ijcis.d.210608.001How to use a DOI?
- Keywords
- Support vector regressions; Optimization; Intelligent transportation systems; Autonomous mobility-on-demand; Congestion control; Machine learning
- Abstract
Traffic congestion in urban areas has become a critical problem that municipal governments cannot overlook. Meanwhile, mixed traffic systems containing both autonomous and human-driven electric vehicles ramp up the challenge for traffic management in urban areas. Although numerous researchers have proposed traffic control heuristics to alleviate traffic congestion problems in the recent literature, scant research has addressed the joint problems of route and charging strategies for electric vehicles along with urban traffic congestion prevention. Accordingly, this work tackles the complex task of traffic management in urban areas during peak periods by using practical congestion prevention strategies that consider the characteristics of mixed traffic flows and the charging demands of electric vehicle users. Notably, we apply support vector regressions to compute the charging time at each charging point and the traverse time of an electric vehicle at each road segment/intersection, based on historical traffic data. The simulation results reveal that the proposed algorithms are feasible because they can avoid possible occurrences of traffic congestion during rush hours and provide the routes and charging options that are chosen by electric vehicle users.
- Copyright
- © 2021 The Authors. Published by Atlantis Press B.V.
- Open Access
- This is an open access article distributed under the CC BY-NC 4.0 license (http://creativecommons.org/licenses/by-nc/4.0/).
1. INTRODUCTION
The world has experienced dramatic urbanization in recent decades. In 1950, only 30% of the world’s total population lived in cities. However, following the baby boom after the Second World War, dramatic global population expansion has been accompanied by concentration of populations in cities. The latest United Nations statistical report [1] estimates that by 2050, the global population will surge to 9.7 billion, with 68% of the population living in urban areas. This means the problems of traffic congestion, traffic accidents, and air pollution caused by rapidly increasing numbers of vehicles and population growth in urban areas cannot be ignored. Although the central and local governments of many countries have proposed various traffic management plans to alleviate traffic congestion in urban areas, huge volumes of privately owned vehicles simultaneously traversing specific popular road segments during commute times still causes inconvenience and serious economic losses for most societies.
In recent years, many vehicle users have come to rely on vehicle navigation systems installed in their automobiles to recommend less-congested routes they can follow instead of taking the shortest paths. However, as illustrated in [2], widespread usage of vehicle navigation systems often leads to network state oscillations and makes traffic congestion worse. Meanwhile, the congestion problem is exacerbated further by the unpredictability of driving behavior and fluctuating traffic conditions during commute times. In the recent literature, although researchers have presented route reservation mechanisms to prevent road traffic congestion in urban areas [3], vehicle reservation cancellations were not considered in those studies. In addition, early and late vehicle arrivals at the road segments caused by prediction errors also tended to weaken the congestion control effect.
Besides the traffic congestion problem, owing to concern over greenhouse gas emissions, many countries have announced and promoted policies to ban the sale of fossil fuel-powered vehicles, and plan to prohibit the sale of some or all such vehicles in the next few decades. Electric vehicles (EVs) that use green energy to reduce carbon emissions are currently recognized as the best alternative to traditional automobiles in the future. However, an important issue to be solved in the future development of EVs is the convenience of EV charging. Most EVs are currently charged at charging stations, homes or workplaces. Due to the limited capacity of EV batteries, if their storage capacity is insufficient, EVs need to find a charging station on the route for replenishment.
Driven by the upsurge in the popularity of EVs, self-driving technology has received more attention than ever. Although the two are completely different technologies that do not need to be combined, and both can operate independently, the major reason why automakers have accelerated their investment in self-driving technology research and development is that Tesla has combined EVs with self-driving technology, and has established an industry benchmark, to some extent. It will be difficult for other automakers to compete with Tesla if their EV products are not equipped with self-driving technology to improve the safety and comfort of EVs.
In the literature, numerous studies have aimed at taking action at congested spots to mitigate traffic jams. Researchers also have been paying attention to traffic management of mixed traffic systems containing both connected and automated vehicles (CAVs) and human-driven vehicles (HDVs). To the best of our knowledge, scant research work in the literature has tackled the joint problem of traffic congestion prevention, mixed traffic flow management, and route/charging planning for EVs. Accordingly, this work presents a novel traffic management scheme that integrates route/charging planning for EVs and urban traffic congestion control. A mixed traffic system that includes both CAVs and HDVs is considered in this work. Notably, to reduce the number of vehicles driving on the roads effectively, only CAV fleet vehicles are allowed to provide ride-sharing mobility-on-demand (MoD) services during peak periods, whereas traditional vehicle drivers can own either CAVs or HDVs.
An adaptive traffic control mechanism is applied to each expressway or to portions of busy local roads during peak periods. Here we adopt prerouting and rerouting reservation schemes to control traffic flow during rush hours. An EV is required to make a prerouting reservation before its departure. In the meantime, portions of traffic volumes on each road segments under traffic control during peak periods are reserved for the EVs that have already departed from their origins. In the case where some EVs do not arrive at certain road segments on time after making a reservation, this kind of reassignment mechanism can boost the traffic volumes on under-utilized road segments during peak hours. In addition, no traffic control is applied to public transportation, so as to provide an incentive for the public to take public transportation to help mediate urban traffic congestion.
If an EV needs to recharge on the way to its destination due to a battery electricity shortage, three charging options, including plug-in charging stations [4], battery-swapping services [5], and on-road wireless charging [6], can be chosen according to a specific charging preference set by an EV driver. In contrast, the most convenient charging option is selected for the CAV fleet vehicles that are offering ridesharing MoD services before recharging. A series of simulations were conducted to examine the effectiveness of the proposed work. The simulation results reveal that the proposed mechanism can improve urban traffic flows during peak hours and meet the demands of EV users effectively.
The remainder of this paper is organized as follows. Section 2 gives a detailed description of the proposed mechanism. The simulation results and the conclusions are given in Sections 3 and 4, respectively.
2. RELATED WORK
In this section, we discuss on related work of this paper in three aspects, including the recent research progress about urban traffic control, mixed traffic flow management, and the route/charging planning of EVs.
In the recent literature, numerous studies are being conducted to develop solutions for improving the performance of urban traffic networks. To name a few, Artuñedo et al. proposed an algorithm for cooperative control of urban subsystems to provide a solution for mobility problems in urban areas [7]. The interconnected traffic lights controller network adapts traffic lights cycles, based on traffic and air pollution sensory information, in order to improve the performance of urban traffic networks. Godoy et al. conducted a driverless experiment consisted of a 100-km route around Madrid in Spain, including both urban and motorway environments [8]. A leading vehicle shares information about its route in real time. A trailing vehicle is able to follow the leader’s trajectory using a combination of fuzzy logic controllers. Castaño et al. presented a self-tuning method to maximize the reliability of LiDAR sensors network for obstacle detection in the Internet of Things mobility scenarios [9]. The experimental results demonstrated that the self-tuning method is an appropriate strategy to increase the reliability of the sensor network while minimizing detection thresholds. Chu et al. proposed an advantage actor critic based multi-agent reinforcement learning algorithm for scalable adaptive traffic signal control in urban traffic networks [10]. A spatial discount factor was introduced to reduce the learning difficulty. Yao et al. proposed a dynamic predictive control framework for traffic signal control in a cross-sectional vehicle infrastructure integration environment [11]. Li et al. proposed a multi-agent reinforcement learning method to achieve optimal traffic control by enhancing the cooperation between traffic signals [12]. By introducing the knowledge-sharing enabled communication protocol, each agent can access to the collective representation of the traffic environment collected by all agents. Boukerche et al. employed reinforcement learning agents to cooperatively control the traffic signals by improving the reward and state representation based on the state-of-the-art max-pressure control theory [13]. A traffic state prediction method was proposed to address the data transmission delay issue by decreasing the discrepancy between the real-time and delayed traffic conditions. Mou developed a signal timing control model to optimize road capacity, delay time and the number of stops at the intersections, based on total signal cycle time, green light time and the maximum number of vehicles in each direction of intersection [14]. Liu et al. proposed a traffic flow control model to deal with the uncertainties in the turning ratio by using distributionally robust chance constraints [15]. The model allows one to compute the optimal control action that maximizes some objective, under all possible distributions of network parameters. Li et al. proposed a data augmented deep behavioral cloning method to imitate the problem-solving skills of traffic engineers [16]. Their method was under a conceptual parallel learning framework that incorporates machine learning techniques for solving decision-making problems in complex systems. You et al. employed a stochastic Markov decision process to model the stochastic behaviors of the vehicles in highway traffic [17]. The state of their model is dynamically modified based on the complicated traffic information.
In recent years, researchers started to focus on traffic management of mixed traffic systems containing both CAVs and HDVs. To name a few, Du et al. proposed a coupled vehicle-signal control method to optimize the traffic signal timing and driving trajectories of CAVs [18]. The signal timing is continuously optimized to minimize the total delay at the intersection. CAVs generate eco-driving trajectories using the received signal timing information and the planned arrival time to reduce fuel consumption. Feng et al. proposed a robust platoon control framework for mixed traffic flow based on tube model predictive control (MPC) [19]. The prediction uncertainty is dynamically mitigated by the feedback control and restricted inside a set with a high probability. Bahrami and Roorda formulated the multi-class traffic assignment problem as a nonlinear complementarity problem to find optimal traffic management policies [20]. Zheng et al. proposed a stochastic model for mixed traffic flow [21]. They used the proposed model to investigate the interaction between CAVs and HDVs. Li et al. proposed a theoretical model to demonstrate that road capacity can be increased with proper Right-of-Way reallocation for the mixed flow [22]. Kamal et al. presented an adaptive traffic signal control scheme for mixed traffic scenario at a road intersection [23]. The traffic signals are optimized to minimize the total crossing time of all vehicles. Qi et al. analyzed the mixed traffic dynamics of CAVs and HDVs, and derived the arrival–departure curves relationship using a combination of Newell car-following and Akçelik acceleration model [24]. Yang et al. proposed a hierarchical and cooperative driving framework for mixed traffic flow on urban arterials [25]. The proposed framework combined centralized and distributed control concepts, where the infrastructure generates optimal signal timing plans and provided high-level trajectory guidance to the CAVs while detailed trajectories are generated by each vehicle. Sharma et al. utilized intelligent driver model (IDM) with estimation errors to model HDVs since it incorporates human factors such as estimation errors [26]. Connected vehicle driving strategy integrated with IDM was utilized to model CAVs because it incorporates driver compliance, which is a critical human factor for the success of CAVs. Guo and Jia proposed an inverse MPC-based approach to model and predict the longitudinal behaviors of HDVs in connected mixed traffic environments [27]. Its predictions can be utilized by the MPC of following CAVs for improved control accuracy, riding comfort, and energy efficiency. Wu et al. developed a distributed control framework for the cooperative control of mixed urban and freeway traffic networks [28]. A MPC strategy was applied to optimize the traffic signals in the urban network and the variable speed limits in the freeway network. Ngoduy et al. proposed a dynamic system optimum formulation for the multi-class dynamic traffic assignment (DTA) problem of fixed traffic flow [29]. The proposed method used the concept of link based approach to develop a multi-class DTA model that equally distributes the total physical queues over the links while considering explicitly the variations in capacity and backward wave speeds due to class proportions. Wang et al. proposed a multi-class traffic assignment problem with elastic demand to estimate the impacts of link tolls on equilibrium flows [30]. It not only enhances behavioral realism for modeling the route choices of HDV and CAV travelers by considering their knowledge level of traffic conditions but also captures the elasticity of both HDV and CAV demand in response to link toll rates.
In addition to the urban traffic management problem, the route/charging planning of EVs has attracted researchers’ attention in recent years due to deteriorated urban air quality. To name a few, Zhang et al. proposed a charging guidance strategy for urgent charging EVs to fast charging stations based on the virtual service range [31]. Ammous et al. proposed formulated a joint problem of minimizing the average trip time for an EV and the average cost of charging as a dual-objective convex optimization problem [32]. Moradipari and Alizadeh designed optimal pricing and routing schemes for the setting that users choose their priority level and energy request amount from the differentiated service offered by EV public charging stations owned by a charging network operator [33]. An EV routing problem with time windows was investigated in [34] through integrating decisions on two charging options of partial recharging and battery swapping. A mixed integer programing model was developed to solve the optimization problem. Qian et al. proposed a deep reinforcement learning-based EV charging navigation that minimizes the total travel time and the charging cost at charging stations [35]. They formulated EV charging navigation as a Markov Decision Process with an unknown transition probability. Chen et al. proposed a bi-level mathematical model to derive optimal design that minimize the joint cost of facility constructions and EV drivers’ travel and waiting time over the network [36]. Basso et al. proposed a probabilistic energy consumption model with machine learning that can estimate the expected energy and variance for the road links, paths, and routes [37]. A two-stage routing model that incorporates energy prediction and plans partial recharging using chance constraints was presented to provide reliable routing of EVs. Chakraborty et al. proposed a heuristic to ensure that the EVs can always route through a path that minimizes the energy consumption and the total time to travel [38]. A multi-objective optimization problem considering real-world specifications and constraints was formulated and a graph-based multi-objective heuristic algorithm was proposed to obtain the desired solutions quickly. Bac and Erdem proposed a framework of EV routing problem with time windows [39]. Partial recharging was considered in the framework with the multiple depots and heterogeneous fleet structure under real-life constraints such as multiple customer visits.
3. URBAN TRAFFIC CONTROL MECHANISM FOR MIXED TRAFFIC FLOW
In this work, all road segments in the whole metropolitan area are managed by an urban traffic control center. The traffic flow at each road segment under traffic control is divided into two categories: one is for EVs reserving their routes before departure and the other is for the EVs that are on the way to their destination. As shown in the middle-left of Figure 1, a prerouting module is used by an EV user to select and reserve the most appropriate candidate route for an EV from its origin to the destination. This is done before departure based on the historical traffic data. In the case of a possible electricity shortage of the EV battery during the trip, this module determines the route and charging point based on the preset priority. Notably, support vector regressions (SVRs) are applied to compute the charging time at each charging point, and the traverse time of an EV at each road segment/intersection, based on the historical traffic data. The SVR method was chosen because it has been proven to predict traffic flows with a high degree of accuracy and to perform traffic data analysis well in the literature [40].
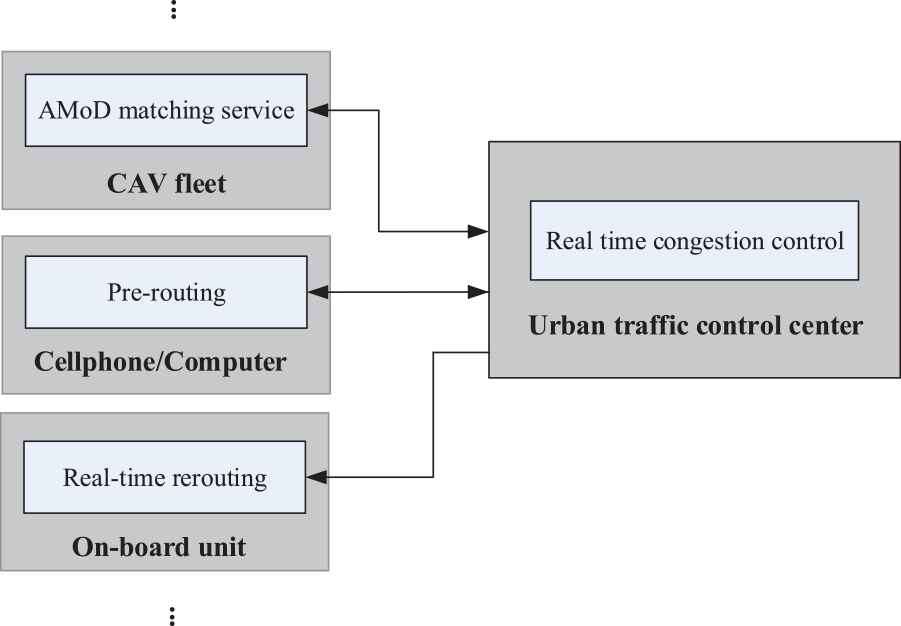
Architecture of urban traffic control mechanism for mixed traffic flow.
Once the EV prerouting module computes the most appropriate route from the origin to the destination that fits the preset preference of an EV, the module then sends reservation requests for the road segments on the route to the urban traffic control center. Since deviations between the prediction computed by SVRs and the real-time traffic and charging conditions might be significant enough to affect the real-time urban traffic condition, especially during rush hours, a real-time congestion control module, as shown on the right of Figure 1, is adopted by the urban traffic control center to deal with the volatile traffic conditions. Road segment reservation and cancellation requests from EVs are updated at the urban traffic control center during a fixed short interval, which can be dynamically adjusted by the urban traffic management control center during peak periods.
At the end of the preset short interval, the urban traffic control center sorts the road segment reservation request queues and determines whether an EV is allowed to drive on designated road segments during rush hours. In case of no route being available due to traffic control policies, the EVs that are declined permission to drive on some popular routes then turn to finding another less-saturated route to their destination. Notably, the ratios of approvals for the road segment reservations of EVs that carry one, two, or more passengers can be set up dynamically for different expressways and local roads during peak periods. In addition, the local roads that are less saturated are not subject to traffic control in order that the entire urban area can be connected, and late-booking EVs that are denied permission to drive on popular expressways and local roads are still capable of reaching their destinations during peak periods.
In addition to the prerouting module mentioned above, this work allows a moving EV to employ the real-time rerouting module (as shown in the bottom-left of Figure 1) to find a better route that fits the demand of the EV. Each moving EV regularly checks whether the arrival time at each road intersection on the route is earlier than or delayed from the originally estimated time. If so, the reroute process will be activated to find a less-congested route to the destination, as this work reserves a proportion of traffic volumes for real-time driving EVs. The ratio of the prerouting EVs to the real-time rerouting ones at a road segment can be adjusted for different expressways and local roads. Meanwhile, this work only allows CAVs to drive on expressways during peak hours to ensure smooth traffic flow on expressways in the urban area.
As shown in the top-left of Figure 1, in the case of there being no satisfactory route due to traffic congestion in the urban area, the EV users will request rideshare service from an autonomous mobility-on-demand (AMoD) fleet. If no rideshare service suits a passenger’s need, scheduled information about public transportation is suggested as an alternative means of transportation.
A brief flow chart of the proposed urban traffic control mechanism for mixed traffic flow is illustrated in Figure 2. The detailed descriptions of the above-mentioned modules are given below.
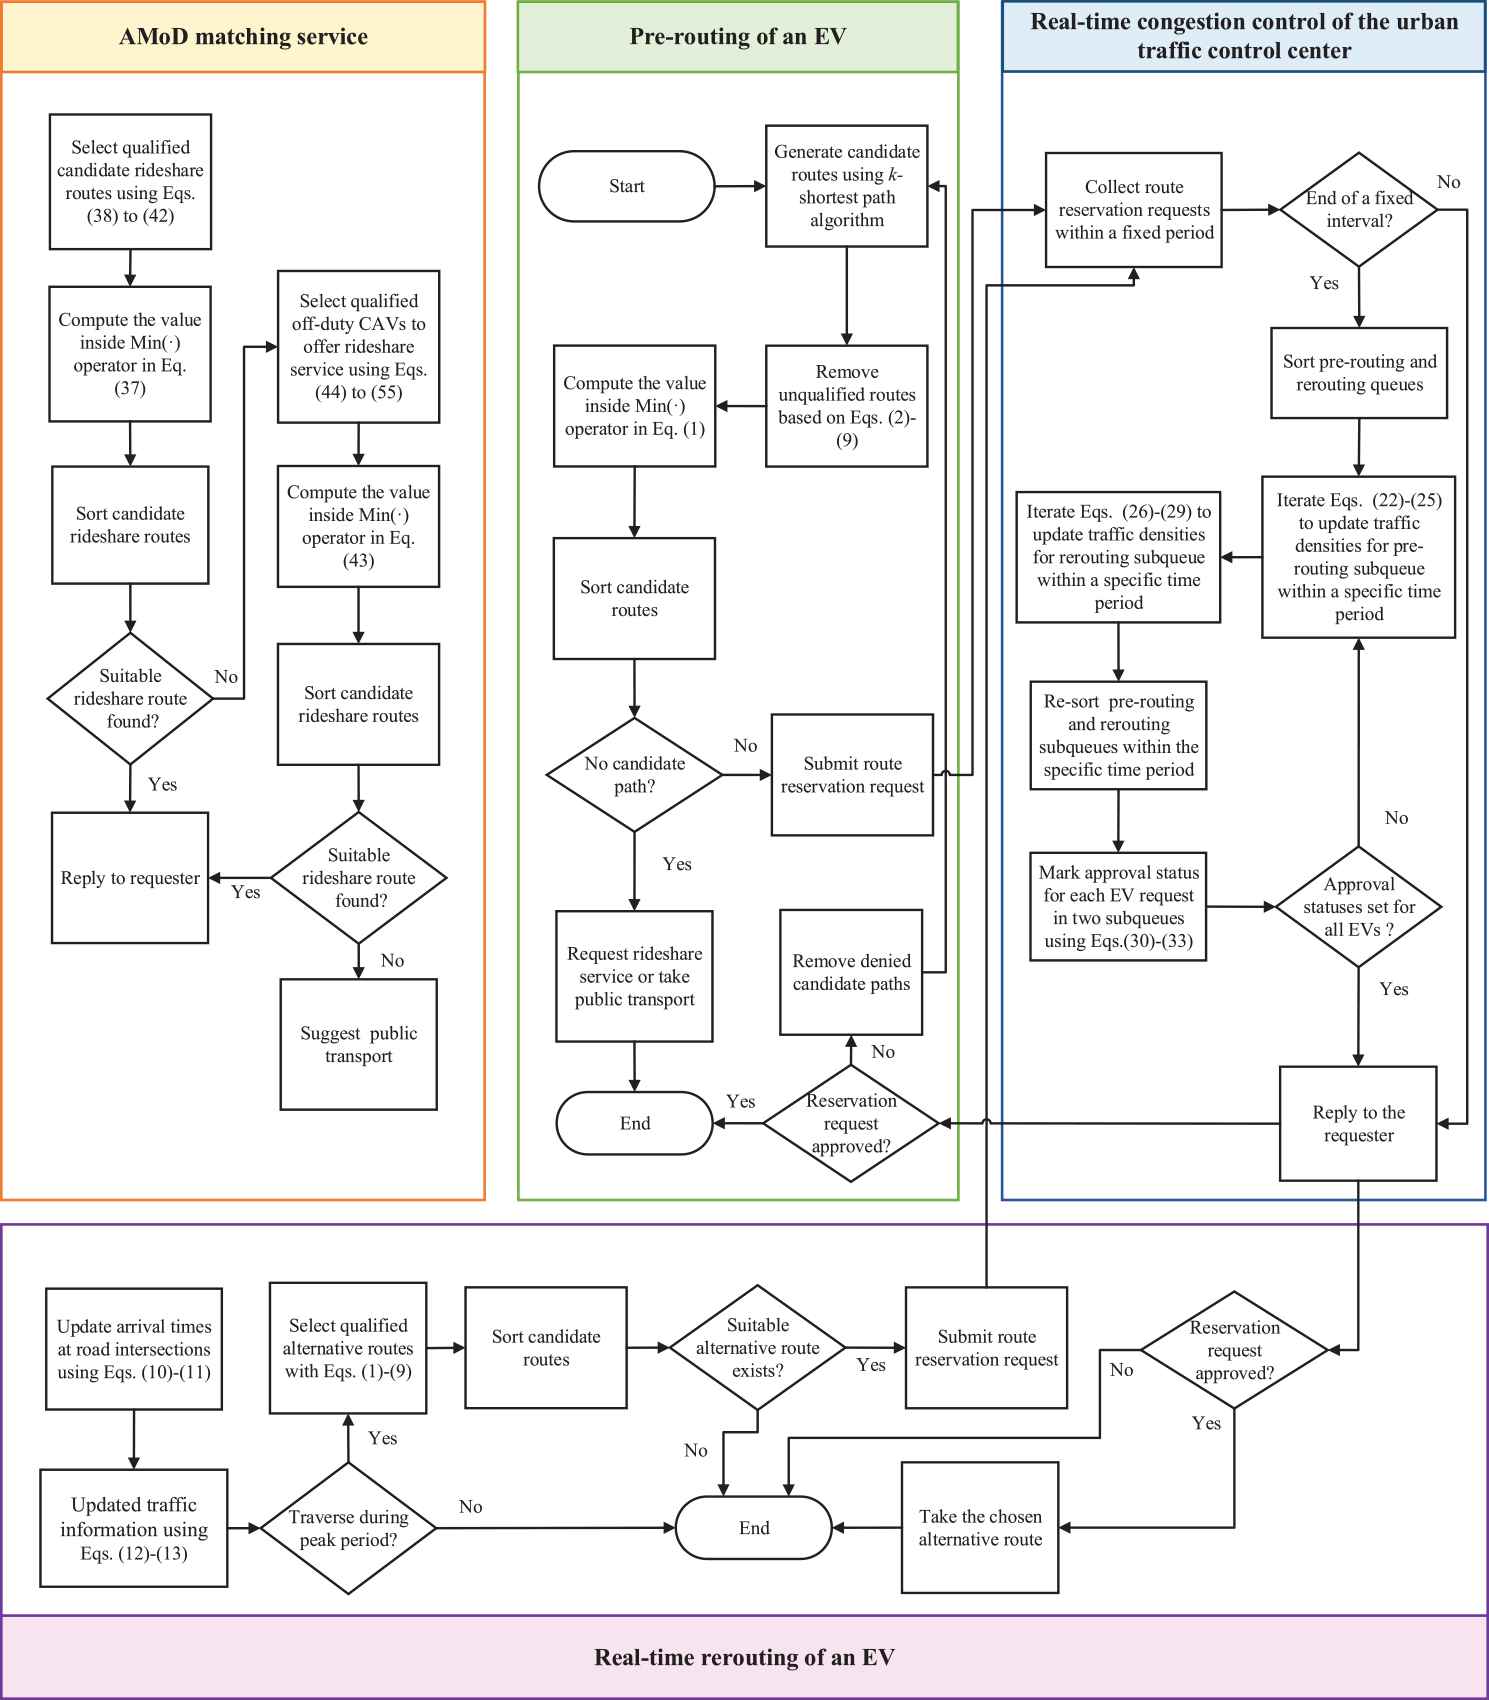
Flow chart of the proposed urban traffic control mechanism for mixed traffic flow.
3.1. Prerouting of an EV
This module is used to set up the route of an EV before its departure. The updated traffic information can be downloaded to any cellphone or computer that is running the module. The road map of the urban area is expressed as a directed graph. Each node of the directed graph stands for the position of a road intersection. During the route computation, the EV checks whether the capacity of its battery, denoted as the state of charge (SOC), is sufficient to arrive at the destination without depleting the electricity of the battery. The battery charging option that suits the need of the EV is arranged in this module if recharging is required before the EV reaches the destination.
This work assumes three charging options, including plug-in charging, battery-swapping, or on-roads wireless charging, which can be chosen to fit the need of an EV. The option of on-road wireless charging would be the most popular during rush periods, especially for the AMoD fleets. However, while a CAV in an AMoD fleet is off duty, a plug-in charging option might suit its need. This latter option also fits the preference of an EV owner while she/he stays at work/home for some period of time. Before the prerouting is initiated, the EV will request the updated traffic and charging information from the urban traffic control center. This work also assumes real-time electricity charging prices are regularly updated by the charging stations/services.
Accordingly, a route that suits the demand of an EV can be obtained by
Three parameters used in Eq. (1) from left to right stand for the total route length, the total traveling time, and the charging costs, respectively. Three weights
The three optimization objectives to be achieved in Eq. (1), from left to right, stand for the total route length, the total traveling time, and the charging cost, respectively. Each coefficient of the three optimization objectives presents the weight of the corresponding preference set by the EV user. As shown in the top-center of Figure 2, we first employ the well-known k-shortest path algorithm [41] to generate at most k- shortest candidate routes in real time. Then the candidate routes that exceed the preset deadline to reach the destination are removed from the list in accordance with the list of constraints given in Eqs. (2–9). Next, we derive the value inside the
After the most appropriate route is derived from the abovementioned equations, a route reservation request is submitted to the urban traffic control center. The EV confirms with the urban traffic control center whether the road segment reservation requests are all approved. In the case where any of the road segments that the EV attempts to reserve is declined, the EV rules out all at-capacity road segments and looks for an alternative route that is less congested.
The prerouting process iterates until the route is found. In the case where the travel time is much longer than expected due to traffic congestion, the alternative of a rideshare or public transport is suggested to the EV user.
3.2. Real-Time Rerouting of an EV
As mentioned above, some EVs might be absent from the designated road intersections at the expected arrival times after making route reservations, or their arrival times might be earlier than or delayed from the originally estimated times due to fluctuating traffic conditions. Accordingly, this module is executed at an EV’s on-board unit (OBU) at every fixed interval, set as five minutes or fewer, to deal with the abovementioned unexpected situations after an EV starts moving. As shown in the bottom of Figure 2, this module first receives updated traffic information from the urban traffic control center and checks whether the time for an EV arriving at each road intersection on the route is shifted from an off-peak period to a peak period:
Eq. (12) examines whether the estimated arrival time at
3.3. Real-Time Congestion Control of the Urban Traffic Control Center
Within a fixed short interval, which can be dynamically tuned during peak periods and off-peak periods, the urban traffic control center keeps track of prerouting and rerouting road segment reservation and cancellation requests. The prerouting and rerouting reservation queues for each road segment are then resorted, in ascending order, based on the updated arrival times of EVs at the end of each fixed interval. The attributes of the two reservation queues for each road segment under traffic control include the arrival timestamp of each incoming EV, the number of passengers carried by the EV, the time that the EV issued the reservation request, the traffic density at the arrival time of the EV, and the approval status of the EV.
As shown in the right of Figure 2, after the two queues are resorted, this module initializes the variables needed during the computation of the traffic density of the road segment between l and m:
As mentioned earlier, the granting of a road segment reservation for an EV depends upon the number of passengers in the EV. The approval ratios for the road segment reservations of EVs with one, two, or more passengers are adjusted dynamically during peak periods. Based on the arrival times of EVs, the traffic densities of prerouting and rerouting traffic flows with different numbers of EV passengers can be computed by
Eqs. (22–25) are iterated until
Next, this module determines whether the EVs in the two queues are granted permission to enter the road segment connecting l and m within
The settings of traffic density approval statuses for the
Next, the variables
Eqs. (18–35) are iterated until the traffic density is set for the road segment connecting l and m, and approval statuses are marked for the EVs in the prerouting and rerouting reservation queues.
3.4. AMoD Matching Service
As mentioned before, this work prohibits late-booking EVs from traversing through a saturated road segment during peak periods. Meanwhile, HDVs are disallowed to drive on expressways during peak periods to keep traffic flows of expressways under control. Accordingly, this work allows an EV owner to request a rideshare service from a designated AMoD fleet if the EV owner is pressed for time, and a CAV that matches the requirements of the EV owner will pick up the EV owner at the designated time and location.
We assume that the routes assigned for a CAV in the AMoD fleet indexed by
As shown in the top-left of Figure 2, once a rideshare request is received, this module first looks for an existing rideshare route that suits the need of the requester:
The first minimization objective in Eq. (37) denotes the distance that the rideshare requester moves when departing from the origin to the pickup point plus the time that the requester departs from the drop-off point to the destination. The second one represents the time required by CAV
If a route that fits the need of the requester is found, the information for the selected route will be sent to the rideshare requester for confirmation. In the case where no satisfactory route is available, this module assigns a CAV that is not on duty at the designated pickup time by
The first minimization objective in Eq. (43) denotes the distance that the rideshare requester moves when departing from the origin to the pickup point plus the time that the requester departs from the drop-off point to the destination. The second one represents the time required by CAV
4. SIMULATION EXPERIMENTS
Here, we describe the experimental details and parameter settings of the proposed work. We ran a series of simulations by using the Python programing language to verify the feasibility and effectiveness of our proposed work. All experiments were performed on a personal computer built with Win10 OS, I7-10700 4.8GHz CPU and 8GB RAM.
4.1. Experimental Setup
In this section, we use the real traffic flow datasets for the experiment to evaluate the proposed work. The historical driving data were obtained from a real-time traffic information web site of the Ministry of Transportation and Communications, Taiwan [42]. The attributes of the database are the average vehicle speed and traffic density measured at the entrance of each road segment during five-minute intervals. The road segments involved in the simulations include three expressways and twelve local roads. One expressway is parallel to two other connected expressways. There is a battery-swapping station deployed at the entrance to each of the two connected expressways, and on-road wireless charging is embedded in the pavement on the paralleled expressway. Five plug-in charging stations are evenly distributed in the area that encompasses the twelve local roads. The ratio of the number of HDVs to the number of CAVs is set as one to five, and the type of each departed EV is randomly assigned as a HDV or CAV based on this ratio. The origin and destination of each EV were generated with uniform distribution within the area encompassing the 15 road segments. The average charging time at a plug-in charging station, and the battery switching time at a battery-swapping station, are 30 minutes [43] and 3 minutes [44], respectively. The total number of records in the dataset was 12672, and the dataset was trained with SVRs. The time spent for pickup and drop-off at a road intersection was randomly set between 10 and 15 seconds. The time for an EV stopped waiting for a traffic light to turn from red to green at the entrance to each road segment was randomly set within the interval of 15 seconds. The upper limit of the traffic density permitted on each of the three expressways was set to 50 vehicles per kilometer [45].
4.2. Experimental Results and Analysis
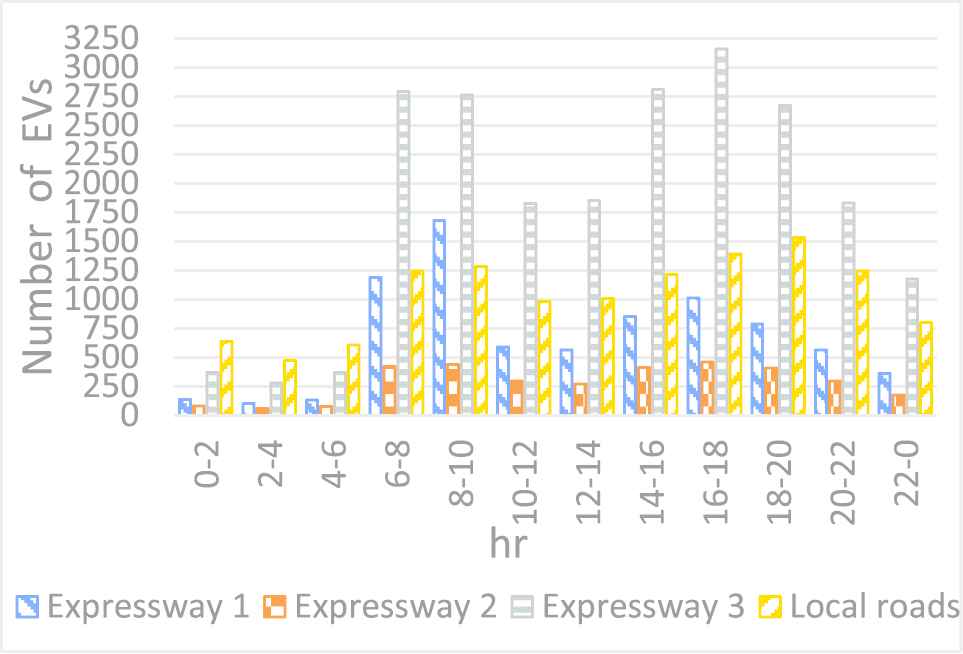
Figure 3 illustrates the traffic volumes on the three expressways and local roads before ridesharing and traffic control strategies are applied. Expressway 3 runs parallel with the connected expressways 1 and 2. Meanwhile, only CAVs are allowed to drive on expressway 3 to ensure the speed of each CAV on expressway 3 can be dynamically adjusted by the traffic control center in this work to maintain the smooth traffic flow during rush hours. This is consistent with the presumption that a majority of EV owners tend to commute via expressway 3 owing to the permitted higher driving speed. In addition, the on-road wireless charging facility embedded in the pavement on expressway 3 also attracts the majority of EV owners because their vehicles can still drive while charging their batteries. Accordingly, this resulted in a surge of traffic volume occurring on expressway 3 during the morning and evening peak hours. In contrast, the traffic flow on local roads is relatively smoother than those of each expressway during rush hours because an EVs owner takes a route via local road(s) if the origin is nearby the destination, or if a detour is required to access an expressway.
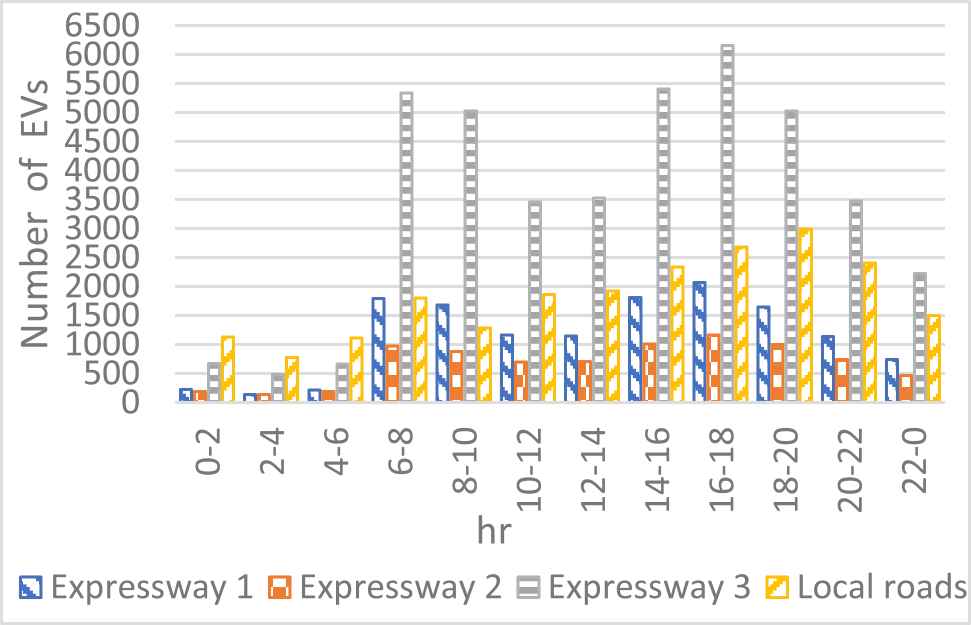
Original traffic volumes over the four types of road segments.
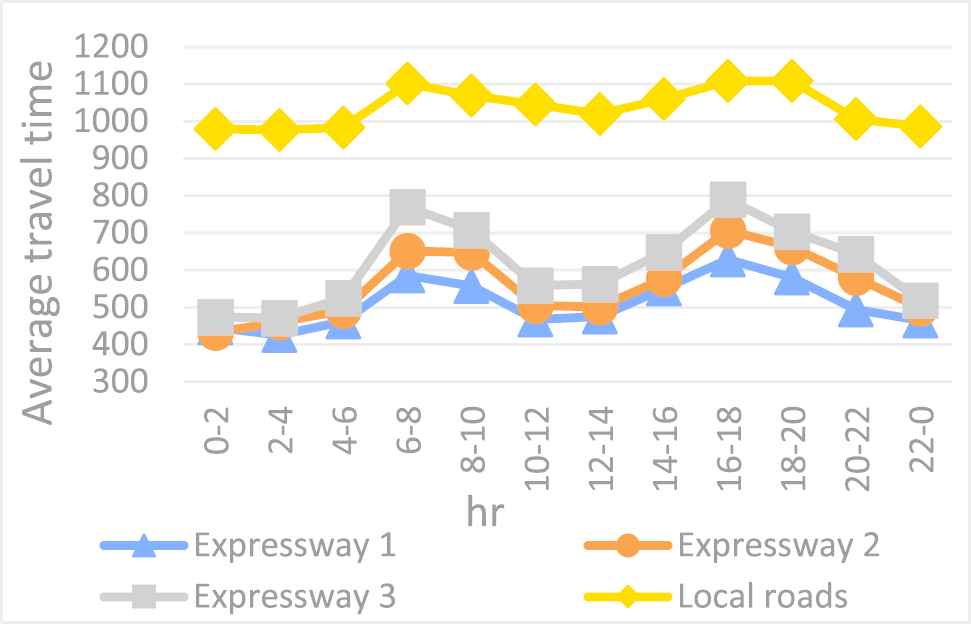
Figure 4 shows the average travel times of EVs that correspond with the traffic volumes observed over all road segments. Notably, the travel time of an EV in the figure includes its driving time over all road segments on the route and the charging time of the EV if it needs recharging during its trip owing to a shortage of battery electricity. Recall that expressway 1 is parallel to the connected expressway 2 and expressway 3. A dramatic increase in the travel times of EVs driving on the three expressways during the typical morning and evening peak hours is evident in Figure 4, especially for expressway 3, which provides an EV with the longest high-speed travel distance on the route. Meanwhile, the length of expressway 1 is shorter than that of expressway 2, which is why the average travel time of an EV on expressway 1 is shorter than that observed on expressway 2. It can be inferred that three expressways are chosen by a large proportion of EV drivers during rush hours because this choice involves less travel time and charging time for an EV on the route to its destination. Accordingly, prolonged traffic times occur on the three expressways during the morning and evening rush hours before ridesharing and traffic control strategies are enforced. The traffic congestion on expressway 3 is more serious than it is on the other two expressways because of the favorable on-road wireless charging service embedded in the pavement on Expressway 3.
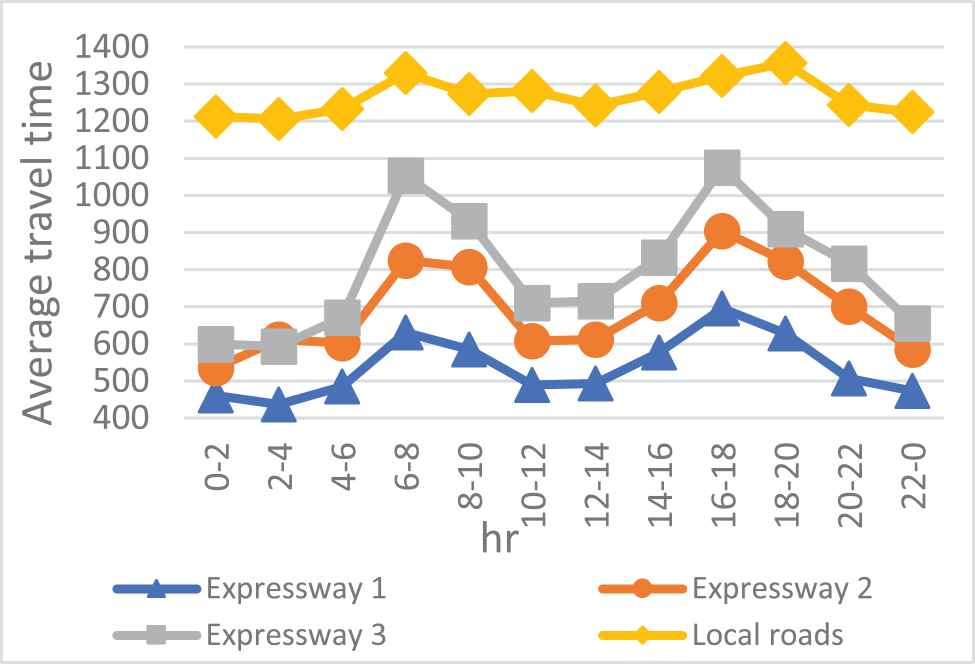
Original travel times of electric vehicles (EVs) over the four types of road segments.
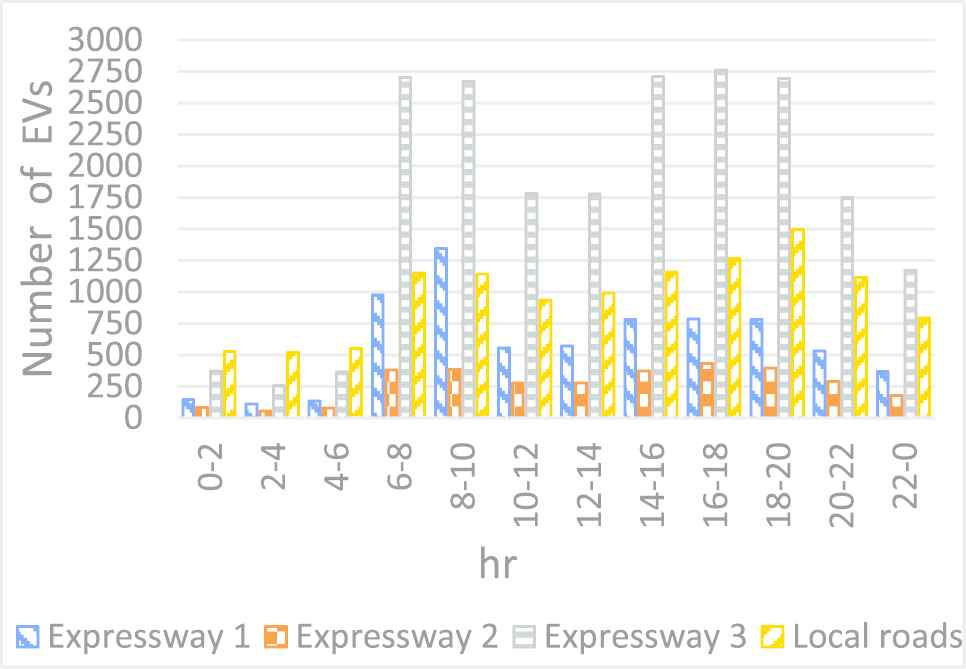
The traffic volumes that correspond with the travel times over all road segments are given in Figure 5. Compared to the original traffic volumes as given in Figure 3, the number of EVs dropped dramatically after the EV users turned to taking rideshare services offered by AMoD fleets. However, most EVs still chose the route via expressway 3, owing to it having the shortest driving time compared to other road segments, not to mention the convenience of on-road wireless charging being supported on expressway 3. Accordingly, traffic jams were still serious on expressway 3 during the morning and evening rush hours, even though the total number of EVs driving over all road segments during the two peak periods was effectively reduced.
Traffic volumes on the four types of road segments after invoking AMoD rideshare service.
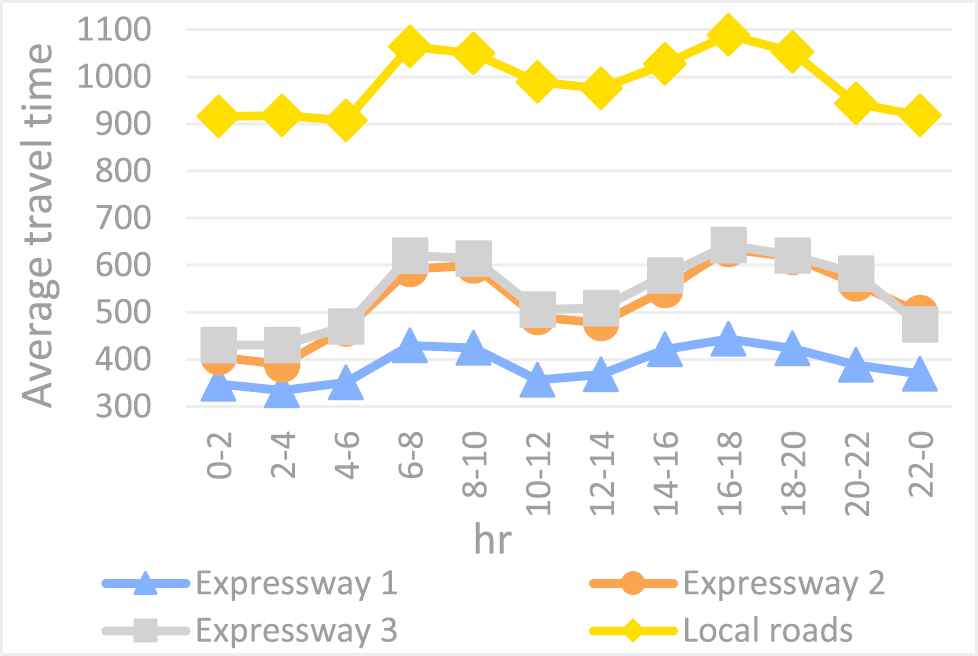
The average travel times of EVs after utilizing the proposed AMoD rideshare service are contrasted in Figure 6. Compared with Figure 4, the traveling times of EVs on expressway 1, expressway 2, expressway 3, and local roads after utilizing AMoD rideshare service decreased 21%, 19%, 23%, and 18% on average, respectively. It can be seen that the travel times over all road segments after utilizing AMoD rideshare service improved, as expected. The reduction of the travel times of EVs traversing each expressway is more noticeable than the reduction observed on the local roads. However, traffic jams on the three expressways, especially expressway 3, are still apparent during rush hours because of large traffic volumes of EVs flowing onto the expressways during commute times. In contrast, the increase of the travel times of EVs on the local roads is not obvious at commute times because the traffic volumes of EVs on the local roads are not impacted to a large extent during the morning and evening peak periods.
Travel times of electric vehicles (EVs) after invoking AMoD ridesharing service.
Figure 7 gives the traffic volumes of EVs after implementing AMoD rideshare service along with appropriate traffic control strategies. The curve for the traffic volumes of EVs on expressway 3 became flat during the morning and evening rush hours. A contributing factor to this flattening is almost surely the addition of the further effect of congestion control after a sizable number of commuters opt to use AMoD rideshare services as an alternative mode of transportation for their daily commute. Although expressway 3 is still the top choice of EVs for their routes during the pre-routing and real-time rerouting processes, the late-booking EVs were allocated to alternative routes via the congestion control mechanism being enforced during the morning and evening rush hours.
Traffic volumes after implementing AMoD ridesharing plus congestion control.
Figure 8 contrasts the travel times of EVs over all road segments that correspond with the traffic volumes observed over all road segments as given in Figure 7. Compared with Figure 6, the traveling times of EVs on expressway 1, expressway 2, expressway 3, and local roads after implementing AMoD ridesharing plus congestion control decreased 9%, 7%, 12%, and 5% on average, respectively. It can be observed that the curve for the travel times of EVs on expressway 3 became much smoother during the morning and evening rush hours, owing to the congestion control being carried out on the saturated road segments during peak periods. The travel times for EVs traversing over all local roads were still much longer than those of EVs using each expressway owing to the low speed limits being enforced on local roads and traffic light delays at the local road intersections. Meanwhile, the charging time spent at the plug-in charging stations by the proportion of the EVs requiring charging prolonged the delays experienced by those EVs to some extent.
Travel times of electric vehicles (EVs) after implementing AMoD ridesharing plus congestion control.
Figure 9 contrasts the average travel times of EV passengers under the three scenarios mentioned above. Compared with the original scenario, the average traveling times of EV passengers after applying the mechanisms of AMoD ridesharing and AMoD ridesharing plus congestion control decreased by 20% and 26%, respectively. To some degree, the three curves are consistent with the distribution of travel times of EVs over all types of road segments observed in the corresponding figures given above. Notably, it can be seen from this figure that the EV travel times spent on expressway 3 and on local roads dropped significantly during the morning and evening peak hours, after the proposed rideshare and traffic control strategies were put into practice. However, the disparity in the travel times between off-peak periods and peak periods cannot be overlooked because the driving speeds of CAV fleet vehicles can be automatically raised owing to the low traffic volumes of EVs over all road segments during off-peak periods.
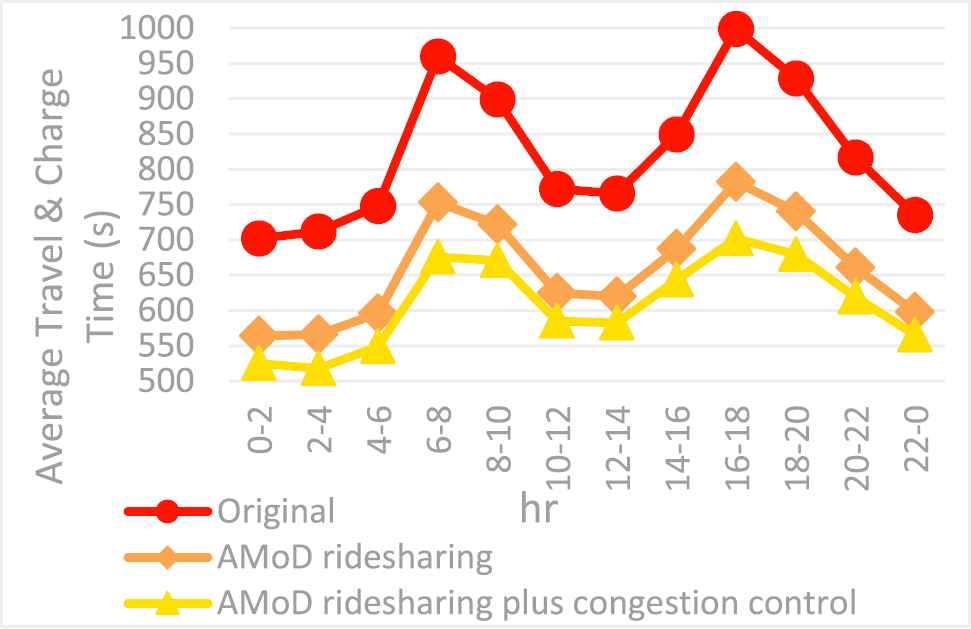
Comparison of travel times of electric vehicle (EV) passengers.
5. CONCLUSION
To the best of our knowledge, little research work has tackled the problems of traffic congestion prevention in an urban area along with the routing and charging strategies of EVs. This work not only proposes a traffic congestion prevention mechanism for an urban area, but also accommodates the routing and charging planning for mixed traffic consisting of human-driven EVs and autonomous EVs. Each EV is required to make road segment reservations for its route before its departure time. The prerouting can be initiated via a cellphone owned by a traditional EV driver or a server installed for the management of an AMoD fleet. Then, a rerouting module will be activated at the OBU of the EV after it starts moving. The rerouting is used to respond to a situation where the EV is earlier than or delayed from the originally estimated off-peak hours to the peak hours. In the meantime, the rideshare matching service provided by an AMoD fleet is adopted to provide an alternative for an EV user who is unsatisfied with a delayed arrival time at her/his destination during the prerouting process. The simulation results indicate that this research can effectively ease the traffic congestion problem in an urban area and provide an acceptable transportation solution for EV users.
CONFLICTS OF INTEREST
The authors declare they have no conflicts of interest.
AUTHORS' CONTRIBUTIONS
Chenn-Jung Huang: conducting the research and design the algorithm. Kai-Wen Hu: Coding the algorithm. Hsing Yi Ho, Bing Zhen Xie, Chien-Chih Feng, and Hung-Wen Chuang: Reviewing and Editing.
ACKNOWLEDGMENTS
The authors would like to thank the Ministry of Science and Technology, Taiwan, for financially supporting this research under Contract Numbers MOST 108-2221-E-259-006 and MOST 109-2221-E-259-008.
REFERENCES
Cite this article
TY  - JOUR
AU  - Chenn-Jung Huang
AU  - Kai-Wen Hu
AU  - Hsing Yi Ho
AU  - Bing Zhen Xie
AU  - Chien-Chih Feng
AU  - Hung-Wen Chuang
PY  - 2021
DA  - 2021/06/12
TI  - A Distributed Urban Traffic Congestion Prevention Mechanism for Mixed Flow of Human-Driven and Autonomous Electric Vehicles
JO  - International Journal of Computational Intelligence Systems
SP  - 1714
EP  - 1727
VL  - 14
IS  - 1
SN  - 1875-6883
UR  - https://doi.org/10.2991/ijcis.d.210608.001
DO  - 10.2991/ijcis.d.210608.001
ID  - Huang2021
ER  -