
A MCDM Method with Linguistic Variables and Intuitionistic Fuzzy Numbers to Evaluate Product Development Projects
- DOI
- 10.2991/ijcis.d.210222.003How to use a DOI?
- Keywords
- Product development projects (PDP); Linguistic variable; Intuitionistic fuzzy number; Multiple criteria decision-making (MCDM)
- Abstract
The high-tech consumer goods market is a rapidly changing environment. Project evaluation and selection play important roles in an organization to increase its competitive advantages successfully. When handling new product project decision problems, it is important to collect information to make the right decision at the initial stage of product development. Past research found that managers usually only evaluate product development projects (PDP) based on a company's own resources. However, competitors can generate similar products to compete in the market. In this way, the process of PDP evaluation and selection should consider internal and external factors. In other words, it is a multiple-criteria decision-making (MCDM) problem. In addition, uncertainty and complex project evaluations are usually involved in dealing with MCDM problems. Therefore, we propose a new MCDM method by combining linguistic variables with intuitionistic fuzzy numbers (IFNs) to analyze the performance of PDPs. The proposed method is then implemented to evaluate a new kind of smartphone in order to fit with 5th generation mobile networks (5G). Finally, the conclusions and future research direction are discussed.
- Copyright
- © 2021 The Authors. Published by Atlantis Press B.V.
- Open Access
- This is an open access article distributed under the CC BY-NC 4.0 license (http://creativecommons.org/licenses/by-nc/4.0/).
1. INTRODUCTION
Project evaluation and selection play an important role in an organization to successfully increase its competitive advantages. When handling new product project decision problems, it is important to collect information to make the right decision at the initial stage of product development. According to resource-based theory (RBT), enterprises striving for sustainable development should possess heterogeneous resources with characteristics that are valuable, rare, irreplaceable, and nonreplicated [1,2]. However, it is difficult to generate or acquire heterogeneous resources for each enterprise in a competitive market. In this way, enterprises can easily develop novel products that are similar to other enterprises because the products are easily imitated by other enterprises. Therefore, enterprise should predict the profitability of a product carefully by considering the imitation of other competitors. The profit of a novel product can be separated into three time periods: the monopoly period, the competitive period, and the obsolete period [3]. In the monopoly period, the novel product will have large sales numbers because other competitors have not generated a similar product. In the competitive period, the profit of the new product will decrease because other competitors have developed similar products. In the obsolete period, new products will have been developed by competitors and the enterprise should consider to stop manufacturing the original product (Figure 1).
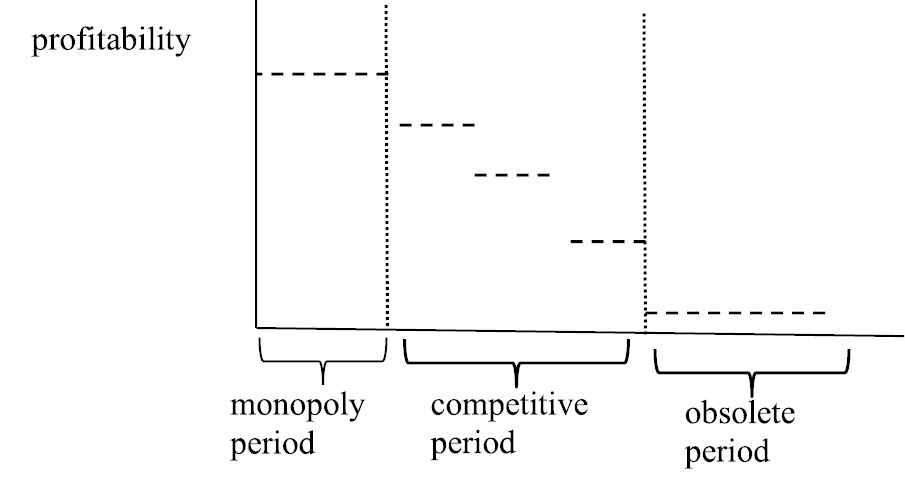
Profitability of product in each period.
Therefore, when an enterprise develops a novel product, it should not only consider its resources in order to develop the product successfully, but also consider the overall profit among all three periods by taking care of the imitation of competitors. In fact, many internal and external factors will influence the evaluation and selection of product development projects (PDP). In this way, PDP decisions can be regarded as a multiple-criteria decision-making (MCDM) problem. The main goal of this paper was to build a framework to analyze the performance of PDP in order to help enterprises decide on the suitable PDP to implement.
In general, vague, imprecise, or insufficient information always exists in a business environment [4]. Uncertainty and complex project evaluations are usually involved in dealing with PDP evaluation and selection problems. Faced with this decision environment, experts cannot always use crisp values to express their opinions. Intuitionistic fuzzy sets (IFS) are useful tools to cope with the uncertainty information, because experts can flexibly express their opinions according to the membership degree, nonmembership degree, and in-determine degree [5]. In decision science fields, the projection method has been used as an effective measurement tool to calculate the similarity degree between alternatives [6]. Up to now, the projection tool has been applied in various decision-making problems, such as partner selection [7], personnel selection [8], project evaluation [9], and material selection [10], etc. Therefore, we proposed an intuitionistic fuzzy projection approach by combining linguistic variables with intuitionistic fuzzy numbers (IFNs) to analyze the performance of PDPs.
The rest of this paper is structured as follows. In Section 2, literature about the methods of project evaluation and selection are discussed. In Section 3, we introduce the notation and operation of the IFN. The proposed method is presented in Section 4. An example is implemented in Section 5 in order to illustrate the proposed method. Finally, the conclusions and future research direction are discussed in the last section.
2. LITERATURES REVIEW
Numerous MCDM methods have been presented and applied in various fields. Danneels and Kleinschmidt [11] presented a conceptual framework to identify product innovativeness. They thought that environmental familiarity, project-firm fit and technological criteria are important for evaluating product innovativeness. Based on the above criteria, experts will make a Go/No Go decision to execute project. Kumar et al. [12] demonstrated the efficacy of applying six-sigma in small medium‐sized enterprise (SME) product project selection. Weissenberger-Eibl and Teufel [13] collected past new PDP selection literatures and found that organizational politics are a critical factor that will influence project selection. Chang [14] combined a technique for order preference by similarity to the ideal solution (TOPSIS), the analytic network process (ANP), and the balanced scorecard (BSC) to analyze and evaluate new PDPs in Taiwan.
Costantino et al. [15] considered competitive environments, enterprise strategic objectives, and the project manager's experience to build project critical success factors (CSFs) and used an artificial neural network (ANN) to design a decision support system to classify successful and unsuccessful projects. Chen et al. [16] analyzed and picked new product projects according to various factors. They considered the performance of a new project and its influence on the company's past products and competitors' products to generate the maximum profit for an enterprise. Lee et al. [17] combined DEMATEL and ANP with zero-one goal programming (ZOGP) to select the optimal green aviation fleet management strategy decisions. Awasthi and Omrani [18] applied the fuzzy Delphi method to design a goal-oriented approach based on fuzzy axiomatic design to select reasonable new product projects in Luxembourg city. Peng et al. [19] applied the fuzzy TOPSIS approach to select a proper restoring technology for crankshaft remanufacturing. Wu et al. [20] integrated Dempster-Shafer theory (DST) and the analytic hierarchy process (AHP) to evaluate and rank new product projects under uncertain business environments.
Some past research has discussed new product development time. Adler et al. [21] modeled product development organization as a stochastic processing network, in which engineering resources are workstations and projects are jobs that flow between the workstations. In this model, an enterprise can predict product development times easily and reasonably because every PDP can predict its execution time in each workstation in the network. The strength of this method is that the model can predict all project development in the enterprise. The weakness of this method is that it does not consider similar projects being developed by competitors, which will influence the profit of enterprise. Carrascosa et al. [22] designed a structure matrix to estimate product development time. This method uses the probability function to predict the service time needed for each research process. The advantage of this method is that it can predict the entire product development time for both the best-case condition and the worst-case condition. Again, the disadvantage of this method is that it does not consider the developments of its competitors, who will influence the overall profit of the enterprise. Chen and Huang [23] integrated fuzzy theory and the program evaluation and review technique (PERT) to evaluate product development times. The strong point of this method is that it can cope with the product development time problem and find out the critical work stations in a project network. Decision makers can then shorten the product development time by inputting more resources to these workstations. The weakness of this method is that the predict product development time range will be large if there are many workstations in a project network. Like the above research, this method predicts product development time according to its resources and does not consider the developments of its competitors.
Internal resources and external competitors are important considerations when making project decisions. Considering internal resources, human resources [16,24], funds [25], and support of high-level manager [26] are suitable factors that have been used to select new PDP. Regarding external competitors, game theory [27] and SWOT analysis [28] are popular tools that have been applied to evaluate the performance between research enterprise and its competitors. It is therefore important to select PDPs based on internal resources and external competitors because enterprises should develop new products as fast as possible when products can be imitated easily.
From the above literatures, it can be seen that new PDP selection should consider various dimensions based on the enterprise's goals, organization policy, external environment, entire profit, product innovativeness, and competitors' behavior. The key considerations of each new product development problem are different. Most new PDP selection problems consider internal resources and external competitors simultaneously. This study analyzed and evaluated the performance of PDP in order to predict the product develop time needed for launching. Past research found that enterprises will select PDP from different versions of PDPs in the enterprise. However, every enterprise should predict its product profit according to the new product launch sequence between case enterprise and its competitors, especially for products that can be easily imitated by competitors.
3. IFN AND ITS DEFINITION
Definition 1.
Let F be a fuzzy set
Definition 2.
Let Z be a fixed and nonempty set; intuitionistic fuzzy set F in Z can be described as the following equation [30]:
Definition 3.
Let
Definition 4.
Let
Definition 5.
Let
Definition 6.
Let
Definition 7.
Let
Definition 8.
Let
4. PROPOSED METHOD
4.1. Notations and Glossary
In general, the PDP problem can be formulated by the following notations:
A set of expert
A set of PDP
A set of criteria
A set of weight criteria is
A decision matrix X.
4.2. Assumptions
There are two assumptions that should be considered for evaluating the performance of PDPs of industry.
Novel products that are easily copied by competitors.
If the developed technologies of the new product cannot be imitated by other enterprises, the enterprise will monopolize the entire market, therefore this PDP should be permitted without any evaluation because it can provide long-term profit without any competition
Novel products produced by each enterprise that are homogenous.
When assessing the profit of each enterprise reasonably, it should be supposed that novel products that are developed by each enterprise are homogenous. Market share and entire profit will be equally acquired by enterprises that have developed this novel product successfully.
4.3. Process of the Proposed Method
The concept of the proposed method came from the intuitionistic fuzzy projection-based approach for partner selection [7]. At the first step, the manager should decide a PDP set. Afterward, the opinions of experts for each PDP should be collected. The experts will express their opinions about the performance of each PDP with respect to each criterion. Let
The experts can also describe their opinions about the importance of each criterion. Let
Next, the weighted decision matrix is calculated by assigning
Once the weighted decision matrix is created, three kinds of reference points are used for evaluating the performance of PDPs. These reference points are the positive ideal decision (PID), negative ideal decision (NID), and the complement of the PID (CPID) [7].
The PID is the best and ideal result of the PDPs and is computed as:
The NID is the worst result of the PDPs. It is computed as:
The CPID is the inverse of the PID. It is computed as:
In other words, a PID represents the maximum benefit, while an NID represents the maximum loss for all PDPs.
The projection of
The projection of
The projection of
Based on the concept of TOPSIS, the relative closeness of the i-th PDP can be computed as follows:
The PDPs can be ranked according to the relative closeness; the higher the value of
Based on the ranking order of the PDPs, the profit index can be calculated as follows:
The entire profit ratio of the i-th PDP can be calculated as follows:
5. CASE STUDY
A smartphone enterprise wants to develop new kind of smartphone in order to fit with 5th generation mobile networks (5G). In order to let the case enterprise evaluate its future product competitive ability, this enterprise compares its PDP with other PDPs developed by its competitors. At first, this enterprise invites seven experts to constitute the committee to evaluate the performance of the PDPs. The experts include high-level managers and middle-level managers in the case enterprise, high-level managers and middle-level managers in the competitive enterprises, professors of information system, industrial engineering professors, and civil servants. The experts come from the industry, government, and academia, and the opinions of the experts are representative to evaluate the performance of the PDPs.
The execution process of the proposed method is as follows:
Step 1. Decide the analysis target.
After discussion, the experts decide on five PDPs (one PDP acquired from the case enterprise and the others from its competitors) as targets from the smartphone industry for evaluating performance of the PDP in the case enterprise. The competitors have been decided mainly according to the market share of smartphones in Taiwan. The Top 5 mobile phone manufacturers in the market share are selected as competitors.
Step 2. Decide on the evaluation criteria.
The experts also decide on five criteria to evaluate the performance of the PDP. Those criteria are the patent technology needed to develop the product (
| Criterion No. | Criterion | Literatures |
|---|---|---|
| ( |
Patent technology for developing product | [19,31,32] |
| ( |
Talent for developing product | [16,24] |
| ( |
Production equipment in enterprise | [33–35] |
| ( |
Research speed for developing product | [36,37] |
| ( |
Research fund for developing product | [25,36,37] |
Project selection criteria.
Step 3. Collect qualitative information. (Tables A1–A7 can refer to Appendix.)
The experts apply nine-scale linguistic variables to express their opinions (refer to Table A1). Each expert also expresses his/her opinion by selecting linguistic variables to describe the performance of each PDP with respect to each criterion, and the linguistic variables can collate as an IFN(refer to Table A2). Each expert expresses his/her opinion by selecting linguistic variables to describe the importance of each criterion, and the linguistic variables can collate as a score (refer to Table A3). The above experts' opinions can reflect each enterprises' resource and research ability. The enterprises' resource and research ability are transferred as the new product research time by the proposed method and used to decide the new product launch sequence of each enterprise.
Step 4. Calculate the weighted decision matrix.
This research used Equation (6) to calculate the weighted performance of each PDP with respect to each criterion (refer to Table A4).
Step 5. Calculate the values of PID, NID, and CPID, as shown in Table A5.
Step 6. Calculate the projection of the PDPs on PID, NID, and CPID, as shown in Table A6.
Step 7. Calculate the relative closeness of each PDP, as shown in Table A6.
Step 8. Calculate the profit index and entire profit ratio of each PDP, as shown in Table A6.
According to the analysis result, the rank of each PDP is
Based on the analysis result, we can find out that the new product launch time point of the case enterprise is closer to its competitor. Therefore, we can conclude that the research ability of each enterprise is the same at this time point. The case enterprise should develop or search for external resources (such as marketing channels) to increase its competitive ability if the case enterprise wants to win the battle of developing this new project.
According to the Table A6, traditional TOPSIS method will compute relative closeness just consider the projections of PID and NID. In this way, the relative closeness of the i-th PDP in accordance with traditional TOPSIS method can be computed as follows:
The
6. CONCLUSIONS
Because the main goal of an enterprise is to make profit, it should select the most suitable new product project to increase its revenue and competitive advantage when competitors develop similar products in the market. In order to evaluate and select the right project to develop a new product, this paper used linguistic variables and IFNs to express the opinions of experts and reduce the fuzziness in the decision-making process. Then we proposed a new MCDM method, called the intuitionistic fuzzy projection approach, to analyze the relative position of each PDP and the ranking order of each project.
The appropriate reasons for using the proposed method to evaluate PDPs were as follows:
The evaluation process is more objective
Traditional TOPSIS can analyze PDPs according to expert opinions that are expressed by linguistic variables [38]. However, the linguistic variables handled by TOPSIS are relatively rigid and nonflexible. The proposed method transfers linguistic variables into IFNs. IFNs can provide the membership degree, nonmembership degree, and indeterminacy degree of special linguistic variables belong to one kind of status. Compared with traditional TOPSIS, the proposed method can also calculate the relative position of the PDP between the positive ideal solution and the negative ideal solution based on the projection method. However, the proposed method can deal with expert opinions more carefully, as well as PDPs with high risk and high uncertainty that require evaluating and analyzing the experts' opinions cautiously.
Provide the launch sequence of each PDP
Because some new products developed by the enterprise are similar and easily imitated, it is important to predict the new product launch sequence according to the performance of each PDP. Enterprises can analyze their profit according to the new product launch sequence. The proposed method can not only analyze and evaluate the performance of each PDP, but also predict the new product launch sequence according to the performance of each PDP. This information is important for enterprises when implementing PDP decisions.
The traditional TOPSIS method determines the solution with the shortest distance to the ideal solution and the greatest distance from the negative-ideal solution, but it does not consider the relative importance of these distances [39]. Enterprises must consider new product launch time points when selecting PDPs to execute. Because the traditional TOPSIS method evaluates and selects PDPs based on the relative distance, it will cause projects with a high distance to the ideal solution to be judged as high-performance projects if they are also at a high distance from the negative-ideal solution. However, projects with a high distance to the ideal solution may have an increased product launch time because their strength and resources are relatively rare and relatively more time is needed to develop new products. However, projects with a high distance to the ideal solution could still be selected as high-performance projects in traditional TOPSIS. Therefore, this study did not take traditional TOPSIS as an evaluation tool.
In the future, this method can be extended and modified by adding quantitative criteria for making decisions. At the same time, an interactive system can be presented based on the proposed method.
CONFLICTS OF INTEREST
Authors declare that no conflict of interest for publishing in this journal.
AUTHORS' CONTRIBUTIONS
Chen-Tung Chen is responsible for quality control and supervision of this paper. Wei-Zhan Hung is responsible for collecting data, computing the data and document editing of this paper.
ACKNOWLEDGMENTS
This work was supported partially by Ministry of Science and Technology, Taiwan. The project No. is “MOST 108-2410-H-239-010-MY2.”
APPENDIX
| Performance |
Weight |
||
|---|---|---|---|
| Linguistic Variable | IFNs | Linguistic Variable | Scores |
| Extremely poor (EP) | (0.10, 0.80) | Extremely low (EL) | 1.25 |
| Very poor (VP) | (0.20, 0.70) | Very low (VL) | 1.50 |
| Poor (P) | (0.30, 0.60) | Low (L) | 1.75 |
| Medium poor (MP) | (0.40, 0.50) | Medium low (ML) | 2.00 |
| Fair (F) | (0.50, 0.40) | Fair (F) | 2.25 |
| Medium good (MG) | (0.60, 0.30) | Medium high (MH) | 2.50 |
| Good (G) | (0.70, 0.20) | High (H) | 2.75 |
| Very good (VG) | (0.80, 0.10) | Very high (VH) | 3.00 |
| Extremely good (EG) | (0.90, 0.00) | Extremely high (EH) | 3.25 |
Linguistic variables.
| Expert 1's Opinion |
Expert 2's Opinion |
|||||||||
|---|---|---|---|---|---|---|---|---|---|---|
| VG | MG | P | F | F | F | EG | MG | VG | VG | |
| G | P | P | F | MG | MG | F | MG | G | MP | |
| G | P | MG | VP | VG | VG | VG | F | F | G | |
| MG | VP | MG | MG | G | MG | VG | MG | G | F | |
| G | MG | G | VG | VG | MG | F | MG | P | VP | |
| Expert 3's Opinion |
Expert 4's Opinion |
|||||||||
| MP | G | MG | VP | MG | VG | F | EP | MG | G | |
| EG | F | MG | MG | F | F | VG | EP | MP | P | |
| MG | VG | P | EP | F | F | VG | P | VG | MP | |
| G | F | F | MG | MG | G | MG | F | VP | F | |
| MG | VP | F | F | F | VG | F | MG | P | MG | |
| Expert 5's Opinion |
Expert 6's Opinion |
|||||||||
| F | EP | F | VG | F | F | EP | MP | EP | VG | |
| EP | VP | MG | F | P | VP | F | VP | G | G | |
| F | P | MG | G | G | EP | MG | F | G | F | |
| F | MG | F | MG | MG | EP | MG | MG | VP | G | |
| MG | MP | EP | F | G | EP | VG | P | G | F | |
| Expert 7's Opinion |
||||||||||
| MG | G | VG | EP | VP | ||||||
| VP | VP | EP | P | G | ||||||
| P | VG | VP | G | MG | ||||||
| VG | G | MP | VP | G | ||||||
| MG | VG | G | MG | VP | ||||||
Performances of product development projects (PDPs).
| L | EL | EH | VH | F | MH | MH | |
| MH | EL | H | EL | H | H | MH | |
| MH | H | EL | F | EL | MH | H | |
| EL | MH | F | H | H | MH | F | |
| MH | H | EL | MH | F | H | VH |
Weight of each criterion.
| Expert 1 |
||||||||||
|---|---|---|---|---|---|---|---|---|---|---|
| 0.591 | 0.004 | 0.300 | 0.059 | 0.059 | 0.300 | 0.195 | 0.115 | 0.195 | 0.115 | |
| 0.448 | 0.027 | 0.067 | 0.317 | 0.067 | 0.317 | 0.210 | 0.127 | 0.317 | 0.067 | |
| 0.460 | 0.030 | 0.073 | 0.329 | 0.329 | 0.073 | 0.030 | 0.460 | 0.615 | 0.007 | |
| 0.305 | 0.061 | 0.024 | 0.437 | 0.305 | 0.061 | 0.305 | 0.061 | 0.437 | 0.024 | |
| 0.421 | 0.020 | 0.289 | 0.054 | 0.421 | 0.020 | 0.582 | 0.004 | 0.582 | 0.004 | |
| Expert 2 |
||||||||||
| 0.195 | 0.115 | 0.780 | 0.000 | 0.300 | 0.059 | 0.591 | 0.195 | 0.115 | 0.780 | |
| 0.317 | 0.067 | 0.210 | 0.127 | 0.317 | 0.067 | 0.448 | 0.317 | 0.067 | 0.210 | |
| 0.615 | 0.007 | 0.615 | 0.007 | 0.221 | 0.136 | 0.221 | 0.615 | 0.007 | 0.615 | |
| 0.305 | 0.061 | 0.596 | 0.005 | 0.305 | 0.061 | 0.437 | 0.305 | 0.061 | 0.596 | |
| 0.289 | 0.054 | 0.186 | 0.108 | 0.289 | 0.054 | 0.054 | 0.289 | 0.054 | 0.186 | |
| Expert 3 |
||||||||||
| 0.115 | 0.195 | 0.431 | 0.023 | 0.300 | 0.059 | 0.023 | 0.431 | 0.300 | 0.059 | |
| 0.789 | 0.000 | 0.210 | 0.127 | 0.317 | 0.067 | 0.317 | 0.067 | 0.210 | 0.127 | |
| 0.329 | 0.073 | 0.615 | 0.007 | 0.073 | 0.329 | 0.007 | 0.615 | 0.221 | 0.136 | |
| 0.437 | 0.024 | 0.200 | 0.119 | 0.200 | 0.119 | 0.305 | 0.061 | 0.305 | 0.061 | |
| 0.289 | 0.054 | 0.020 | 0.421 | 0.186 | 0.108 | 0.186 | 0.108 | 0.186 | 0.108 | |
| Expert 4 |
||||||||||
| 0.591 | 0.004 | 0.195 | 0.115 | 0.004 | 0.591 | 0.300 | 0.059 | 0.431 | 0.023 | |
| 0.210 | 0.127 | 0.605 | 0.006 | 0.006 | 0.605 | 0.127 | 0.210 | 0.067 | 0.317 | |
| 0.221 | 0.136 | 0.615 | 0.007 | 0.073 | 0.329 | 0.615 | 0.007 | 0.136 | 0.221 | |
| 0.437 | 0.024 | 0.305 | 0.061 | 0.200 | 0.119 | 0.024 | 0.437 | 0.200 | 0.119 | |
| 0.582 | 0.004 | 0.186 | 0.108 | 0.289 | 0.054 | 0.054 | 0.289 | 0.289 | 0.054 | |
| Expert 5 |
||||||||||
| 0.195 | 0.115 | 0.004 | 0.591 | 0.195 | 0.115 | 0.591 | 0.004 | 0.195 | 0.115 | |
| 0.006 | 0.605 | 0.027 | 0.448 | 0.317 | 0.067 | 0.210 | 0.127 | 0.067 | 0.317 | |
| 0.221 | 0.136 | 0.073 | 0.329 | 0.329 | 0.073 | 0.460 | 0.030 | 0.460 | 0.030 | |
| 0.200 | 0.119 | 0.305 | 0.061 | 0.200 | 0.119 | 0.305 | 0.061 | 0.305 | 0.061 | |
| 0.289 | 0.054 | 0.108 | 0.186 | 0.004 | 0.582 | 0.186 | 0.108 | 0.421 | 0.020 | |
| Expert 6 |
||||||||||
| 0.195 | 0.115 | 0.004 | 0.591 | 0.115 | 0.195 | 0.004 | 0.591 | 0.591 | 0.004 | |
| 0.027 | 0.448 | 0.210 | 0.127 | 0.027 | 0.448 | 0.448 | 0.027 | 0.448 | 0.027 | |
| 0.007 | 0.615 | 0.329 | 0.073 | 0.221 | 0.136 | 0.460 | 0.030 | 0.221 | 0.136 | |
| 0.005 | 0.596 | 0.305 | 0.061 | 0.305 | 0.061 | 0.024 | 0.437 | 0.437 | 0.024 | |
| 0.004 | 0.582 | 0.582 | 0.004 | 0.054 | 0.289 | 0.421 | 0.020 | 0.186 | 0.108 | |
| Expert 7 |
||||||||||
| 0.300 | 0.059 | 0.431 | 0.023 | 0.591 | 0.004 | 0.004 | 0.591 | 0.023 | 0.431 | |
| 0.027 | 0.448 | 0.027 | 0.448 | 0.006 | 0.605 | 0.067 | 0.317 | 0.448 | 0.027 | |
| 0.073 | 0.329 | 0.615 | 0.007 | 0.030 | 0.460 | 0.460 | 0.030 | 0.329 | 0.073 | |
| 0.596 | 0.005 | 0.437 | 0.024 | 0.119 | 0.200 | 0.024 | 0.437 | 0.437 | 0.024 | |
| 0.289 | 0.054 | 0.582 | 0.004 | 0.421 | 0.020 | 0.289 | 0.054 | 0.020 | 0.421 | |
Weighted decision matrix of each expert.
| PID |
||||||
|---|---|---|---|---|---|---|
| 0.591 | 0.448 | 0.615 | 0.437 | 0.582 | ||
| 0.004 | 0.027 | 0.007 | 0.024 | 0.004 | ||
| 0.780 | 0.448 | 0.615 | 0.596 | 0.289 | ||
| 0.000 | 0.027 | 0.007 | 0.005 | 0.054 | ||
| 0.431 | 0.789 | 0.615 | 0.437 | 0.289 | ||
| 0.023 | 0.000 | 0.007 | 0.024 | 0.054 | ||
| 0.591 | 0.605 | 0.615 | 0.437 | 0.582 | ||
| 0.004 | 0.006 | 0.007 | 0.024 | 0.004 | ||
| 0.591 | 0.317 | 0.460 | 0.305 | 0.421 | ||
| 0.004 | 0.067 | 0.030 | 0.061 | 0.020 | ||
| 0.591 | 0.448 | 0.460 | 0.437 | 0.582 | ||
| 0.004 | 0.027 | 0.030 | 0.024 | 0.004 | ||
| 0.591 | 0.448 | 0.615 | 0.596 | 0.582 | ||
| 0.004 | 0.027 | 0.007 | 0.005 | 0.004 | ||
| NID |
||||||
| 0.300 | 0.317 | 0.460 | 0.437 | 0.054 | ||
| 0.059 | 0.067 | 0.030 | 0.024 | 0.289 | ||
| 0.115 | 0.210 | 0.136 | 0.119 | 0.421 | ||
| 0.195 | 0.127 | 0.221 | 0.200 | 0.020 | ||
| 0.431 | 0.127 | 0.615 | 0.119 | 0.421 | ||
| 0.023 | 0.210 | 0.007 | 0.200 | 0.020 | ||
| 0.591 | 0.605 | 0.329 | 0.437 | 0.289 | ||
| 0.004 | 0.006 | 0.073 | 0.024 | 0.054 | ||
| 0.591 | 0.605 | 0.329 | 0.119 | 0.582 | ||
| 0.004 | 0.006 | 0.073 | 0.200 | 0.004 | ||
| 0.591 | 0.448 | 0.615 | 0.596 | 0.582 | ||
| 0.004 | 0.027 | 0.007 | 0.005 | 0.004 | ||
| 0.591 | 0.605 | 0.460 | 0.437 | 0.421 | ||
| 0.004 | 0.006 | 0.030 | 0.024 | 0.020 | ||
| CPID |
||||||
| 0.004 | 0.027 | 0.007 | 0.024 | 0.004 | ||
| 0.591 | 0.448 | 0.615 | 0.437 | 0.582 | ||
| 0.000 | 0.027 | 0.007 | 0.005 | 0.054 | ||
| 0.780 | 0.448 | 0.615 | 0.596 | 0.289 | ||
| 0.023 | 0.000 | 0.007 | 0.024 | 0.054 | ||
| 0.431 | 0.789 | 0.615 | 0.437 | 0.289 | ||
| 0.004 | 0.006 | 0.007 | 0.024 | 0.004 | ||
| 0.591 | 0.605 | 0.615 | 0.437 | 0.582 | ||
| 0.004 | 0.067 | 0.030 | 0.061 | 0.020 | ||
| 0.591 | 0.317 | 0.460 | 0.305 | 0.421 | ||
| 0.004 | 0.027 | 0.030 | 0.024 | 0.004 | ||
| 0.591 | 0.448 | 0.460 | 0.437 | 0.582 | ||
| 0.004 | 0.027 | 0.007 | 0.005 | 0.004 | ||
| 0.591 | 0.448 | 0.615 | 0.596 | 0.582 | ||
PID), negative ideal decision (NID), and complement of the positive ideal decision (CPID).
| Projection of PID | 3.513 | 3.579 | 3.205 | 3.242 | 3.397 |
| Projection of NID | 3.341 | 3.433 | 3.380 | 3.156 | 3.585 |
| Projection of CPID | 2.657 | 2.718 | 3.022 | 2.872 | 2.897 |
| Relative closeness | 0.539 | 0.538 | 0.500 | 0.518 | 0.512 |
| PDP profit index | 0.116 | 0.115 | 0.100 | 0.105 | 0.103 |
| Entire profit ratio | 0.215 | 0.213 | 0.186 | 0.195 | 0.191 |
| Rank | 1 | 2 | 5 | 3 | 4 |
Information of each product development project (PDP).
| Projection of PID | 3.513 | 3.579 | 3.205 | 3.242 | 3.397 |
| Projection of NID | 3.341 | 3.433 | 3.380 | 3.156 | 3.585 |
| Relative closeness | 0.513 | 0.510 | 0.487 | 0.507 | 0.487 |
| Rank | 1 | 2 | 4 | 3 | 4 |
Rank of each product development project (PDP) by traditional technique for order preference by similarity to the ideal solution (TOPSIS).
REFERENCES
Cite this article
TY  - JOUR
AU  - Chen-Tung Chen
AU  - Wei-Zhan Hung
PY  - 2021
DA  - 2021/03/03
TI  - A MCDM Method with Linguistic Variables and Intuitionistic Fuzzy Numbers to Evaluate Product Development Projects
JO  - International Journal of Computational Intelligence Systems
SP  - 935
EP  - 945
VL  - 14
IS  - 1
SN  - 1875-6883
UR  - https://doi.org/10.2991/ijcis.d.210222.003
DO  - 10.2991/ijcis.d.210222.003
ID  - Chen2021
ER  -