
Activity Efficiency Model in Business Process Under Conflict Information and Its Application
 , Li Juan1, *, Ruin Fatimah1, Jiong Chen1
- DOI
- 10.2991/ijcis.d.201215.004How to use a DOI?
- Keywords
- Activity efficiency model; Conflict information; Business process; Dempster–Shafer theory; Queuing theory
- Abstract
Information transition and sharing is necessary for business process management and multi-source information may cause information conflict and reduce activity efficiency. This paper proposes a novel activity efficiency model in business process under conflict information. First, the evidence theory and Pignistic probability conversion are used to measure the conflict information by the difference sum of the probability conversion function based on the relations among the evidences. Second, the M/M/1 queuing system and the mapping between the conflict coefficient and service time are adopted to set up the single activity efficiency model, which is followed by the key activity efficiency models with respect to the four typical process structures, such as the Sequence structure, OR-Join structure, AND-Join structure and loop structure. Then, for a validation experiment, the road-rail intermodal transport business process is introduced and the container preparation activity of the operator sub-business process is demonstrated. As a result, the conflict information has a clear impact on the container preparation activity efficiency. Finally, it is concluded that the models here achieve to quantify the impact mechanism of conflict information on one activity efficiency, which indicates the activity service optimization direction from the view of information sharing.
- Copyright
- © 2021 The Authors. Published by Atlantis Press B.V.
- Open Access
- This is an open access article distributed under the CC BY-NC 4.0 license (http://creativecommons.org/licenses/by-nc/4.0/).
1. INTRODUCTION
Business process is composed of multiple interconnected sub-processes or activities that together achieve business goals. Over the past few decades, business processes have been worked as modern organizations core, and continue to evolve to meet changes in business requirements [1]. Owing to the rapid development of workflow technology, the business process is realized to the computerized management and control. In recent years, a lot of literature has also explored on business process including execution efficiency. As to Shi Mei-hong et al. [2] adopted the ECA rules to monitor business process efficiency and establish a real-time management framework for business process efficiency. Yu et al. [3] proposed the Runtime Balanced Clustering Algorithm and Dependent Balanced Clustering Algorithm based on the Backtracking method and dependent correlation, which reduced the execution time of workflow. Xie et al. [4] built a system that minimizes business process cycle time dynamic task allocation model on the basis of personal worksheets, queuing theory, and statistical theory. Obviously, the process efficiency is determined by its activities' efficiency. Liu and Fan [5] took activity as the basic unit, and the measurement frame for average value and probability density function of the workflow model waiting and processing time was proposed based on queuing theory and multi-dimensional workflow network. From the view of process nodes (activities) consumption, Ling Xin-yang [6] proposed a activity time scheduling algorithm under time constraints and time conflict nodes. Hsu et al. [7] analyzed the process instances during the activity execution including the processing, transmission, queues, and delays, and built a k-nearest neighbor method that was used to detect the activity duration time of process instances. Here the time conflict is considered for efficiency, but more importantly, the information conflict has more impact on efficiency because many activities are always implemented by man.
Additionally, the conflict information processing is concerned by many researchers, which focuses on the measurement methods of information conflict degree and the improvement of conflict-reducing mechanism, whose function is to minimize counter-intuitive phenomena and promote the integration of multi-source information. As to the former, the evidence theory is a powerful tool for these uncertain information processing. Many conflict measurement methods are studied and proposed including Pignistic probability distance [8], Jousselme distance [9], conflict rate [10], relative coefficient [11], and belief divergence measure [12]. Meanwhile, the research on the conflict-reducing mechanism has also achieved certain results. González-Pachón et al. [13] proposed a model to minimize the matrix distance function based on the order and basic information of objects for inconsistent preferences. Zhou Mi et al. [14] proposed a new attribute weight allocation method which is considered the difference of different belief distribution and carried out the conflict measurement of attribute to reduce the impact of conflict on multiple attribute decision-making schemes. Obviously, it is useful to overcome the subjectivity of the evidence theory [15] and the problem relaxation by expanding the conflict constrain [16]. As to the activity efficiency model, the measurement of information conflict is the focus.
In order to validate the activity efficiency model, the road-rail intermodal business process is used for experiment. Usually, the network optimization [17], cost minimization [18], and business process performance [19] are the main issues for the road-rail intermodal transport. Besides, the conflict information in the road-rail intermodal business process concerns the information fusion based on evidence theory. Here the coordination efficiency of road-rail intermodal transport among the participants under conflict information is the goal of experiment. In this paper, the evidence theory is also adopted to measure the inconsistency degree of multi-source information, the activity execution to use resource for business process instances is regarded as M/M/1 queuing system, then the activity efficiency model is constructed for several typical business process structures, which is followed by the activity experiment in the road-rail intermodal business process.
This paper is organized as follows. The foundation of evidence theory is introduced in Section 2. The efficiency model for the conflict information is built based on Pignistic probability function in Section 3, which measurement of conflict information, the efficiency of business process activities and the key activity are discussed respectively. The experiment of road-rail intermodal is carried out for validation with discussion in Section 4. The conclusions are drawn in Section 5.
2. FOUNDATION OF EVIDENCE THEORY
Evidence theory is an effective theory that is used to deal with uncertain information. It was proposed by Dempster and later added by Shafter, also known as Dempster–Shafer theory (DS evidence theory). The theory mainly includes the following two stages.
2.1. Acquisition of Basic Probability Distribution
Definition 1.
Frame of discernment (FOD) If
Definition 2.
(Basic probability assignment, BPA) If
Then
Definition 3.
(Belief function and plausibility function) In the FOD
Then
2.2. Combination of Evidence
Definition 4.
(Combination rule) When
Here,
3. THE ACTIVITY EFFICIENCY MODEL CONSTRUCTION
In order to measure the conflict information for the activity execution, some basic assumptions about the activity in the business process are defined as follows:
During the processing of the activity
The arrival process of business process instance is subject to the exponential distribution with the parameter
The capacity of the activity
The service rate of resources at activity
The conflict information generally refers to the improper handling of the basic probability distribution function when the evidences are combined, resulting in counter-intuitive results. For the business activities, multi-source information is received, and there is inconsistency between the information, so it is necessary to measure the conflict information. The conflict between the information is usually related to the distance of the evidence.
In order to measure the conflict degree of multi-source information as reasonably as possible, the improved Pignistic probability distance is used to measure the inconsistent information based on the idea of literature [20], which is the distance summation of the probability transformation function under the framework
3.1. Measurement of Conflict Information
3.1.1. Pignistic probability function
Under the FOD
In the formula (6),
3.1.2. Probability transformation function
Step 1: Proportional reliability conversion
Step 2: Proportional plausibility conversion
Step 3: Probability transformation
3.1.3. Evidence relationship and conflict measurement
With the FOD
Case 1: When the maximum value of the corresponding probability transformation function of evidence
Case 2: When the corresponding maximum value of the probability transformation function of the evidences
Case 3: When the maximum value of the corresponding probability transformation function of evidence
In the formula (12),
3.2. The Single Activity Efficiency Model
For each business process activity, the execution process of business process instances can be regarded as M/M/1 queuing system, in which the process instances are considered as customers and the activities are seen as service stations. Then the execution time, the process instance waiting time, and waiting queue length are the efficiency indicators of the activity. Usually, the arrival rate and service rate are subjected to exponential distribution in the queuing system, so activity execution process is a birth and death process. Therefore, the activity efficiency is analyzed from internal execution process perspective. As for an activity
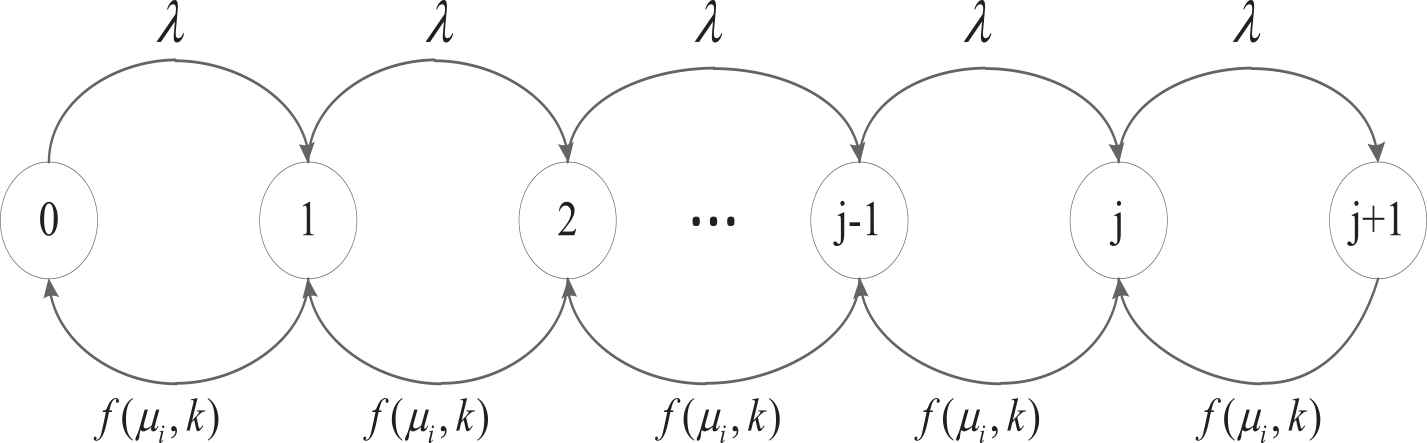
The birth and death process of M/M/1 queuing system under conflict information.
In Figure 1, the circle represents the system status of activity. The number in the circles represents the number of business process instances in activity stable state.
3.2.1. The function f(µi, k) definition
Among them,
3.2.2. The steady-state probability
According to the little law in queuing theory, assuming that the current state of business process activity is
The transition probability from state
Besides, the boundary conditions are
Then the derivative of formulas (18) and (19) are carried out with respect to
Moreover, when the maximum number of process instances tends to infinity, the probability of each state tends to be constant, and the derivative of the constant is 0. Therefore, the state transition equation in the equilibrium state is obtained:
Further derivation of the above formula:
In addition, due to
3.2.3. The activity efficiency calculation
Among them,
3.3. The Key Activity Efficiency Models
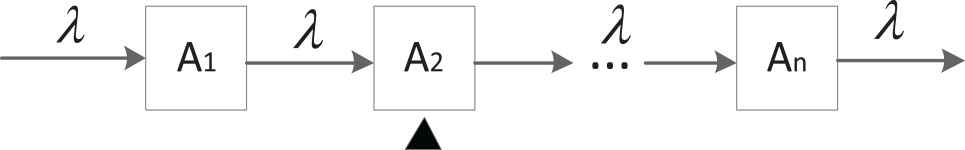
Based on the input flow of business process activity above, the different key activity efficiency models for the typical business process structures are described, including the Sequence structure, OR-join structure, AND-join structure, and loop structure [21]. In the following explanation figures, activity is denoted as a box and a triangle is used under the key activity (box). Especially, a circle is used for the key activity in AND-join structure instead of the box for the key activity in OR-join structure.
3.3.1. The key activity efficiency in sequence structure
In the Sequence structure, the business process is executed in order according to the sequence. Only after the execution of the previous activity, the latter activity is executed. In this structure shown in Figure 2, taking the key activity as an example, the calculation of its efficiency is implemented by using formulas (27), (28), and (30).
3.3.2. The key activity efficiency in the OR-join structure
Taken the activity
The key activity efficiency in Sequence structure.
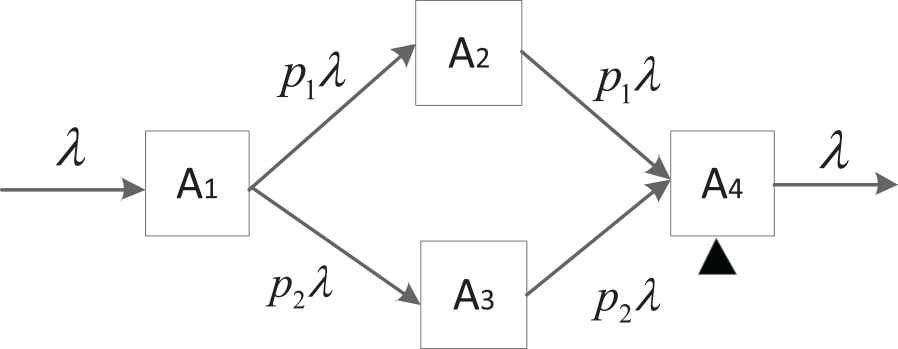
The key activity efficiency in OR-Join structure.
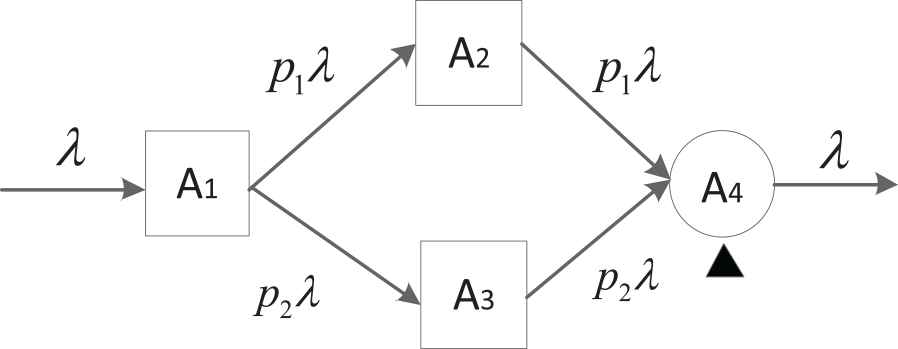
The key activity efficiency in AND-Join structure.
3.3.3. The key activity efficiency model in the AND-Join structure
Similarly, as is shown in Figure 4, assuming the number of activities in the AND-Join structure system is four, the key process activity is
3.3.4. The key activity efficiency model in the loop structure
There is a feedback phenomenon in business process. As shown in Figure 5, it is assumed that there are three process activities in the loop structure system. The key activity is the activity A3 which needs a feedback to activity A1. The probability p represents the information of the process instance does not enter the loop structure but is directly executed in sequence, and the probability
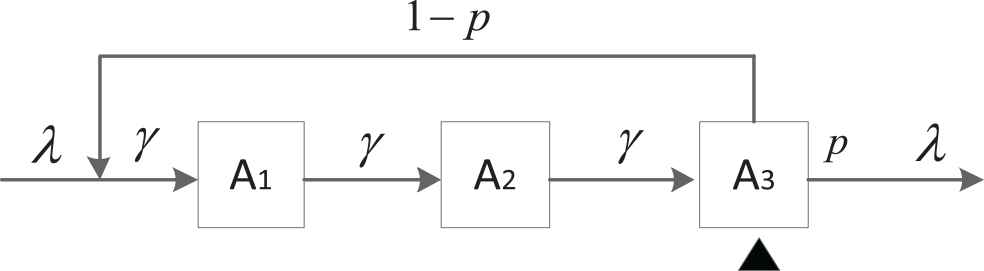
The key activity efficiency in Loop structure.
Subsequently, based on the above analysis, the algorithm for activity efficiency model execution are shown in Table 1.
| Input: The frame of discernment Arrival parameters of the business process instance The service rate of resources without conflict Output: Procedure: 1. Initialize: Business process model 2. 3. Construct the frame of discernment according to different types of information source 4. The information source is equivalent to BPA function, the evidence space 5. For Pignistic probabilistic conversion: Proportional reliability conversion: Proportional plausibility conversion: 6. If the maximum value of the corresponding probability transformation function of evidence elif the corresponding maximum value of the probability transformation function of the evidences else: end if 7. Judge the model structure of the business process 8. Judge the location of activities 9. If the activity elif the activity elif the activity else: end if 10. Print |
The algorithm for activity efficiency model execution.
4. THE ROAD-RAIL INTERMODAL TRANSPORT PROCESS EXPERIMENT
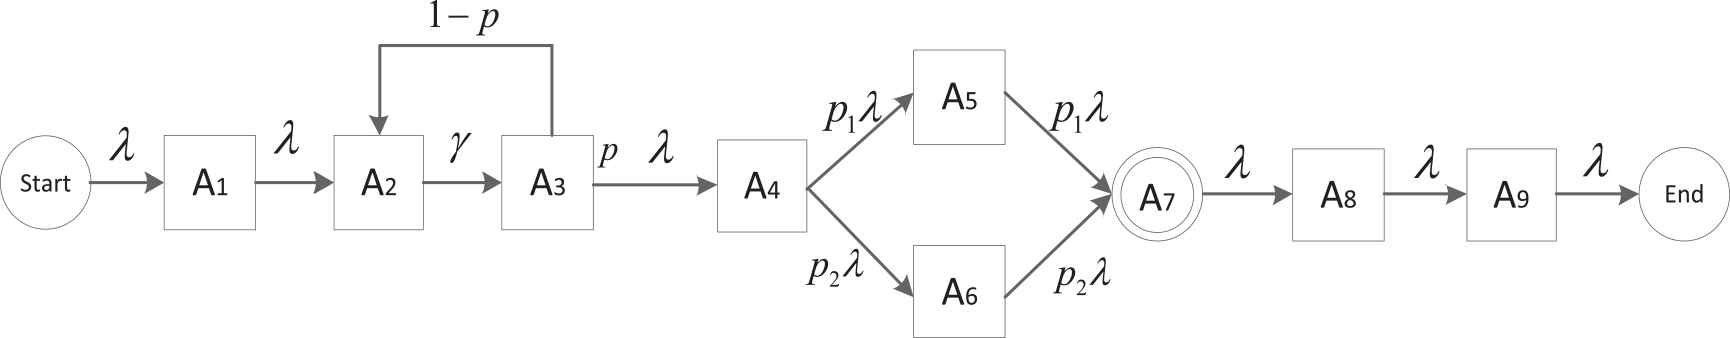
In the process of the logistics service of road-rail transportation, it mainly includes customers, cargo owners, railway-rail transportation operators, and railway company. Each participant has its own sub-business process. Different sub-business processes need to cooperate at some key activities together for road-rail intermodal transport. Meanwhile, some conflict information has an impact on those key activities, and the activities' corresponding efficiency can be considered based on our achievements above. Taking the business process of the road-rail intermodal transport operator as an example, it has the logistics service process like Figure 6, in which circle Start and circle End means the beginning activity and the end activity of this sub-business process. In the same way, box represents the activity. Double circles represent the container preparation activity, whose efficiency is considered later.
Logistics service process of road-rail intermodal transport operator.
In Figure 6, the activity
In this example, the efficiency of the container preparation activity is considered which is the key activity of the operator. As to the operator, it is necessary to integrate the container information of the railway company, the planning information of road-rail intermodal transport, and the inventory information of the cargo owner to complete the container preparation activity. Assuming the conflict information exists here, which causes the hesitation execution and reduces the service efficiency of the container preparation activity because of the different information fusion. In this regard, the above three sources of information are regarded as three elements
Probability transformation of evidences.
According to formulas (7–9), then we can calculate as follows:
The value calculation of the probabilistic transformation function of the proposition is:
Similarly, the calculation results for m2 is:
then:In summary, we have:
Calculate the conflict coefficient.
In the evidence
Calculate container preparation activity efficiency.
According to the description of the sub-business process, this container preparation activity is located in the AND-Join structure activity in the operator business process. Based on the analysis of the historical data, it is concluded that the process instances arrive at this activity with exponential distribution (4 times per hour). The service time without the impact of conflict information also subjects an exponential distribution, and the processing time of each process instance is 10 minutes. So
By formula (36), the activity efficiency result is obtained as follows.
Therefore, the information conflict has a clear impact on the container preparation activity efficiency. As a result, the queue length of the process instance is 2.519, and the wait time of each process instance the time is 0.63h. The container preparation activity execution time for each process instance is 0.192h. It is obvious that the process instance stays at the container preparation activity too long owing to the three-source conflict information and the possible following works include reducing the information conflict to optimize activity services and improve process efficiency.
5. CONCLUSIONS
This paper proposes an activity efficiency model in business process under conflict information, in which the evidence theory and Pignistic probability conversion are used to measure the conflict information. In fact, the conflict coefficient is the difference sum of the probability conversion function based on the relation among the evidences. Then the M/M/1 queuing system and the mapping between the conflict coefficient and service time are used to build the single activity efficiency model, followed by the key activity efficiency models with respect to the four typical process structures.
Under the context of road-rail intermodal transport business process, the container preparation activity of the operator sub-business process is demonstrated for model validation. Therefore, the activity efficiency model under conflict information can reveal the impact mechanism of conflict on efficiency. And it also provides a basis for decision-making to improve the efficiency of business processes in the context of information sharing.
Further research will extend our research from “point” to “line” or “net” and establish multi-input, multi-activities, multi-output process efficiency model, including several applications to find the reasonable strategies of multi-source information sharing to improve the process efficiency.
CONFLICTS OF INTEREST
The authors declare that there is no conflicts of interests regarding the publication of this article.
AUTHORS' CONTRIBUTIONS
Xiaoping Qiu contributed to the conception of the study; Juan Li contributed significantly to analysis and manuscript preparation; Ruin Fatimah performed the experiment and wrote the manuscript; Jiong Chen helped perform the experiment.
ACKNOWLEDGMENTS
The research is supported by the National Natural Science Foundation of China (Grant No. 61673320), National Key R&D Program of China (Grant No. 2019YFB2101802), Research and Planning Fund for Humanities and Social Sciences of the Ministry of Education in China (Grant No. 19YJA630057), International S&T cooperation program (Grant No. 2020-GH02-00064-HZ) of Chengdu and Chengdu Soft Science Research program (Grant No. 2020- RK00-00370-ZF).
REFERENCES
Cite this article
TY  - JOUR
AU  - Qiu Xiaoping
AU  - Li Juan
AU  - Ruin Fatimah
AU  - Jiong Chen
PY  - 2020
DA  - 2020/12/21
TI  - Activity Efficiency Model in Business Process Under Conflict Information and Its Application
JO  - International Journal of Computational Intelligence Systems
SP  - 528
EP  - 536
VL  - 14
IS  - 1
SN  - 1875-6883
UR  - https://doi.org/10.2991/ijcis.d.201215.004
DO  - 10.2991/ijcis.d.201215.004
ID  - Xiaoping2020
ER  -