
Fault Tree Construction Model Based on Association Analysis for Railway Overhead Contact System
 , Long Yu2, Shibin Gao2
- DOI
- 10.2991/ijcis.d.201105.002How to use a DOI?
- Keywords
- Railway OCS; Association rule acquisition; Fault tree construction
- Abstract
The overhead contact system (OCS) is the power source of electrified railway, it is very important to evaluate the system status accurately to maintain its safe and stable operation. At present, fault tree analysis is the main method of reliability assessment for OCS. Existent methods to establish the fault tree divide the system into functional modules and require professional knowledge, which limits the failure cause and makes the result subjective. Besides, the fault tree constructed by traditional method cannot reflect the difference between the same system under different working conditions. In this paper, we applied association analysis to OCS for the first time and proposed a novel fault tree construction model based on characteristics of OCS. Firstly, hierarchical structure and method of multi-dimensional partition (MDP) is proposed to flexibly transform the failure records of OCS into transaction database, which can reduce the sparsity of data. Secondly, the failure mode intensity is defined to replace the support, which can eliminate the influence by complex layout of railway and make the mining result more reasonable. Adjustment factor and new pruning strategy are proposed for mining association rules among levels. Thirdly, the transformation from rules into fault tree structure is presented and fault tree construction model based on association rules is proposed. At last, a case study is conducted based on real failure records database of two local railway administrations of China sharing the same OCS design and the comparison between fault trees constructed by our model and traditional method verifies that the proposed model can build the adaptable fault tree in a more objective way without the limitation of modules.
- Copyright
- © 2021 The Authors. Published by Atlantis Press B.V.
- Open Access
- This is an open access article distributed under the CC BY-NC 4.0 license (http://creativecommons.org/licenses/by-nc/4.0/).
1. INTRODUCTION
With the increase of train speed and the extensive deployment of high-speed railway (HSR) in China, the operation reliability of railway has received much attention. The overhead contact system (OCS), as the sole power source of HSR, is required to maintain the safe and stable performance. Because once the OCS enters into the failed state, trains of the entire line will run behind the schedule or even suffer from downtime, which may cause cascaded social impact and inestimable economic loss. Consequently, the research of reliability assessment [1] for railway OCS is significant and promising, which will enhance the system security by evaluating the current system status.
Several methods of the reliability assessment for railway OCS have been developed, such as the fault tree analysis (FTA) [2,3], the Bayesian network [4], the Markov chain [5], the Bayes Monte Carlo assessment method [6,7], and their improved methods [8]. Among them, the FTA [9] is the most widely used, which was invented by H.A. Watson in 1961 with the intention to help in the design of US Air Force's Minuteman missile system. After the advent of this method, it has made an important contribution to the reliability analysis and assessment of complex systems. Nowadays, it has been applied in many fields, like robot [10], transport [11], Internet of Things (IoT) [12], etc.
The FTA analyzes the top event based on the probability of bottom events through the fault tree constructed from top to bottom, which requires the analysts have deep awareness of system and should be aware of all potential elements in the system, also the connection of them [13]. Therefore, the fault trees constructed by different people in allusion to some complex system can be obviously different. In addition, the traditional fault tree construction method [14–16] is generally based on functional modules or mechanical structure to divide the system. This virtually limits the cause of failure only happens in the same module or in the same sub mechanical structure. However, in a complex system (such as OCS), the elements that may cause failure are diverse, which may be between modules or subsystems. More importantly, there is no difference between the fault trees constructed for two identical OCSs, despite their different service environments and operating frequencies. As a result, the evaluation of system status cannot be adjusted according to the characteristics of each system. Inaccurate assessment results will promote the occurrence of accidents, resulting in irreparable consequences. Based on the discussions above, an objective fault tree construction method which can break the module limitation and has adaptability is urged to be proposed.
In recent years, the OCS failure record database of all local railway administrations has been built gradually, which stores numerous failure records and inspires us to study from the perspective of data mining. Association analysis, one of these technologies, emerges as a promising method to solve the current problem, which has the ability to reveal the inner connections between OCS failure modes and shows great potential for optimizing the fault tree construction for OCS. Association analysis obtains association rules by mining the historical failure records with the form of “A→B,” where A and B are two different failure modes or combinations. The directivity of association rules shows the causality between failure modes and can provide guidance for the construction of fault tree. For example, the association rule “A1→A2” means that failure mode A1 and A2 occurred frequently, and the appearance of A1 often leads to the occurrence of A2. By discovering such rules, we can consider failure mode A1 as a child element of A2 to complete the construction of fault tree. The advantage of association analysis is that this method is completely data-driven, faithfully reflects the information of failure records and the knowledge acquisition is carried out in a full range of failure modes. It seems that association analysis is a feasible method to solve the above problems, but the existent methods cannot be directly applied to OCS, which still need to be adjusted by characteristics of OCS.
Association analysis was first proposed by Agrawal and Srikant in 1993 [17]. After over two decades of development, it has many improved algorithms, but all of them are based on three basic models: (1) Apriori-based, breadth search in horizontal data format, with Apriori [17] as its representative, (2) projection-based, depth search in horizontal data format, as FP-growth [18], and (3) vertical data format, such as Eclat [19]. These algorithms are designed according to the characteristics of the database to solve the problem. For example, UF-growth [20] and other algorithms are proposed to study the association rules of uncertain databases; high-utility pattern mining [21] is proposed to study items with high profits; CLARE [22] is proposed to study hierarchical items, etc. The common framework among these algorithms is using thresholds to ensure the generation of frequent itemsets and association rules, based on the Apriori property [17]: Every sub-pattern of a frequent pattern must be frequent (also called the downward closure property).
The OCS failure record database has its own characteristics: (1) sparsity, because the OCS is a highly reliable system, it is rare that two or more failure modes occur simultaneously on one pillar, which leads to most transactions of horizontal data format has only one item. This brings difficulties to the further mining work. We have to develop a flexible and appropriate method to cluster the records to ensure transactions have enough items. (2) complexity, railway layout is a complex network system, there are always differences among lines or sections. Binary Apriori or frequency of failure mode cannot be compared equally when we deal with failure data at macro level. Consequently, a unified standard needs to be proposed to replace the support. (3) Hierarchy, the OSC is a mechanical system, which has many kinds of possible failure modes (more than 2000 specific types). Some failure modes are not frequent respectively, but their combination can become frequent. To avoid missing this kind of information, it is wise to analyze association rules based on hierarchical structure. To address issues mentioned above, we proposed an improved algorithm (FHI) based on failure mode intensity (FI) for mining hierarchical structure of OCS failure record database, which uses FI as the parameter to evaluate whether the itemset is frequent after clustering failure records properly by multi-dimensional information partition method (MDP).
In this paper, we proposed a novel fault tree construction model for railway OCS based on our improved algorithm FHI, and our main contributions are summarized as follows:
To make the fault tree constructed more reasonable and accurate, we proposed to adopt the method of association analysis to guide the construction process. This method is applied to railway OCS and FTA for the first time.
To establish transaction database from original failure record database, a hierarchical structure with detailed encoding method is proposed, and a failure record partition method called MDP is developed to reduce the sparsity of data flexibly by choosing the scale when shaping the original failure records for the further mining work.
An improved algorithm is proposed to obtain association rules for OCS database with hierarchical structure by using FI to replace the support, which can effectively return the association rules and judge the failure modes more accurately.
A case study on real failure records collected from two local administrations sharing the same OCS design is conducted. Compared with the traditional method, our model can construct fault tree more objectively and flexibly, and can reflect the difference of the same system under different working conditions.
This paper is organized as follows: Section 2 proposes the hierarchical structure of OCS and a failure record partition method MDP. In Section 3, an improved algorithm (FHI) for mining hierarchical structure of OCS failure record database is proposed with a novel indicator and new pruning strategy. In Section 4, we introduce the elements of fault tree and propose the construction model by transforming association rules. At last, a case study is conducted in Section 5 and conclusions are presented in Section 6.
2. FAILURE DATA PREPROCESSING
In this section, the content of each failure record in the original database is introduced and a hierarchical structure of OCS failure mode with detailed encoding method based on its mechanical characteristics is proposed to make it prepared for the further mining work. To shape the original database into suitable transaction database, a failure record partition method based on the scale of information called MDP is developed to reduce the sparsity of data flexibly.
2.1. Failure Record and Hierarchical Structure of OCS
The railway OCS failure record database stores all failure information that collected by detection equipment or manual testing. Each occurrence of failure is a record in the original database, which contains the record identification, the location information (accurate to pillar), detection time, and the failure mode description, as shown in Table 1.
| No. | Location | Detection Time | Failure Mode Description | Code of failure Mode | ||||||
|---|---|---|---|---|---|---|---|---|---|---|
| Local Railway Administration | Line | Battlefield /Interval | Pillar No. | Kilometer Sign | TC | EC | AC | |||
| 6926 | Guangzhou Railway Bureau | Beijing-Guangzhou HSR | Shaoguan Station | 0099 | K2067 + 108.560 | 2015/7/15 | Damage of reinforced line without broken strand | 16 | 05 | 01 |
| … | … | … | … | … | … | … | … | … | … | |
The example of failure records in database of railway overhead contact system (OCS).
To obtain more interesting information from the full range of OCS failure modes (more than 2300 kinds), a three-level hierarchical structure is released according to the mechanical characteristics of OCS components, which is divided into type level, equipment level, and attribute level, as shown in Figure 1. All specific failure modes are placed at the bottom level, and their combinations are in the first and second level.
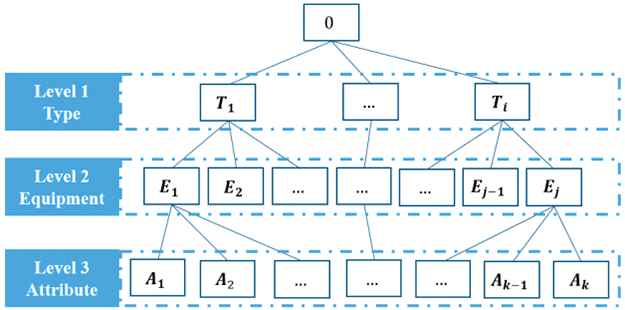
The hierarchical structure of overhead contact system (OCS) failure modes.
According to the principle of minimum description length [23,24], a set of string in minimum length is used to locate a position in this hierarchical structure, which has 6 digitals for each specific failure mode (2 digitals for each level). Besides, the frequency of any combination needs to be defined and the value equals to the sum of frequency of all its sub-level failure modes or combinations, as shown in (1):
2.2. Establishment of Transaction Database
Generally, the original database can be barely available for mining association rules. The preprocessing of data to shape into transaction database is necessary. However, the basic partition method based on the smallest unit is no longer applicable to failure data of railway OCS because of sparsity, which causes too many transactions with single item. To reduce the sparsity of data and obtain suitable transaction database, a partition method based on multi-dimensional information (MDP) is proposed to cluster the records.
In the original failure record database of railway OCS after coding, each record contains (1) the code of an item
When establishing transaction database, we have to make sure that the partition of failure records is reasonable, which means all records in one transaction should share the same physical or logical connection. For instance, failure modes occurred in a certain time or space can be put into one transaction considering that the environment and frequency of operation are similar.
As illustrated in Figure 2, all failure records can be put into a rectangular coordinate system consisting of time axis and space axis and each node represents a transaction divided by basic method. In our method MDP, the axis of time and space can be divided into finite intervals
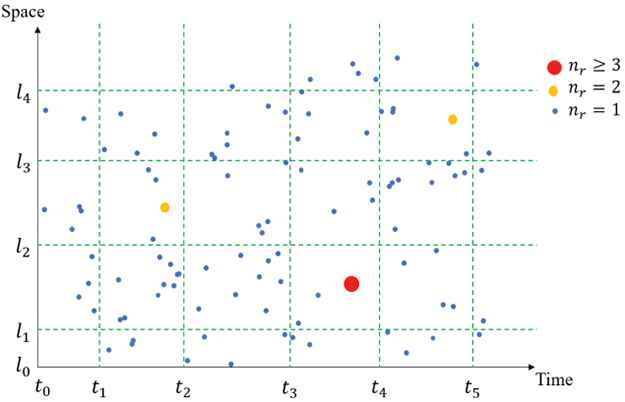
Schematic diagram of multi-dimensional partition (MDP) (nr: number of records).
To realize method MDP, we use the matrix called Binary Frequency Matrix to establish transactions and store the data. When scanning the original database
Based on the discussion above, the algorithm of partition method based on multi-dimensional information (MDP) is shown in Algorithm 1.
Algorithm 1: MDP Method
Input:
(1) Failure record database of railway OCS: R
(2) The choice of time and space scale:
Output:
Binary frequency matrix: F
Item index: I
1. Set transaction index
2. Scan failure record database R;
3. For each record
4. Generate tuple
5. End For
6. Return
7. T intersected by IT and IL;
8. K← Length of I; mn← Length of T;
9. Set binary frequency matrix F to zero matrix of size
10. For r in range (0, mn) do
11. For j in range (0, K) do
12. Employ Equations (2) and (3) to update the value of element
13. End For
14. End For
15. Return F
3. ASSOCIATION RULES ACQUISITION
In this section, we proposed a novel indicator, FI, to determine whether the itemset is frequent, which can eliminate the influence of complex railway layout. And then the adjustment factor is proposed to realize the batch calculation, the pruning strategy is improved according to the hierarchical structure. At last, our algorithm FHI for mining association rules among levels in failure record database is given.
3.1. FI and Adjustment Factor
In the previous section, we proposed method of MDP which has the ability to transform failure record database flexibly by selection of scale. It can reduce the sparsity of data and obtain suitable transaction database for mining work, but this method leads to unequal partition in order to ensure the correlation between failure mode records in one transaction. Unequal partition may disrupt mining results and even further interfere with the construction of fault tree. For example, an infrequent failure mode can be mistaken for frequent when few transactions have large frequencies caused only by unequal partition, which will lead to the deviation of system reliability assessment, wrong decision-making, and even the occurrence of accidents and inestimable consequences. Consequently, it is urgent to find a more reasonable indicator to replace the support.
In the detection and maintenance of railway OCS, FI is an important indicator to judge the state of OCS.
Definition 1 (FI).
In a given time and space interval, the FI is the frequency of OCS failure mode under unit time and unit distance, which is defined as (4):
With definition of FI, the influence of unequal partition can be fully eliminated. The settable standard interval is proposed to meet different requirements and the FI of any item
For an itemset
Define the following operation which has good downward closure property, as shown in (7):
Compared the equations for calculating FI of item and itemset, they have the same operations as matrix multiplication, which inspires us to do batch calculations of itemsets rather than separate calculations.
To realize the batch calculation, we use a matrix called Adjustment Factor Matrix
With adjustment factor matrix, the FI can be calculated by (9):
The multi-dimensional information of each transaction can be integrated into one coefficient, which means that a row vector
Based on the discussion above, a more reasonable indicator of support, FI, has been well defined and it can be obtained by row vector
The batch calculation of a set of itemsets
The confidence of two frequent itemsets can be obtained by their FI, as shown in (13):
3.2. Pruning Strategy
The Apriori property, also called the downward closure property, is still applicable in hierarchical structure [25]. In addition, we have found that there is similar property under the definition of combination's frequency. This property can be expressed as two following rules:
If a parent-level item is not frequent, all the sub-level items are not frequent.
If a sub-level item is frequent, all parent-level items are frequent.
Figure 3 shows two rules in a hierarchical structure of encoded items. Moreover, these rules can also be extended to itemsets. For example, for any frequent itemset, when the new itemset is still frequent after adding an item, the old itemset adding any parent-level item will be frequent. Conversely, when the new itemset is not frequent, the old itemset adding any sub-level item will never be frequent.
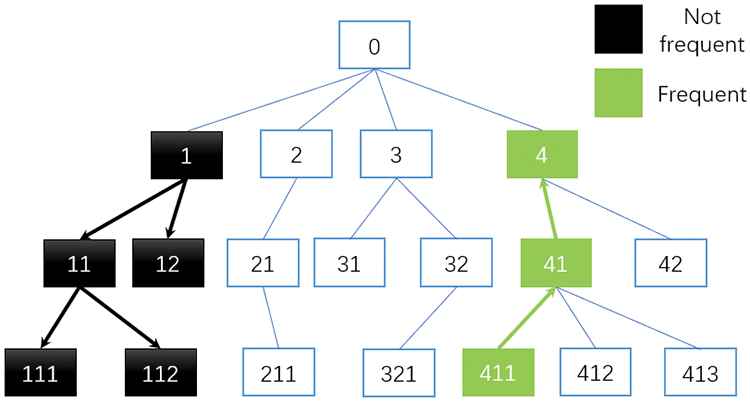
Two hierarchical rules in hierarchical structure.
According to the properties above, we have found that some itemsets can be judged whether they are frequent by other itemset. To improve the pruning strategy, we define this situation as follows:
Definition 2.
If each item in an itemset
With Definition 2, we propose a new pruning strategy in the process of generating frequent itemsets
All candidate itemsets are arranged in descending order according to the total length of all encoded items.
Candidate itemsets with the same total length of all encoded items can be judged together according to the following two situations:
If
For all itemsets which do not satisfy (a), we calculate their FI and compare with the threshold to determine which itemsets are frequent and put them into
The algorithm proposed for association rules acquisition based on FI for OCS database with hierarchical structure is presented in Algorithm 2.
4. FAULT TREE CONSTRUCTION MODEL
In this section, the basic structure and symbols of fault tree are introduced. And then the transformation from association rules to fault tree is proposed, which can be divided into four types according to the content of association rules. At last, the construction process of fault tree from association rules is presented and the algorithm is given.
Algorithm 2: Association rules acquisition (FHI)
Input:
(1) Binary frequency matrix: F
(2) Adjustment Factor Matrix: AF
(3) The minimum threshold:
Output:
Frequent itemsets: L
Association rules list: BR
1. Set k-candidate itemsets
2.
3. For (
4. Update matrix F(k) by
5. Sort
6. For itemsets sharing the same code length do
7. Employ improved pruning strategy to generate
8. End For
9. Return
10. For itemsets
11.
12. If
13.
14. End If
15. End For
16. Return
17. End For
18. Return
19. Generate association rules by
20. For each association rule
21. If
22.
23. End If
24. End For
25. Return
4.1. Symbols and Structure of Fault Tree
FTA is aim to calculate or estimate the occurrence probability of top event, which displays a logic structure of system using event symbols and logic symbols, called fault tree. Figure 4 shows the symbols will appear in a fault tree. In general, the rectangle represents an intermediate or a top event (combinations for OCS), and the circle represents a bottom event (specific failure mode of OCS).
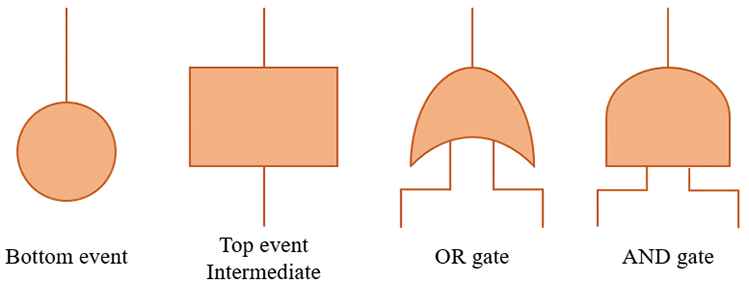
Symbols used in fault trees.
Besides, structure function is a common method to describe the fault tree, which can be seen as combination of logic AND gates and logic OR gate with “If-Then” rules. The AND gate presents the situation that the output event will occur if all the input events exist. An OR gate defines the logical operation in the situation where one or more of the input events is required to produce the output event [26].
The probability of top event is determined by the type of logic gate and its input events, as shown in (14) and (15):
4.2. Transformation Types of Association Rules
Association rules can be obtained by mining algorithm with proper threshold setting, their directivity can help to construct the fault tree. For example, the rule R: A→B can be transformed to itemset A as input event and B as output event. However, according to the content of itemset in each rule, the transformation can be divided into four situations based on whether the itemset is 1-itemset (only one item in itemset) or not. In the following part, we will present each transformation respectively. And the transformation under different situations are shown in Figure 5.
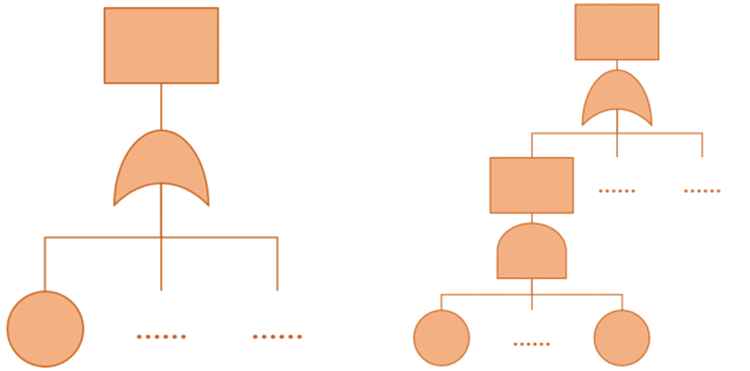
Transformation types of association rules.
One to One. Itemset A will form OR gate with other itemsets pointing to B.
Several to One. Each item in A will form AND gate and then constitute OR gate as situation 1.
X (One or Several) to Several. These situations are complex to transform. Fortunately, it can be separated into some “X to One” situations. Because once association rule
Proof:
Consider the rule
4.3. Fault Tree Construction Process
With the transformation of all kinds of association rules introduced above, fault tree can be constructed easily by traversing the big rule list. Nonetheless, the complexity of the system will return a large number of rules by algorithm, thus disordered traversal will bring confusion to the construction of fault tree and increase the time cost.
It is worth noting that the more frequent the failure mode, the more likely it is to become an output event, which is determined by the definition of confidence. Therefore, it is advisable to scan big rule list in descending order of FI. During the scanning process, each association rule will be classified and constructed according to its corresponding situation. The algorithm to construct the fault tree is shown in Algorithm 3.
Algorithm 3: Fault tree construction process
Input:
(1) Frequent itemsets: L
(2) Association rules list: BR
Output:
Fault tree structure: FT
1. Set
2. Sort L in descending order of FI(X);
3. For each itemset
4. For itemset
5. If
6. For item
7.
8. End For
9. Else
10. End If
11. End For
12. End For
13. Return FT
5. CASE STUDY
In this section, we report the performance of method MDP to reduce the sparsity of data and a case study is conducted based on two real failure record databases of railway OCS, whose records are collected from HSR lines of two local railway administrations sharing the same OCS design, denoted as DB1 and DB2.
5.1. Performance of Multi-Dimensional Information Partition Method
The density is an indicator to measure sparse data, its definition on a matrix is the proportion of nonzero numbers. And a matrix is called sparse matrix, when the proportion of nonzero numbers is less than or equal to 5%. Besides, the transactions with single item only affect 1-frequent itemsets, but have barely effect on association rules mining. Therefore, the proportion of transactions with single item cannot be too large. Based on the discussion above, we chose density and proportion of transactions with single item, denoted as
In the following part, the result of DB1 is shown in detail, while the same process has been implemented on DB2. For DB1, the density of transaction matrix divided by basic method is only 0.24%, and
| Density T1% | Day (%) | Month (%) | Quarter (%) | Year (%) |
|---|---|---|---|---|
| Bureau level | 1.62 | 9.52 | 20.52 | 47.61 |
| 35.50 | 13.79 | 0.00 | 0.00 | |
| Line level | 0.88 | 2.71 | 4.71 | 9.24 |
| 58.96 | 27.61 | 17.72 | 6.25 | |
| Battlefield level | 0.55 | 0.77 | 1.04 | 1.65 |
| 70.38 | 56.38 | 41.05 | 24.76 | |
| Pillar level | 0.24 | 0.25 | 0.25 | 0.25 |
| 96.80 | 96.14 | 95.70 | 94.06 |
Two indicators of different choice of scale (DB1).
According to the results in Table 2, with the increase of scale in time or space dimension, the density of data is increasing and the proportion of transactions with single item are decreasing together, which confirms the effectiveness of the method MDP.
The choice of scale is flexible, but it's not that the bigger the scale, the better the mining results. For example, the scale of (Year, Bureau Level) will put records of entire year in local railway administration into one transaction, which makes the data overly clustered and leads to few transactions for further mining work. Therefore, we should not only reduce the sparsity of data, but also ensure that enough transactions are provided for mining algorithm. Comparing the results in Table 2 and considering the number of transactions, the scale of (Year, Line Level) is the most suitable choice for DB1, which is also the best choice for DB2.
5.2. Comparison of Fault Tree
After choosing the scale to divide the records in original database of railway OCS, we have to set the value of time and distance for calculating the FI according to the target demand before mining association rules by algorithm. As an example, in this case study we assume that the target demand is to do mining work by failure mode frequency per hundred kilometers per year, which means
To mine association rules by algorithm, the thresholds of FI and confidence are needed, which are set as (6, 80%) both for DB1 and DB2. The number of rules returned is 82 for DB1 and 66 for DB2, which are shown as the failure mode relation network [27] in Figure 6. In Figure 6, each arrow represents one association rule, and the nodes on both sides of arrow are input event and output event respectively.
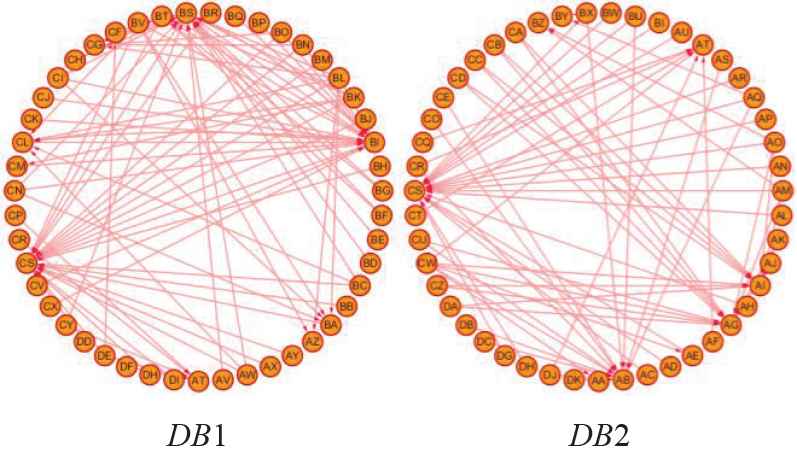
Failure mode relation networks of association rules obtained.
All the rules obtained from database will be traversed by our proposed fault tree construction model in the descending order of FI and the fault tree based on parameter setting and threshold setting is given. We take the two association rules with event S (the event with the highest FI) in DB1, R1: K→S and R2: N→S, as an example. R1 is traversed first and K is listed below as an event that raises S. Then, when traversing R2, N and K constitute OR gate, and because event N is a combination, all its combined events together constitute AND gate. The other association rules that point to event S will be traversed in turn. After that, all rules pointing to the event whose FI is less than S will be followed until the end of the traversal.
To present the differences between fault trees constructed by traditional way and our model, a part of the fault tree of railway OCS is shown in the following part, which is a sub fault tree with registration device fail (event S) as the top event. The sub fault trees of DB1 and DB2 are obtained by our proposed model, the sub fault tree of traditional method is presented in [3], the details of the three fault tree are shown in Figure 7. The events involved are listed in Table 3 with their codes and the corresponding failure modes.
| Code | Corresponding Failure Mode | Event |
|---|---|---|
| {'01, 02, 02'} | Height change of the contact line in one span overrun | A |
| {'01, 02, 02', '12, *, *'} | Height change of the contact line in one span overrun andsupport device fail | B |
| {'01, 03, 01'} | Contact wire zig-zag overrun | C |
| {'01, 08, 01'} | Hard spot overrun | D |
| {'02, *, *'} | Messenger wire fail | E |
| {'12, *, *'} | Support device fail | F |
| {'12, *, *', '30, *, *'} | Support device failandexternal environment impact | G |
| {'12, 01, *'} | Bracket for top anchor fail | H |
| {'12, 01, *', '13, 06, *'} | Bracket for top anchor failandeye clamp fail | I |
| {'12, 01, *', '13, 10, *'} | Bracket for top anchor failandsteady arm fail | J |
| {'12, 01, 07'} | Beta-split pin of bracket for top anchor fail | K |
| {'12, 02, *'} | Top anchor body fail | L |
| {'12, 06, *'} | Bracket for strut fail | M |
| {'12, 06, *', '30, *, *'} | Bracket for strut failandexternal environment impact | N |
| {'12, 06, 07'} | Beta-split pin of bracket for strut fail | O |
| {'12, 16, *'} | Clevis end holder fail | P |
| {'12, 17, *'} | Tie bar fail | Q |
| {'12, 18, *'} | Embedded parts in tunnel fail | R |
| {'13, *, *'} | Registration device fail | S |
| {'13, 01, *'} | Registration tube body fail | T |
| {'13, 06, *'} | Eye clamp fail | U |
| {'13, 08, *'} | Positioning bracing wire fail | V |
| {'13, 10, *'} | Steady arm fail | W |
| {'13, 11, *', '30, *, *'} | Steady clamp failandexternal environment impact | X |
| {'13, 11, *'} | Steady clamp fail | Y |
| {'13, 16, *'} | Positioning offset overrun | Z |
| {'15, *, *'} | Feeder wire fail | 1 |
| {'30, *, *'} | External environment impact | 2 |
Events involved with code and failure mode specification.
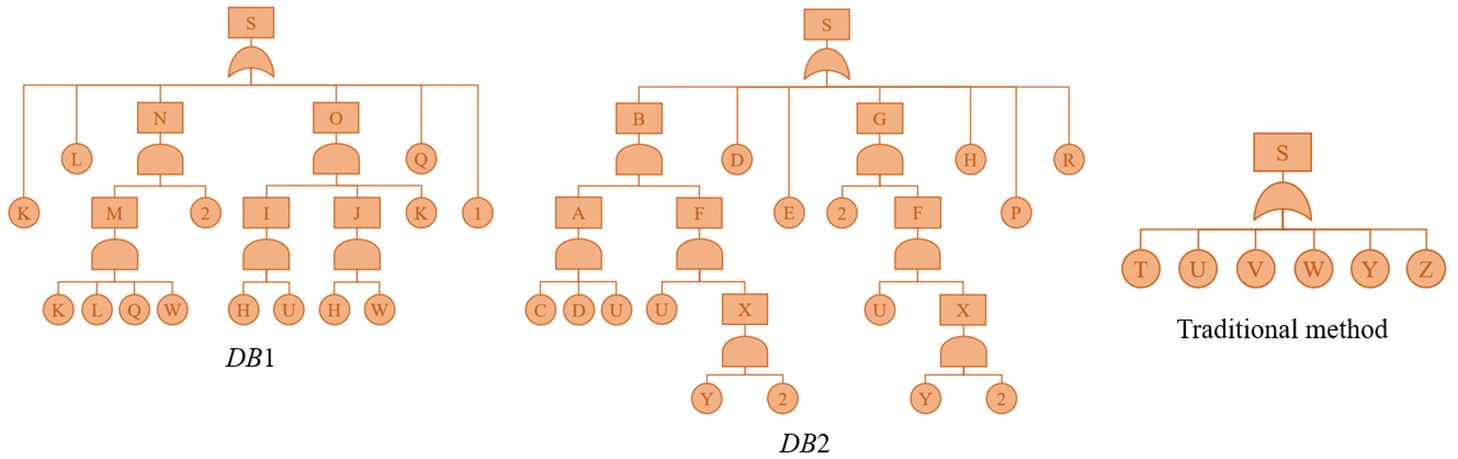
The details of the three sub fault trees obtained by our model and traditional method.
Generally speaking, the fault tree structure constructed by traditional method is too simple compared with our model, because even with professional knowledge, the awareness of failure mode is limited compared with association analysis.
The events listed in traditional fault tree are the components of top event (registration device fail.), while the events of DB1 and DB2 involve the failure modes among multiple modules, like contact line fail, messenger wire fail, support device fail, feeder wire fail, etc. It turns out that our model has a better understanding of the failure cause, because the association analysis is not limited by the module.
The system design of DB1 and DB2 is the same, which will lead to the same fault tree for them in the traditional way. However, the two systems have different running states, so it is unreasonable to evaluate the reliability based on the same fault tree. The results show that our model can adjust the fault tree structure according to the specific situation of each system which is reflected by the differences between failure records. For example, the fault tree structure of DB1 mainly contains the events of support device module and components of registration device, while that of DB2 adds the events of contact line module on the basis of DB1.
The results of our proposed model is unique under the same threshold and parameter setting, which means the fault tree established will not be affected by different users. And the complexity of fault tree can be modified by different threshold. For instance, the number of association rules will be reduced when increasing the threshold, which will lead to a simple structure of fault tree and vice versa.
Based on the discussion above, we can conclude that our proposed model for fault tree construction is objective and has better adaptability to the same system under different working conditions, which can break through the traditional module limits and deepen the understanding of the causes of failure modes. And the method MDP can flexibly transform the failure record database of railway OCS to transaction database, which can reduce the sparsity of data and provide suitable data format for association analysis.
6. CONCLUSION
To achieve more accurate evaluation of system status for railway OCS, we applied association analysis to OCS for the first time and explored a fault tree construction model to build the adaptable fault tree in a more objective way without the limitation of modules. According to the characteristics of OCS failure record, the hierarchical structure is proposed to well represent all failure modes and method MDP is proposed to reduce the sparsity of data and provide multiple options for establishment of transaction database. Then, an algorithm based on FI is proposed for mining association rules among levels from hierarchical failure record database. The fault tree construction model is proposed to establish the fault tree structure by traversing the big rule list. A case study is conducted based on two real failure record databases of railway OCS and the comparison of fault trees constructed by our model and traditional method verifies the superiority of this model.
It is worth mentioning that our proposed model is universal and can be applied to other sparse and hierarchical databases of complex system. For example, method MDP in this paper only involves two dimensions of information for classification, which can be extended to multi-dimensions. Moreover, FI can be replaced by other indicator of support in different application areas and different dimensional information involved.
CONFLICTS OF INTEREST
The authors declare that they have no conflicts of interest.
AUTHORS' CONTRIBUTIONS
The study was conceived and designed by Kaiyi Qian and Long Yu. The data was collected by Long Yu and Shibin Gao. Kaiyi Qian performed experiments, wrote the paper and correspondences. All authors read and approved the manuscript.
ACKNOWLEDGMENT
This work was partially funded by grants from the Key Projects of China State Railway Group Co., Ltd (No. N2019G023); the Key Projects of National Natural Science Foundation of China (No. U1734202); National Key Research and Development Plan of China (No. 2017YFB1200802-12).
REFERENCES
Cite this article
TY  - JOUR
AU  - Kaiyi Qian
AU  - Long Yu
AU  - Shibin Gao
PY  - 2020
DA  - 2020/11/10
TI  - Fault Tree Construction Model Based on Association Analysis for Railway Overhead Contact System
JO  - International Journal of Computational Intelligence Systems
SP  - 96
EP  - 105
VL  - 14
IS  - 1
SN  - 1875-6883
UR  - https://doi.org/10.2991/ijcis.d.201105.002
DO  - 10.2991/ijcis.d.201105.002
ID  - Qian2020
ER  -