
Regional Input–Output Multiple Choice Goal Programming Model and Method for Industry Structure Optimization on Energy Conservation and GHG Emission Reduction in China
- DOI
- 10.2991/ijcis.d.191104.002How to use a DOI?
- Keywords
- Industrial restructuring; Energy conservation; Greenhouse gas emission reduction; Big data analysis; Input–output model
- Abstract
To assess the potential of China's industrial restructuring on energy conservation and greenhouse gas (GHG) emission reduction in 2020, this study proposes an input–output multi-choice goal programming model and method. In this model, the goals include the maximization of gross domestic product (GDP), minimization of energy consumption and GHG emission. They are subjected to the input–output balance, economy development, energy supply, and industry diversity. And four scenarios with different decision preferences are taken into accounted in the solutions of the industrial structure optimization model. The results demonstrate that industrial restructuring has potential in energy saving and emission reducing. First, after optimization, energy consumption intensity and GHG emission intensity can drop by 13.88246% and 5.33767% over 2012, and GDP can grow up at annual growth rate 6.6% from 2013–2020. Second, promoting the development of the low energy-intensive and low GHG emission intensive sectors is an effective method for energy conservation and emission reduction. Three, compared to energy intensity reduction, GHG emission intensity reduction is less effective for four scenarios. Four, there are several difficulties to achieve the amounts and intensity control targets of energy conservation and GHG emission reduction simultaneously. It is suggested that China had better strive to promote progress of technologies of energy conservation and GHG emission reduction while adjusting the industrial structure.
- Copyright
- © 2019 The Authors. Published by Atlantis Press SARL.
- Open Access
- This is an open access article distributed under the CC BY-NC 4.0 license (http://creativecommons.org/licenses/by-nc/4.0/).
1. INTRODUCTION
Recently, energy, especially for the fossil fuels, has been consumed in large quantities to support the rapid development of human economy and society, which results a large number of greenhouse gases (GHG) emission. The massive emissions of GHG have led global temperatures rising, which will lead to global sea level raising and extreme weather impacts aggravating. It not only endangers the balance of natural ecosystems, but also threatens the survival of human beings. Therefore, conserving energy consumption, reducing greenhouse emission, and stabling global climate have become a worldwide consensus and universal task. China, the largest energy consumption and carbon emission country, has pledged to international community to achieve a 40%–45% reduction in carbon dioxide emission per unit GDP by 2020 over 2005 at the United Nations Climate Change Conference in Copenhagen in 2009 and incorporated energy conservation and emission reduction into its own long-term planning of national economic and social development as a binding indicator. Especially in the 13th Five-Year-Plan (FYP) of comprehensive work for energy conservation and emission reduction (2016–2020), China has formulated a series of mandatory strategies for energy conservation and emission reduction. Such as that by 2020, total energy consumption should be controlled within 5 billion tons coal equivalent. Total chemical oxygen demand, ammonia nitrogen, sulphur dioxides, and nitrogen oxide emission in China should be controlled within 0.01 million tons, 2.07 million tons, 15.8 million tons, and 15.74 million tons, which should be reduced by 10%, 10%, 15%, and 15% over 2015. The issue of effectively implementing the energy-saving and pollution control targets has emerged as an important agenda for Chinese government.
As seen as Figure 1, China has achieved remarkable results in energy conservation and emission reduction. Especially, the growth rate of total energy consumption has slowed down since 2012. Energy consumption per unit GDP has achieved negative growth and energy consumption per unit GDP in 2016 has decreased by 14% compared with 2012. To some extent, China is believed that it has the ability to achieve the goal of energy conservation and emission reduction in international community [1,2]. However, it should be seen that the reduction of energy consumption and carbon emissions per unit GDP in China is at the expense of economic growth. China economic growth has changed from high-speed growth to medium-high-speed growth since 2012. Especially, China's economic growth rate dropped further to 6.7% in 2016, reaching the lowest level since 1999. It deviates from the development goals of economic growth and income growth to a certain extent.
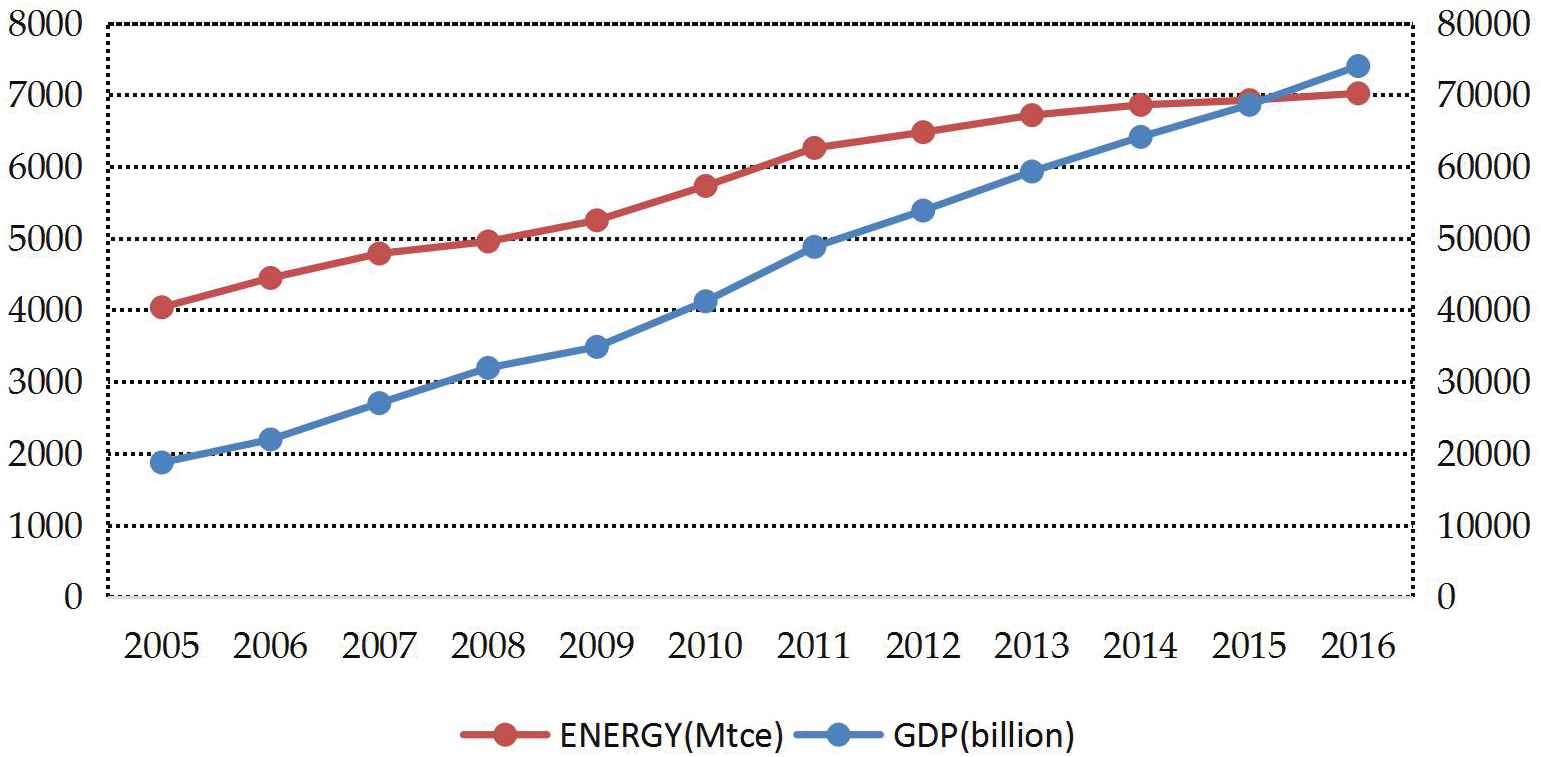
China energy consumption and gross domestic product (GDP) of 2005–2016.
It has a great possibility that the slowdown of economic growth will aggravate the financial expenditure pressure, regional competition pressure, and political promotion pressure faced by local governments, which will then translate into local governments' demand for rapid economic growth and rapid expansion of economic scale in their jurisdictions in the short term. Stimulated by irrational investment impulses, energy-intensive projects and infrastructure construction have a great possibility of being launched one after another. It is difficult to avoid the externalization of internal costs of enterprises by means of environment. Local governments tend to reduce environmental protection requirements and ignore the regional environmental costs brought about by the rapid increase of industrial energy consumption. Therefore, it is one of the important constraints for China to achieve sustainable green development to properly handle the balance between stable economic growth and the realization of energy conservation and carbon emission reduction targets.
According to the evidences provided by mounting literature and government documents, changing China's industrial structure and improving energy technology are two main significant methods for energy conservation and emission reduction. Among them, industrial restructuring indicates a reallocation of production across different economic sectors with various value-added, energy consumption, and GHG emission intensities [3–5]. A great deal of researches indicated that optimization method is the significant method of industrial restructuring mainly through incorporating multiple objectives and constraints [6–9]. Cristobal and Ramon [10] used two isolated models (one for the maximization of GDP, and the other one for minimization of GHG emissions) to optimize the industrial structure of Spain. Hristu-Varsakelis et al. [11] explored the optimal structure of Greece through formulating a linear programming model of maximizing the gross output subjected to energy consumption constraint and GHG emission constraint considering two scenarios (3% reduction in total demand and sectoral production changes
Though these studies have made contributions to quantify the interrelation between the industrial structure and energy conservation and emission reduction in various regions at macro-level based on multi-objectives GP and input–output (IO) models, but these studies show the need to be improved in diverse areas including: (1) Much of current researches optimized industrial structure using GP model, whose principle is to obtain the optimal industrial structure by minimizing the deviations between the predefined aspiration level of each goal and itself. Usually, there is only one aspiration value for one goal in GP model. However, it is a big problem for decision-makers to determine the aspiration value due to the conflicts of resources and the incompleteness of available information. Decision-makers, usually, would like to set multiple choice aspiration levels to avoid underestimating. But the current GP model cannot solve this problem. (2) Economy is an open system that relies heavily on the external trade. The GHG emission including carbon dioxide, methane, and nitrous oxide from the domestic energy consumption has been calculated. Yet, the GHG emission implied in imports is always ignored. (3) The energy consumption calculated in current reaches mostly only includes the energy used in the production process of sectors, but ignores the energy consumption used in final household consumption and energy loss in all processing. Inattention to the setting of aspiration levels of objectives and ignoring the GHG implied in imports and the energy consumed by household consumption and energy loss will result in delivering insufficient information in industrial structure adjustment.
This study, therefore, propose an input–output multi-choice goal programming (IO-MCGP) model and method for the optimization of China's industrial structure on the energy conservation and GHG emission reduction. The objectives of the industrial structure optimization are to achieve the greatest potential of reducing the total amounts of energy consumption and GHG emissions and maintain sustained and stable economic growth, which are subjected to constraints of input–output balances, economic growth, energy supply, GHG emission, and industrial diversity. The multi-choice goal programming (MCGP) model allows decision-makers to set multiple aspiration values for each goal to avoid underestimating the potential of goals and expands the original feasible region to the potential feasible region to obtain appropriate solution of industrial restructuring. The remainder of this article is organized as follows: Section 2 provided a summary of MCGP. The proposed MCGP model of industrial structure based on IO model is presented in Section 3. An illustrative application in China is described in Section 4. Finally, the results and suggestions of industrial restructuring for energy conservation and emission reduction in China are presented in Section 5.
2. MULTI-CHOICE GOAL PROGRAMMING
The GP, proposed by Charnes and Cooper [16] has been applied in most current industrial structure adjustment for energy conservation and emission reduction. Its main principle is to get the satisfactory solution by minimizing the deviations between the objectives and its aspiration level predefined by decision-makers. The GP model can be simply expressed as follows:
But in fact, it is difficult for decision-makers to set appropriate aspiration value of each objective to avoid underestimating the potential impacts of energy saving, emission reducing and economic growth in the optimization of industrial restructuring. Therefore, Chang [17] proposed MCGP which allows multiple aspiration value for each goal to avoid the underestimation of the decision. The MCGP can be expressed as follows:
For the less the better objective, the revised MCGP can be formulated as follows:
3. PROPOSED IO-MCGP
3.1. Assumptions
In order to facilitate industry structure optimization and achieve the simplification required in the proposed model, our proposed model and method is subjected to several assumptions and limitations. Here, we assume as follows:
The technology level of society remains unchanged as same as that of the base year.
The price of products of each sector remains the same as that of the base year.
The final demand is consistent to the basic year.
The proportions of consumption, capital formation, and net export are assumed to be consistent to the base year.
3.2. Goal Functions
According to the aim of this study, which is to discuss how to optimize China's industry structure so that it can achieve the goal of energy saving and emission reduction without reducing the level of economic development. The model proposed in this paper explicitly considers three competing and conflict objective functions. Maximization of gross domestic product (GDP) is chosen as economic objective, minimization of total energy consumption is chosen as energy objective, and minimization GHG emission is chosen as GHG emission objectives.
Goal 1: Maximization of the GDP generated by all sectors
Goal 2: Minimization of total energy consumption of all sectors
Goal 3: Minimization of the GHG emission of all sectors
3.3. Constraints
3.3.1. Constraints of basic linear equations of IO model
The IO model, proposed by Leontief [20] in 1930s, can not only track fund flow, but also energy consumption and GHG emission flow between sectors within a destination's economy by establishing a tessellated IO table and a system of linear equation [21]. The basic linear equations of the IO model as follows:
In the matrix notation, Eqs. (8) and (9) can be rewritten as follows:
The Eq. (10) can be rewritten as follows:
Since the linkage between imported products and domestic sectors does is not counted in China's IO tables, the following assumptions are made in this study to take into account the GHG emissions implied by imported products. Assuming that imported products are homogeneous with domestic products, all sectors treat imported products equally with domestic products when using them, they are related as follows:
3.3.2. Economic development, energy consumption, and GHG emission constraints
The reduction of energy consumption and carbon emissions is always at the expense of economic growth. In order to ensure stable the development of social and economy, the growth rate of GDP should be constrained at a certain level.
Industrial economic activities need to be supported by energy resource, especially for fossil fuels. But in fact, energy supply is non-renewable and finite. In order to conserve energy consumption and develop economy, the average growth rate of total energy consumption is constrained to smaller than
Three types of GHG emissions including carbon dioxide, methane, and nitrous oxide from energy consumption of economic activities are the main causes of climate warming. Many countries have set targets to reduce GHG emissions. China has set a target of reducing GHG emissions per unit of GDP by 17% in 2020 compared with 2015. Therefore, in this study, the average growth rate of total GHG emission is constrained to smaller than
3.3.3. Industry diversity constrains
The adjustment of industrial structure will make resource redistributing to flow to some industries with lower energy consumption and lower GHG emission. But in a region, we should not only develop one or some industries. Industry diversity should be protected to satisfy various demands. Even more, the industrial structure cannot be unrestricted and freely adjusted during a short period of time. Therefore, the industry diversity is constrained by the proportions of industrial value-added. The constraint can be expressed as follows:
Especially for the value-added constraint of the tertiary industry, the development level of tertiary industry is an important symbol to measure the development of modern social economy in a region. Compared with the developed countries with highly developed tertiary industry, China's economy relies more on the secondary industry with high energy and carbon intensive, which leads to the lagging development of tertiary industry and the imbalance of industrial structure. Therefore, China has raised the goal of increasing the proportion of the value-added of tertiary industry to 60% of total industrial value-added by 2020 in the 13th FYP. The proportion of the value-added of the tertiary industry is constrained as follows:
3.4. Model Formulation
According to Eqs. (3) and (4), the output of all sectors in the target year is denoted by
4. DATA RESOURCE AND RESULTS
In this study, we use the data of China in 2012 to assess the potential impacts of industrial structure adjustment on the energy conservation and GHG emission reduction in 2020. In the processing of solving the above linear programming, a relatively large volume of data necessarily must be required. The data of the IO table are derived from China Input–Output Table 2012 published by China National Bureau of Statistics (China National Bureau of Statistics [22]), whose economic activities are divided into 42 sectors in the Input–Output table, their codes and names are listed as in Table 1.
| Code | Name | Code | Name |
|---|---|---|---|
| S01 | Agriculture, forestry, animal husbandry and fishery | S22 | Scrap and waste |
| S02 | Mining and washing of coal | S23 | The production and supply of electricity and heat |
| S03 | Extraction of petroleum and natural gas | S24 | The production and supply of gas |
| S04 | Mining and dressing of metallic ores | S25 | The production and supply of water |
| S05 | Mining and dressing of non-metallic ores | S26 | Construction |
| S06 | Food manufacturing and tobacco processing Industry | S27 | Transportation and warehousing |
| S07 | Manufacture of textiles | S28 | Posts |
| S08 | Manufacture of textile wearing apparel, footwear, caps, leather, fur, feather (down) and its products | S29 | Information transmission, computer services, and software |
| S09 | Timber processing and furniture manufacturing | S30 | Wholesale and retail |
| S10 | Paper making, printing, and manufacture of articles for culture, education, and sports activities | S31 | Accommodation and catering |
| S11 | Petroleum processing, coking, and nuclear fuel processing industry | S32 | Finance |
| S12 | Chemical industry | S33 | Real estate |
| S13 | Manufacture of non-metallic mineral products | S34 | Leasing and business service |
| S14 | Metal smelting and rolling processing industry | S35 | Research and experimental development |
| S15 | Manufacture of metal products | S36 | Poly technical services |
| S16 | Manufacture of general and special equipment | S37 | Water conservancy, environment, and public facilities management industry |
| S17 | Manufacture of transport equipment | S38 | Resident services and other |
| S18 | Manufacture of electrical machinery and equipment | S39 | Education |
| S19 | Manufacture of communications equipment, computers, and other electronic equipment | S40 | Health, social security, and social welfare |
| S20 | Instrumentation and cultural office machinery manufacturing | S41 | Culture, sports, and entertainment |
| S21 | Handicraft article and other manufacturing | S42 | Public management and social organization |
Sectors categories and descriptions of input–output (IO) table.
Energy consumption data are from China Energy Statistical Yearbook 2012 (China National Bureau of Statistics [23]) while greenhouse emission of sectors in China are calculated based on the IPCC method [19]. Technology coefficient matrix of China's Input–Output table for 2020 can be obtained by “RAS” procedure, which is used to balance the columns and rows of input–output when updating or revising these tables [14,24,25]. Besides, some exogenous parameters should be treated as known quantities, including the lower and upper aspiration level bounds of three goals, the lower and upper constraint level bounds of the growth rate of GDP, energy consumption and GHG emissions, the growth rate of the proportion of sector's value-added on GDP, and the level of development tertiary industry, and so on.
When setting these exogenous parameters, we refer to relevant history data and government plans including data on the China's GDP and energy consumption from 2005 to 2012 (China National Bureau of Statistics [26]), the comprehensive work plan for energy conservation and emission reduction during the Thirteenth FYP period (the State Council [27]), and the 13th Five-Year Plan for national economic and social development of the People's Republic of China (National Development and Reform Commission [28]), and so on. To reduce the number of exogenous parameters, the lower and upper aspiration level bounds of the three goals are assumed to be consistent to the lower and upper constraint level of economic development, energy consumption, and GHG emission. Additional details on the model's parameter settings are presented in Table 2.
| Parameters | Meanings of the Parameters | Settings | Assumptions and Explanations |
|---|---|---|---|
| The lower and upper constraint level bounds of growth rate of GDP | 6%–8% | The average annual growth rate of GDP is between 6% and 8% from 2012 to 2016, and the growth rate of China's GDP is slowing down. | |
| The lower and upper constraint level bounds of growth rate of energy | 1%–5% | Assuming the structure and technology of energy consumption are unchanged, the average annual growth rate of energy is between 1% and 5% from 2012 to 2016 and have a trending downward | |
| The lower and upper constraint level bounds of growth rate of greenhouse gas emission | 1%–5% | Assuming that the emission intensity of energy does not change, the growth rate of GHG emission and GHG emission intensity per unit of GDP are set in the same way as energy consumption. | |
| The lower and upper level bound of the proportion of added value of tertiary industry | 55%–60% | The proportion of added value of services to the all value-added of all tertiary industry has reached 51.78%, and China has set the target that the proportion of added value of services to the all value-added of all industries will increased to 60% in the 13th FYP. | |
| The lower and upper level bound of the proportions of value-added of sectors on GDP | Details can be seen Table 3 | Assuming that the industrial structure cannot be adjusted freely from 2013–2020, the proportions of value-added of sectors on GDP can been forecast via the extrapolation of historical trends based on 2005–2012 values |
GDP, gross domestic product; GHG, greenhouse gas.
The settings of exogenous parameters in the model.
| Sector | Sector | ||||
|---|---|---|---|---|---|
| S01 | 0.09754 | 0.09754 | S22 | 0.00076 | 0.00089 |
| S02 | 0.01626 | 0.01894 | S23 | 0.00478 | 0.00558 |
| S03 | 0.01098 | 0.01279 | S24 | 0.00029 | 0.00034 |
| S04 | 0.00713 | 0.00830 | S25 | 0.01839 | 0.02143 |
| S05 | 0.00411 | 0.00478 | S26 | 0.00099 | 0.00116 |
| S06 | 0.03033 | 0.03534 | S27 | 0.00155 | 0.00169 |
| S07 | 0.01016 | 0.01184 | S28 | 0.07281 | 0.07943 |
| S08 | 0.00930 | 0.01084 | S29 | 0.09858 | 0.10755 |
| S09 | 0.00624 | 0.00727 | S30 | 0.04537 | 0.04950 |
| S10 | 0.01023 | 0.01192 | S31 | 0.01887 | 0.02058 |
| S11 | 0.01090 | 0.01271 | S32 | 0.02334 | 0.02547 |
| S12 | 0.03399 | 0.03961 | S33 | 0.06961 | 0.07594 |
| S13 | 0.01725 | 0.02010 | S34 | 0.06182 | 0.06744 |
| S14 | 0.02908 | 0.03389 | S35 | 0.02219 | 0.02421 |
| S15 | 0.00936 | 0.01091 | S36 | 0.01815 | 0.01980 |
| S16 | 0.01309 | 0.01525 | S37 | 0.00506 | 0.00551 |
| S17 | 0.00984 | 0.01147 | S38 | 0.01614 | 0.01760 |
| S18 | 0.01884 | 0.02195 | S39 | 0.03199 | 0.03490 |
| S19 | 0.01219 | 0.01421 | S40 | 0.01775 | 0.01937 |
| S20 | 0.01616 | 0.01884 | S41 | 0.00698 | 0.00762 |
| S21 | 0.00181 | 0.00211 | S42 | 0.03977 | 0.04338 |
GDP, gross domestic product.
The lower and upper level bounds of the proportions of value-added of sectors on GDP.
4.1. The Decision Preference and Setting of Weights
The proposed optimization model includes three goals: maximization of the economic growth, minimization of the energy consumption, and minimization of GHG emission. Since decision-making preferences of objectives significantly affects the solutions of industrial restructuring, to facilitate decision-making, four scenarios are taken into accounted in this study: namely equal importance of three objectives, economic growth priority, energy conservation priority, and GHG emission reduction priority.
4.2. The Solution of Industrial Restructuring
According to the decision-making preferences in Table 4, solutions of the four scenarios can be obtained through the MCGP method. Table 5 shows the results of the adjusted structures in 2020 and initial structure in 2012 of China. Except for Scenario D (GHG emission reduction priority), solutions of the industrial structure in the other three scenarios are basically identical.
| Decision Scenarios | Preference Description | Weights |
|---|---|---|
| A | Three objectives-equal importance of three objectives | |
| B | Three objectives-economic growth priority | |
| C | Three objectives-energy conservation priority | |
| D | Three objectives-GHG emission reduction priority |
GHG, greenhouse gas.
Decision-making preferences and setting of weights.
| 2020 | |||||
|---|---|---|---|---|---|
| Scenarios (2012 Price) | |||||
| Indicators (Unit) | 2012 | A | B | C | D |
| Total industrial output (Billion RMB Yuan) | 160162.70834 | 248772.79310 | 248772.67930 | 248772.60120 | 170835.59104 |
| GDP (Billion RMB Yuan) | 53680.01709 | 89560.03517 | 89559.95788 | 89559.90593 | 61361.95582 |
| The average annual growth rate of GDP (%) | 0.07900 | 0.06607 | 0.06607 | 0.06607 | 0.01686 |
| Proportion of the primary industry | 0.09754 | 0.09754 | 0.09754 | 0.09754 | 0.09673 |
| Proportion of secondary industry | 0.38457 | 0.30923 | 0.30909 | 0.30909 | 0.30962 |
| Proportion of tertiary industry | 0.51789 | 0.59323 | 0.59337 | 0.59337 | 0.59365 |
| Energy consumption (Mtce) | 3480.01660 | 5000.21991 | 5000.21981 | 5000.21978 | 3437.84698 |
| Energy consumption intensity (Mtce/Billion RMB Yuan) | 0.06483 | 0.05583 | 0.05583 | 0.05583 | 0.05586 |
| Proportion of the primary industry | 0.02656 | 0.03084 | 0.03084 | 0.03084 | 0.03048 |
| Proportion of secondary industry | 0.77872 | 0.71766 | 0.71766 | 0.71766 | 0.71885 |
| Proportion of tertiary industry | 0.19472 | 0.25150 | 0.25150 | 0.25150 | 0.25068 |
| The growth rat | 0.07160 | 4.63476 | 4.63476 | 4.63476 | −0.15228 |
| GHG emission (Mt) | 1422325.60687 | 2247224.58778 | 2247223.34225 | 2247222.26288 | 1540046.86908 |
| GHG emission intensity (Mt/Billion RMB Yuan) | 26.49638 | 25.09183 | 25.09183 | 25.09183 | 25.08209 |
| Proportion of the primary industry | 0.04218 | 0.04466 | 0.04466 | 0.04466 | 0.04427 |
| Proportion of secondary industry | 0.44414 | 0.39260 | 0.39260 | 0.39261 | 0.39318 |
| Proportion of tertiary industry | 0.51368 | 0.56274 | 0.56274 | 0.56274 | 0.56255 |
| The growth rate | 0.02990 | 5.88413 | 5.88413 | 5.88413 | 0.998951 |
| Imports (Billion RMB Yuan) | 12202.69787 | 17367.81789 | 17367.80840 | 17367.79946 | 11837 |
| The GHG emission of imports (Mt) | 73601.85478 | 103678.87036 | 103678.81397 | 103678.76063 | 70647 |
| The annual growth rate of import | 0.10515 | 0.04511 | 0.04511 | 0.04511 | −0.00611 |
| The proportion of the GHG emission implied in imports on the total GHG emission | 0.05175 | 0.04614 | 0.04614 | 0.04614 | 0.04587 |
| The growth up rate of the GHG emission implied in imports | −0.03791 | 0.04376 | 0.04376 | 0.04376 | −0.00750 |
GDP, gross domestic product; GHG, greenhouse gas.
China's Structure of GDP, energy consumption, and GHG emission for the four scenarios in 2020 after optimization.
Both Scenario A (equal importance of three objectives), Scenario B (economic growth priority), and Scenario C (energy conservation priority), the GDP can grow up to about 89560 Billion RMB Yuan at about 6.6% annual growth rate. The total energy consumption is about 5000 million tons of coal equivalent (Mtce), of which approximately 0.05583 Mtce is consumed per Billion RMB Yuan. GHG emission is about 2247223 million tons (Mt), of which GHG emission implied in imports is about 103679 Mt, accounting for 0.04614 of the total emissions.
In Scenario D (GHG emission reduction priority), the energy consumption, GHG emission, and GDP are 3437.84698 Mtce, 1540046.86908 Mt, 61361.95582 Billion RMB Yuan. But the growth rate of GDP is 0.01686, which is the smallest for the four scenarios. Several characteristics of industrial structural adjustment are shown as follows:
4.2.1. Energy consumption and GHG emission reducing remarkably
Table 5 shows that no matter in which scenarios, energy consumption intensity and GHG emission intensity can all be in decline remarkably through inter industrial structure adjustment from 2013 to 2020. Compared to the initial industrial structure of 2012, Chinese energy consumption intensity in 2020 can decrease by at least 13.88246%, GHG emission intensity drops by at most 5.33767%. Even more, the GDP can maintain steady growth while intensities are decreasing. Especially in scenario A, the GDP of China in 2020 rise from 53680.01709 Billion RMB Yuan in 2012 to 89560.03517 Billion RMB Yuan in 2020, which the annual growth rate of GDP can reach the largest rate (6.607486%). The energy consumption and GHG emission are 5000.21991 Mtce and 2247224.58778 million tons respectively. After optimizing, energy consumption can decrease 806.04032 Mtce, GHG emission can reduce 125791.54740Mt.
4.2.2. Sectors which are low energy intensity and low GHG emission intensive develop fast
Figure 2 shows China's industrial structure has been improved after optimizing. On the one hand, Sectors which are low energy intensity and low GHG emission intensity develop fast. For example, S29 (Information transmission, computer services and software) will develop to be the sector of the largest value-added in GDP. S28 (Posts), S33 (Real Estate) and S34 (Leasing and Business Service) will also develop fast with average annual growth rates of 8.59%. On the contrary, sectors which are high energy-intensive and high emission intensive develop slowly. The shares of value-added of three sectors, S12 (Chemical industry), S06 (Food Manufacturing and Tobacco Processing Industry), and S14 (Metal smelting and rolling processing industry) in GDP will fall the most. The value-added of S24 (The production and supply of gas) will occupies 0.3% of GDP which is the smallest proportion. S26 (Construction) also develop slow, which is the most high energy intensive (0.091787 Mtce/Billion RMB Yuan) and high emission intensive (44.113775 Mt/Billion RMB Yuan).
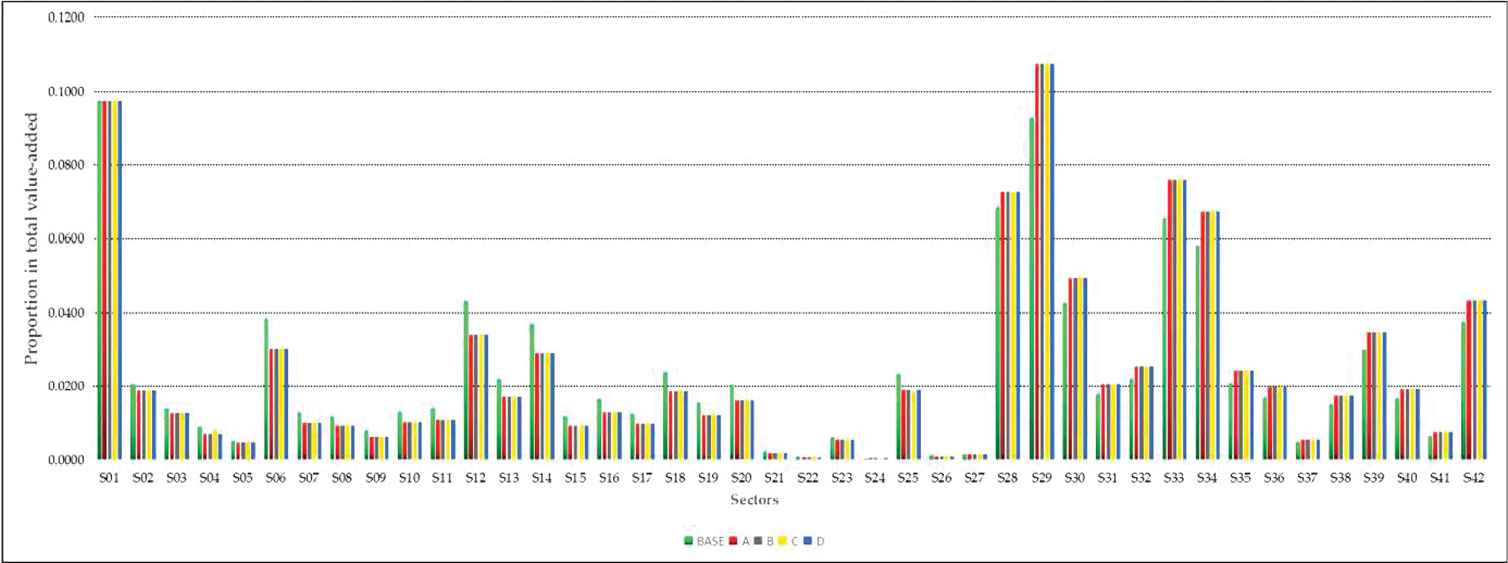
The proportion changes in the total value-added of 42 sectors among four scenarios in 2020.
On the other hand, it shows the average proportion of secondary industry value-added in GDP declines from 0.38457 to about 0.30926 for the four scenarios. The proportion of tertiary industry increases from 0.51789 to 0.59341, which basically achieves the target of developing the tertiary industry in China's 13th FYP. The proportion of primary industry remains unchanged as in 2012, which can protect the development of agriculture. With the change of sectoral value-added, the proportions of three industries for the energy consumption also change corresponding. As seen as Figures 3 and 4, the average proportion of energy consumption of secondary industry decline from 0.77872 in 2012 to 0.71796 in 2020, the average proportion of GHG emission of secondary industry decreases from 0.44414 to 0.39275. This change is conducive to energy conserving and emission reducing.
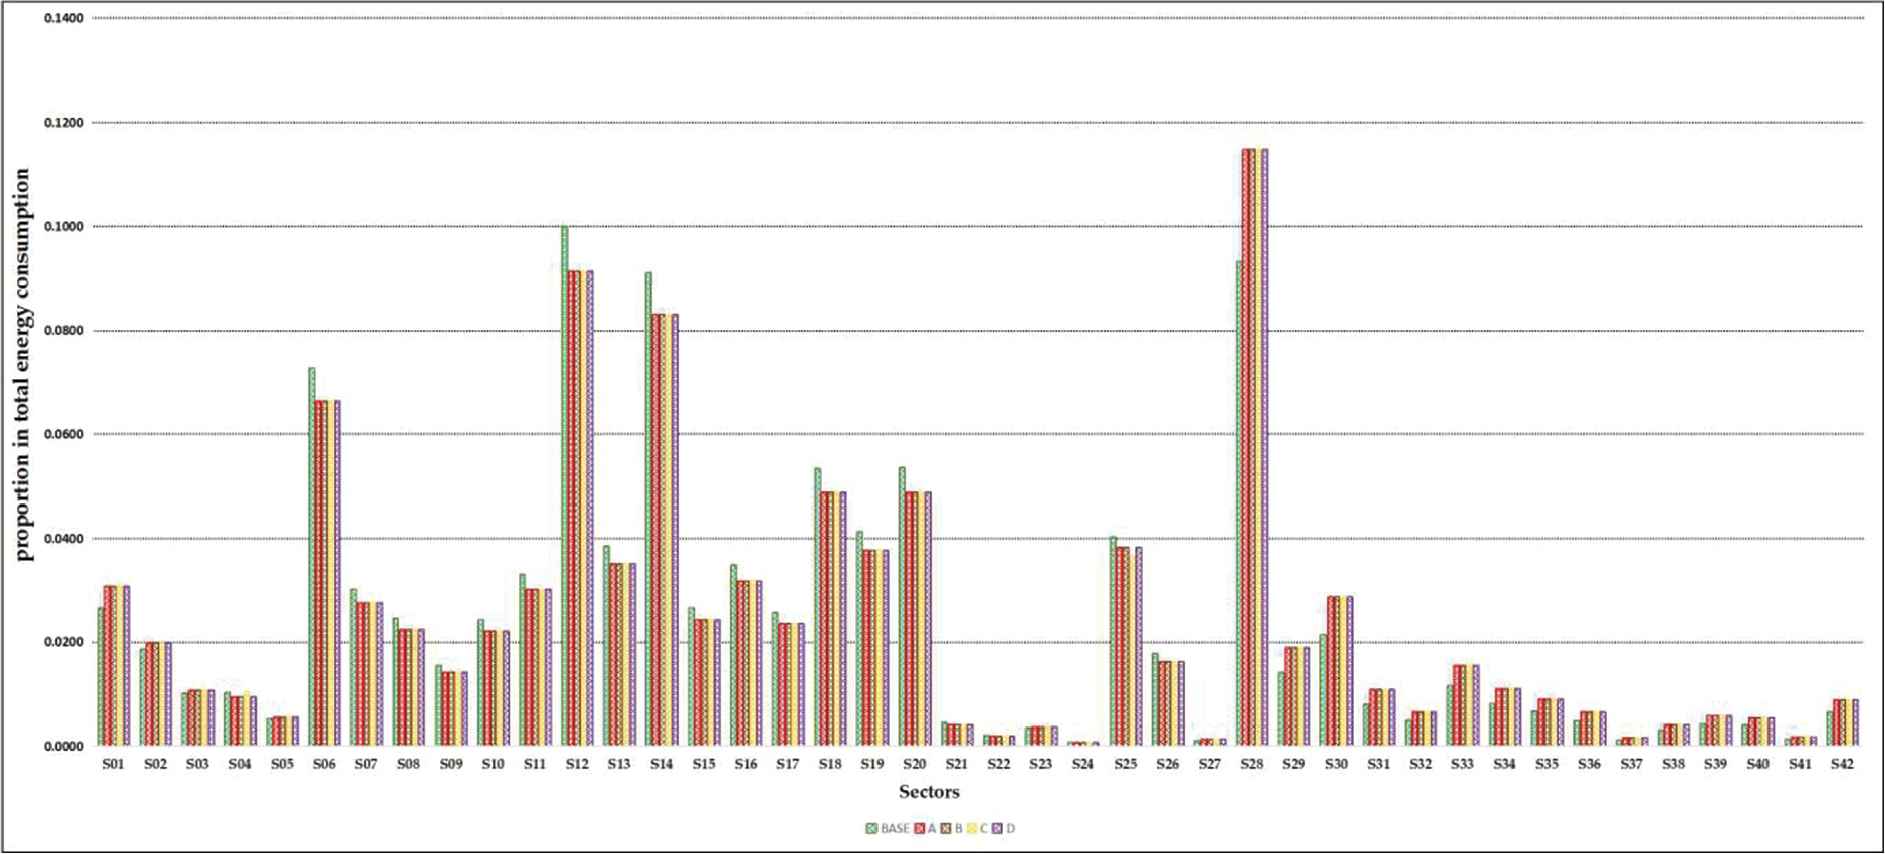
The proportion changes in energy consumption of 42 sectors among four scenarios in 2020.
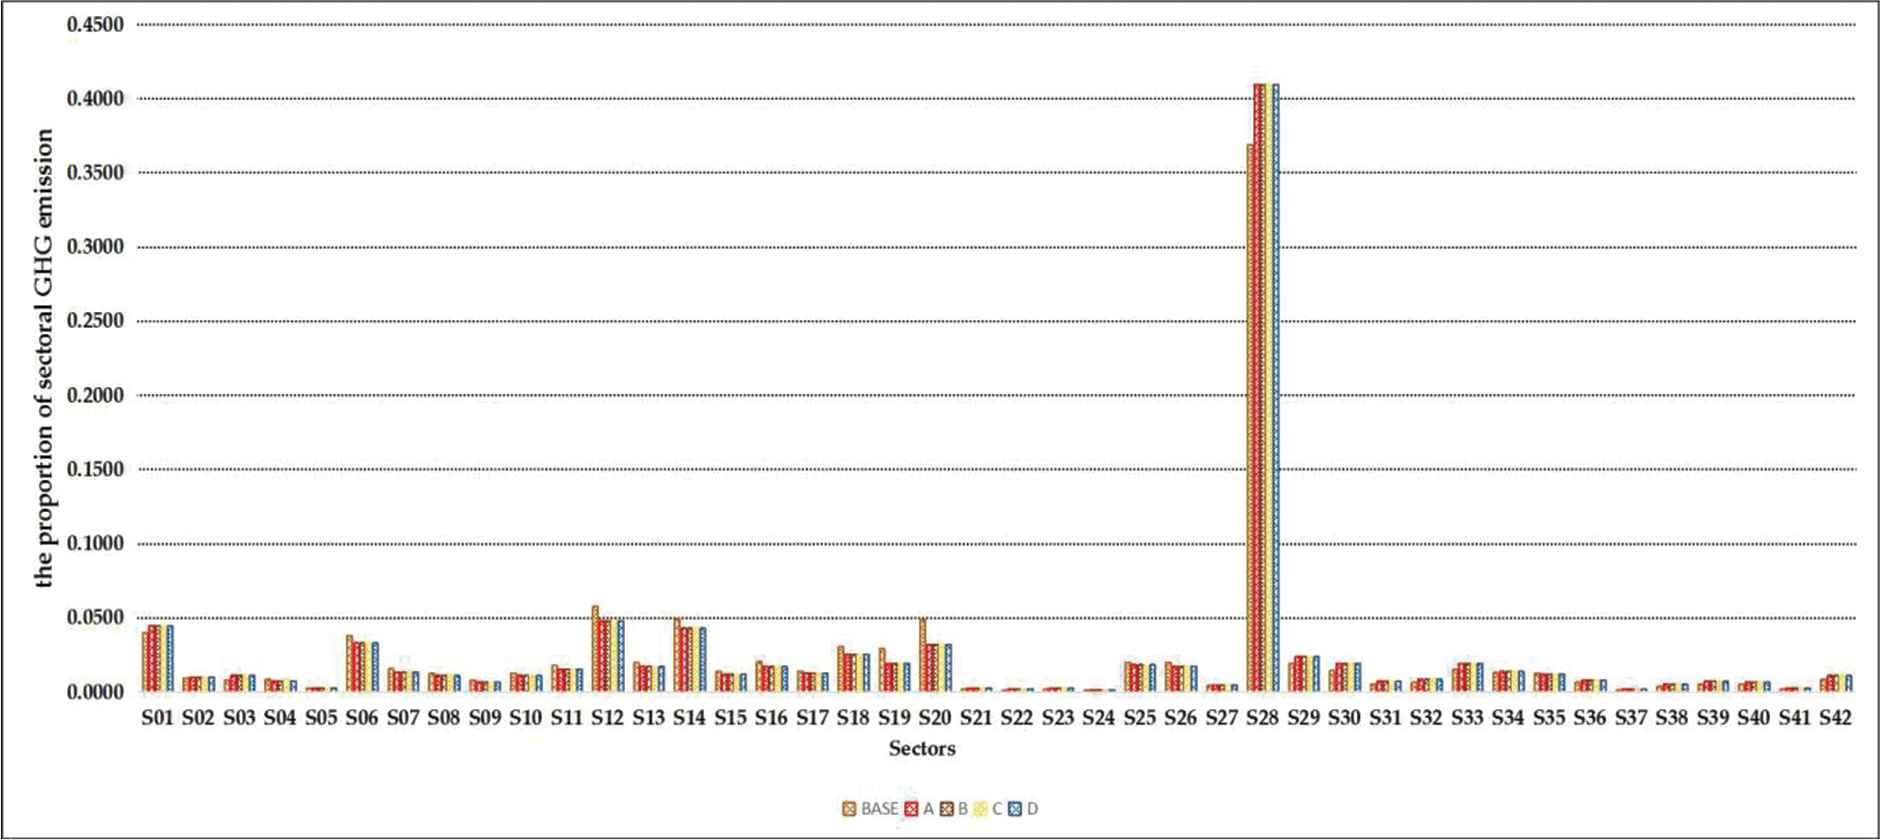
The proportion changes in GHG emission of 42 sectors among four scenarios in 2020.
4.2.3. Energy consumption conservation is more effective than GHG emission reduction
Energy consumption conservation and GHG emission reduction are the two main target in this model. According to Table 5, the results of Scenario A (equal importance of three objectives), Scenario B (economic growth priority), and Scenario C (energy conservation priority) are almost the same. Energy consumption is possible to reach the minimum when GDP reaches the maximum. Energy consumption intensity in 2020 decreases by 13.88246% while GDP grows at average annual rate of 6.6%. In other words, energy consumption is possible to decrease without negatively affecting economic growth. But for GHG emission reduction, GHG emission intensity drops by at most 5.33767% for the four scenarios. The fall in GHG emission intensity is smaller than the fall in energy consumption intensity, especially for the results of Scenario D (GHG emission reduction priority). The total amount of GHG emissions declines the most, which is the smallest of the four scenarios, but the growth rate of GDP is the smallest (1.7%) and the emission intensity is almost the same as the other three scenarios. Therefore, GHG emission reduction is less effective than energy conservation.
5. DISCUSSION AND CONCLUSION
Energy conservation and emission reduction is the core link of transformation of economic development model. And it needs to be resolved urgently in contemporary China. In this study, design, and optimization of industrial structure considering three objectives (Maximization of GDP, Minimization of energy consumption, and Minimization of GHG emission) are treated. The proposed IO-MCGP model is different from other models in literature by introducing the conception of multiple choices to determine the aspiration values of each goal. Each goal of industrial restructuring can be set multiple aspiration values to avoid be underestimated. According to China 13th FYP for energy conservation and emission reduction, this study applies this model to assess the potential impacts of industrial structure adjustment on the energy conservation and GHG emission reduction in 2020 based on China Input–Output Table 2012. According to the results, several conclusions can be gained.
Industrial structure adjustment has great potential of energy conservation and GHG emission reduction. After optimizing, the energy consumption intensity and GHG emission decline remarkably. Compared to the 2012, the energy consumption intensity in 2020 drops by 13.88246%, GHG emission intensity drops by 5.33767%, and GHG emits about 2247222 Mt. Energy is consumed about 5000 Mtce. The amount of energy consumption and GHG emission save 806.04032 Mtce and 125791.5474Mt, respectively. At the same time, GDP can grow up at annual growth rate 6.6% from 2013–2020. Such a growth rate of GDP is suitable for the economic development pattern in new normal period of China. It can be proved that industrial restructuring is a powerful method for energy conservation and emission reduction.
Raising the shares of sectors which are low energy intensive and low GHG emission intensive is an effective method to save energy and reduce GHG emission. The results show that China should develop vigorously S28 (Posts), S29 (Information transmission, computer services and software), S30 (Wholesale and retail), S33 (Real Estate), S34 (Leasing and Business Service), S39 (Education), and S42 (Public Management and Social Organization), as well as several low energy consumption and low emission sectors. On the other hand, several high energy and high emission sectors such as S06 (Food Manufacturing and Tobacco Processing Industry), S08 (Manufacture of Textile Wearing Apparel, Footwear, Caps, Leather, Fur, Feather (Down) and its products), S12 (Chemical industry), and S14 (Metal smelting and rolling processing industry) should be strictly controlled.
There are still several difficulties in achieving the targets of the 13th FYP for energy conservation and emission reduction only through industrial restructuring. Firstly, it is difficult to achieve the double control targets including that China's energy consumption intensity should drop by 15% over 2015 and total energy consumption should be controlled within 5000 Mtce. From the results of this study, the energy consumption is 5000 Mtce, energy intensity is 0.055865, only 10.8% lower than 2015 (0.062668) after optimization. Therefore, the latter target of total energy control can be achieved, but the former target of energy intensity cannot be satisfied. Secondly, compared to energy consumption conservation, GHG emission reduction is less effective. In our model, energy consumption intensity can decrease by 13.88246% over 2012, but GHG emission intensity can only decrease by 5.33767% for the four scenarios. Especially for Scenario D (GHG emission reduction priority), the negative impact of emission reduction on economic growth is greater than that of energy conservation on economic growth. It may be due to the lack of progress in energy structure and technology. It is suggested that China had better strive to promote progress of technologies of energy conservation and GHG emission reduction while adjusting the industrial structure.
CONFLICT OF INTEREST
We don't have any competing financial, professional, or personal interests from other parties.
AUTHORS' CONTRIBUTIONS
In this work, Ping Ping Lin and Deng Feng Li conceived the study and were responsible for the design and development of the data analysis. Ping Ping Lin, Bin Qian Jiang and An Peng WEI were responsible for data collection and analysis. Ping Ping Lin wrote the first draft of the article. Deng Feng Li, Ping Ping Lin and Gao Feng Yu revised the article.
Funding Statement
This work was supported by the China National Science Foundation, under Grant No. 71231003.
ACKNOWLEDGMENTS
The authors would like to thank Prof. Dr. Luis Martínez López, the Editor in Chief of this journal and two anonymous for their insightful comments and suggestions that have strengthened the paper.
REFERENCES
Cite this article
TY  - JOUR
AU  - Ping Ping Lin
AU  - Deng Feng Li
AU  - Bin Qian Jiang
AU  - An Peng Wei
AU  - Gao Feng Yu
PY  - 2019
DA  - 2019/11/14
TI  - Regional Input–Output Multiple Choice Goal Programming Model and Method for Industry Structure Optimization on Energy Conservation and GHG Emission Reduction in China
JO  - International Journal of Computational Intelligence Systems
SP  - 1311
EP  - 1322
VL  - 12
IS  - 2
SN  - 1875-6883
UR  - https://doi.org/10.2991/ijcis.d.191104.002
DO  - 10.2991/ijcis.d.191104.002
ID  - Lin2019
ER  -