
Assessment of Healthcare Waste Treatment Alternatives Using an Integrated Decision Support Framework
Corresponding author. Email: ahinduja.phd2015.mca@nitrr.ac.in
- DOI
- 10.2991/ijcis.2018.125905685How to use a DOI?
- Keywords
- Health-care waste management; HCW treatment technology selection; Intuitionistic fuzzy sets; DEMATEL; ANP; AHP
- Abstract
Healthcare waste (HCW) management has become a major environmental and public-health concern especially in developing countries, and therefore, it has been receiving increasing attention from both industrial practitioners and researcher in recent years. Selection of the optimal treatment technology for HCW is regarded as an intricate multi-criteria decision-making problem involving conflicting and intertwined qualitative as well as quantitative evaluative criteria. To address this decision problem, we develop an integrated decision support framework based on decision-making trial and evaluation laboratory (DEMATEL), intuitionistic fuzzy ANP, and intuitionistic fuzzy AHP. The DEMATEL method determines the influences of main factors and criteria and produces a network relationship map while the ANP method calculates the degree of interrelationship among evaluative criteria and obtains their relative weights. The AHP method assesses the HCW treatment alternatives over evaluative criteria. The experts’ opinions are collected in form of intuitionistic fuzzy preference relations as they are effective in capturing uncertainty and hesitancy involved in decision-makers’ judgment. We also develop a priority method to derive nonfuzzy weights from the intuitionistic fuzzy preference relations. To validate the feasibility of the proposed approach, a case study is carried out on the selection of optimum HCW treatment technology for Chhattisgarh, India. The analyses of the results indicate that the proposed integrated multi-criteria decision making (MCDM) framework effectively handles the issue of HCW treatment technology selection in uncertain environments.
- Copyright
- © 2019 The Authors. Published by Atlantis Press SARL.
- Open Access
- This is an open access article distributed under the CC BY-NC 4.0 license (http://creativecommons.org/licenses/by-nc/4.0/).
1. INTRODUCTION
With the increasing numbers of healthcare facility, the amount of healthcare waste (HCW) is also growing. In recent years, a massive rise has been registered in HCW [1,2]. As a result, HCW management has become a major challenge for public sectors throughout the world, particularly in developing countries like India, China, and Brazil, where HCW is often mixed with municipal solid wastes [3,4]. The World Health Organization (WHO) defines the HCW as “waste generated by healthcare activities includes a broad range of materials, from used needles and syringes to soiled dressings, body parts, diagnostic samples, blood, chemicals, pharmaceuticals, medical devices, and radioactive materials” [5]. According to WHO factsheet, about 85% of the HCW is nonhazardous wastes, but the remaining 15% is considered hazardous material that may be infectious, toxic, or radioactive. In order to efficiently segregate the hazardous and nonhazardous wastes, specific regulations have been adopted by many developed and developing countries. The nonhazardous wastes can simply be treated with the municipal solid wastes; however, the disposal of hazardous HCW requires a separate and rigorous treatment. Poor management of HCW may cause infection and toxic effects to the healthcare personnel, waste handlers, patients, and the community. It may also pollute the environment that can adversely affect the people. Thus, it is imperative to segregate all medical waste materials at the point of generation, treat appropriately and dispose carefully. Besides, the inappropriate treatment or disposal of that waste can lead to environmental pollution, transmission of disease like cholera and typhoid, unpleasant odors, and growth of worms and insects [6]. Due to these reasons, HCW management has been receiving an escalating amount of attention from academic researchers, governments, and practitioners [7–12].
HCW management is a multifaceted process that consists of collection of waste from the healthcare facility, selection of transit modes and routes to the treatment plants, treatment technology selection, and site selection for the disposal. Owing to its significant environmental and economic impacts, the selection of the most suitable and effective HCW treatment technology has been a subject of intense research interest. In order to select the “Best” treatment technology for HCW, decision-makers (DMs) need to consider various conflicting factors or criteria. A large number of criteria such as capital cost, waste residuals and their environmental impacts, treatment effectiveness, and public acceptance are often incorporated in the assessment of the various HCW treatment technologies. Each treatment option has different performance score with respect to each evaluation criteria. However, there is no HCW treatment alternative which is superior to other alternatives over all the criteria. Therefore, the evaluation of HCW treatment technologies can be regarded as a complex multi-criteria decision-making (MCDM) problem. A systematic and rigorous approach is required to effectively address this imperative issue.
A number of studies indicated the significance of the appropriate waste treatment technology selection [9, 11, 13]. The selection of appropriate waste treatment technology is considered to be a complex decision problem, which can be effectively handled by the methods of MCDM. However, it has been indicated by many researchers [14, 15] that due to the vagueness of human cognition and uncertainty of the available information, providing crisp judgments over alternatives and criteria is difficult for the DMs. Besides, these crisp judgments can be imprecise and inaccurate in certain situations. To cope with imprecision and uncertainty of the available information, researchers and industrial scientists have been employing Fuzzy sets [16] in different fields of science and technologies. The recent applications of the fuzzy sets are Dendritic spines detection [17] and Classification of black, oolong and green teas [18] using Fuzzy SVM, Fault detection filtering [19], Design of energy management system [20], and Fuzzy MCDM [21]. Most of the recent studies regarding HCW treatment technology selection used fuzzy set–based linguistic terms to obtain experts’ opinions. For instance, Dursun et al. [22] proposed a fuzzy multi-criteria group decision-making framework to evaluate four prominent waste treatment technologies. The proposed framework was based on concepts of fuzzy measure and fuzzy integral. Dursun et al. [23] developed an MCDM technique based on multi-level hierarchy structure and fuzzy logic to assess the waste disposal technologies. Liu et al. [24] developed a VIKOR-based MCDM approach for HCW treatment selection and validate the approach with a case study of HCW management in Shanghai, China. Liu et al. [25] also applied interval 2-tuple linguistic variables based MULTIMOORA [26] method (ITL-MULTIMOORA) to select the suitable waste treatment technology for Shanghai, China. In addition, Liu et al. [8] employed fuzzy DEMATEL and fuzzy MULTIMOORA to assess the biohazardous waste disposal alternatives. Voudrias [12] provided comprehensive details of HCW treatment technologies and used analytic hierarchy process (AHP) to evaluate them. Lee et al. [9] conducted a research in England, in which, they used AHP as a research tool to find the “optimal” HCW treatment technique. Lu et al. [27] proposed a novel ITI-TOPSIS (interval 2-tuple-induced TOPSIS) method and illustrated it with a case study for Shanghai, China. Shi et al. [7] developed a hybrid decision-making framework based on MABAC method and cloud model to assess and select the “optimum” HCW treatment technique taking the perception of multiple stakeholders in the account. The most recent study on the HCW treatment technology selection problem has been carried out by Xiao [28], who proposed a D number theory-based approach. Another recent approach has been proposed by Liu et al. [29]. The approach employed intuitionistic uncertain linguistic variables and their Hamy-mean operators to aggregate the information.
Most of the proposed models are based on the assumption of the independent criteria and are incapable of handling complex interdependent relationship among criteria. A complex decision problem like HCW treatment technique selection requires a more comprehensive analysis of the intricate relationships between the criteria. Moreover, most of the proposed methods focused on the assessment of the HCW treatment technologies employ fuzzy linguistic variables to obtain DMs’ opinion. It has been indicated by many researchers that since fuzzy sets only represent the degree of preferences and non-preferences in MCDM context, they are incapable of capturing abstention or indeterminacy in the decision [30]. However, in real-world decision problem, the experts’ judgments are often subject to inherent uncertainties, hesitancy, and rapid changes in circumstances that are difficult to predict. Besides, most of the previous studies included only four HCW treatment techniques: incineration, autoclaving, microwave disinfection, and landfilling, for evaluation. However, some other prominent treatment technologies like chemical disinfection, reverse polymerization, and pyrolysis were not evaluated.
The discussion above shed light on the limitations of the previous studies. We can also conclude that approaches to addressing selection of optimal HCW treatment technology are not yet fully developed and to address this important issue, a new approach is required that can effectively handle the inherent uncertainty and the hesitancy in DMs’ judgments. The objective of this article is to propose an integrated decision support model to prioritize and select the optimal HCW disposal technology. The proposed methodology integrates three prominent methods, DEMATEL, intuitionistic fuzzy analytic network process (IF-ANP), and intuitionistic fuzzy analytic hierarchy process (IF-AHP) at different stages of the decision-making process. The decision support framework incorporates DEMATEL to obtain the network relationship map (NRM) depicting interrelationships among the factors and the sub-factors (criteria) of the HCW treatment selection problem. Intuitionistic fuzzy set (IFS)-based ANP is integrated to obtain the criteria weight and IFS-based AHP is employed to evaluate the HCW treatment technology. The combination of DEMATEL and ANP has received noteworthy attention of MCDM research community in recent time and has proved itself to be one of the most competent approaches to handle interdependent criteria in an MCDM problem [31]. The reason for using AHP for evaluation of ERP system is its simplicity and capability of accurately registering human cognition through pair-wise comparisons. Owing to its powerfulness, we use IFSs to capture the uncertainty involved in human judgment. The experts’ opinions are collected in form of intuitionistic fuzzy preference relations (IFPRs), which comprehensively capture the uncertainty and hesitancy in the judgments of the DMs. In addition, we develop a novel priority method to derive priorities from these IFPRs. Unlike existing priority method [32], the proposed priority method derives easy to interpret crisp value priorities from IFPRs.
This paper makes following contribution to the extant body of knowledge: First, this study proposes an integrated decision support framework using DEMATEL, IF-ANP, and IF-AHP methods to prioritize and select the optimal treatment technology. The proposed method effectively establishes the interrelationships among criteria and captures the uncertainty involved in DMs’ judgments. Secondly, this study is the first study that includes six prevalent HCW disposal alternatives, incineration, autoclaving, microwave disinfection, chemical disinfection, reverse polymerization, and pyrolysis for evaluation. Another contribution of this paper is its priority method, which extracts relative preference in crisp values from the IFPRs. The remaining paper is organized as follows: Section 2 provides an overview of intuitionistic fuzzy concepts and MCDM methods employed in this study. Section 3 presents the proposed methodology for HCW treatment alternative selection. An empirical case study is presented in Section 4. Next section analyzes the results and presents a discussion on them. The last section discusses the findings of the paper and makes concluding remarks.
2. PRELIMINARIES
2.1. Intuitionistic Fuzzy Concepts
Imprecision and uncertainty are unavoidable problems of real-world decision problems. Often decision problems involve more than one DMs and these DMs have different qualifications, backgrounds, and understandings of the problem. Owing to numerous reasons like lack of experience and vague knowledge of the problem domain, DMs may not be able to provide a precise preference. In order to deal with this situation, Fuzzy Set Theory [16] has been incorporated into MCDM methods. Fuzzy MCDM methods facilitate the use of linguistic terms while collecting preferences of DMs. However, some studies have shown that Fuzzy Sets can be incompetent in processing DMs' subjective judgments, their hesitancy in providing judgment, and the associated uncertainty [33]. IFSs are useful in such situations as it adequately deals with hesitancy and uncertainty involved in problem definition and DMs judgments.
IFSs are a generalized form of Fuzzy Sets. The concept of IFS was developed by Atanassov [34, 35]. Unlike Fuzzy Sets, which only contain information of membership degree, the IFS also contain information of non-membership degree and hesitancy degree. When IFSs are used to obtain DMs preferences, the hesitancy degree represents insufficient knowledge of the DM; hence considered to be more useful in managing uncertainty in MCDM than Fuzzy Sets.
Definition 1.
Let X be the universe of discourse, then an IFS A can be defined as:
Definition 2.
[36]. An IFPR B on X is defined as a matrix
In addition, υji = μij, μii = νii = 0.5. A scale is presented in the Table 1 that analogize the Saaty’s fundamental scale. The scale represents the intensities of support and objection of the preferences.
| 1–9 Scale | Linguistic Variables | 0.1–0.9 Scale |
|---|---|---|
| 1/9 | Extremely not | 0.1 |
| 1/7 | Very strongly not | 0.2 |
| 1/5 | Strongly not | 0.3 |
| 1/3 | Moderately not | 0.4 |
| 1 | Equally | 0.5 |
| 3 | Moderately | 0.6 |
| 5 | Strongly | 0.7 |
| 7 | Very strongly | 0.8 |
| 9 | Extremely | 0.9 |
Note: Use of intermediate values is allowed in both scales to present compromise.
Analogy of 0.1–09 scale with Saaty's 1–9 scale [32].
Definition 3.
[37]. If
2.2. Decision-Making Trial and Evaluation Laboratory
Most of the renowned MCDM methods consider the criteria, upon which the alternatives are assessed, as independent characteristics. However, MCDM problems often involve numerous evaluating criteria or factors which usually are interrelated and the assumption of independence of criteria may lead to the linear modeling of the problem. The linear solution of the MCDM problems with interdependent criteria may produce flawed results. On the other hand, in a completely interrelated system, any interference to one criterion affects other criteria and therefore, it is difficult to find their priorities [38]. Therefore, only significant interdependent relationships should be taken into account and negligible interdependent relationships should be left while designing the problem structure.
The decision-making trial and evaluation laboratory (DEMATEL) was developed by Battelle Geneva Institute in order to solve complex intertwined decision problems. The DEMATEL method uses concepts of graph theory and allows the DMs to analyze the problems visually and gather a better understanding of the problem. Unlike the well-known MCDM methods with the assumption of independence among factors such as TOPSIS and AHP, this method identifies the interdependence among the factors of decision problems through a causal diagram. Using the casual diagram, which is basically a digraph, DMs can segregate the decision criteria into cause and effect group in order to attain an understanding of the casual relationship among the criteria [39, 40]. The DEMATEL method involves following steps [41, 42]:
Step 1: Respondent(s) is/are asked to provide their perception regarding degree of direct influence between each pair of factors in form of pair-wise influence matrix
Step 2: Calculate the average matrix. In case of group decision-making, one pair-wise influence matrix are obtained from each respondent. These pair-wise influence matrices are aggregated to form initial average matrix,
Step 3: Calculate the normalized initial influence (direct-relation) matrix D. The purpose of normalization of a matrix is to set a uniform range for all its elements. The initial average matrix A is normalized in this step to range all its elements between 0 and 1, using:
In other words, each element of A is divided by largest sum (row-sum, column-sum) element of the matrix to form direct-relation matrix.
Step 4: Construct the total relation matrix T, which is defined as
Step 5: In order to calculate total impact of the factors to the system, two vectors of dimension n × 1 and 1 × n for representing the sums of rows (r) and the sums of columns (c) of the total relation matrix are defined. If sum of ith row is ri, then it represents the direct and indirect effects given by factor i to the other factors. Similarly, sum of jth column cj represents the direct and indirect effects on factor j, given by the other factors. The sum of ith row and ith column
Step 6: Set up a threshold value and produce the impact-relations map. Matrix T contains the quantification of impact the factors cause on each other. However, some of the values may be negligible and can be removed in order to reduce the complexity of impact-relation map. Therefore, a threshold value is set up either by collecting experts’ opinion or averaging the elements of matrix T. The values higher than the threshold value are depicted in the impact-relations map [43].
2.3. Analytic Hierarchy Process and Analytic Network Process
AHP and ANP, both methods were developed by Saaty [44, 45] to solve complex MCDM problems. The difference between the two methods lies in their assumptions regarding interdependence of evaluating criteria. The AHP method considers each criterion to be independent decision elements while the ANP method regarded them as interconnected decision nodes.
The AHP procedure is 3-fold: decomposition, priority derivation, and synthesis of the priorities [46]. The first step and most creative part of the AHP is decomposition of the problem into a hierarchical structure:
The ANP method generalizes the AHP as it can handle the problem involving independent criteria as well as interdependent criteria. The first step of the ANP procedure is to determine the overall objective, evaluating criteria, subcriteria, and alternatives and identify relation among them. The relationship among decision nodes are depicted through a network relation map (NRM). An NRM is shown in the Figure 1 that consists of nine criteria divided into three clusters (evaluating factors). There is unidirectional connection between Cluster 1 and Cluster 2 that implies influences of c1, c2 and c3 on c4, c5, and c6; however, the inverse is not true. On the other hand, bidirectional links, depicted between Cluster 1 and Cluster 3, and Cluster 2 and Cluster 3, show the influences of the evaluative clusters on each other.
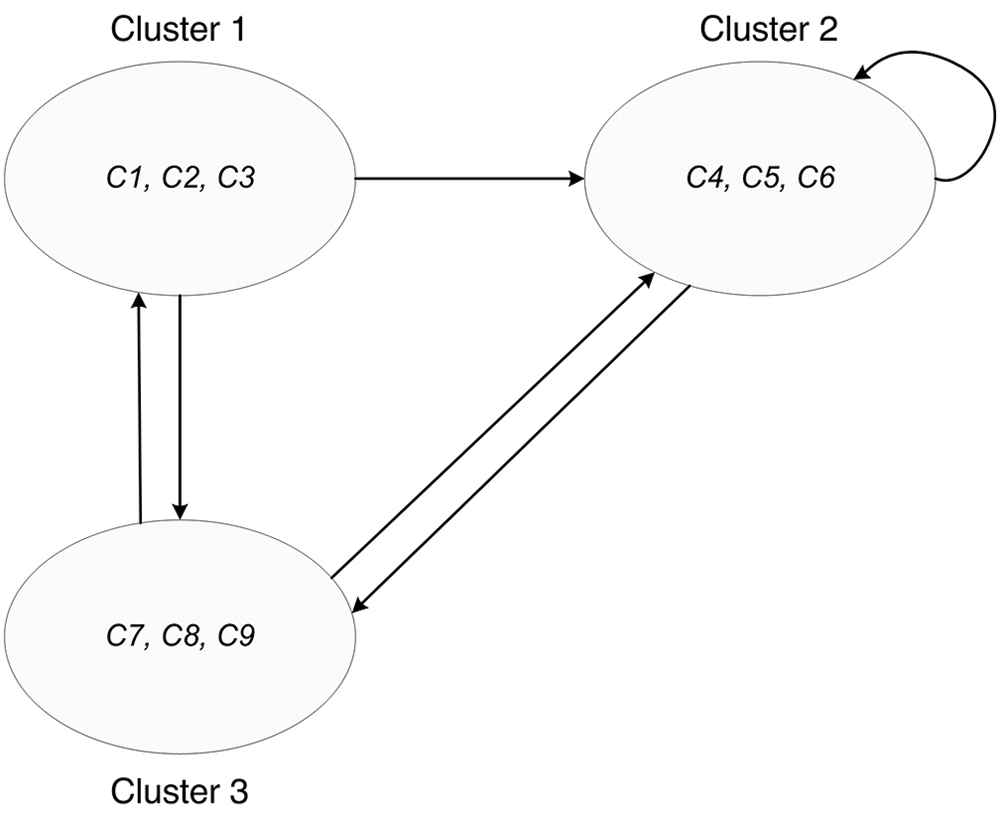
A network relationship map (NRM) illustrating relationships among three evaluating factors [31].
Afterward, preferences of DMs are collected in the form of preference relation and similar to AHP, priority of each preference relation is calculated. The next step is formation of supermatrix. In ANP, a matrix, which is constructed based on the relationships depicted in the NRM, is referred to as supermatrix. A supermatrix is shown in the Figure 2 that represents the NRM shown in the Figure 1:
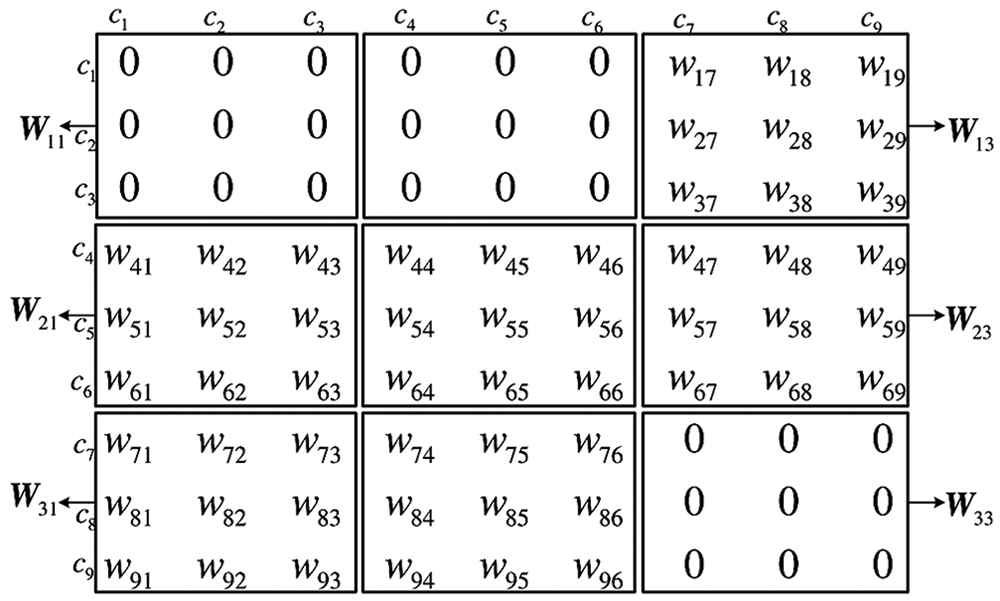
Similar to AHP’s preference relation, supermatrix is also a square matrix contains all the nodes of the hierarchy in both row-headers and column-headers. Each nonzero value of the supermatrix represents the relation of column-header node with row-header node. First the local priorities obtained by using Eigenvector method are set to the appropriate columns; afterward, the comparison values (effect of one node to another) are set in suitable columns. Usually, the sum of columns of the supermatrix is greater than 1. In order to calculate weighted supermatrix, the matrix is normalized so that the sum of the columns become 1. Finally, in order to estimate effects of decision elements on one other, the supermatrix is raised to the limiting power, conventionally denoted by k + 1, until the values of weighted supermatrix become stable. This matrix is referred to as limit supermatrix. The normalized column values of the limit supermatrix represents relation priorities of the criteria and alternatives [51].
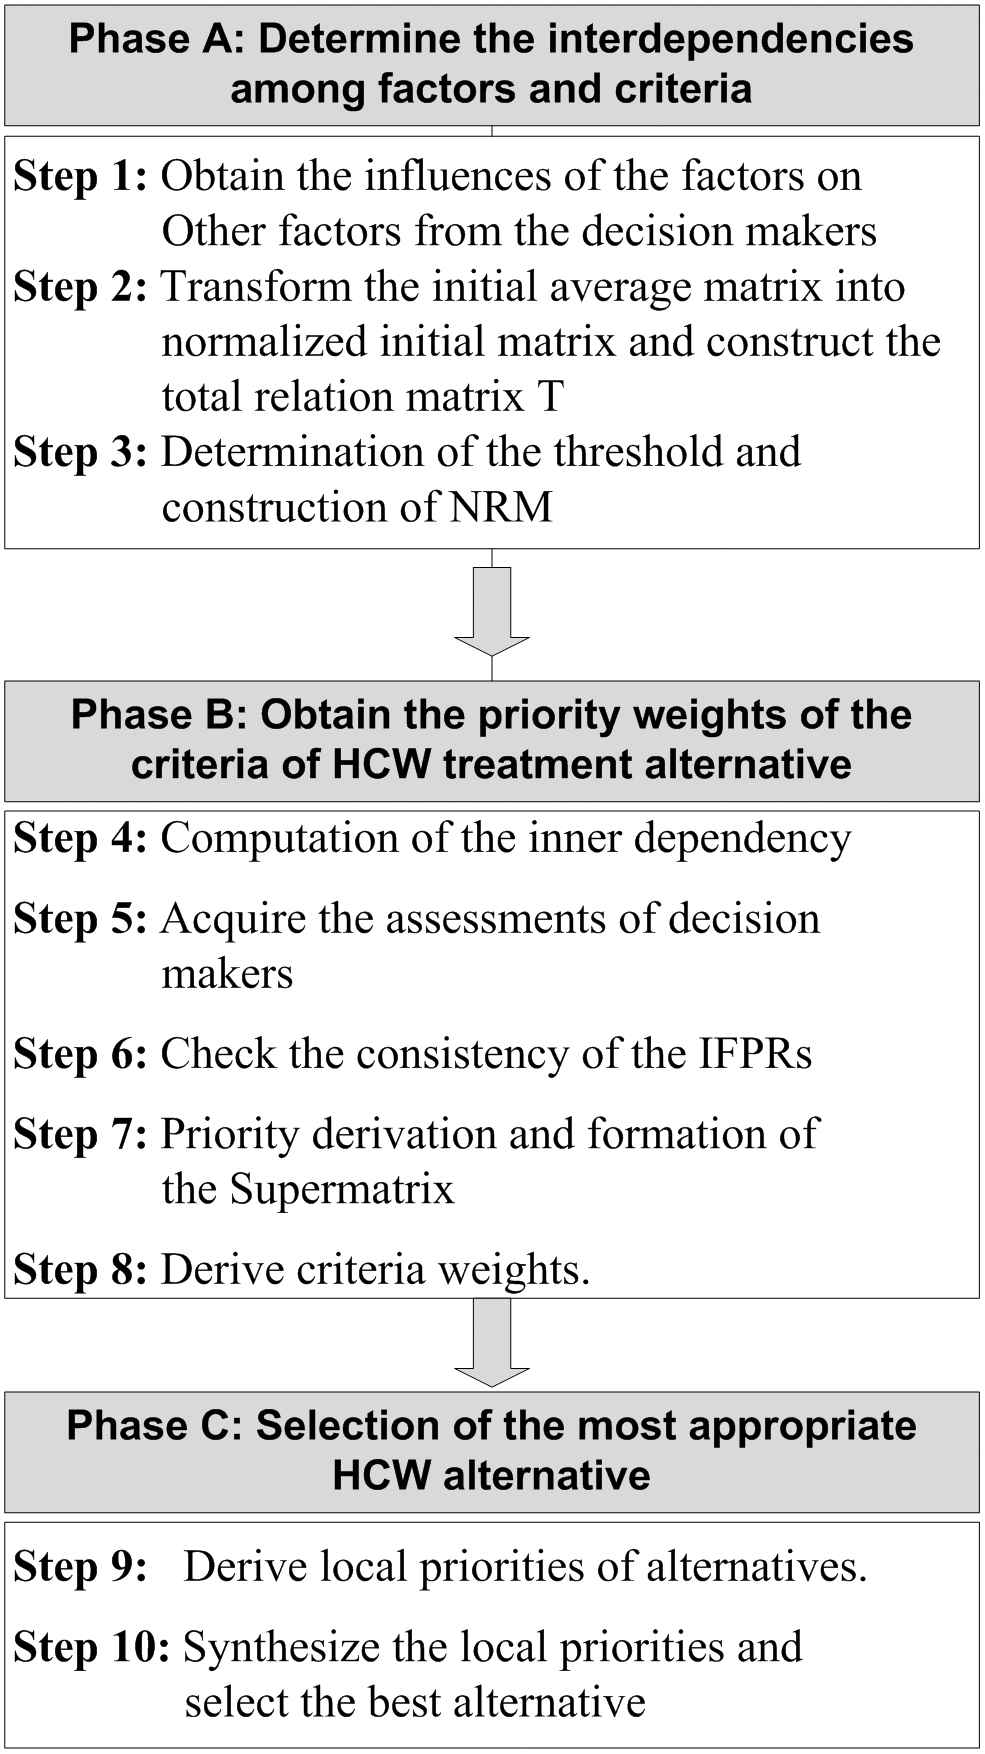
3. PROPOSED METHODOLOGY
In this section, we provide a comprehensive description of proposed methodology. The section is divided into two parts: first, we describe a novel priority method that derives priorities from IFPRs (Section 3.1) and afterward, we provide a step-by-step description of proposed MCDM framework (Section 3.2). The proposed MCDM framework consists of three prevalent methods: DEMATEL is used to construct the NRM of the problem, IF-ANP is used to assign weights to the evaluating criteria and IF-AHP is used to evaluate the alternatives over those criteria. The priority method, described in Section 3.1, is used to derive priorities from IFPRs used in IF-ANP and IF-AHP processes.
3.1. Proposed Priority Derivation Method
In this section, we propose a priority method, which derives priorities from IFPRs. The proposed priority method is slightly inspired by the grey relational analysis [52]. Our priority method overcomes the shortcomings of existing priority methods of IFPRs. Unlike existing methods, our method extracts priorities from IFPRs in crisp values, which are easy to interpret. Another advantage of the proposed priority method is its heuristic way to derive priorities as it compares each alternative’s preferences over other alternatives with a hypothetical optimal preference sequence called reference preferences. The alternative whose preferences have maximum proximity to the reference preferences is considered to be the best alternative.
The proposed priority method is a three-stage procedure: postulation of reference preference relation, assessment of similarities between actual preferences and reference preferences, and aggregation of these similarities to obtain priorities of alternatives.
The reference preference relation can be regarded as a series of rows or reference preferences, where the ith
Next, the similarity coefficients are calculated. The similarity coefficients indicate the similarity of each preference value of the IFPR, to its corresponding preference value of the reference preference relation. The value of similarity coefficients ranges between Zero and One. One indicates complete similarity while Zero suggests no similarity at all. This process results in a similarity coefficient matrix
In the final step, the similarity coefficients of each row (depicting an alternative) are aggregated to estimate its proximity to its corresponding row of reference preference relation. For this purpose, a modified row-sum approach is applied to the similarity coefficient matrix. The diagonal elements are not included in the calculations as they always hold the value One.
In the following, the priority method is given in the form of an algorithm
3.1.1. Priority algorithm step-by-step
Let
Step 1: Postulate a reference preference relation. Let
As it can be observed that each row of the reference preference relation represents an optimal preference sequence setting all the elements to best possible intuitionistic preference value
Step 2: Determine similarity between each element aij of IFPR
Equation (14) is adapted from grey relational coefficients calculation [52]. The purpose of step 2 is to determine the similarities between elements of the IFPR and elements of reference preference relation. The outcome of step 2 is a matrix of similarity coefficients ξij. The value one for similarity coefficients ξij denotes complete similarity while the value zero denotes complete dissimilarity.
Step 3: Aggregate the similarity coefficients ξij of each row and normalize them to obtain the weights of alternatives. The similarity coefficients can be combined using following equation:
The objective of this step is to combine the preference similarities of each alternative and normalize them to derive the priorities. Since diagonal elements of the similarity coefficient matrix are always one, including them in the calculation may produce misleading results. Thus, to remove the impact of those extraneous values, the diagonal elements are eliminated from the equation by subtracting one from the numerator part and n from the denominator part.
In the following, we present an illustrative example to demonstrate the priority derivation from IFPRs using the proposed priority method.
Example 1.
In the following, we illustrate the priority method using a numerical example adopted from [53]. In this example an IFPR is given containing preference information of three alternatives:
First, a reference preference relation
Afterward, we calculate the distances between elements
In order to calculate the weights of alternatives, we aggregate the distances using Equation (16). We obtain the weights of alternatives as γ1 = 0.405, γ2 = 0.355, and γ3 = 0.240. The scores indicate the ranking of alternative is x1, x2, x3. The obtained result is matched with general heuristics and the rankings obtained by Liao & Xu [53].
3.2. Steps of Proposed MCDM Framework
The assessment of HCW treatment alternatives is a complex decision-making procedure that often includes contradictory ecological, social, and economic criteria. A holistic approach is required that involves multiple DMs, appropriately calculates the priorities of intertwined criteria and properly tackles the uncertain experts’ judgments to find a suitable HCW treatment technology.
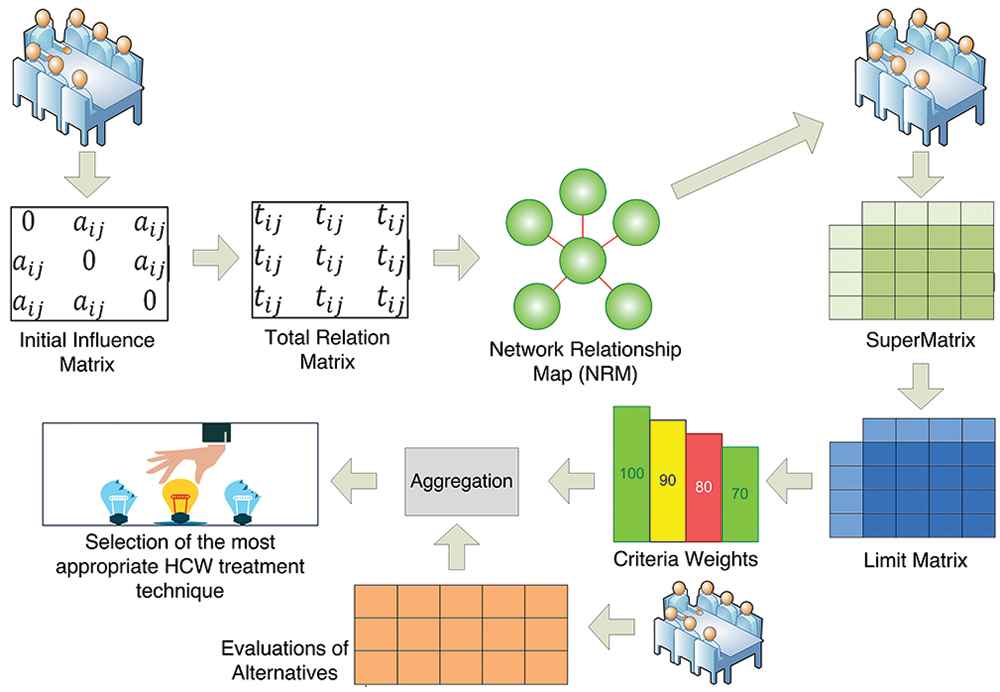
For a multi-criteria HCW disposal alternative choice problem, assume that there are m HCW treatment alternatives Ai(i = 1, 2 … ., m) and n criteria Cj (j = 1, 2, … , n) classified in p main factors fk (k = 1, 2, … ., p). The weight vector for criteria is w = (w1, w2, … .wn), where wj = ∈ [0,1] and
Proposed methodology of healthcare waste (HCW) treatment technology selection.
3.2.1. Determine the interdependencies among factors and criteria
Step 1: Obtain the influences of the factors on other factors from the DMs.
The DEMATEL method is used to obtain the interdependencies among factors and criteria. First, DMs are asked to estimate the direct influence between all pairs of factors. The DMs provide their evaluation by an integer score ranging from 0 to 4. The integer 0 represents “no influence” while integer 4 represents “very high influence.” Each DM presents his perception using a nonnegative matrix X = (xij)n×n providing the number of factors is n. The symbol xij represents the DM’s perception on the degree to which factor i influences factor j. The diagonal elements (when i = j), are set to zero.
If more than one DM participates in the decision-making process, each DM provides one influence matrix; hence, the aggregation of the matrices is required. In order to combine p respondents’ opinions, the average matrix A = (aij)n×n can be constructed as:
Step 2: Transform the initial average matrix into the normalized initial matrix and Construct the total relation matrix T
In order to range the values between 0 and 1, normalization of average matrix A is required. The resultant normalized matrix is referred to as initial average matrix or direct-relation matrix and denoted with D. The direct relation matrix can be constructed using following equation:
Afterward, the total relation matrix can be constructed as T = D(I − D)−1, where I denotes identity matrix. The total relation matrix represents the net direct/indirect influences of the factors on each other.
Step 3: Determination of the threshold and construction of NRM.
After construction of total relation matrix, a threshold is determined. The purpose of setting a threshold is to reduce the complexity of the model. The influences, whose values are below the threshold value, are deemed as negligible influences and thus eliminated from the total relation matrix. The influences, higher than the threshold value are remained in the total relation matrix and used as a base to draw the NRM of the ANP process. The NRM represents the network structure of the model as opposed to the hierarchy problem structure used in the AHP method. The NRM can be created with the help of total relation matrix T = (tij)n×n. For each positive value of influence tij in the total relation matrix, an arrow is drawn from ith node to jth node to construct the NRM reflecting dependencies among the evaluative factors [31].
3.2.2. Obtain the priority weights of the criteria of HCW treatment alternative selection
Step 4: Computation of the inner dependency
The purpose of Steps (1–4) is to identify inner-dependency and interdependency among factors. NRM of the ANP process is created based on influences higher than the threshold values. Gölcük and Baykasoğlu [31] demonstrated that in the inner dependency situation the pair-wise comparisons may be inefficient; in addition ANP requires too many pair-wise comparisons which might be time-consuming and difficult to obtain. Hence, the DEMATEL method is used to quantify inner-dependency among criteria belong to the same factors. The steps of quantifying the inner-dependencies are as follows:
For each factor having inner-dependency:
Form the inner-dependency matrix (total relation matrix for inner dependency) of criteria within the cluster.
Normalize the inner-dependency matrix. In order to obtain the normalized inner-dependency matrix, the row-sums are calculated and subsequently, each element of the inner-dependency matrix is divided by the corresponding row-sum.
Transpose the normalized inner-dependency matrix so that it can be placed in the appropriate positions in supermatrix of ANP.
Step 5: Acquire the assessments of DMs
Based on the inter-dependency and inner-dependency among the criteria, obtain the DMs’ opinion to perform the pair-wise comparisons accordingly. DMs should comprehensively analyze the NRM before providing their opinions. With the influence of 0.1–0.9 scale shown in Table 1, an Intuitionistic Fuzzy scale is carefully designed with the consensus of experts and used to extract opinions of DMs to form the IFPRs. The scale used in pair-wise comparison is shown in the Table 2.
| AHP/ANP Scale | Linguistic Terms | IFS |
|---|---|---|
| 1 | Equally preferred | [0.50, 0.50, 0.00] |
| 3 | Moderately preferred | [0.60, 0.25, 0.15] |
| 5 | Strongly preferred | [0.75, 0.15, 0.10] |
| 7 | Very Strongly preferred | [0.90, 0.05, 0.05] |
| 9 | Extremely preferred | [1.00, 0.00, 0.00] |
Note: Use of intermediate values is allowed in both scales to present compromise.
IFS, intuitionistic fuzzy set; IF-AHP, intuitionistic fuzzy analytic hierarchy process; ANP, intuitionistic fuzzy analytic hierarchy process.
Evaluation scale employed for IF-AHP/ANP.
Step 6: Check the consistency of the IFPRs
Since the human opinions are not always perfectly consistent, the consistency check is an imperative step while dealing with preference relations. Xu’s algorithm [32] is adapted in order to check and repair inconsistent IFPRs. The acceptable inconsistency is regarded 10% as suggested by Saaty [44]. The prime step of the algorithm is to form a perfect multiplicative consistent IFPR corresponding to the given IFPR. The perfect consistent IFPRs are constructed based on the transitivity properties of the elements of the IFPRs. Providing that
For all j > i + 1 (Upper triangular elements):
For all i = j (Diagonal elements):
And for all j < i (Lower triangular elements):
Afterward, the distance between given IFPR and its corresponding perfect consistent IFPR is calculated using:
This distance is referred to as inconsistency of the IFPR. If the inconsistency is greater than 0.10, the IFPR is fused with corresponding perfect consistent IFPR by averaging them until it shows acceptable consistency. The presented automatic consistency repairing method saves DMs’ time and efforts from repetitive correction of the inconsistent IFPRs’ values.
Step 7: Priority derivation and formation of the supermatrix
After checking the consistency of each IFPR obtained from the DMs, extracting priorities from each consistent IFPR is required to form the supermatrix. The priorities of the IFPRs are derived using proposed priority derivation method explained in Section 3.1. The proposed priority method provides relative importance of the elements of IFPRs in crisp values, which is easy to interpret and appropriate to place in the supermatrix.
In ANP, a matrix represents the NRM called supermatrix. Similar to AHP’s preference relation, supermatrix is also a square matrix contains all the nodes of the hierarchy in both row-headers and column-headers. Each nonzero value of the supermatrix represents the relation of column-header node with row-header node.
Local priorities obtained in the previous steps are put into the appropriate columns of the supermatrix. The interdependencies among criteria and relative importance of the clusters are obtained using proposed priority derivation method and the inner dependencies are obtained using Step 4.
Step 8: Derive criteria weights.
Usually, the sum of columns of the supermatrix is greater than 1. In order to calculate weighted supermatrix, the matrix is normalized so that the sum of the columns become 1. The resultant matrix is referred to as weighted supermatrix.
Afterward, the weighted supermatrix is raised to limiting powers until the weights become stable; this matrix is called limit supermatrix. The weights of the criteria can be obtained by normalizing any column of the limit supermatrix.
3.2.3. Selection of the most appropriate HCW alternative
Step 9: Derive local priorities of alternatives.
This step is to evaluate the HCW treatment alternative with respect to each evaluative criteria. IF-AHP is used to rank alternatives upon their preferences to DMs. First, the pair-wise comparisons of alternatives with respect to each criterion are obtained from DMs. The DMs provide their assessments using intuitionistic fuzzy scale (Table 2). These pair-wise comparisons form IFPRs, which are checked for inconsistency as per Step 6. Afterward, the priorities of each aggregated IFPR are derived by applying proposed priority method. This step yields local priorities of each alternative over each criterion.
Step 10: Synthesize the local priorities and Select the best alternative.
After obtaining the priorities of alternative with respect to each criterion, synthesize these local priorities in order to obtain overall priorities of the alternatives. The alternative with the highest priority scores is opted as “the Best” alternative.
4. AN EMPIRICAL CASE STUDY
4.1. Problem Description and Identification of the Decision Elements
Chhattisgarh is one of the most rapidly developing states of India. In recent years, medical facilities, including super specialty healthcare facilities like All India Institute of Medical Sciences (AIIMS) and Apollo Hospital, have been constantly increasing. With the increasing healthcare facilities, amount of bio-medical waste generated by these medical facilities is also growing. However, the existing HCW treatment facilities are not enough to deal with this massive amount of medical waste and hence, a large portion of this medical waste is disposed using landfilling. In addition, a large part of the HCW is disposed as normal garbage due to lack of treatment facilities and absence of valid authorization for disposal of biomedical wastes [54]. Therefore, it is imperative to install new treatment facilities for HCW disposal in the State. Since the treatment facilities have a broad economic, environmental and social impact, it is essential to determine the optimal technology for HCW treatment. In the course, we analyzed and reviewed the existing HCW disposal methods and current scenario of HCW management in Chhattisgarh by surveying major hospitals and existing HCW disposal facilities and by interviewing the environmental experts, authorities, and waste management researchers. After preevaluation, six treatment alternatives have been determined for the disposal of HCW in Chhattisgarh. These treatment technologies are incineration (A1), chemical disinfection (A2), steam sterilization (A3), microwave (A4), reverse polymerization (A5), and plasma pyrolysis (A6).
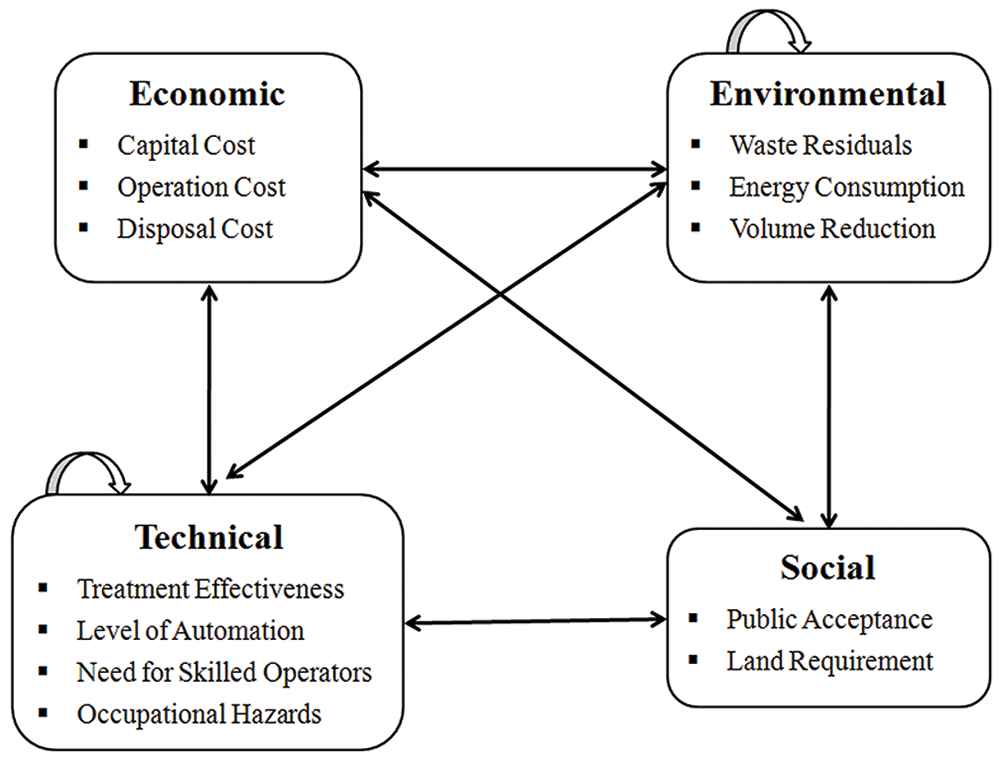
The effectiveness, efficiency, and the impact on the different aspect of the society of an HCW treatment technology can be measured on the basis of several qualitative and quantitative criteria; and in order to select the optimum alternative, all the criteria must be taken into account. Through comprehensive review [7 – 9, 12, 22 – 25] of the recent literature on HCW treatment technology selection, we identified 12 criteria categorized into the four main factors (economic, environmental, technical, and social). Since the factors consist of respective criteria, they are also referred to as clusters in this paper. The factors/clusters and their criteria are listed as follows:
Economic Factors (C1): Capital cost (C11), Operation and maintenance cost (C12), and Disposal cost (C13).
Environment Factors (C2): Waste residuals and their environmental impacts (C21), Energy consumption (C22), and Volume reduction (C23)
Technical Factors (C3): Treatment effectiveness (C31), Level of automation (C32), Need for skilled operators (C33), and Occupational hazards (C34).
Social Factors (C4): Public Acceptance (C41) and Land Requirement (C42).
After determining the criteria and alternatives through literature review and interview sessions with experts, the judgments are obtained by a group of experts or DMs, sequentially for each step. The jury consists of three members: a municipal authority, a senior researcher and a system engineer at an HCW treatment facility. First, we collected the opinion of each expert individually, and afterward, several brainstorming sessions have been performed until the DMs reach a consensus. Based on the consolidated opinions, the proposed framework is implemented to select the optimum HCW treatment technology for Chhattisgarh. The summarized process flow diagram is represented in the Figure 4 and the detailed implementation is illustrated in the following section.
The process flow diagram of the case study.
4.2. Illustration of the Proposed Model
4.2.1. Determine the interdependencies among factors and criteria
Step 1: In order to build the foundation for pair-wise comparisons of evaluative criteria, it is required to determine the relationships among the factors (clusters) and their metrics (criteria). The DEMATEL method is used to evaluate relationships among clusters owing to its capability to reveal direct and indirect causal relations among decision factors. Based on consolidated opinions of the DMs, the initial influence matrix is formed using the 0 – 4 scale of the DEMATEL. Since the consensed judgments are acquired from DMs, there is no requirement to aggregate individual judgments. The initial influence matrix is presented in Table 3:
| Economic | Environmental | Technical | Social | |
|---|---|---|---|---|
| Economic | 0 | 1 | 1 | 1 |
| Environmental | 2 | 0 | 2 | 3 |
| Technical | 2 | 3 | 0 | 1 |
| Social | 1 | 1 | 1 | 0 |
Initial influence matrix A.
Step 2: The initial influence matrix A is first utilized to calculate normalized initial matrix D using Eq. (18). Afterward, the total relation matrix T = D(I − D)−1 is calculated where I denotes identity matrix. The total relation matrix represents the net direct/indirect influences and the causal-effect relationship of the evaluative factors on each other. The total relation matrix for the illustrative problem is shown in the Table 4:
| Economic | Environmental | Technical | Social | |
|---|---|---|---|---|
| Economic | 0.267 | 0.387 | 0.348 | 0.396 |
| Environmental | 0.740 | 0.508 | 0.657 | 0.846 |
| Technical | 0.735 | 0.812 | 0.431 | 0.657 |
| Social | 0.392 | 0.387 | 0.348 | 0.271 |
Total relation matrix T.
Step 3: In order to eliminate the extraneous and negligible influences and curtail the complexity of the model, the threshold is determined. The DMs established the value of threshold to 0.3. As consequence, two influences associated with values 0.267 and 0.271 are purged from the decision model.
Afterward, an NRM is constructed based on the remaining influences represented by the total relation matrix T. First, four nodes are drawn representing four main factors of the problem and subsequently, nodes are connected with using directed lines. For each value higher than the threshold value, a direct line is drawn from row element toward column element. The resultant NRM is shown in Figure 5.
Network relation map of the healthcare waste (HCW) alternative selection problem.
4.2.2. Obtain the priority weights of the criteria of HCW treatment alternative selection
Step 4: As the NRM (Figure 5) reflects, the environment and technical clusters show inner-dependencies. The DEMATEL method is used to quantify the inner-dependencies among main factors. First, the initial influence matrix is obtained from DMs for each factor showing inner-dependency. Then, the total relation matrix is derived from those initial influence matrices. Total relation matrices reflecting the inner-dependencies of environmental and technical factors are presented in Tables 5 and 6, respectively. The total relation matrices are normalized by dividing values with respective row-sums. Finally, the resultant normalized matrices are transposed and placed into the appropriate positions in the supermatrix (Table 7).
| Waste Residuals | Energy Consumption | Volume Reduction | Row Sum | |
|---|---|---|---|---|
| Waste residuals | 0.872 | 1.122 | 1.497 | 3.491 |
| Energy consumption | 1.122 | 0.872 | 1.497 | 3.491 |
| Volume reduction | 0.997 | 0.997 | 0.997 | 2.991 |
Total relation matrix showing inner-dependency of environmental factor.
| Treatment Effectiveness | Level of Automation | Need for Skilled Operators | Occupational Hazards | Row Sum | |
|---|---|---|---|---|---|
| Treatment effectiveness | 0.576 | 0.776 | 0.863 | 1.098 | 3.313 |
| Level of automation | 0.776 | 0.576 | 0.863 | 1.098 | 3.313 |
| Need for skilled operators | 0.471 | 0.471 | 0.412 | 0.706 | 2.06 |
| Occupational hazards | 0.706 | 0.706 | 0.784 | 0.726 | 2.92 |
Total relation matrix showing inner-dependency of the technical factor.
| C11 | C12 | C13 | C21 | C22 | C23 | C31 | C32 | C33 | C34 | C41 | C42 | |
|---|---|---|---|---|---|---|---|---|---|---|---|---|
| C11 | 0 | 0 | 0 | 0.518 | 0 | 0 | 0.502 | 0.805 | 0 | 0.5 | 0.33 | 0 |
| C12 | 0 | 0 | 0 | 0.241 | 1 | 0 | 0.208 | 0.195 | 0 | 0.5 | 0.33 | 0 |
| C13 | 0 | 0 | 0 | 0.241 | 0 | 1 | 0.29 | 0 | 0 | 0 | 0.33 | 0 |
| C21 | 0.698 | 0.5 | 0.5 | 0.250 | 0.321 | 0.333 | 0.66 | 0 | 0.5 | 1 | 1 | 0 |
| C22 | 0 | 0.5 | 0 | 0.321 | 0.250 | 0.333 | 0.09 | 1 | 0 | 0 | 0 | 0 |
| C23 | 0.302 | 0 | 0.5 | 0.429 | 0.429 | 0.333 | 0.25 | 0 | 0.5 | 0 | 0 | 1 |
| C31 | 0.698 | 0 | 0 | 1 | 0 | 1 | 0.174 | 0.234 | 0.229 | 0.242 | 0.744 | 0 |
| C32 | 0.302 | 0.33 | 0 | 0 | 0.805 | 0 | 0.234 | 0.174 | 0.229 | 0.242 | 0 | 0 |
| C33 | 0 | 0.33 | 0 | 0 | 0.195 | 0 | 0.26 | 0.26 | 0.2 | 0.268 | 0 | 0 |
| C34 | 0 | 0.33 | 0 | 0 | 0 | 0 | 0.331 | 0.331 | 0.342 | 0.248 | 0.256 | 0 |
| C41 | 0 | 0 | 0 | 0 | 0 | 0 | 1 | 0 | 0 | 0 | 0 | 0 |
| C42 | 1 | 0 | 0 | 0 | 0 | 0 | 0 | 0 | 0 | 0 | 0 | 0 |
Supermatrix of evaluative criteria of healthcare waste (HCW) selection problem.
Step 5: Based on the interdependent relationships, indicated by NRM, DMs provide their consensed opinions using Table 2 in the form of IFPRs. For each interdepended relationship, one IFPR is required to represent the preferences of criteria of the same factors (row elements) with respect to the control criterion (column element). It is noteworthy that participation of each element of a cluster in the pair-wise comparison is not mandatory as it completely depends on the influence of the elements on the control criterion. The preference of nonparticipating elements in a pair-wise comparison is deemed to be Zero. An IFPR showing pair-wise comparisons of the environmental criteria with respect to treatment effectiveness is presented in Table 8.
| Treatment Effectiveness | Waste Residuals | Energy Consumption | Volume Reduction | Priorities |
|---|---|---|---|---|
| Waste residuals | (0.50,0.50) | (1.0,0) | (0.90,0.00) | 0.66 |
| Energy consumption | (0.00,1.0) | (0.50,0.50) | (0.10,0.90) | 0.09 |
| Volume reduction | (0.00,0.90) | (0.90,0.10) | (0.50,0.50) | 0.25 |
The pair-wise comparisons of environmental criteria with respect to treatment effectiveness.
Step 6: Since the opinions obtained from the DMs are often inconsistent, the consistency of each IFPR is checked using the consistency check algorithm [32] before priority derivation process. Priorities of inconsistent IFPRs can lead to suboptimal decisions; therefore, the inconsistent IFPRs are repaired using the algorithm until they show acceptable consistency. First, perfect multiplicative consistent IFPRs are constructed using Equations (19–22) for each IFPRs obtained from DMs and then the distances between them are calculated using Equation (23). These distances are regarded as inconsistencies of IFPRs. If the inconsistency of any IFPR is found greater than 10%, it is fused by averaging with its corresponding perfect multiplicative IFPR until it becomes acceptably consistent. For instance, the inconsistency of the IFPR, shown in Table 8, is 0.099, which is acceptable for the priority derivation.
Step 7: The priorities are derived from each IFPR collected from DMs using the proposed priority method (Section 3.1). After obtaining the priorities from IFPRs, the priorities are arranged in the form of supermatrix (Table 7). The first row and column list evaluative criteria. The criteria listed in the first row are treated as control criterion. Priorities of each criterion, listed in the first column, with respect to the control criterion are placed in the column of control criterion. The priorities of inner-dependent clusters, obtained in step 4, are also placed in appropriate places of the supermatrix. The priorities of inner-dependent clusters are displayed in the boxes in the supermatrix.
Step 8: It can be observed in Table 7 that the sum of the elements of many columns are greater than One. In order to unify the sum of the columns, the supermatrix is normalized. The resultant matrix is referred to as weighted supermatrix and displayed in Table 9. In order to derive the criteria weights from the weighted supermatrix, it is raised to the power of 200. The limit supermatrix is presented in Table 10. Each row of the limit supermatrix represents the relative importance of the corresponding criterion. Normalized column of the limit supermatrix represent the weight vector w = (w1, w2, …. wn) for the evaluative criteria.
| C11 | C12 | C13 | C21 | C22 | C23 | C31 | C32 | C33 | C34 | C41 | C42 | |
|---|---|---|---|---|---|---|---|---|---|---|---|---|
| C11 | 0.000 | 0.000 | 0.000 | 0.173 | 0.000 | 0.000 | 0.126 | 0.268 | 0.000 | 0.167 | 0.110 | 0.000 |
| C12 | 0.000 | 0.000 | 0.000 | 0.080 | 0.333 | 0.000 | 0.052 | 0.065 | 0.000 | 0.167 | 0.110 | 0.000 |
| C13 | 0.000 | 0.000 | 0.000 | 0.080 | 0.000 | 0.333 | 0.073 | 0.000 | 0.000 | 0.000 | 0.110 | 0.000 |
| C21 | 0.233 | 0.251 | 0.500 | 0.083 | 0.107 | 0.111 | 0.165 | 0.000 | 0.250 | 0.333 | 0.334 | 0.000 |
| C22 | 0.000 | 0.251 | 0.000 | 0.107 | 0.083 | 0.111 | 0.023 | 0.333 | 0.000 | 0.000 | 0.000 | 0.000 |
| C23 | 0.101 | 0.000 | 0.500 | 0.143 | 0.143 | 0.111 | 0.063 | 0.000 | 0.250 | 0.000 | 0.000 | 1.000 |
| C31 | 0.233 | 0.000 | 0.000 | 0.333 | 0.000 | 0.333 | 0.044 | 0.078 | 0.115 | 0.081 | 0.249 | 0.000 |
| C32 | 0.101 | 0.166 | 0.000 | 0.000 | 0.268 | 0.000 | 0.059 | 0.058 | 0.115 | 0.081 | 0.000 | 0.000 |
| C33 | 0.000 | 0.166 | 0.000 | 0.000 | 0.065 | 0.000 | 0.065 | 0.087 | 0.100 | 0.089 | 0.000 | 0.000 |
| C34 | 0.000 | 0.166 | 0.000 | 0.000 | 0.000 | 0.000 | 0.083 | 0.110 | 0.171 | 0.083 | 0.086 | 0.000 |
| C41 | 0.000 | 0.000 | 0.000 | 0.000 | 0.000 | 0.000 | 0.250 | 0.000 | 0.000 | 0.000 | 0.000 | 0.000 |
| C42 | 0.333 | 0.000 | 0.000 | 0.000 | 0.000 | 0.000 | 0.000 | 0.000 | 0.000 | 0.000 | 0.000 | 0.000 |
Weighted supermatrix.
| C11 | C12 | C13 | C21 | C22 | C23 | C31 | C32 | C33 | C34 | C41 | C42 | |
|---|---|---|---|---|---|---|---|---|---|---|---|---|
| C11 | 0.081 | 0.081 | 0.081 | 0.081 | 0.081 | 0.081 | 0.081 | 0.081 | 0.081 | 0.081 | 0.081 | 0.081 |
| C12 | 0.067 | 0.067 | 0.067 | 0.067 | 0.067 | 0.067 | 0.067 | 0.067 | 0.067 | 0.067 | 0.067 | 0.067 |
| C13 | 0.081 | 0.081 | 0.081 | 0.081 | 0.081 | 0.081 | 0.081 | 0.081 | 0.081 | 0.081 | 0.081 | 0.081 |
| C21 | 0.183 | 0.183 | 0.183 | 0.183 | 0.183 | 0.183 | 0.183 | 0.183 | 0.183 | 0.183 | 0.183 | 0.183 |
| C22 | 0.085 | 0.085 | 0.085 | 0.085 | 0.085 | 0.085 | 0.085 | 0.085 | 0.085 | 0.085 | 0.085 | 0.085 |
| C23 | 0.151 | 0.151 | 0.151 | 0.151 | 0.151 | 0.151 | 0.151 | 0.151 | 0.151 | 0.151 | 0.151 | 0.151 |
| C31 | 0.160 | 0.160 | 0.160 | 0.160 | 0.160 | 0.160 | 0.160 | 0.160 | 0.160 | 0.160 | 0.160 | 0.160 |
| C32 | 0.064 | 0.064 | 0.064 | 0.064 | 0.064 | 0.064 | 0.064 | 0.064 | 0.064 | 0.064 | 0.064 | 0.064 |
| C33 | 0.041 | 0.041 | 0.041 | 0.041 | 0.041 | 0.041 | 0.041 | 0.041 | 0.041 | 0.041 | 0.041 | 0.041 |
| C34 | 0.046 | 0.046 | 0.046 | 0.046 | 0.046 | 0.046 | 0.046 | 0.046 | 0.046 | 0.046 | 0.046 | 0.046 |
| C41 | 0.040 | 0.040 | 0.040 | 0.040 | 0.040 | 0.040 | 0.040 | 0.040 | 0.040 | 0.040 | 0.040 | 0.040 |
| C42 | 0.027 | 0.027 | 0.027 | 0.027 | 0.027 | 0.027 | 0.027 | 0.027 | 0.027 | 0.027 | 0.027 | 0.027 |
Limit supermatrix.
4.2.3. Selection of the most appropriate HCW alternative
Step 9: All six HCW treatment alternatives are evaluated, with respect to each criterion, by DMs. The assessment scale (Table 2) is used in the pair-wise comparisons of the alternatives. The pair-wise comparisons yielded 12 IFPRs, which are checked for their inconsistencies before priority derivation. The proposed priority method is used to derive the priority from the IFPRs. Table 11 presents the evaluation of all the HCW treatment technologies with respect to capital cost. The distance between presented IFPR and its perfect multiplicative consistent IFPR is calculated as 15.8% and thus, both are fused to results into an IFPR. Same process for consistency checking is done with the resultant IFPR, which shows 7.9% inconsistency and acceptable for the priority derivation. Proposed priority method is applied on the IFPR to derive priorities, which also are shown in the Table 11. Similarly, the relative weights of HCW treatment alternatives over other criteria are derived from respective IFPRs. The obtained priorities are listed in Table 12.
| Capital Cost | A1 | A2 | A3 | A4 | A5 | A6 | Priorities |
|---|---|---|---|---|---|---|---|
| A1 | (0.50, 0.50) | (0.20, 0.50) | (0.20, 0.50) | (0.30, 0.50) | (0.50, 0.40) | (0.50, 0.50) | 0.137 |
| A2 | (0.50, 0.20) | (0.50, 0.50) | (0.50, 0.50) | (0.60, 0.30) | (0.75, 0.15) | (0.50, 0.20) | 0.216 |
| A3 | (0.50, 0.20) | (0.50, 0.50) | (0.50, 0.50) | (0.60, 0.30) | (0.75, 0.15) | (0.50, 0.20) | 0.216 |
| A4 | (0.50, 0.30) | (0.30, 0.60) | (0.30, 0.60) | (0.50, 0.50) | (0.65, 0.25) | (0.60, 0.20) | 0.172 |
| A5 | (0.40, 0.50) | (0.15, 0.75) | (0.15, 0.75) | (0.25, 0.65) | (0.50, 0.50) | (0.40, 0.50) | 0.125 |
| A6 | (0.50, 0.50) | (0.20, 0.50) | (0.20, 0.50) | (0.20, 0.60) | (0.50, 0.40) | (0.50, 0.50) | 0.132 |
Evaluation of all the HCW treatment technologies with respect to capital cost.
| C11 | C12 | C13 | C21 | C22 | C23 | C31 | C32 | C33 | C34 | C41 | C42 | Overall Priorities | |
|---|---|---|---|---|---|---|---|---|---|---|---|---|---|
| Criteria Weights (wj) | 0.079 | 0.066 | 0.079 | 0.178 | 0.083 | 0.147 | 0.156 | 0.062 | 0.040 | 0.045 | 0.039 | 0.026 | |
| A1 | 0.137 | 0.111 | 0.145 | 0.119 | 0.099 | 0.212 | 0.263 | 0.196 | 0.099 | 0.109 | 0.119 | 0.109 | 0.160 |
| A2 | 0.216 | 0.223 | 0.21 | 0.133 | 0.303 | 0.105 | 0.098 | 0.119 | 0.262 | 0.125 | 0.138 | 0.249 | 0.163 |
| A3 | 0.216 | 0.223 | 0.153 | 0.179 | 0.227 | 0.17 | 0.177 | 0.188 | 0.262 | 0.231 | 0.263 | 0.212 | 0.195 |
| A4 | 0.172 | 0.143 | 0.165 | 0.253 | 0.157 | 0.12 | 0.126 | 0.173 | 0.159 | 0.256 | 0.214 | 0.19 | 0.173 |
| A5 | 0.125 | 0.192 | 0.175 | 0.161 | 0.119 | 0.15 | 0.097 | 0.122 | 0.12 | 0.165 | 0.143 | 0.123 | 0.141 |
| A6 | 0.132 | 0.107 | 0.153 | 0.154 | 0.092 | 0.242 | 0.238 | 0.202 | 0.097 | 0.113 | 0.121 | 0.115 | 0.167 |
Criteria-wise and overall priorities of healthcare waste (HCW) treatment alternative.
Step 10: In order to obtain overall priorities of HCW treatment alternative, their criteria-wise priorities are synthesized with their respective criteria weights. Results are shown in Table 12, which suggested that the ranking of six prominent HCW treatment technologies is A3 ≻ A4 ≻ A6 ≻ A2 ≻ A1 ≻ A5 and steam sterilization is the “Best” alternative for treatment of HCW for the undertaken case study.
4.3. Sensitivity Analysis
In order to verify the robustness of the result obtained from the proposed decision making framework, we performed a sensitivity analysis on the judgments collected from the DMs. The sensitivity analysis applied in this paper has a resemblance to the Bootstrap sensitivity analysis [55] utilized in the REPOMP method [56]. However, the sampling procedures of both approaches are completely different. The REPOMP method assumes the judgment-vectors provided by experts as data points and these data points are “drawn with replacement” to construct input for simulation. On the other hand, our approach inputs the randomized actual judgments to the simulation. For each expert-opinion (values in preference relations), a normal distribution range is created, which depends upon the degree of uncertainty we input to the simulation. Then, a data point is picked randomly to replace the original value. For each iteration of the experiment, all the data values are replaced by corresponding randomized values. To implement the experiment, our sensitivity analysis approach uses Monte-Carlo simulation. First, the computer simulation is designed to put a significant amount of uncertainty in the decision model of the considered case study replacing original judgment values by pseudorandom values generated from a uniform distribution. Then, the simulation was run for a considerable large number (107) of iterations and the results are recorded. Afterward, statistical analysis is performed on the simulation results. The statistical facts about the rankings of the six alternatives obtained from the simulation results are presented as the box-plot chart in Figure 6. The black circles reflect the median of the respective alternative’s rankings obtained through iterative runs of the simulations. The blue box represents the quartiles Q1–Q3 (25%–75% of the samples had this ranking), and the best and the worst ranks are the endpoints of the grey lines. It can be observed from the box-plot chart that there is no change in the rank of the best alternative despite the external uncertainty is added to the DMs’ judgments. Besides the medians of the ranking are same as corresponding actual ranks, which indicate that in most of the iterations of the simulation runs, rankings of the alternatives do not differ from the original rankings.

Box-plot chart presenting simulation results.
In addition, we replaced a randomly selected alternative (A2) with a less preferred alternative (A5) to check the validity of the results. With this change, the scores are computed as P(A1) = 0.16, P(A2) = 0.15, P(A3) = 0.20, P(A4) = 0.18, P(A5) = 0.1, P(A6) = 0.17. As result, the new ranking order of the alternatives is A3 ≻ A4 ≻ A6 ≻ A1 ≻ A2 ≈ A5 and there is no change in the rank of the best alternative.
5. RESULTS AND DISCUSSION
The results of the empirical case study provide some important insights regarding evaluative criteria and prominent alternatives for the HCW treatment in Chhattisgarh state. As it can be observed in Table 12, waste residuals and their environmental impacts (C21) and treatment effectiveness (C31) are the most important criteria with 17.8% and 15.6% weights, while land requirement (C42) and public acceptance (C41) are least important criteria with 2.6% and 3.9% weights. The weights of economic factors, environmental factors, technical factors, and social factors are 40.8%, 30.3%, 22.4% and 6.5%, respectively, which reveals that DMs believe environmental factors and technical factors are more concerned about public health and should not be overlooked while selecting the optimum treatment technology for biomedical waste.
We also analyzed the performances of the HCW treatment alternative with respect to each evaluative factor. The ranks and relative weights of the HCW treatment alternatives over each main factor are presented in Table 13. It can be observed that steam sterilization (A3) ranked either first or second with respect to all the factors, and hence, it has been selected as the “Best” HCW treatment alternative satisfying all the evaluative criteria. Besides, one noteworthy fact revealed from the Table 13 is the similarity of overall rankings of alternative with their rankings with respect to environmental factors, which shows the dominance of environmental factors in the selection of HCW treatment technology.
| Alternatives | Economic Criteria | Environmental Criteria | Technical Criteria | Social Criteria | ||||
|---|---|---|---|---|---|---|---|---|
| Weight | Rank | Weight | Rank | Weight | Rank | Weight | Rank | |
| A1 | 0.030 | 5 | 0.061 | 6 | 0.062 | 1 | 0.008 | 6 |
| A2 | 0.048 | 1 | 0.064 | 4 | 0.039 | 5 | 0.012 | 3 |
| A3 | 0.044 | 2 | 0.076 | 1 | 0.060 | 2 | 0.016 | 1 |
| A4 | 0.036 | 4 | 0.076 | 2 | 0.048 | 4 | 0.013 | 2 |
| A5 | 0.036 | 3 | 0.061 | 5 | 0.035 | 6 | 0.009 | 4 |
| A6 | 0.030 | 6 | 0.071 | 3 | 0.059 | 3 | 0.008 | 5 |
Scores and ranks of healthcare waste (HCW) alternative with respect to evaluative factors.
Furthermore, the rankings of alternatives are analyzed in the absence of particular factor, one at a time. The results are presented in Table 14, which shows the strengths and weakness of each HCW treatment technology. It can be observed that steam sterilization (A3) is ranked first regardless of the absence of any criteria or factor, while incineration shows drastic change in ranking in absence of environmental factors (Rank 2) and technical factor (Rank 6) as opposed to its original rank (Rank 5).
| Case 0 | Case 1 | Case 2 | Case 3 | Case 4 | |
|---|---|---|---|---|---|
| Alternatives | Original Weights | Economic Factors = 0 | Environmental Factor = 0 | Technical Factor = 0 | Social Factor = 0 |
| A1 | 5 | 4 | 2 | 6 | 4 |
| A2 | 4 | 5 | 3 | 3 | 5 |
| A3 | 1 | 1 | 1 | 1 | 1 |
| A4 | 2 | 2 | 4 | 2 | 2 |
| A5 | 6 | 6 | 6 | 5 | 6 |
| A6 | 3 | 3 | 5 | 4 | 3 |
Rankings of HCW treatment alternatives with respect to the considered cases.
Results of the analysis carried out in this section and the previous section shows that the ranking produced by the proposed integrated framework for HCW treatment selection is reliable, and steam sterilization is the most promising HCW treatment alternative for the Chhattisgarh state. The results also reveal that incineration is an effective treatment technology but due to its high cost and adverse effect on the environment and public health, it is not selected as an appropriate solution for HCW disposal.
In addition, we compare the ranking obtained by utilizing the proposed approach with the rankings of state-of-the-art studies on the HCW treatment technology selection. The comparison includes Fuzzy TOPSIS [23], 2-tuple linguistic MULTIMOORA [25], extended MABAC method [7], Interval 2-Tuple Induced TOPSIS [27], and D number based linguistic variable approach [28] (Table 15). However, the mentioned previous studies included only four alternatives: incineration, steam sterilization, microwave, and landfilling while our study included three additional promising HCW treatment technologies: chemical disinfection, reverse polymerization, and plasma pyrolysis. In addition, we excluded landfilling from our study due to its ineffectiveness to treat infected and radioactive bio-medical waste. Nonetheless, the ranking of the common alternatives, calculated by proposed methodology, are consistent with the ranking calculated by aforementioned methods, which is steam sterilization ≻ microwave ≻ incineration. This validates the reliability of the proposed decision-making framework. In addition, we carried out an experiment, similar to that provided in Section 4.3, to perform sensitivity analysis on the results of all the aforementioned approaches using large number of stochastic iterations. The statistical analysis of the experimental results reveals that the mean rankings of all the approaches are very close to the respective original rankings and the numbers of rank-reversal are insignificant.
| Method | Ranking | Mean Ranking (Sensitivity Analysis) |
|---|---|---|
| Dursun et al. [23] | ss ≻ mw ≻ inci ≻ ll | ss ≻ mw ≻ inci ≻ ll |
| Liu et al. [25] | ss ≻ mw ≻ inci ≻ ll | ss ≻ mw ≻ inci ≻ ll |
| Shi et al. [7] | ss ≻ mw ≻ inci ≻ ll | s ≻ mw ≻ inci ≻ ll |
| Lu et al. [27] | ss ≻ mw ≻ inci ≻ ll | ss ≻ mw ≻ inci ≻ ll |
| Xiao [28] | ss ≻ mw ≻ inci ≻ ll | ss ≻ mw ≻ inci ≻ ll |
| Proposed method | ss ≻ mw ≻ pp ≻ cd ≻ inci ≻ rp | ss ≻ miw ≻ pp ≻ cd ≻ inci ≻ rp |
Note: Abbreviations of the HCW treatment technologies are used in the Table; for instance, ss represents steam sterilization and mw represents microwave.
Comparison of the ranking of proposed approach with the rankings of different state-of-the-art approaches.
6. CONCLUSION
HCW disposal has been becoming a serious problem for municipalities and has been receiving an escalating amount of consideration from researchers and industries in recent years. Selection of the optimal technology for HCW treatment is a complicated and challenging job for accountable local governing bodies, especially in developing countries. Owing to the conflicting evaluation criteria, selecting a suitable treatment technology for HCW management can be regarded as complex MCDM problem. Moreover, the domain experts and DMs provide imprecise linguistic terms as their judgments due to the vague nature of system parameters, imprecise information, and hesitancy. In this paper, we proposed an integrated MCDM framework that combines DEMATEL, IF-ANP, and IF-AHP methods to select appropriate HCW treatment technology. The proposed MCDM framework can handle the complex interdependent relationship among factors and criteria and produce an NRM that shows the magnitude of the influences of the criteria and the factors. The information of dominant criteria helps to bridge the desired level and current level of extant treatment alternatives for HCW management. In addition, the proposed methodology uses IFSs to capture the uncertainty in the judgments of DMs in order that the rankings of the alternatives remain unaffected from the vagueness of the DMs’ opinions. In order to validate the proposed method, an empirical study was conducted in Chhattisgarh, India. The empirical study demonstrates the application of the proposed integrated framework to the selection of HCW treatment technology and the results of performed analysis confirm its effectiveness. From the empirical study, it was established that the proposed integrated MCDM framework can effectively handle the issue of HCW treatment technology selection in uncertain environments.
One of potential directions of our research will be expanding the proposed integrated MCDM framework by incorporating objective as well as subjective information. Since the current model completely relies on the experts’ subjective opinions, lack of domain knowledge can lead erroneous results. Therefore, modeling an MCDM framework that incorporates subjective as well as objective information for prioritization will be our possible next step. Furthermore, application of the hesitant fuzzy sets [57] to the multi-criteria decision-making is rapidly growing owing to its capability to interpret vague information efficiently. Some studies (Zhang et al. [58, 59], Rodríguez et al. [60], Yu et al. [61]) have proposed hesitant fuzzy preference relation and methods for accounting its consistency. Incorporation of hesitant fuzzy preference relation as preference elicitation approach can be a significant extension of the proposed work. Another mathematical model that can effectively operate with linguistic expressions is hesitant fuzzy linguistic term set [62–64] as it allows the DMs to express their opinions using terms like “at least moderately preferable” and “between Strongly preferable and Extremely preferable.” It can be very interesting extension of the current research to use the hesitant fuzzy linguistic terms to construct preference relations. Aforementioned extensions of this work may have a great chance of success. Further development on this study is to implement the proposed method into a web-based application for the quick execution of the proposed MCDM framework for HCW treatment technology selection. In addition, a number of government officials and practitioners all over the world can be benefited from the online implementation.
REFERENCES
Cite this article
TY  - JOUR
AU  - Akshay Hinduja
AU  - Manju Pandey
PY  - 2019
DA  - 2019/02/04
TI  - Assessment of Healthcare Waste Treatment Alternatives Using an Integrated Decision Support Framework
JO  - International Journal of Computational Intelligence Systems
SP  - 318
EP  - 333
VL  - 12
IS  - 1
SN  - 1875-6883
UR  - https://doi.org/10.2991/ijcis.2018.125905685
DO  - 10.2991/ijcis.2018.125905685
ID  - Hinduja2019
ER  -