
Efficient Prediction of Water Quality Index (WQI) Using Machine Learning Algorithms
- DOI
- 10.2991/hcis.k.211203.001How to use a DOI?
- Keywords
- River water; water quality prediction; WQI; NN
- Abstract
The quality of water has a direct influence on both human health and the environment. Water is utilized for a variety of purposes, including drinking, agriculture, and industrial use. The water quality index (WQI) is a critical indication for proper water management. The purpose of this work was to use machine learning techniques such as RF, NN, MLR, SVM, and BTM to categorize a dataset of water quality in various places across India. Water quality is dictated by features such as dissolved oxygen (DO), total coliform (TC), biological oxygen demand (BOD), Nitrate, pH, and electric conductivity (EC). These features are handled in five steps: data pre-processing using min-max normalization and missing data management using RF, feature correlation, applied machine learning classification, and model’s feature importance. The highest accuracy Kappa, Accuracy Lower, and Accuracy Upper findings in this research are 99.83, 99.17, 99.07, and 99.99, respectively. The finding showed that Nitrate, PH, conductivity, DO, TC, and BOD are the key qualities that contribute to the orderly classification of water quality, with Variable Importance values of 74.78, 36.805, 81.494, 105.770, 105.166, and 130.173, respectively.
- Copyright
- © 2021 The Authors. Publishing services by Atlantis Press International B.V.
- Open Access
- This is an open access article distributed under the CC BY-NC 4.0 license (http://creativecommons.org/licenses/by-nc/4.0/).
1. INTRODUCTION
Water is an inorganic, transparent, and colourless chemical substance that is required for the survival of most existing organisms and humans. Water of sufficient quality is required for living creatures to survive. Water species can only withstand a certain amount of pollution. Exceeding these boundaries has an impact on the existence of these organisms and puts their lives in jeopardy. Water quality monitoring is a must to keep a reliable and safe water supply. Water contamination has become increasingly significant as the economy has grown and urbanization has expanded. Predicting water efficiency factors is a troublesome element of any hydrophyte system’s examination. The study of various strategies for predicting water quality in reservoirs has both theoretical and practical implications [1]. Several variables can affect water efficiency, including the calcium content in natural water, as well as industrial waste, stones, and contaminated sewage, which can all be considered calcium sources, resulting in poor water quality. Moreover, hard water is linked to heart disease and a slew of other significant and chronic illnesses. The impurity of water sources by chemical, physical, and radioactive pollutants is the most common cause of water pollution [2]. In truth, the repercussions of contaminated drinking water are quite harmful, posing a serious condition to human health, the environment, and infrastructure. According to a United Nations (UN) report, 1.5 million people expire each year as a result of illnesses that occurred in contaminated water. Water contamination is said to be the cause of 80% of health problems in impoverished countries. Every year, there are 5 million fatalities and 2.5 billion illnesses reported [3]. Using different ANN models, several types of research have been conducted to simulate and predict water quality. The probability and usefulness of using ANN applications to forecast the quality of drinking water have been confirmed in these investigations. Measurements of different parameters like chemical oxygen demand (COD), dissolved oxygen (DO), electrical conductivity (EC), biochemical oxygen demand (BOD), temperature, pH, K, Na, Mg, and other water quality components have been proposed. Various studies have been conducted to determine the consequence of considerations selected in water monitoring systems. Hyperion methods, water quality index, and hazard quotient as oxidation-reduction potential (ORP), and other Physico-chemical characteristics were discussed in the survey, as well as their impact on water quality. A survey has done [4] with this in mind, this study investigates some supervised machine learning (ML) algorithms for estimating the water quality index (WQI), which is a single index that describes the water quality class (WQC) and general quality of water, which is a different class based on the WQI. pH, Temperature, total dissolved solids, and turbidity are four input parameters used in the suggested methodology. Liu et al. [5] introduced a paper for analysing and predicting Water Quality Using LSTM Deep Neural Networks in the IoT Environment. The major goal of this study is to develop a computationally efficient and reliable method aimed at estimating water quality characteristics to reduce the quantity of our time and money during measuring them. We use some advanced machine learning techniques like ANN, SVM, RF, Multinomial Logistic regression (MLR), Bagged Tree Models (BT) which are used to predict WQI and WQC based on several parameters. The highly useful generated models are utilized to identify the mode of the water contamination process, assisting decision-makers in making the appropriate decisions at the appropriate time.
The purpose of this research is to develop a reliable method for forecasting water quality with a proposed model as precisely as necessary. The following are the suitable approaches:
- •
In this study, missing data is handled using the Random Forest approach, and the dataset is splitting using the min-max normalization technique.
- •
Describe and demonstrate the dataset’s significant distribution and feature correlation.
- •
Based on prior research, select the most important features for WQC and categorize three distinct types of water quality based on WQI rate.
- •
SVM, NN, MLR, BTM, and RF algorithms are used to optimize model performance.
- •
The proposed model approaches: develop a software application that uses the MLR algorithm to predict water quality in real time for these three types of WQ.
Section 2 offers a review of relevant research on water quality prediction using various classifiers. Section 3 then discusses the materials and techniques including data preparation, preprocessing, splitting, distribution, feature correlation, and WQI computation. Section 4 furthermore describes the different types of Machine Learning Models (RF, SVM, NN, MLR, and BTM) for forecasting WQI. Sections 5 and 6 respectively addressed the suggested model, findings, and discussion. Sections 7 and 8 provide a brief discussion of the accuracy comparison between our proposed model and current works, followed by the research conclusion.
2. LITERATURE REVIEW
Ahmed et al. [4] have used the supervised machine learning algorithms in order to assess the water quality index (WQI), where an individual index was used to summarize the overall quality of water, and water quality class (WQC). Their suggested techniques and the gradient boosting with a learning rate of 0.1 and polynomial regression with a degree of 2 has predicted the WQI most effectively, and that WQI was subsequently determined with a mean absolute error (MAE) of 1.9642 and 2.7273. In this instance, the MLP, which has the configuration of (3, 7), has the highest classification accuracy of 85.07%. Wang et al. [6] have proposed a two-layered model stacking approach for predictive modeling of beach water quality. The five most frequently used methods (partial least square, sparse partial least square, random forest, Bayesian network, akhand linear regression) are integrated into a machine learning model that is then used to generate the final forecast. In this case, the model stacking technique was applied to three different beaches around eastern Lake Erie, New York, USA, and compared to all five basis models. After analysis, the model stacking strategy performed better than all of the base models. Year-over-year, stacking model accuracy scores were constantly at or near the top of the rankings, with a year-on-year accuracy average of 78%, 81%, and 82.3% at the three tested beaches. Sillberg et al. [7] have developed a machine learning-based approach integrating attribute-realization (AR) and support vector machine (SVM) algorithm to classify the Chao Phraya River’s water quality. The AR has determined the most significant factors to improve the river’s quality using the linear function. In the categorization, the most contributing characteristics were: NH3 -N, TCB, FCB, BOD, DO, and Sal, boosting the contributed values in the range of 0.80–0.98, vs 0.25–0.64 for TDS, Turb, TN, SS, NO3-N, and Cond. The SVM linear method has enabled the best classification results represented as the accuracy of 0.94, a precision average of 0.84, recall average of 0.84, and F1-score average of 0.84. The validation showed that AR-SVM was a powerful method to identify river water quality with 0.86–0.95 accuracy when applied to three to six characteristics. Yilma et al. [8] have used an artificial neural network to simulate the Akaki River’s WQI. The twelve water quality indicators from 27 dry and wet season sample locations were utilized to calculate the index. Except for one upstream location, all forecast results have shown low water quality. Here, the number of hidden layers (2–20), hidden layer neurons (5, 10, 15, 20, 25), transfer, training, and learning functions were used to train and verify the neural network model through 12 inputs and one output. Their study has revealed that an artificial neural network with eight hidden layers and 15 hidden neurons accurately predicted the WQI with an accuracy of 0.93. Bui et al. [9] have developed a random tree and bagging (BA-RT) hybrid machine learning method. Their research has tested four standalone (RF, M5P, RT, and REPT) and 12 hybrid data-mining algorithms (hybrids of the standalone with bagging, CVPS, and RFC) for forecasting monthly WQI in a humid climate in northern Iran. To forecast IRAQIs, they found that fecal coliform and total solids had the largest and least impact. Here, the optimal input combinations have differed across algorithms but the variables with poor correlations have performed worse. The Hybrid algorithms have improved their prediction power of several of the standalone models, but not all, and the Hybrid BA-RT has outperformed the other models by achieving R2 0.941 using a 10-fold cross-validation technique, outdoing 15 standalone and hybrid algorithms. Ding et al. [10] have designed a hybrid intelligent method that combines Principal Component Analysis (PCA), Genetic Algorithm (GA), and Back Propagation Neural Network (BPNN) techniques for predicting river water quality. In this study, 23 different water quality indicator variables were utilized, each of which has a complicated non-linear connection to water quality. In this case, PCA has significantly increased the training speed of follow-up algorithms, while GA has optimized the parameters of BPNN. The average prediction rates for non-polluted and polluted water quality were 88.9% and 93.1% respectively, while the worldwide prediction rate was around 91%, according to the results. Azad et al. [11] have utilized the three evolutionary algorithms including, GA, DE, and ACOR in order to optimize the performance of adaptive neuro-fuzzy inference system (ANFIS) for water quality metrics prediction. These algorithms have been integrated with the ANFIS to predict the EC, SAR, and THE water quality metrics. Based on their research, the ANFIS-DE model, with an R2 of 0.98 and an RMSE of 73.03, as well as a MAPE of 5.16, was the most accurate in predicting EC and TH in the test stage. Furthermore, the ANFIS-DE and ANFIS-GA models have shown the greatest performance in SAR (R2 = 0.95, 0.91; RMSE = 0.43, 0.37; MAPE = 13.43, 13.72) prediction in a test stage. It has been shown that ANFIS is capable of producing the best results in the training stage with respect to water quality indicators. Zhang et al. [12] have improved a hybrid artificial neural network (HANN) model by the genetic algorithm (GA) for the prediction of drinking water treatment plants in china. The model has trained, validated, and has been continually validated using monthly data from 45 DWTPs across China that comprises eleven input variables for water quality and operational performance. The HANN model has shown better ability and consistency in forecasting the total water output of DWTPs in combination with the water quality and operational factors. Their prediction shows that the HANN model has improved its performance from 0.71 to 0.93 (R2) by increasing the training data provided, as shown by the fact that the model has the ability to grow to the greatest level of performance.
3. MATERIALS AND METHODS
Figure 1 depicts our optimization methodology for completing our research.
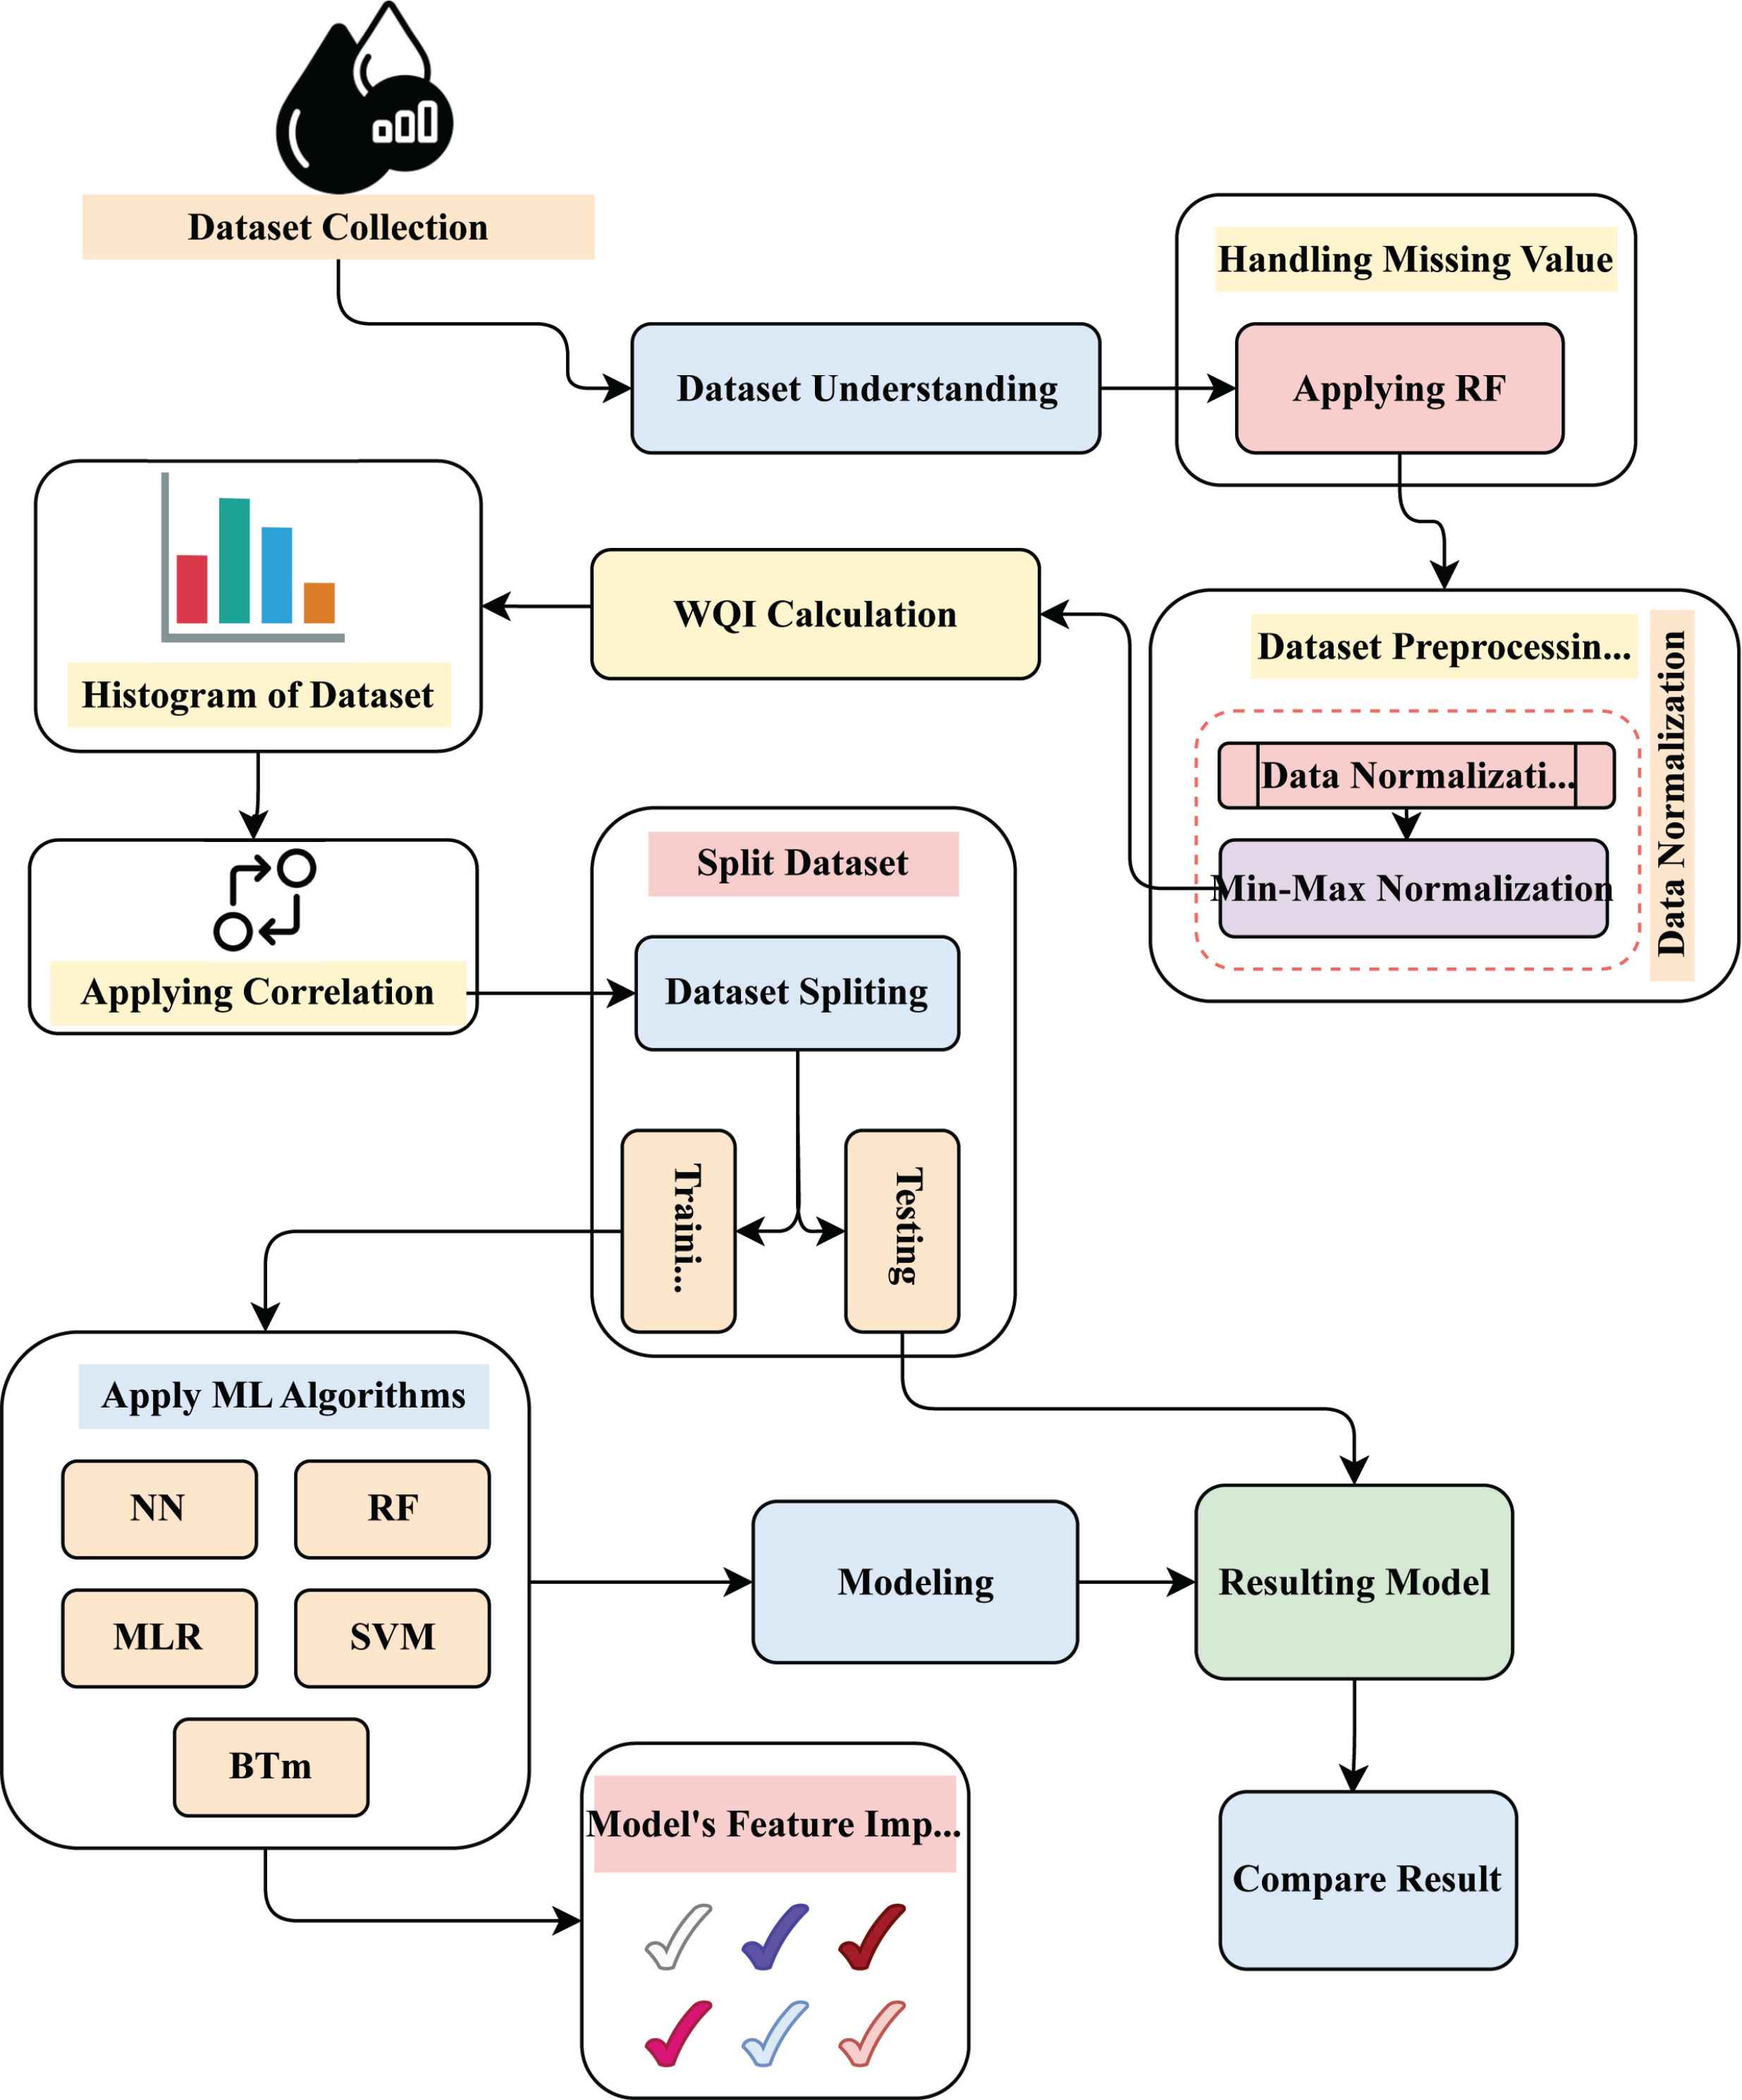
Working diagram of proposed model.
To conduct our research, we initially have decided to collect datasets from the Kaggle website, where we have used Indian water quality data. We have tried to properly understand our necessary data after collecting all datasets. Then, in order to counteract our vast number of datasets, we use Random Forest to handle any missing values from such sets of data. We initially focus on data Normalization and then Min-Max Normalization, which is a crucial procedure in data analysis, to improve data quality for all of our datasets. We calculate the WQI correctly to assess water quality in order to attain our purpose. We provide a Histogram of the dataset for better representation, where we can view the distribution of our entire dataset. Then we apply correlation to measure the changing capability of two variables at a constant rate. Following that, the dataset is distributed into two portions: training and testing. We have implemented five machine learning algorithms to train the dataset: Neural Network, Random Forest, Multinomial Logistic Regression, Support Vector Machine, and Bagged Tree Model, with six distinct colour signals indicating the relevance of each feature. Following the use of those techniques, we concentrate on modelling and obtain results from our intended model, which is also based on our dataset testing part. Finally, we compare all the outcomes by using the accuracy of our suggested models and perhaps some current approaches. As a result, this methodology ensures the validity and trustworthiness of our whole study.
3.1. Data Collection
The dataset in this research was gathered from Indian-water-quality-data on Kaggle [13]. Dissolved oxygen (DO), Biological Oxygen Demand (BOD), PH, Electrical Conductivity (EC), Nitratenan N+ Nitritenann (NNC), and Total coliform (TC) are some of the parameters that were used in this study. Table 1 shows the feature description.
| Attributes name | Description |
|---|---|
| DO | Amount of oxygen present in water. |
| PH | Water acidity and basicity are measured. |
| EC | Good water can conduct electricity in the presence of ions. The amount of dissolved substance, chemicals & minerals can be identified by it. |
| BOD | The amount of oxygen necessary to decompose organic waste from water is measured by BOD. |
| NNC | Excess nitrates, but essential plant nutrition, in combination with phosphorus, can hasten eutrophication. |
| TC | Bacteria that can be found in the soil, surface water has an impact, and total coliforms contain both human and animal faces. |
Feature description of datset
3.2. Data Pre-processing
In order to improve data quality, data processing is critical in data analysis. “The collecting and manipulation of data pieces to produce meaningful information” is how data processing is defined. The WQI was calculated in this phase using the dataset’s most important parameters. Then, based on the WQI values, water samples were categorized.
3.2.1. Missing data handling by RF method
Missing data methods based on random forests (RF) are a likable technique for attributing missing data. The plot of missing value of training dataset is shown to Figure 2. It has the desired qualities of being able to manage many forms of missing data, being adaptable to nonlinearity and interactions, and having the capacity to balance large data sets. There are several RF imputation methods available now, but little information on their effectiveness. The imputation performance of several RF methods was evaluated using a wide, diversified collection of data sets and distinct missing data techniques. Proximity imputation, on-the-fly imputation, and imputation based on multivariate unsupervised and supervised splitting are all examples of imputation techniques and among the algorithms used, with the latter being an extension of a promising new imputation approach known as missForest [14].
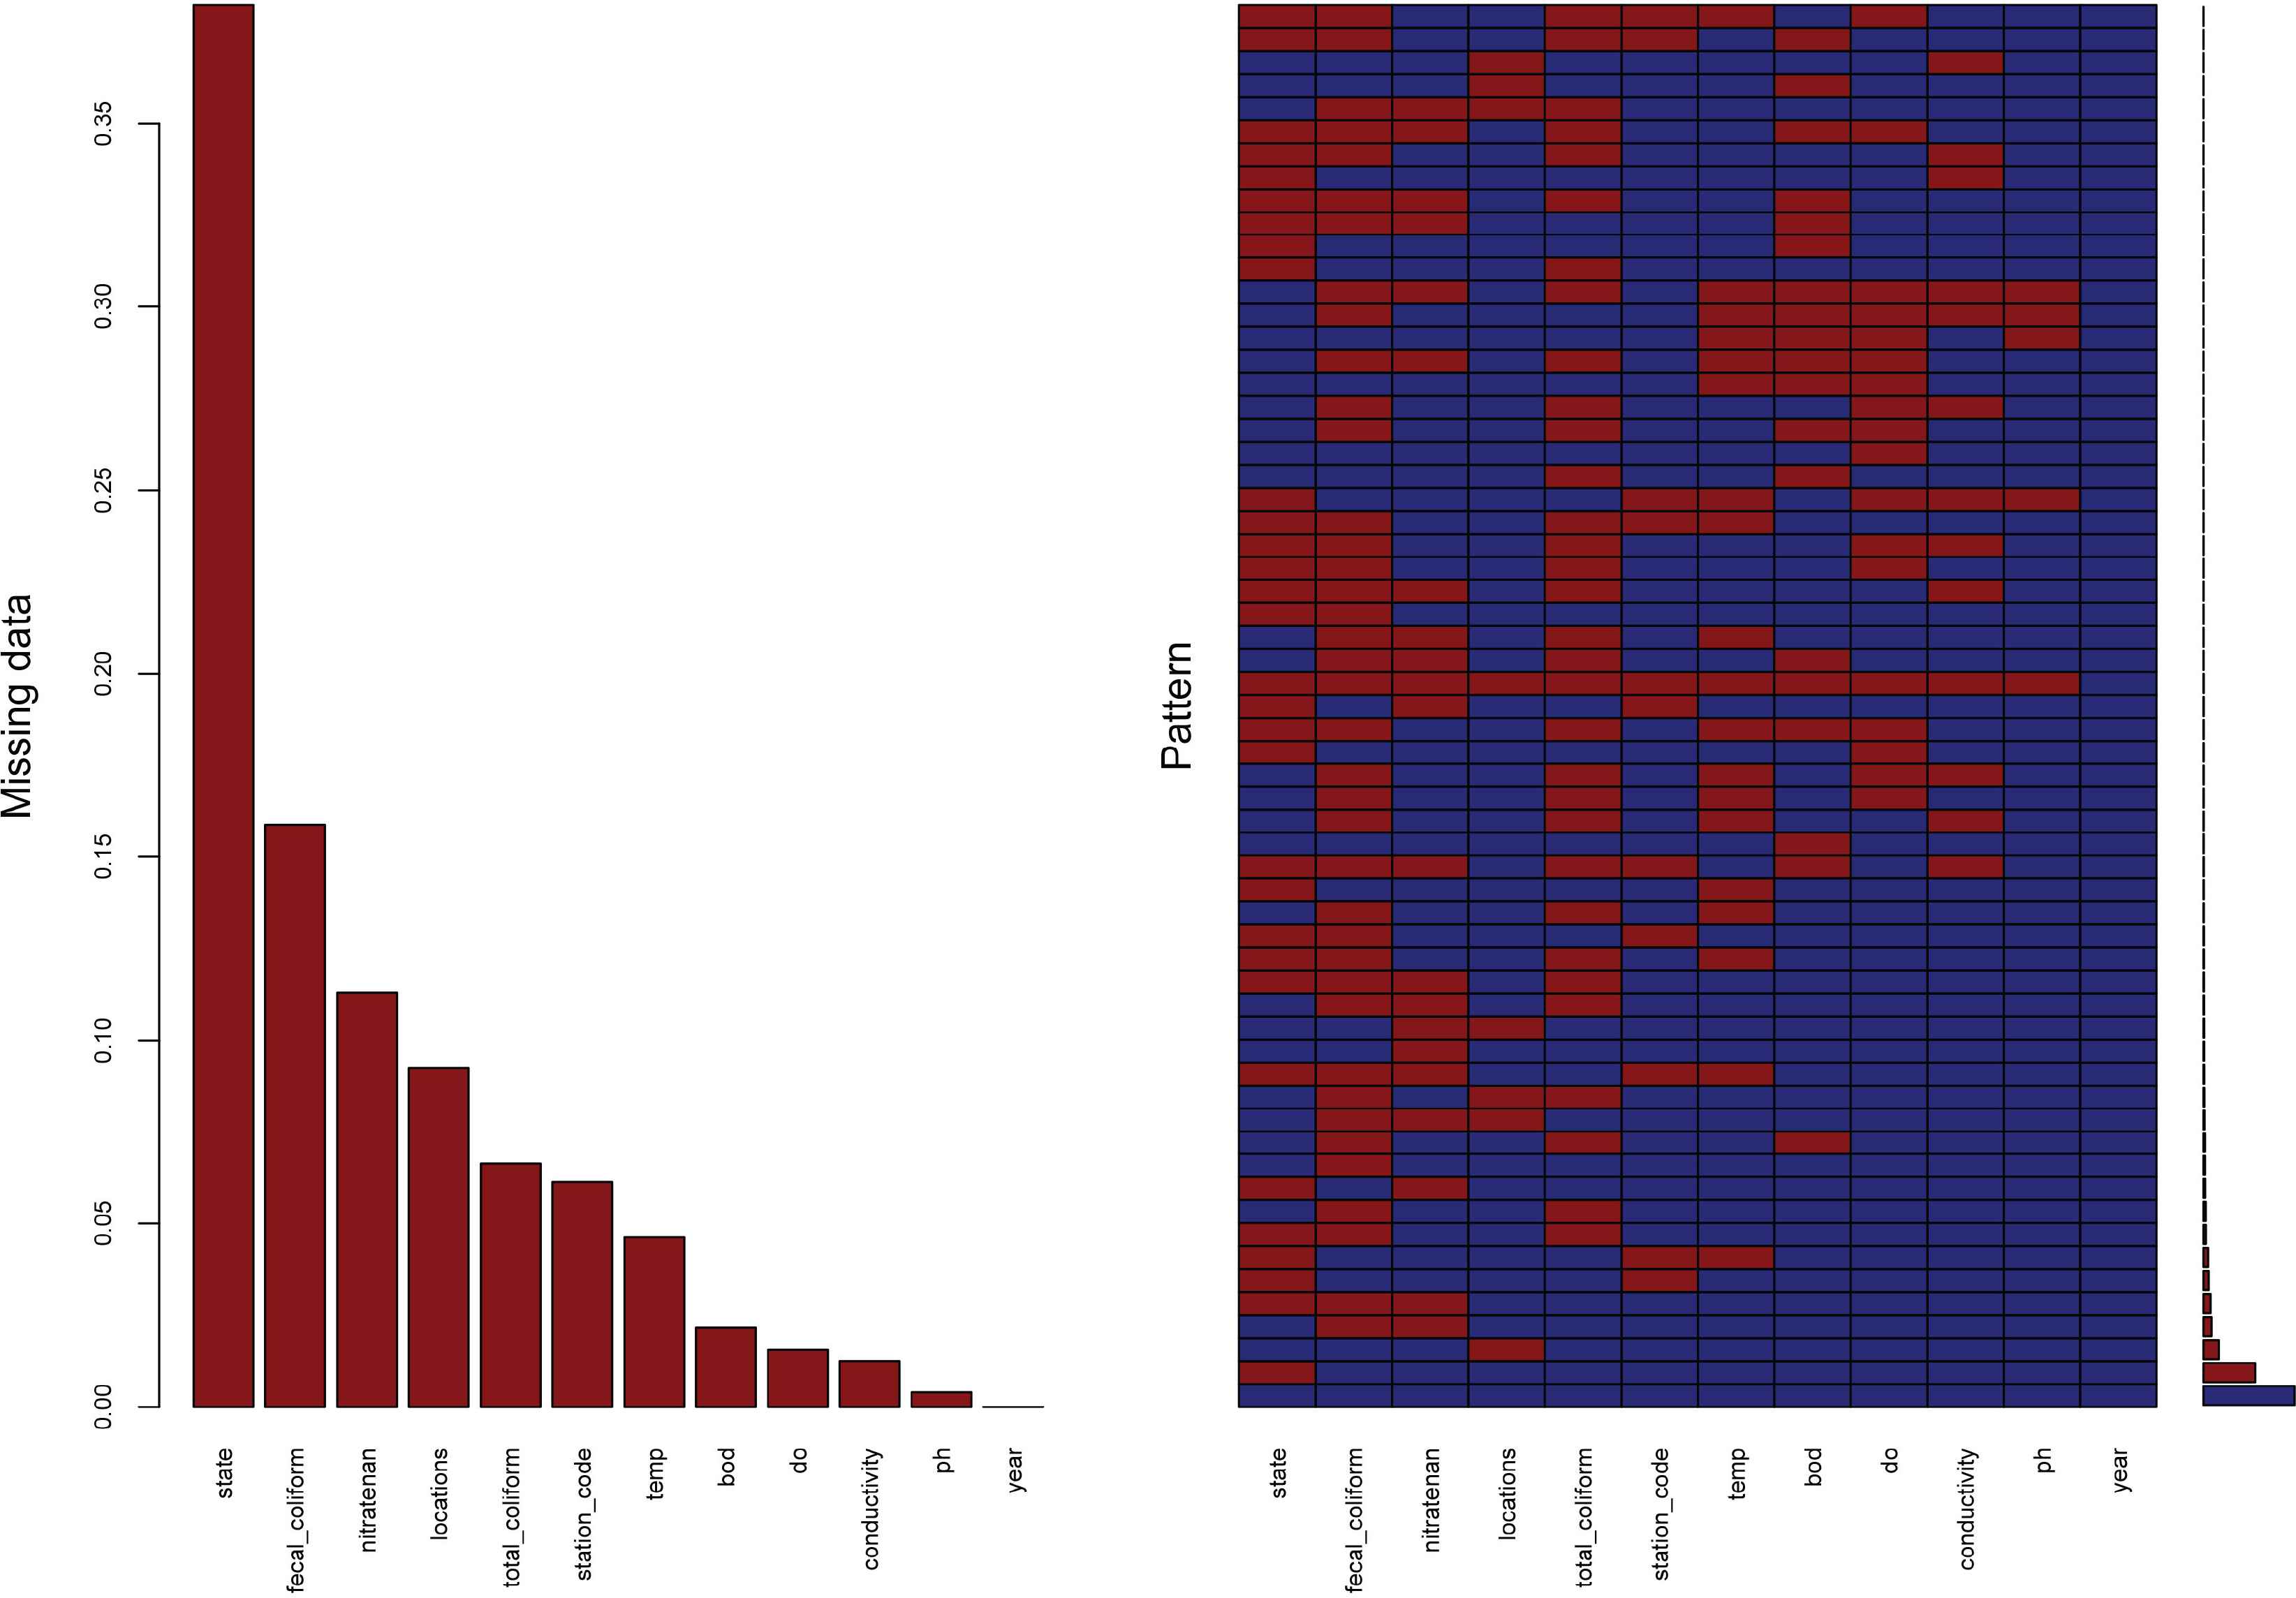
Plot of missing value of dataset.
3.2.2. Feature scaling by min-max normalization
Min-max normalization technique for scaling the feature in the [0,1] range with applying the Equation 1.
3.3. Data Splitting
The dataset was alienated into two portions: a training set and a test set. The training dataset comprised 80% of the entire data, whereas the test set contained 20% of the total data. The ML develops a relationship with the independent and dependent parameters in order to predict or pick an alternative, and then the test data is utilized to assess whether the machine learning technique is effective.
3.4. Data Distribution
In this work, the data distribution is shown in Figure 3 of these six features. All the features data has distributed differently with missing value and without missing value.
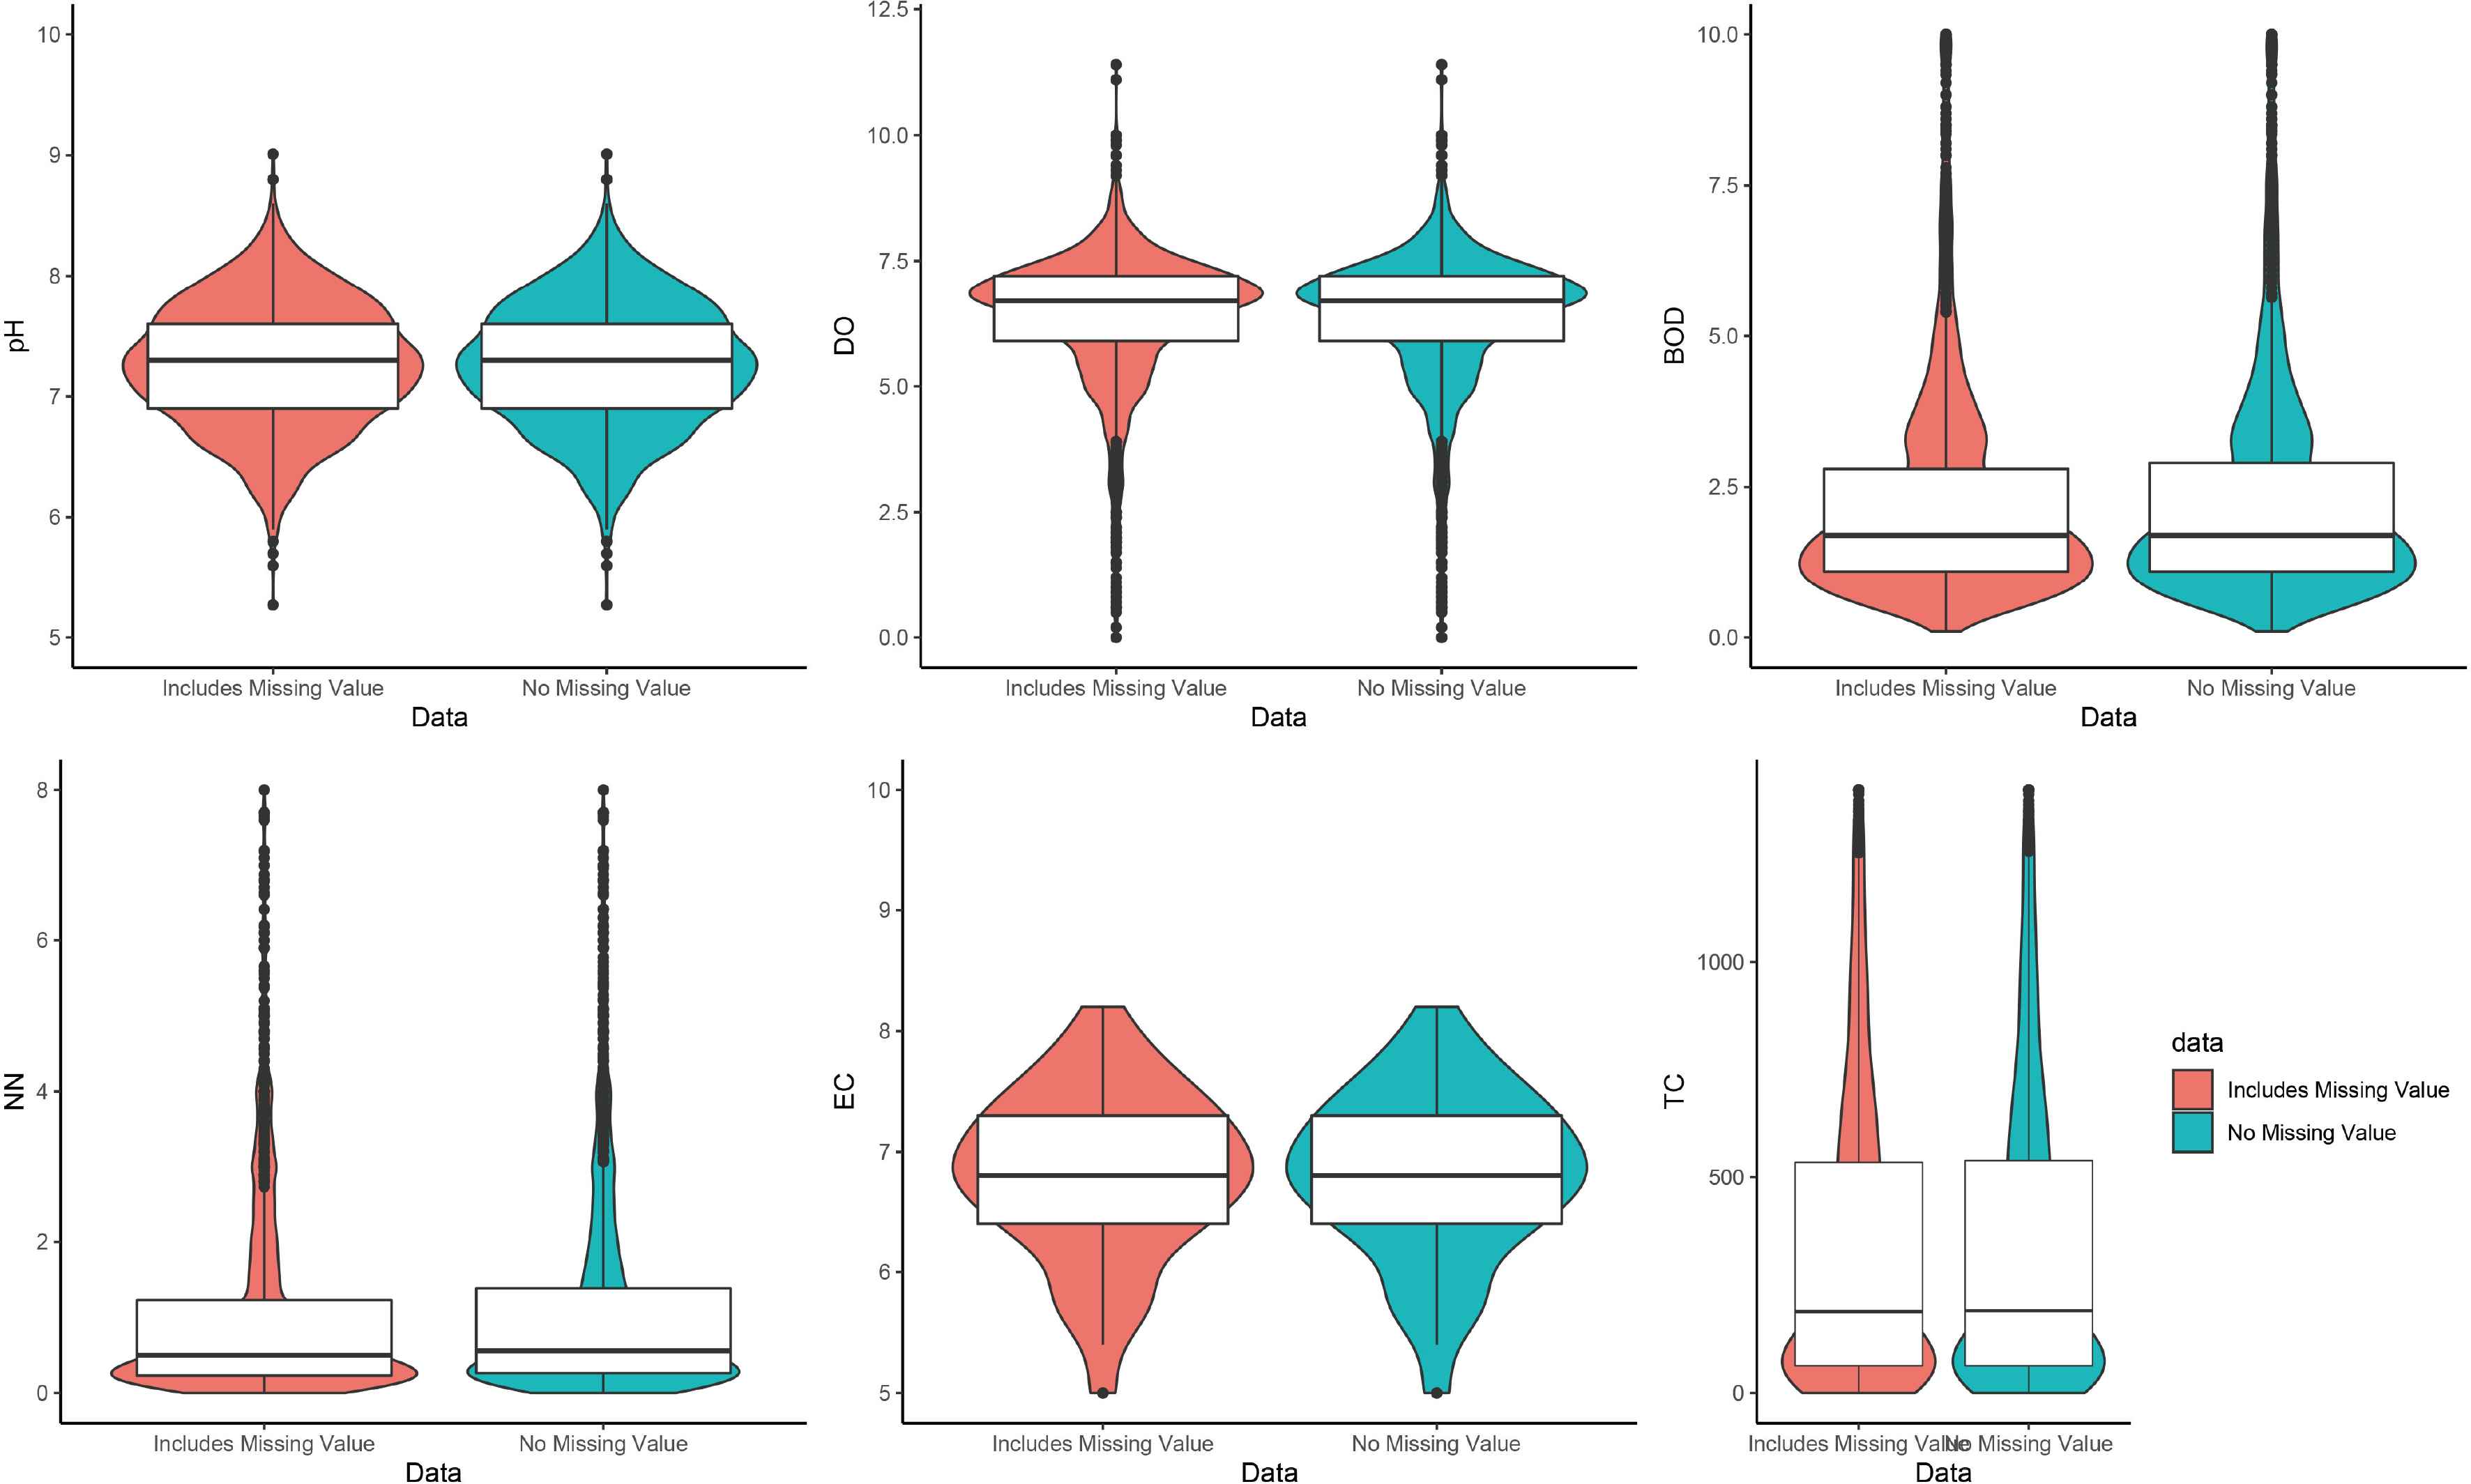
Distribution of dataset.
3.5. Feature Correlation
A correlation matrix is just a table that shows the correlation coefficients for various features. The matrix represents all potential value pairs in a table. It can also be useful for detecting and presenting trends. Figure 4 illustrates the correlation matrix of the characteristics in this dataset. In this Figure 4 BOD is positively correlated between nitrate and total coliform and the value is +0.2 and DO and BOD is negatively correlated with −0.3 value.
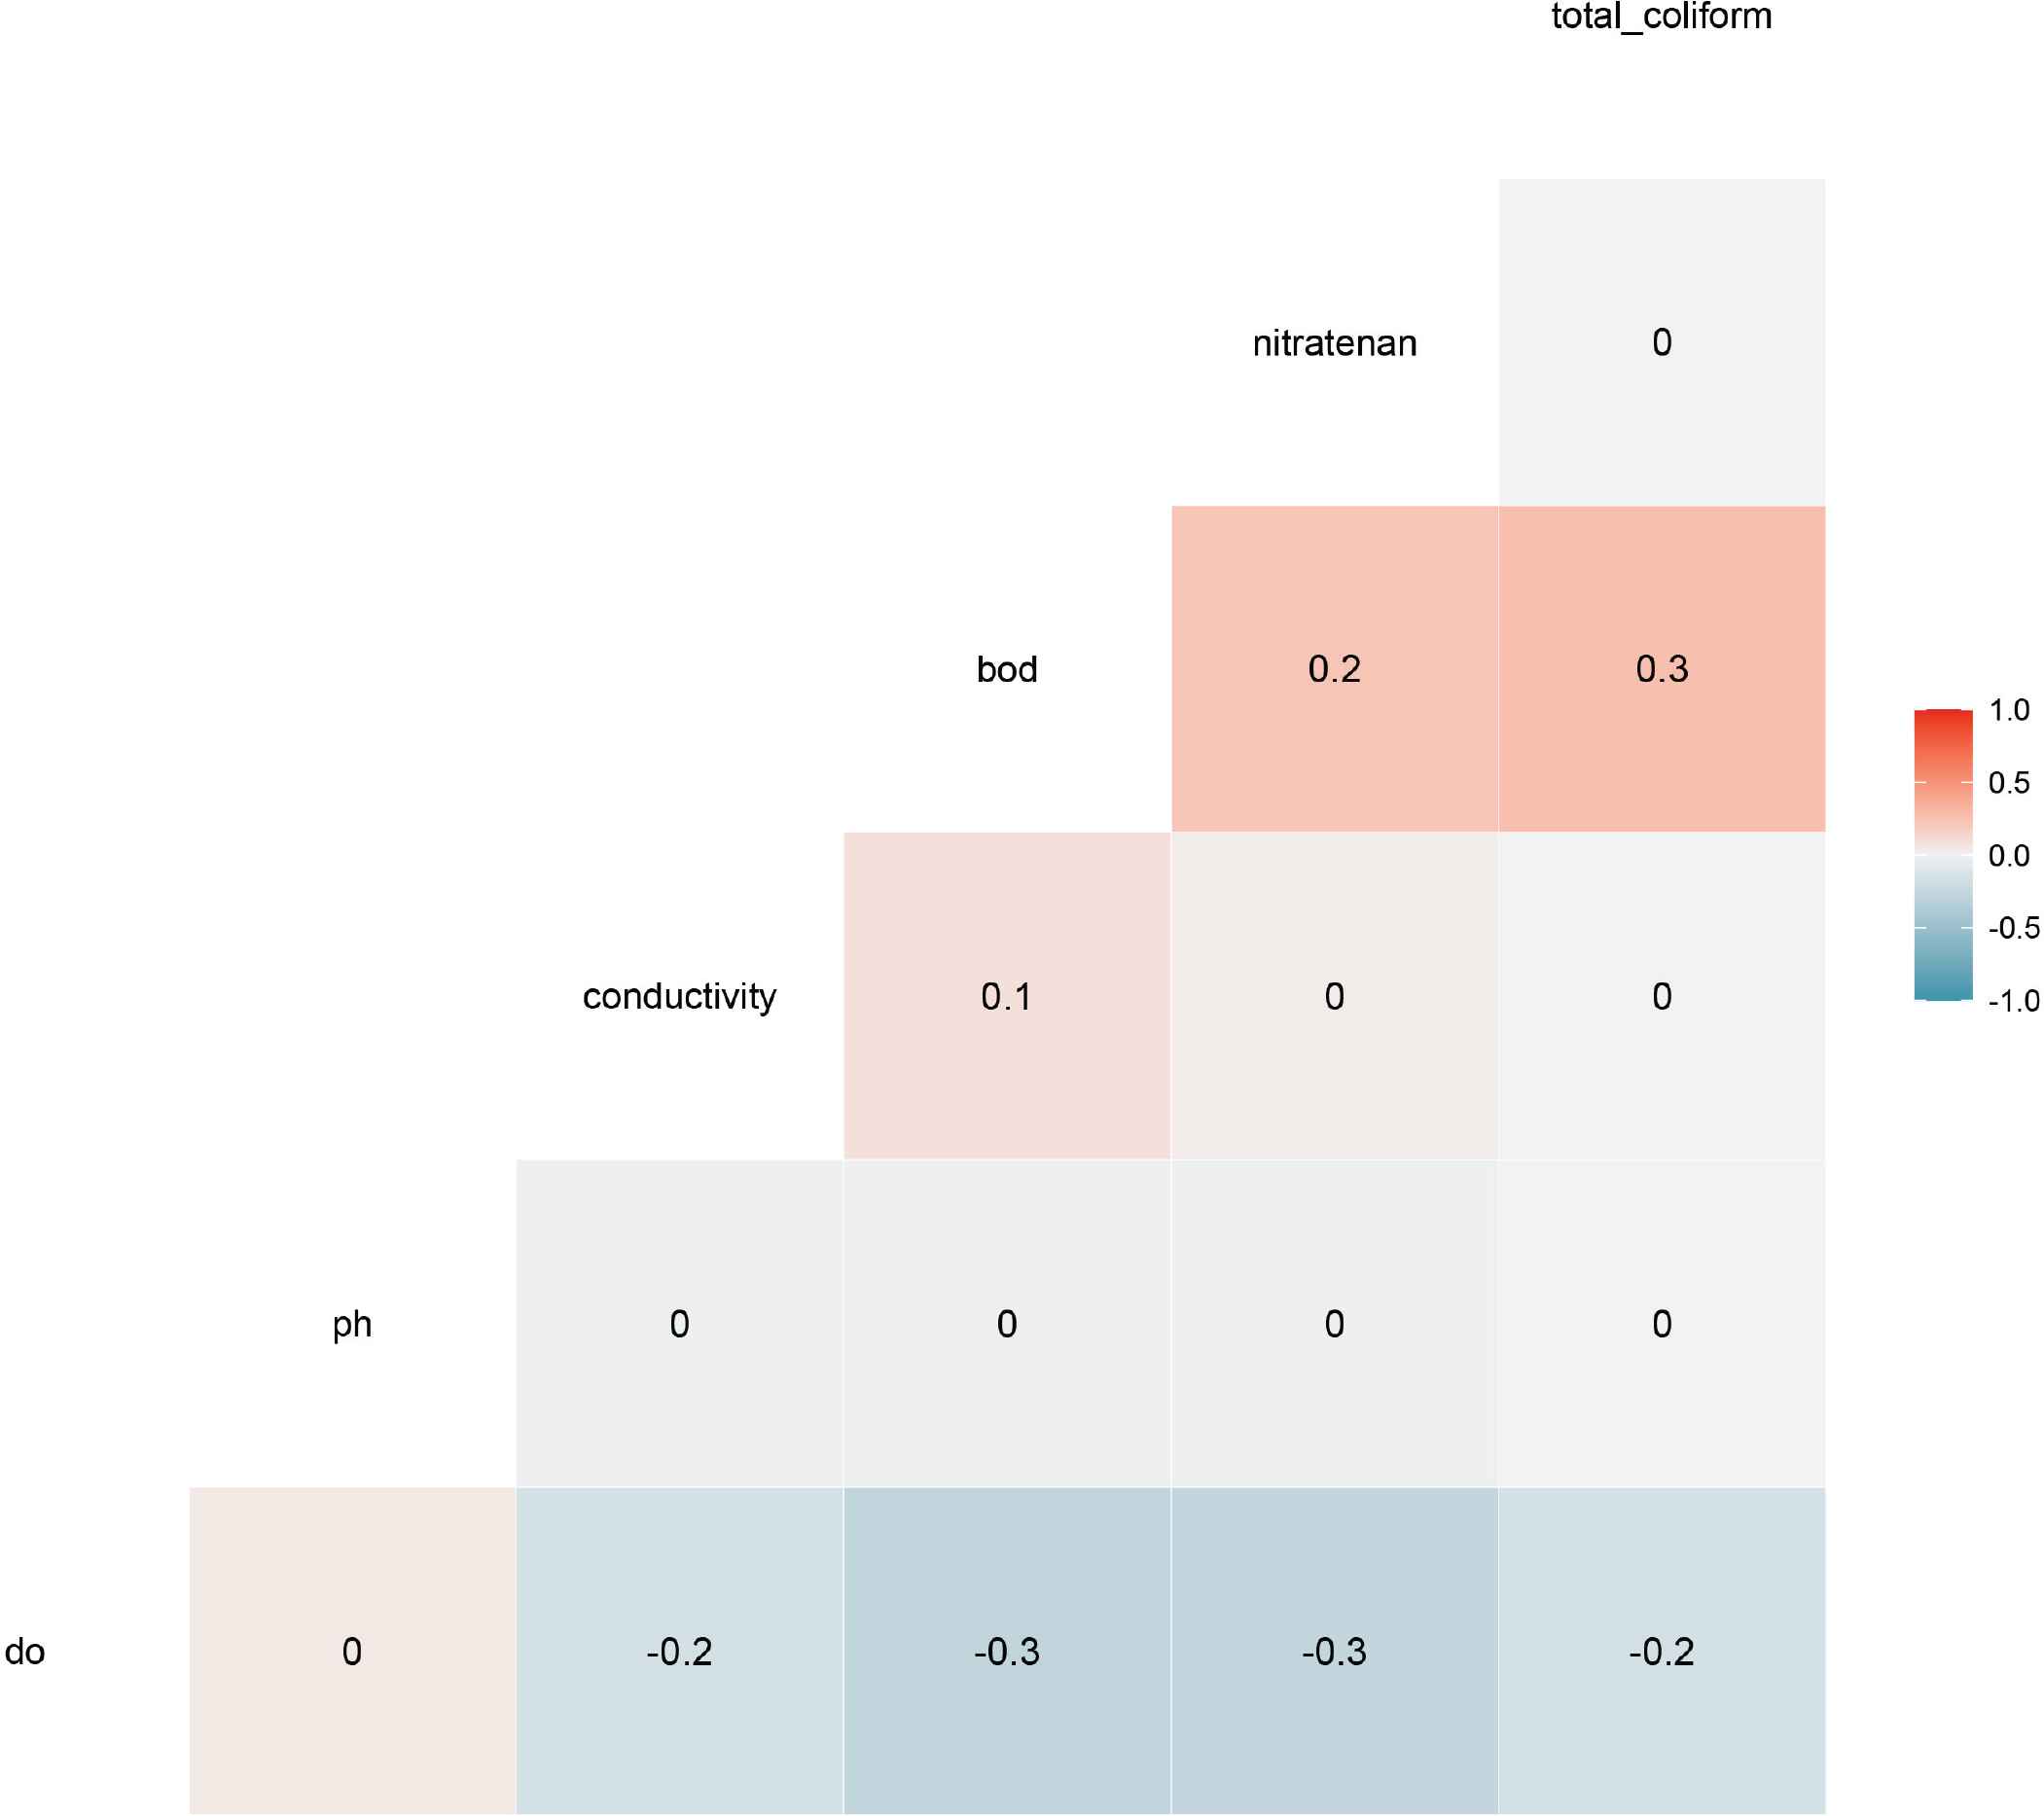
Feature correlation with missing value.
3.6. Water Quality Index Calculation
WQI is utilized to work out water quality using a few attributes that significantly affect WQ [3]. The WQI was processed utilizing the Equation 2.
| Features name | Unit weight |
|---|---|
| PH | 0.16 |
| DO | 0.28 |
| TC | 0.28 |
| BOD | 0.23 |
| EC | 0.09 |
| NNC | 0.03 |
Features unit weight
| WQ index rate | Classification |
|---|---|
| 0–50 | Good |
| 51–100 | Poor |
| More than 100 | Unsuitable for drinking |
Classification of water quality
Table 2 shows the unit weight values for each parameter. The values are 0.16, 0.28, 0.28, 0.23, 0.09 and 0.028 of PH, DO, TC, BOD, EC and NNC respectively. When all the value are putting on Equation (2) then we can get the WQI value and classify the water quality by getting different WQI.
In this work we have classified three types of water quality, which are good, poor, and unsuitable for drinking. When the water quality index rate is 0–50 then it is good, when it is 51–100 then it is poor and when it is more than 100 then it is unsuitable for drinking.
Figure 5 illustrates the feature correlation matrix of the characteristics in this dataset after pre-processed the dataset. Here, this figure shows that the TC and DO is positively correlated with WQI and the value is +0.7 and EC is negatively correlated with PH and −0.3 value.
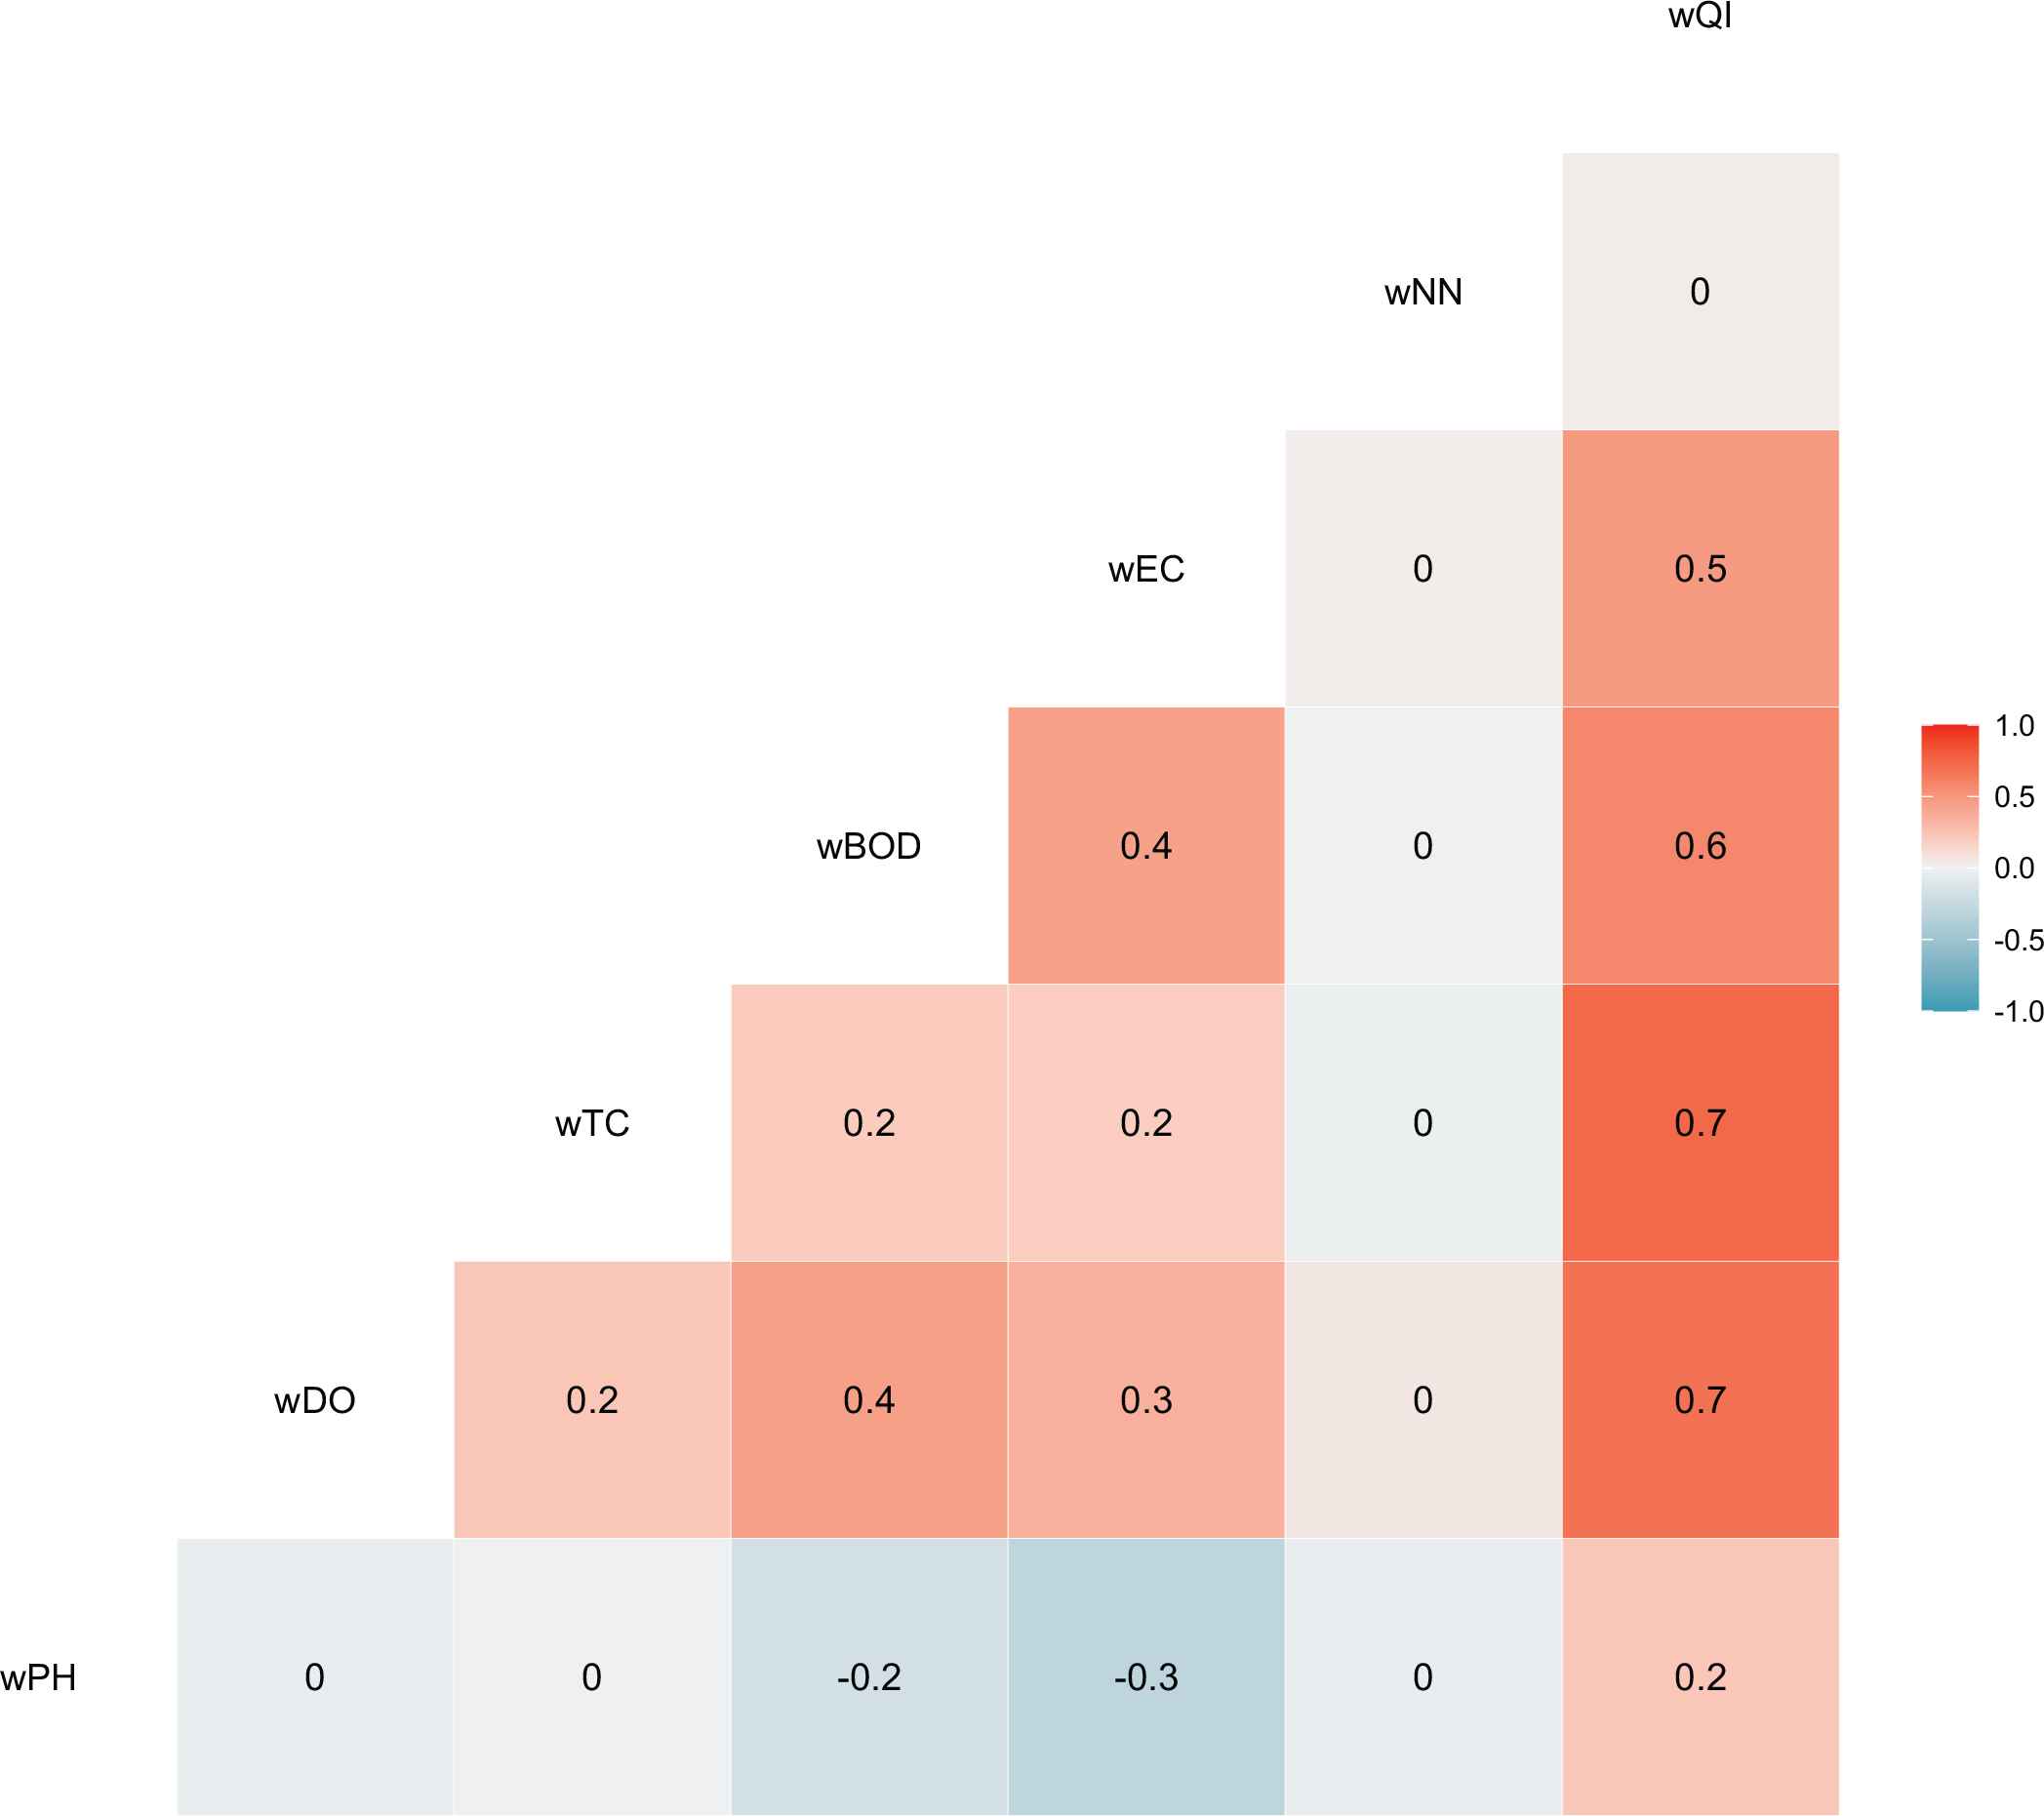
Feature correlation after groupping dataset.
4. APPLYING MACHINE LEARNING MODEL FOR PREDICTING WQI
To achieve this goal, the water quality index was estimated using the machine learning methods Random Forest, Neural Network, Multinomial Logistic Regression, Bagged Tree Model, and Support Vector Machine.
4.1. Random Forest
An ensemble learning approach for regression, classification, and other complications that works by training a large number of DT. It builds decision trees from samples and uses majority voting for classification and regression. Because random forests work with subsets of data, they are faster than decision trees. So, we can easily solve hundreds of features without any complication [16]. Figure 6 depicts the random forest algorithm’s flow.
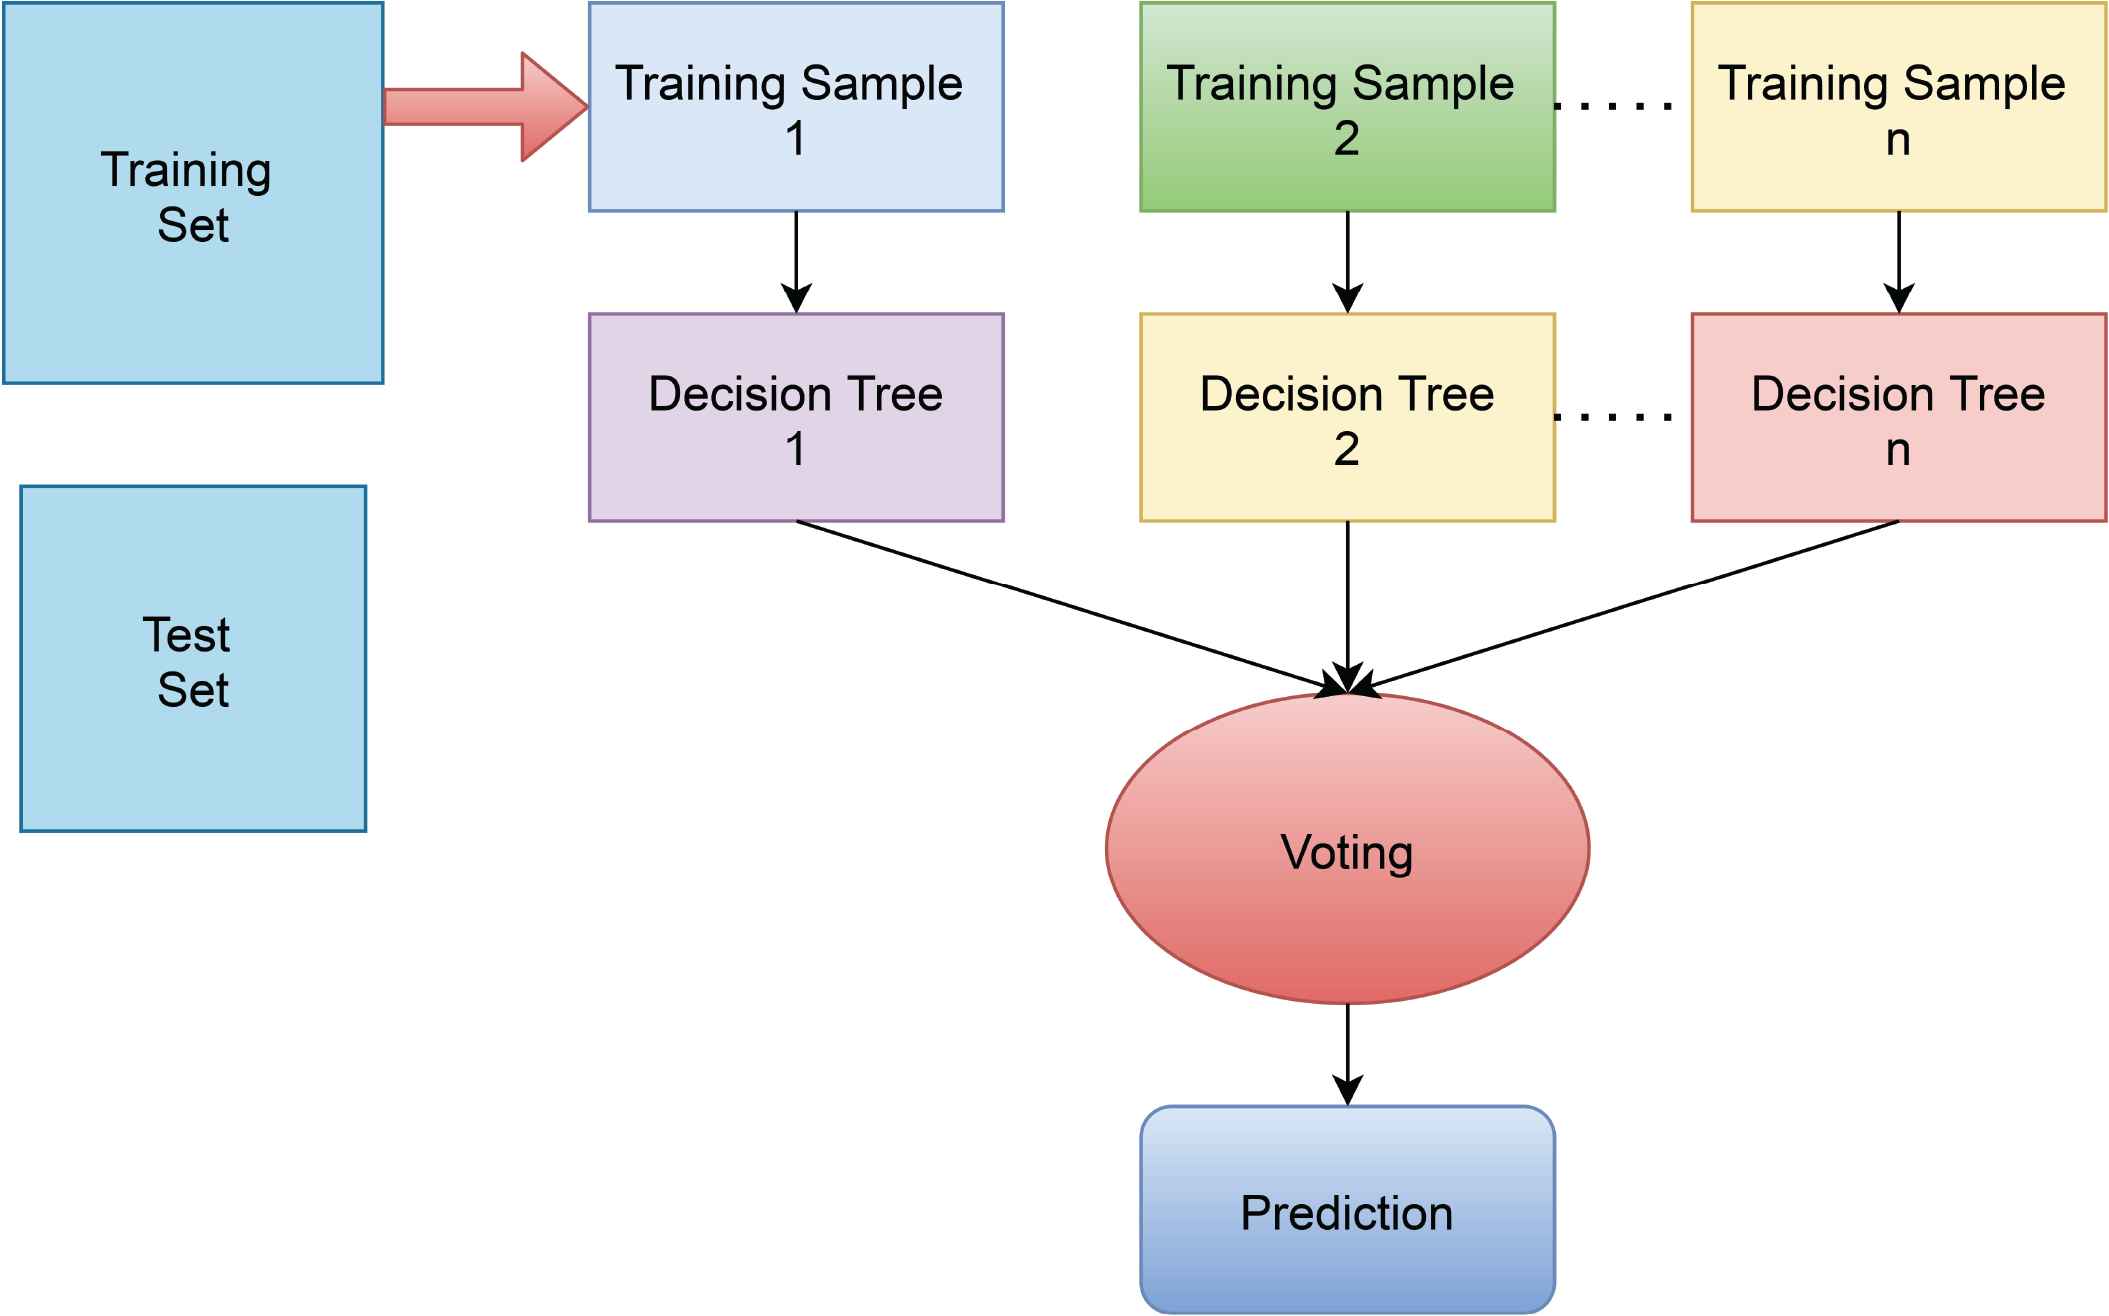
Working procedure of random forest.
The RF selects the dividing characteristics semi-randomly as well. The potential dividing features space is used to generate a random subset of a given proportion. Ganga et al. [17] utilized RF to anticipate the WQ in the Kadapa district of Andhra Pradesh, where 70% of the data was being used for training and 30% of the data was also used as test data for identification. This model has a 6.25% error rate and a 93.75% accuracy by categorizing the provided areas into 3 classifications: Excellent, Good, and Poor for drinking purposes.
4.2. Neural Network
A neural network (NN) is a set of algorithms that try to find hidden relationships in data by mimicking the way the human brain works. Machine Learning experiments and the industry have become very popular since ANNs made breakthroughs in speech recognition, computer vision, and text processing [18].
The output of neuron Y has denoted in Equation 6.
4.3. Multinomial Logistic Regression
Use of MLR to evaluate categorical data in various fields, including health, social, and academic. A response variable was then predicted using integrated or categorical explanatory variables. That is, it measures the rate of relative significance of independents, assesses interrelationships, and helps understand the effect of correlation control variables [20]. In this study, we wanted to know how modifications influenced the explanatory variables on the probability of the variable (infrastructure choice) [17] in Equation (1), which is represented as
Figure 7 depicts the neural network algorithm’s working flow. Ahmed et al. [4] have explored a number of monitored machine learning approaches to quantify WQI and WQC where they have used the MLR algorithm with an accuracy of 84.01% and precision of 55.20%. Their suggested method achieves genuine accuracy while utilizing a minimum number of variables, thus confirming its applicability for implementation in real-time water quality measurement systems.
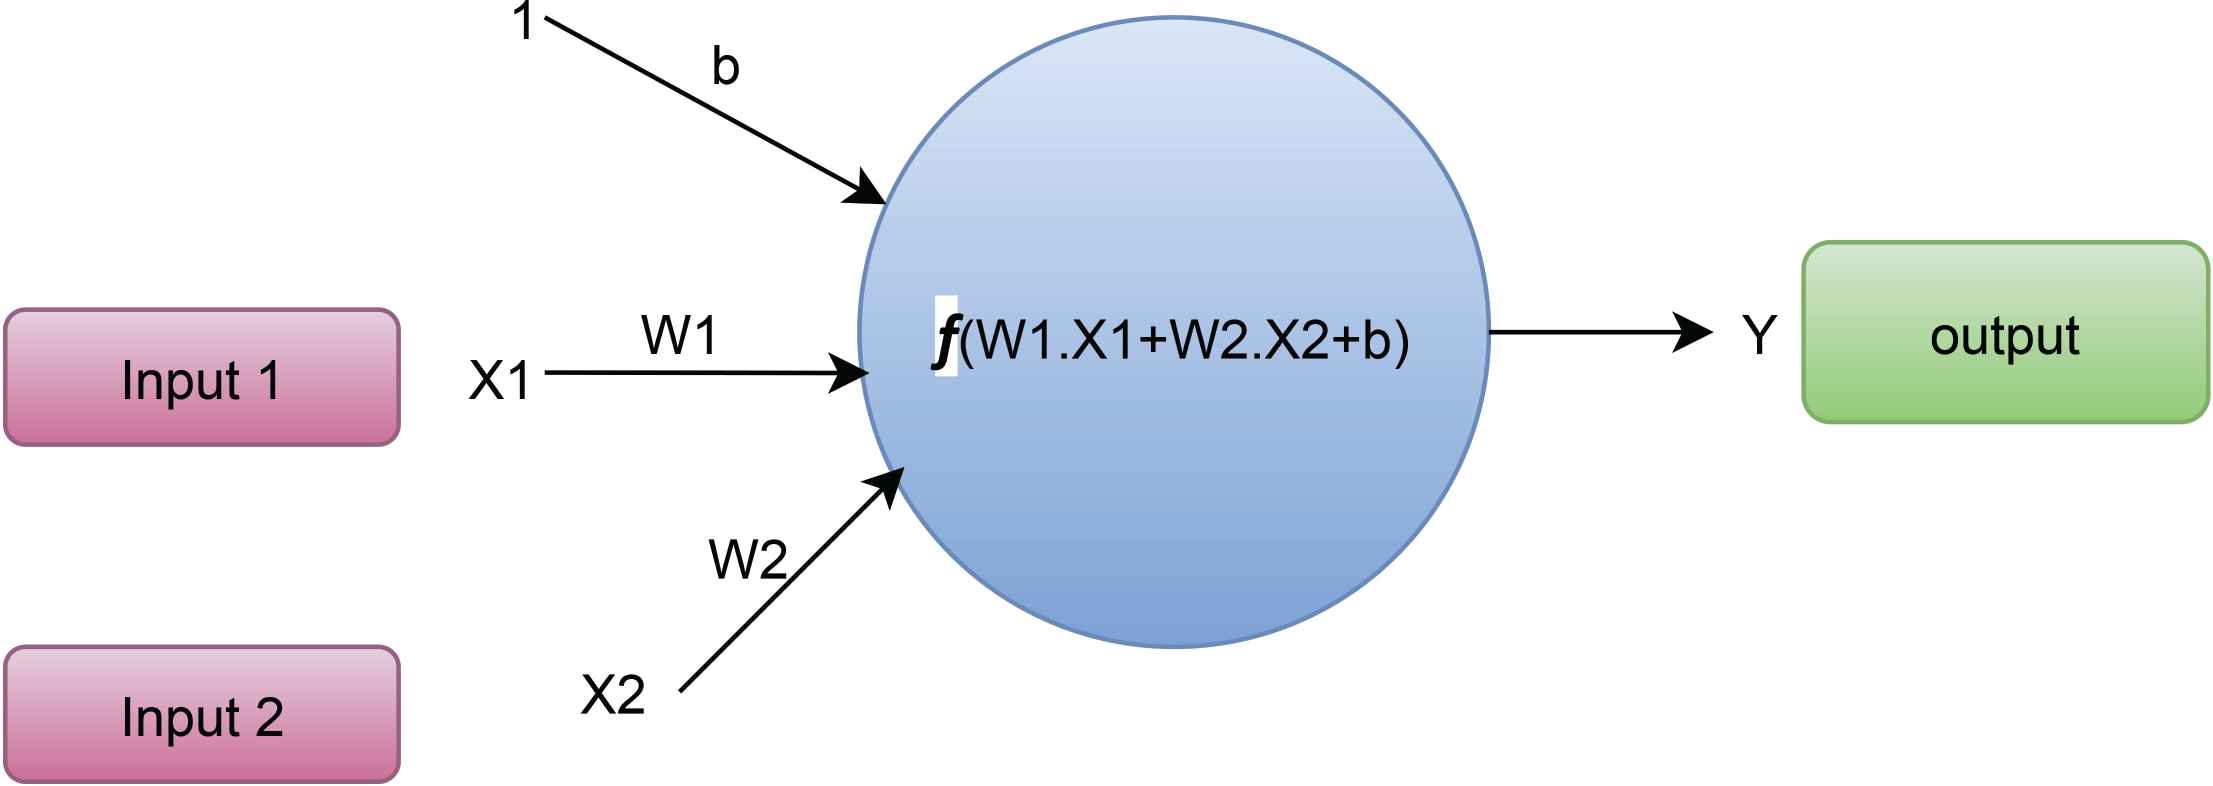
Working procedure of neural network.
4.4. Bagged Tree Model
Bagging is an ML ensemble meta-algorithm for improving the accuracy and stability of ML techniques used in statistical classification and regression. Bagging is a model averaging subset [21]. Mosavi et al. [21] have introduced a paper to make available information based on the results of four ensemble models: GamBoost, AdaBoost, and Bagged Random forest, as well as Bagged CART are a type of classification and regression tree that has been bagged (RF). With an accuracy of 0.86, kappa 0.85, precision 0.85, recall 0.91 the RF model outscored the other models. Maps of groundwater potential, as stated in this piece, can assist water resource policymakers and managers in the public sector domain management of watersheds and aquifers in preserving the best possible use of this essential freshwater resource.
4.5. Support Vector Machine
SVM is a supervised ML technique that can be used for classification and regression. But it’s usually used to solve classification issues. Each data point in n-dimensional space is shown separately, and the two classes can be easily distinguished as follows:
In this Equation 8, x2 tends to the Y axis and x1 tends to X axis. SVMs are gaining popularity in technology, pattern recognition, and learning categorization. The input area can be classified by creating a linear or non-linear separation surface. The separation function in support vector classification is a linear combination of kernels linked to the support vector.
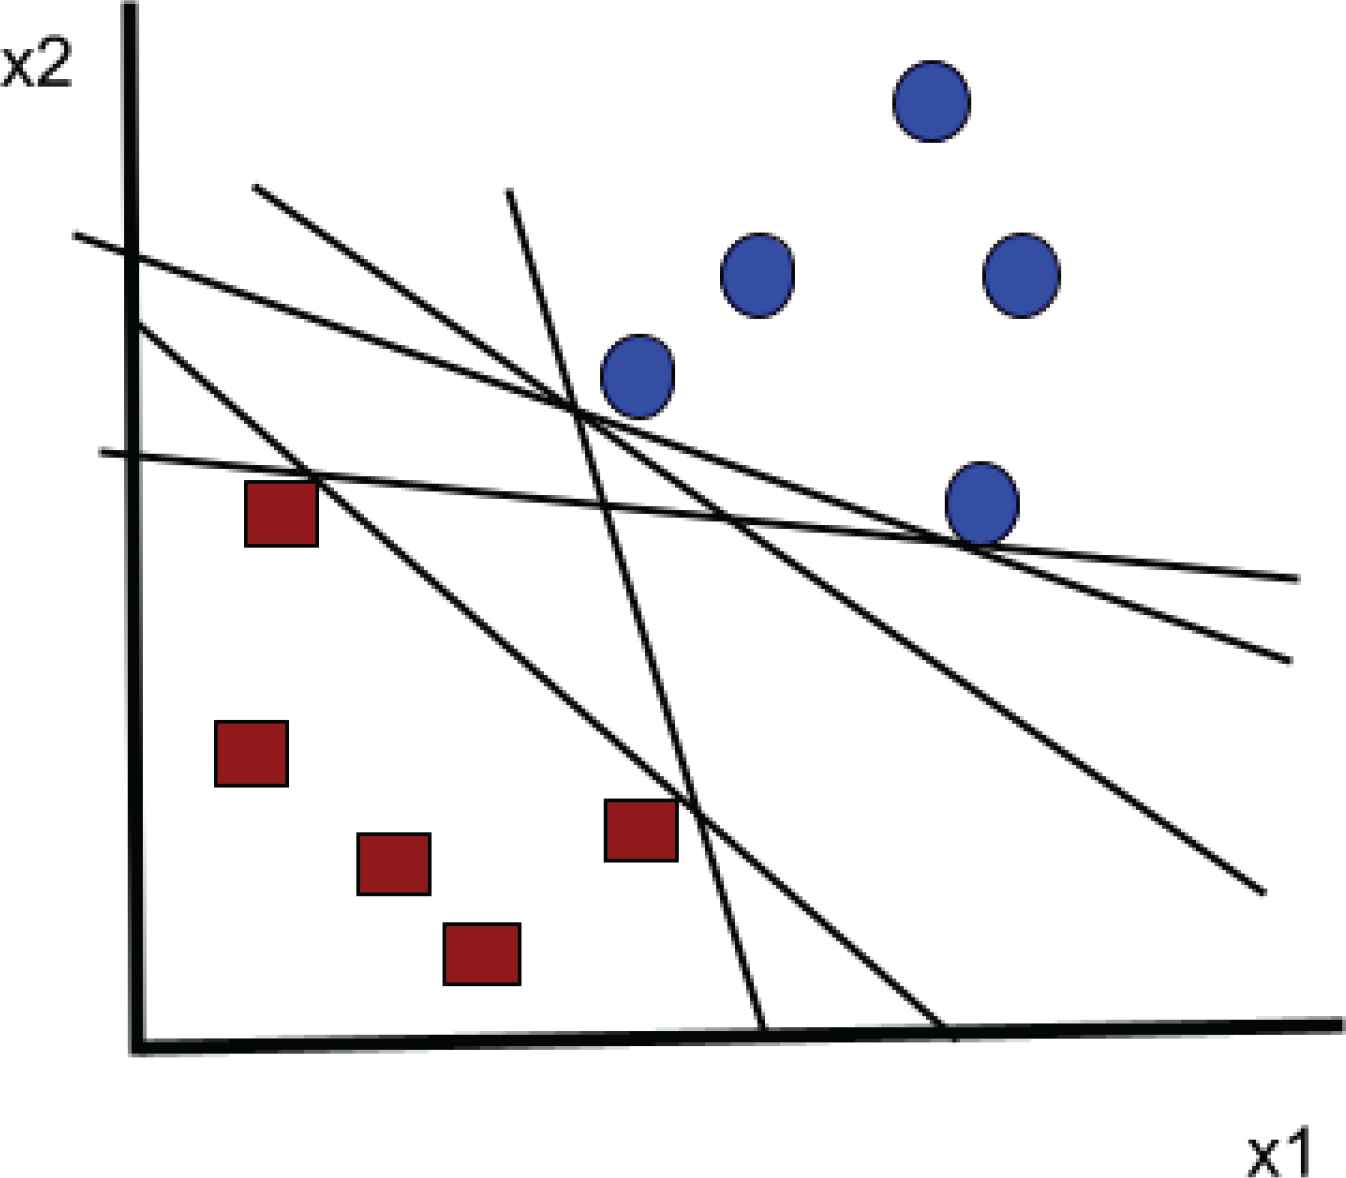
The support vector machine’s operation.
5. OUR PROPOSED APPLICATION
Based on our research, a viable application for predicting water quality using real-time water data has been presented. Specifically, based on our findings, this application may be built on the best model for forecasting water quality. To improve model performance even further, user data will be kept in a database. This application’s entire procedure is demonstrated to Figure 9.
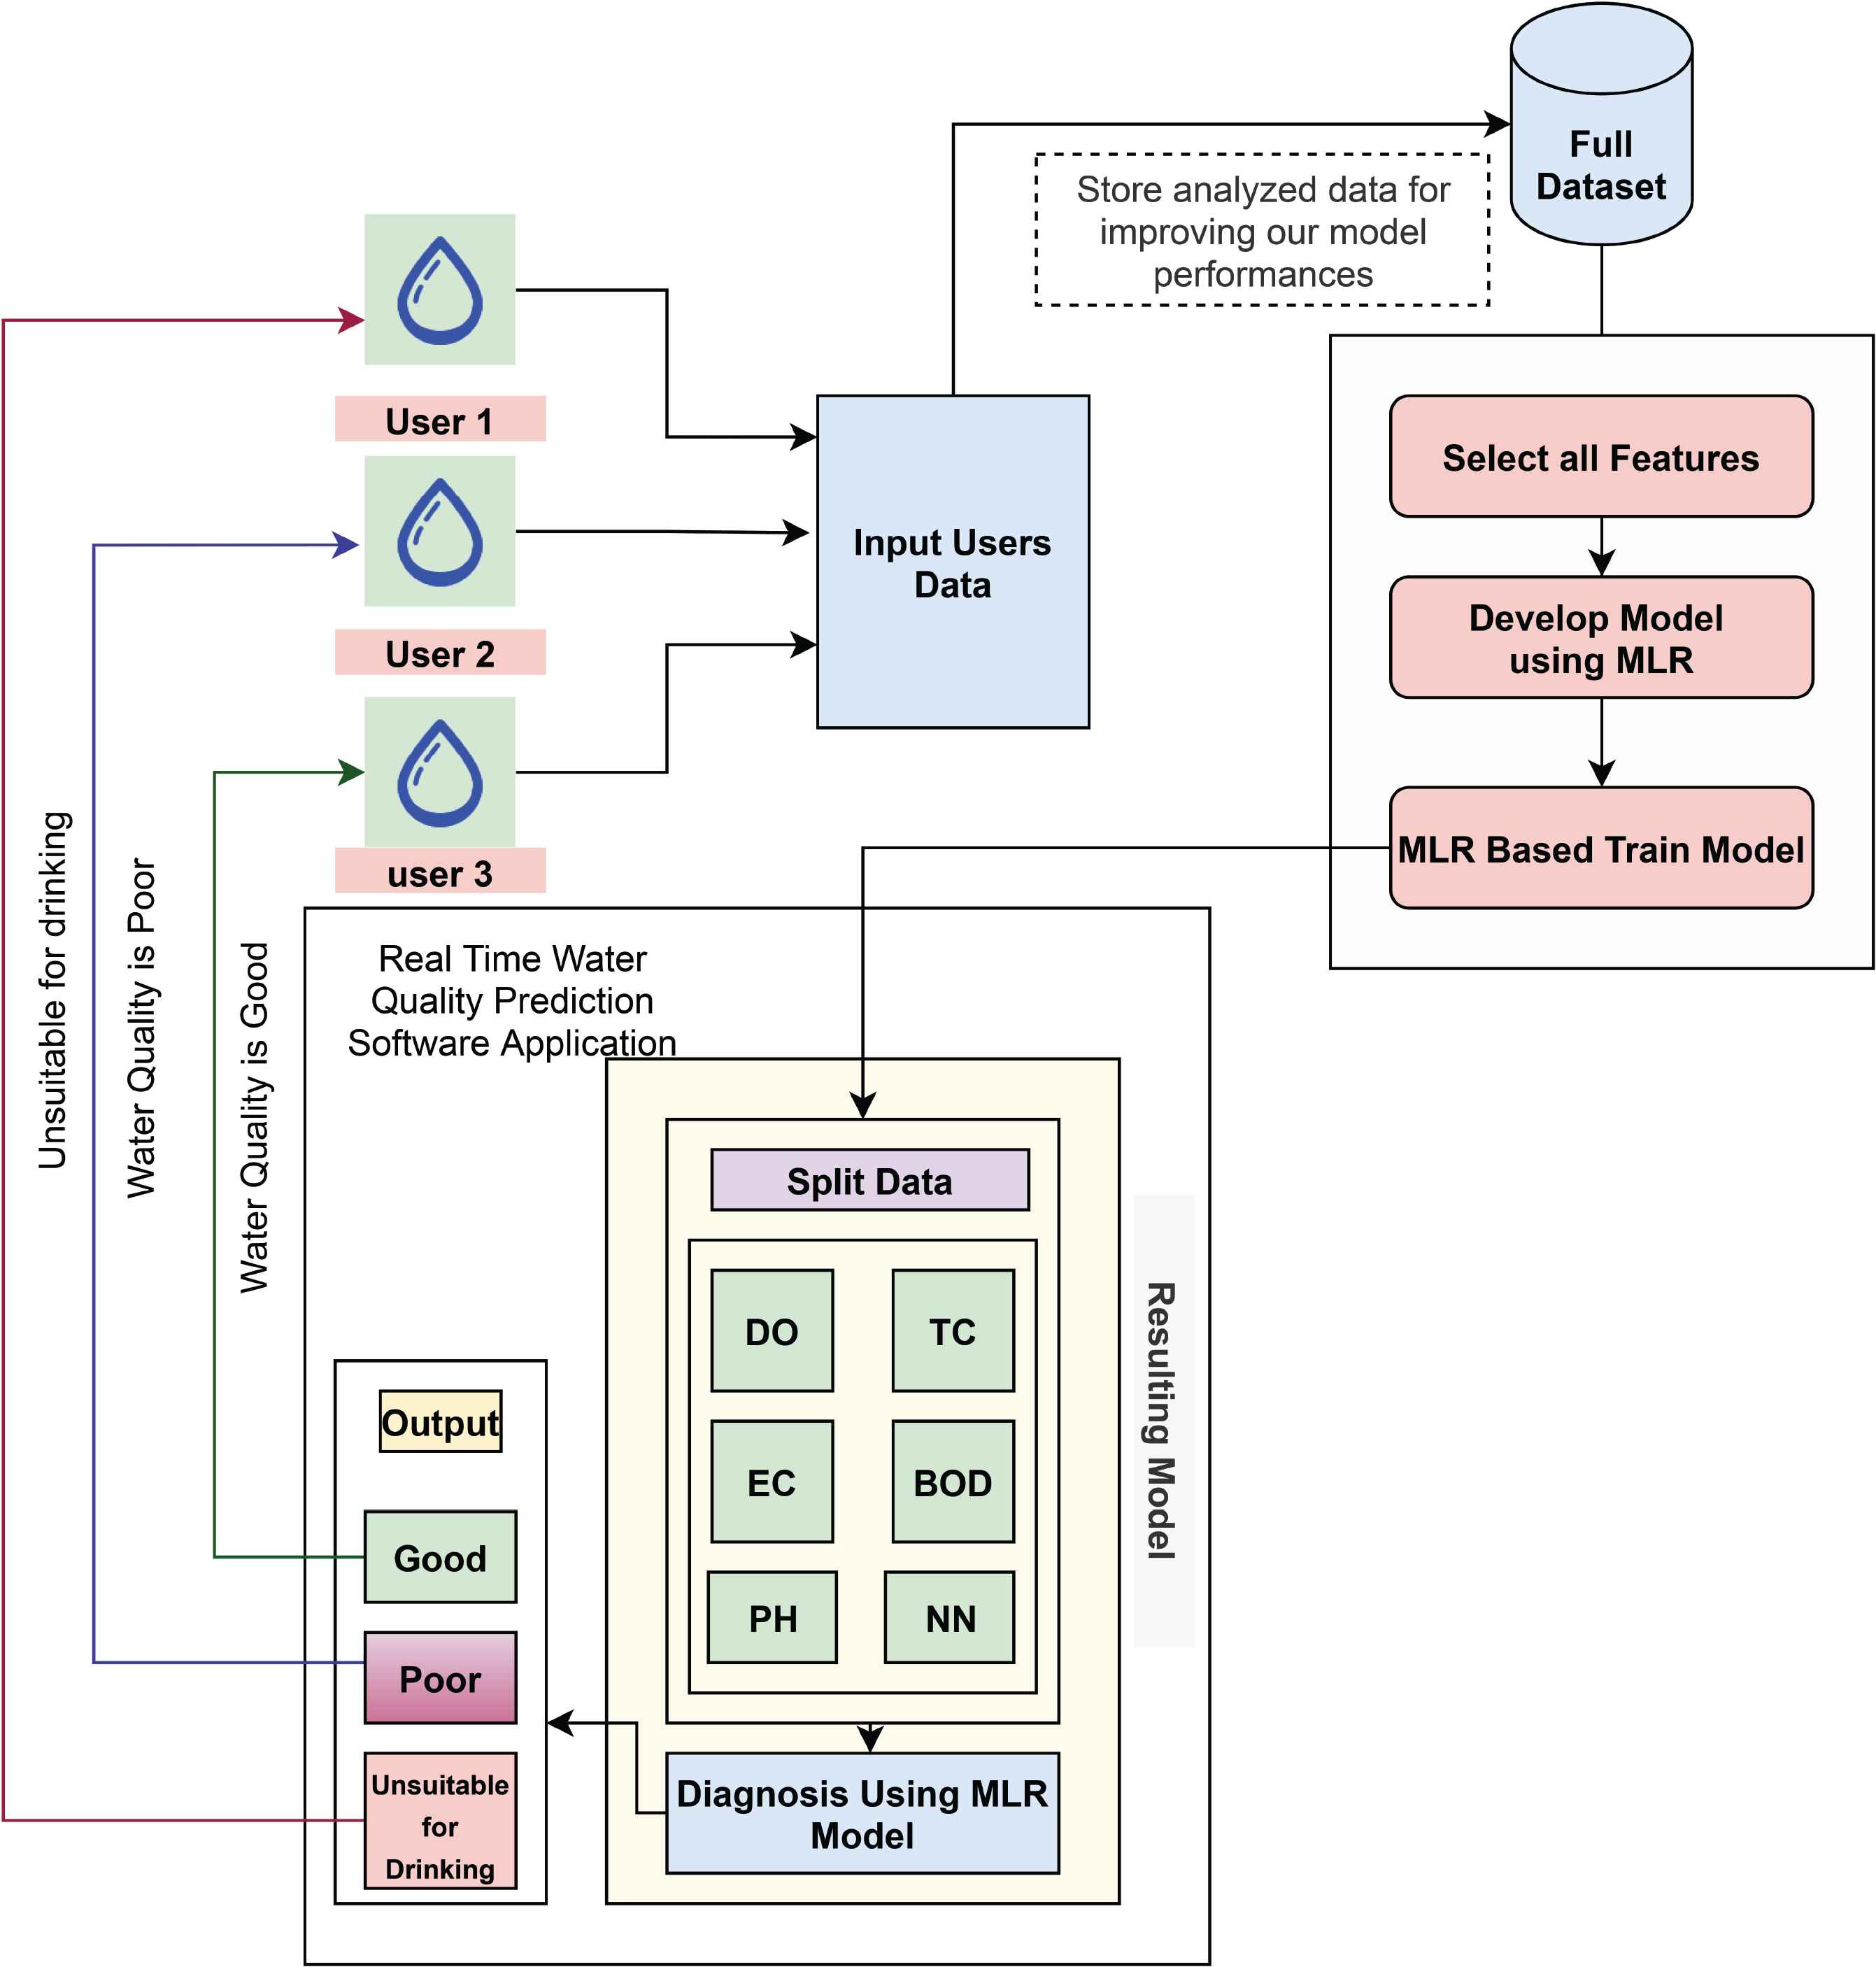
Suitable application for proposed model.
6. RESULTS AND DISCUSSION
6.1. Performance of Classification Models
We have applied numerous algorithms for developing our classification model based on our dataset [y]. Using five classifiers, we have utilized Neural Network (NN), RF, MLR, SVM, and Bagged Tree Model (BT). Various levels of accuracy with the kappa values have been achieved by the classifiers we have examined for our classification. We have applied each of the classifiers mentioned before to our dataset and after applying those algorithms, we have achieved the highest accuracy, the lower accuracy and have found out the average accuracy by utilizing those algorithms. Among the RF, NN, MLR, BTm, and SVM models, MLR has the highest accuracy at 99.83%, while SVM has the lowest accuracy at 96.98%. The highest kappa value has also been obtained through the MLR model with the value of 99.17% and the lower kappa value was 82.81%, which has also been obtained through SVM (Table 4).
| Model | Accuracy (%) | Kappa (%) | Accuracy lower (%) | Accuracy upper (%) |
|---|---|---|---|---|
| NN | 98.65 | 93.52 | 97.38 | 99.42 |
| RF | 98.99 | 94.86 | 97.83 | 99.63 |
| MLR | 99.83 | 99.17 | 99.07 | 99.99 |
| SVM | 96.98 | 82.81 | 95.28 | 98.20 |
| BT | 98.99 | 94.86 | 97.83 | 97.83 |
Classification of water quality
We have also gotten the highest accuracy and lower accuracy of those different models has been denoted by Accuracy Upper and Accuracy Lower. We have gotten the highest accuracy by Accuracy Upper value in MLR (99.99%) and the lower accuracy by Accuracy Lower value in SVM (95.28%). The second highest accuracy we have obtained through RF with the Accuracy Upper value of 99.63%, average Accuracy value of 98.99% and with the kappa value of 94.86%. So, our discussion shows that The MLR and RF model has given the best performance for our classification. Here, Figure 10. shows the classification model performances of our applied models.
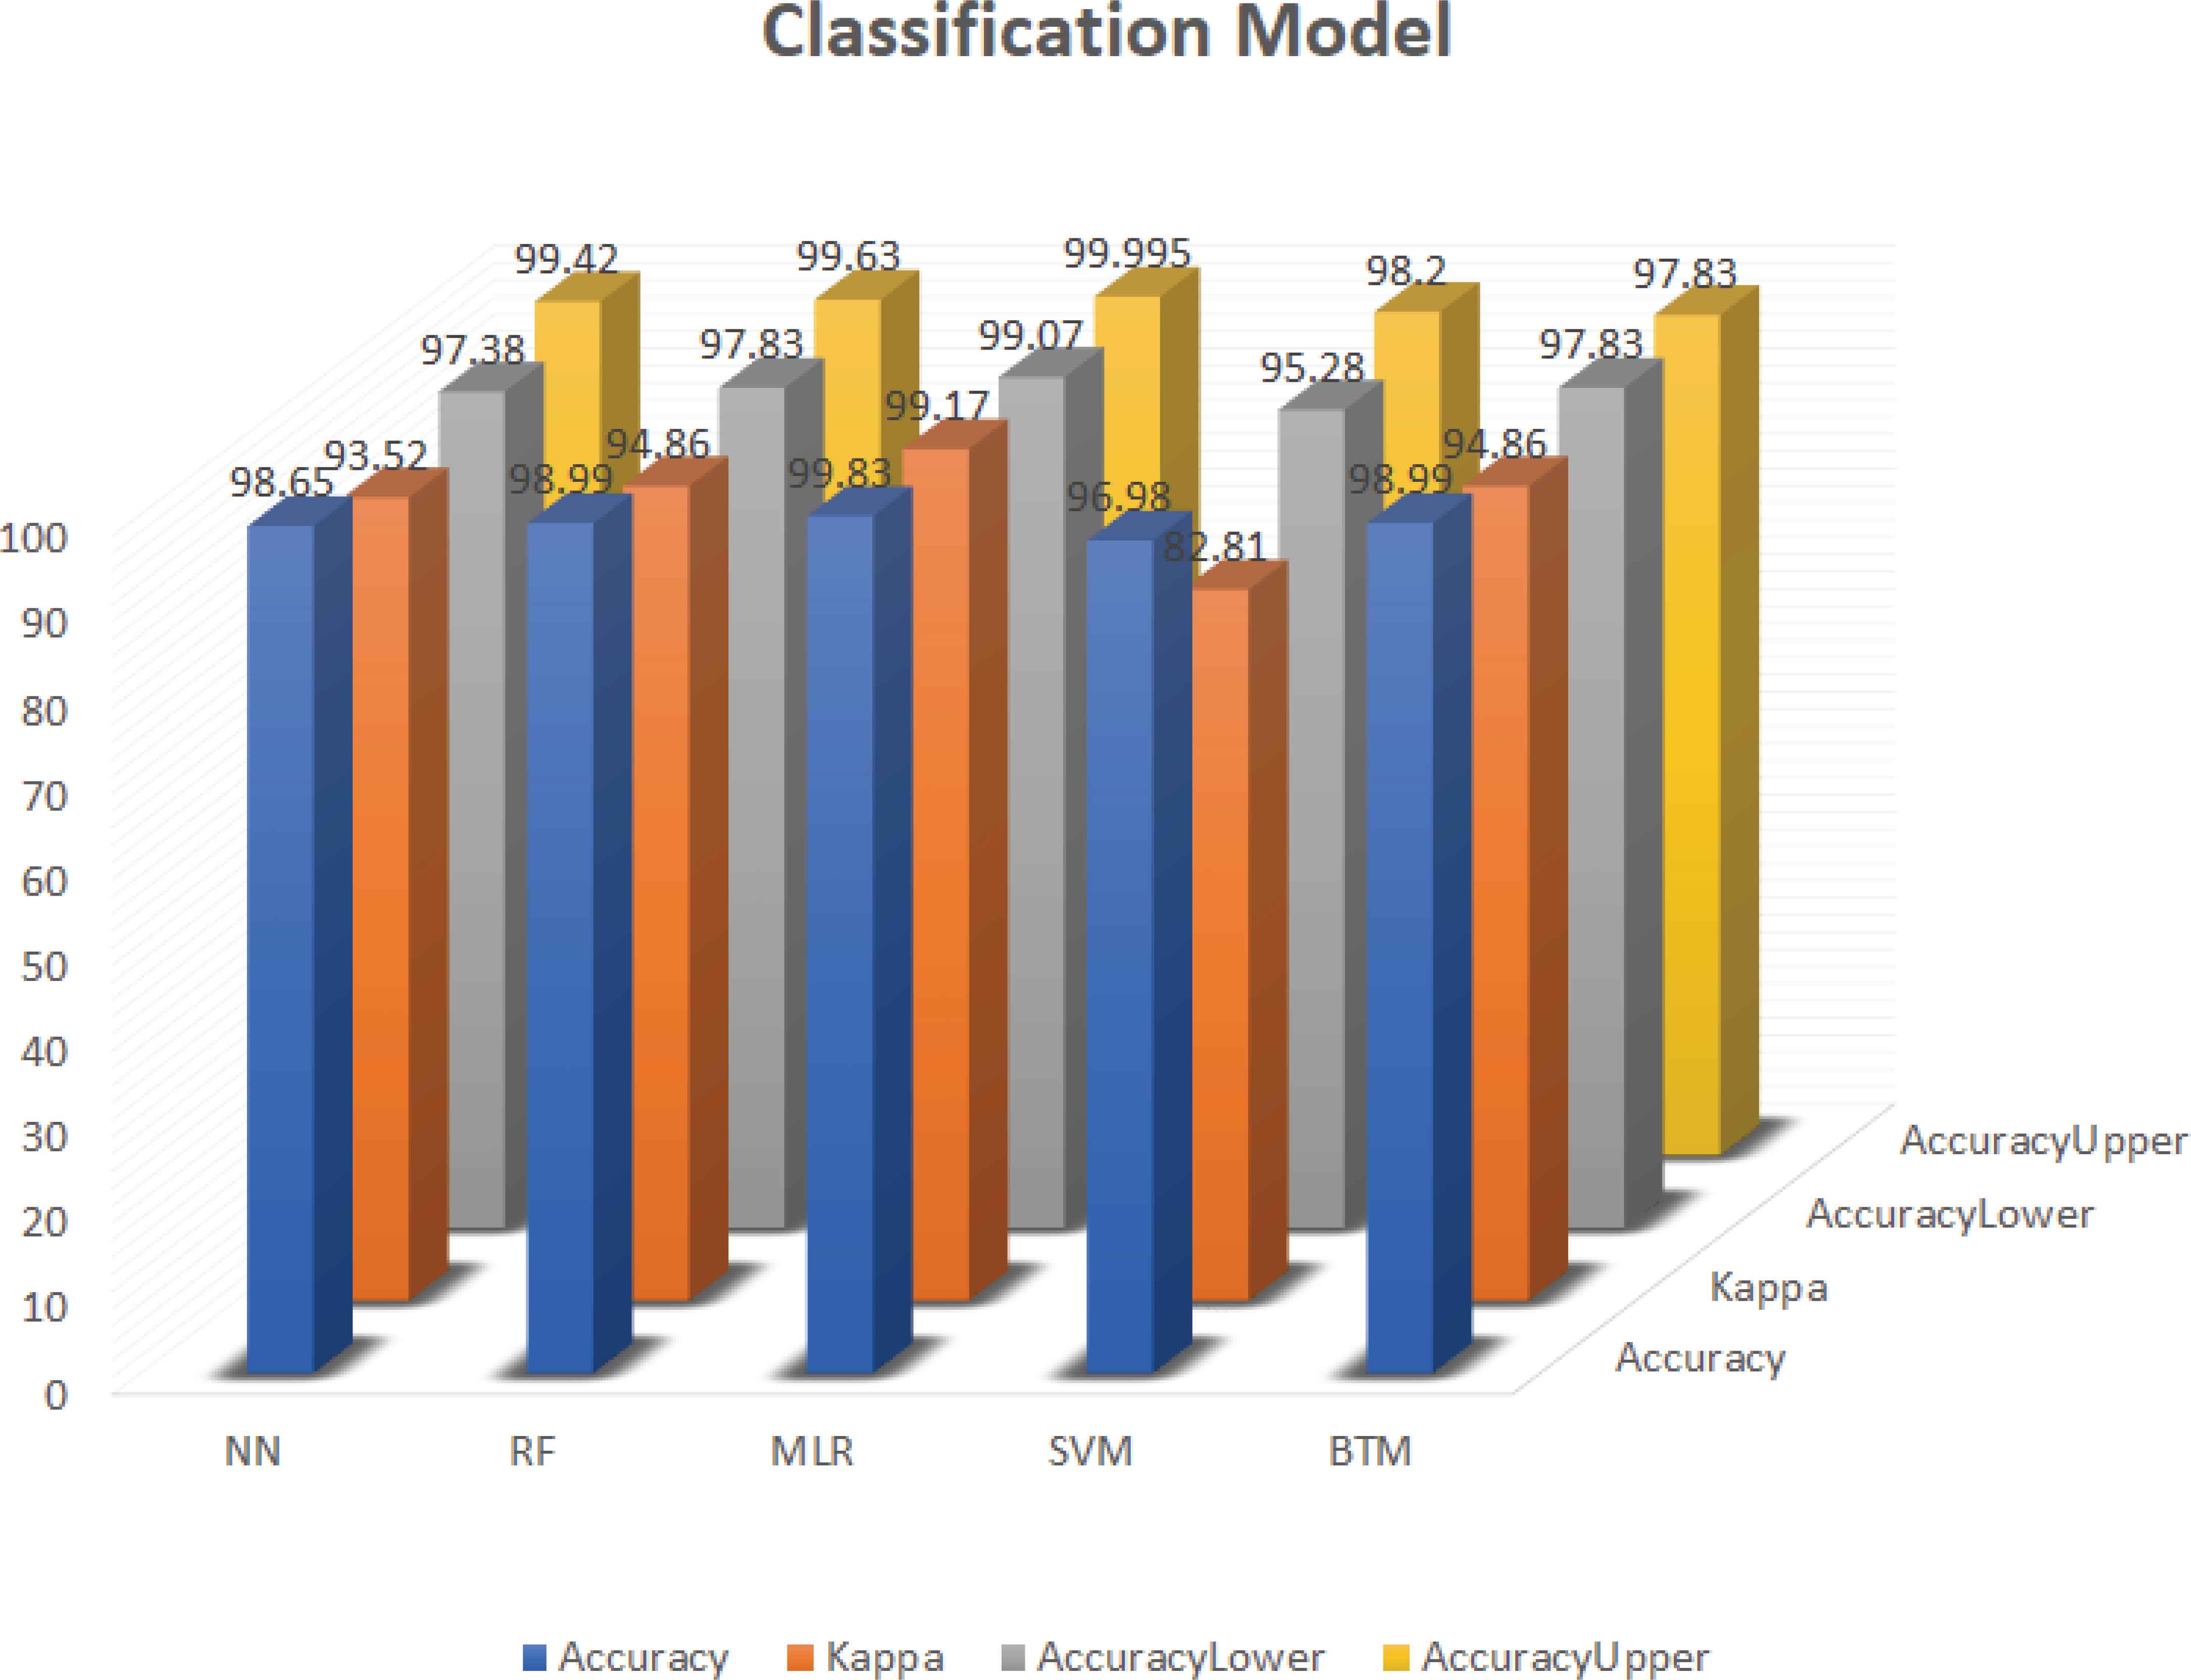
Classification model chart.
6.2. ROC of the Classification Models References
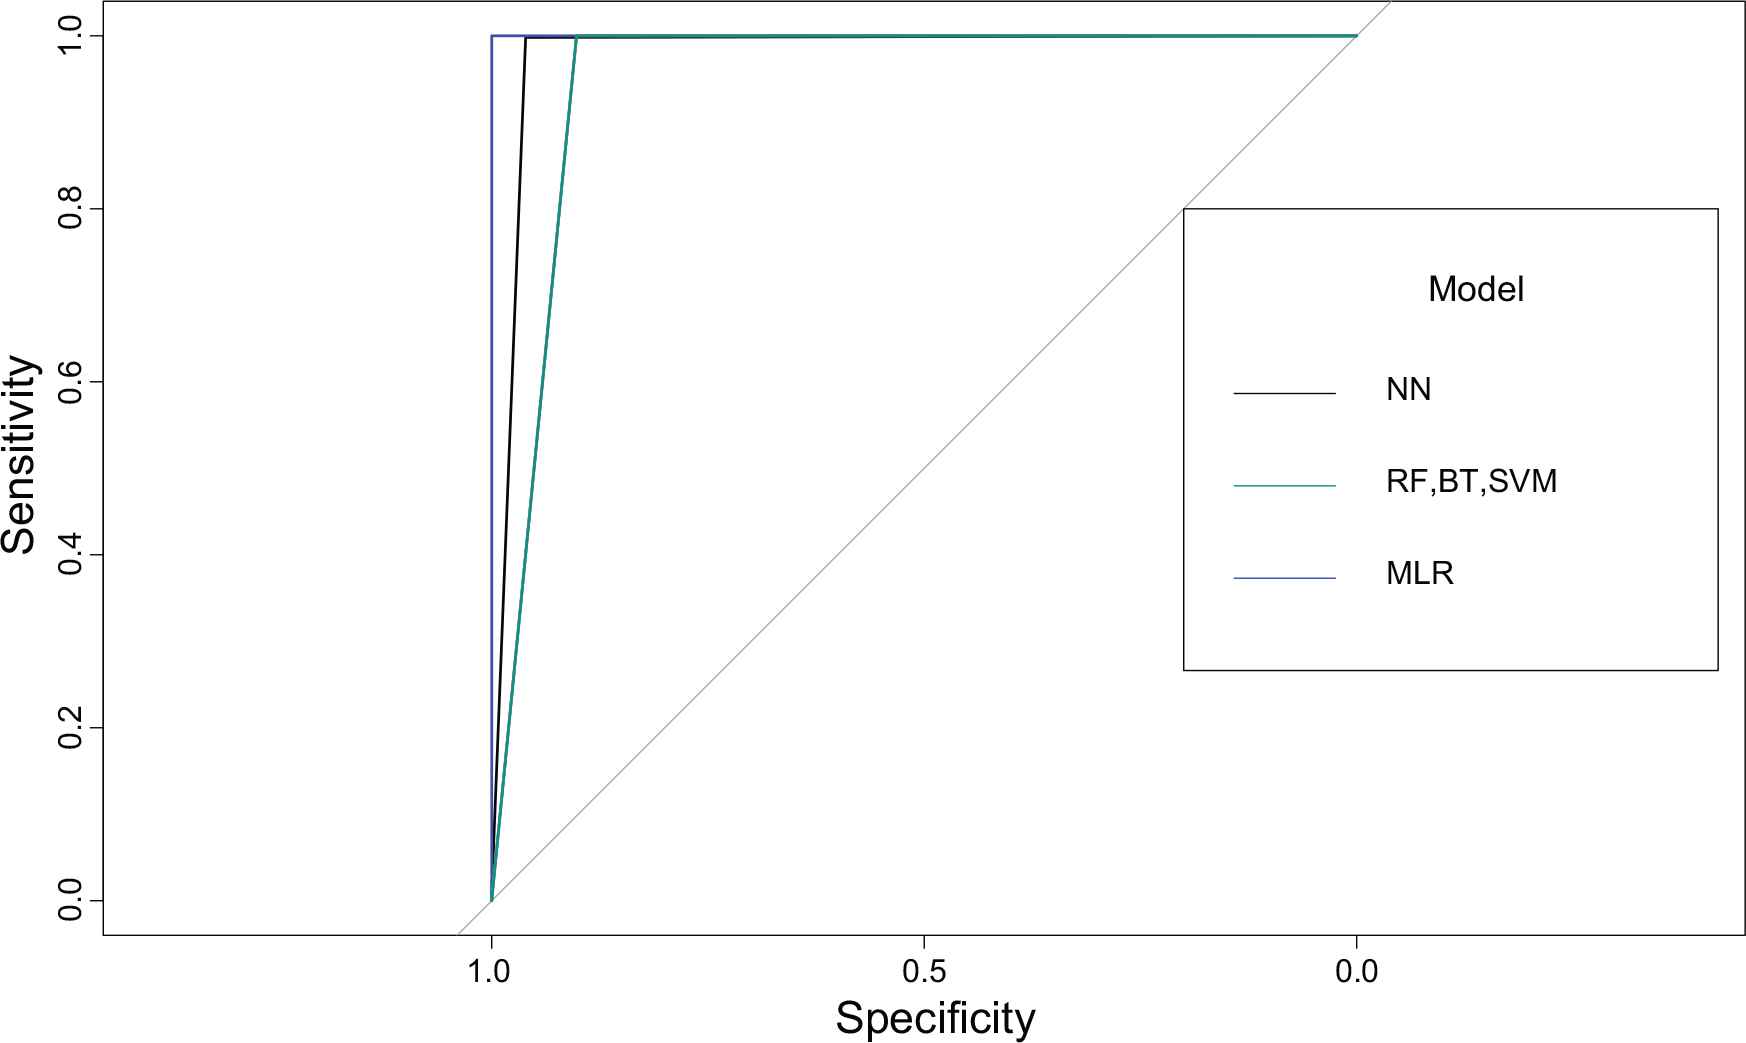
The Receiver Operating Characteristic (ROC) curve illustrates the performance of classification models across all categorization levels. Figure 11 depicts the ROC for the entire collection of our characteristics.
ROC for NN, RF, BT, SVM, MLR models.
The Receiver Operator Characteristic (ROC) curve is an assessment metric for binary classification. It’s a probability curve that compares the TPR (Sensitivity) to the FPR (Specificity) at various threshold levels. A ROC curve with a higher X-axis value implies that there are more False positives than True negatives. A greater Y-axis value implies that True positives outnumber False negatives. The higher the Specificity, the fewer incorrectly categorized Negative class points will appear. Here the Figure 11 depicts the ROC values of the various models we have used. According to the graph, the MLR model has the best specificity when compared to other models. As a consequence, the MLR model has accomplished the best in terms of classification.
6.3. Variable Importance
High-significance factors are result drivers, and their qualities significantly affect the values of the results. For finding Multinorm Variable Importance, we have applied numerous algorithms in our prediction and they are Neural Network (NN), MLR, RF, SVM and Bagged Tree Model (BT). The Variable Importance that we have extracted on different algorithms are NN, PH, Cond, DO, TC and BOD. The different variable importance we have found by applying numerous algorithms has been denoted in Table 5. The table shows us that after applying NN we have obtained the variable importance of 19.67, 18.83, 18.76, 15.70, 14.14 and 12.90 by Nitrate, PH, TC, DO, TC and BOD respectively. The MLR model has given us the variable importance of 74.78, 16.55, 20.17, 10.81, 15.12 and 14.44 respectively by the same metrics that we have used in NN. For the similar metrics, the variable importance by RF, SVM and BT has been obtained of (1.365, 11.570, 28.883, 105.770, 55.773, 38.663); (0.5348, 0.6579, 0.9421, 0.9870, 0.9756, 0.9277) and (5.241, 36.805, 81.494, 147.558, 105.166, 130.173) respectively. However, by applying NN, the highest variable importance of 19.67 has been found. Applying MLR, the highest variable importance has been found to be 74.78 and by applying RF, SVM and BT the highest variable importance has been found to be 105.770, 0.9870 and 147.558 respectively.
| Model | Nitrate | PH | EC | DO | TC | BOD |
|---|---|---|---|---|---|---|
| NN | 19.67 | 18.83 | 18.76 | 15.70 | 14.14 | 12.90 |
| MLR | 74.78 | 16.55 | 20.17 | 10.81 | 15.12 | 14.44 |
| RF | 1.365 | 11.570 | 28.883 | 105.770 | 55.773 | 38.663 |
| SVM | 0.5348 | 0.6579 | 0.9421 | 0.9870 | 0.9756 | 0.9277 |
| BT | 5.241 | 36.805 | 81.494 | 147.558 | 105.166 | 130.173 |
Classification of water quality
7. COMPARATIVE EVALUATION OF OUR PROPOSED MODEL
For our research, we have used a collection of five distinct models to compare the accuracy of our model to that of other current water quality prediction systems. Table 6 summarizes our suggested models’ overall performance to that of other systems.
| Serial number | Our proposed model | Other works | ||
|---|---|---|---|---|
| Model | Accuracy | Dataset | Existing model | |
| 01 | RF | 98.99% | Kadapa District’s groundwater (16 samples of test data, 7 parameters) | 93.75% [16] |
| 02 | NN | 98.65% | India’s rivers and lakes (1679 samples, 666 different water bodies, 7 parameters) | 80.63% [19] |
| 03 | MLR | 99.83% | Pakistan Council of Research in Water Resources (PCRWR) (663 samples, 12 several sources of Rawal Lake, 4 parameters) | 84.01% [4] |
| 04 | SVM | 96.98% | 31 Predictors, 780 original data samples, 317 samples remained (removing outliers) | 91.84% [21] |
| 05 | BT | 98.99% | Iranian Water Resources Management Company (IWRMC), Perennial resources (339 Points) | 86.00% [23] |
A table comparing the accuracy of our suggested models to that of various current systems
For water quality prediction, we have focused on accuracy measurement. For our prediction, we have applied numerous machine learning algorithms like RF, NN, MLR, SVM, and BT. The experimental result of RF, NN, MLR, SVM and BT models has been given in Table 6. Significant results have been observed after implementing those algorithms. As earlier mentioned, we have gotten the best accuracy using five distinct algorithms. Our results are compared to the accuracy of several current models (Table 6), as well as the table that depicts the algorithms’ overall performance in comparison to much other related research. Each row compares the details for an algorithm used during our investigation, as well as one relevant work with the dataset. When all aspects of our experiment have been gathered, the best accuracy has been achieved from the MLR model (99.83%) and a low accuracy score has been obtained from the SVM model (96.98%) (Table 6). Previous studies, on the other hand, revealed that the top outcome from the current models is slightly over 93.75% [24]. Ganga et al. [18] have utilized the RF model with data on groundwater in Andhra Pradesh, where researchers have attained a 93.75% accuracy by assessing seven factors. But our experimental results show that the RF model for water quality prediction has shown 98.99% accuracy (Table 6). Islam et al. [19] have proposed an artificial intelligence model for water quality prediction by using some algorithms including NN with an accuracy of 80.63% where 1679 samples and 7 parameters have been used. On the contrary, in Table 6, we have obtained 98.65% accuracy from our NN model. Ahmed et al. [4] have looked at multiple machine learning methods to estimate WQI and WQC, where they have used the MLR algorithm with an accuracy of 84.01% by analysing 663 samples and 4 parameters. Conversely, by using the MLR technique, we have attained 99.83% accuracy. With the MLR approach, the best outcomes have been obtained from our experiment. From the SVM model, we have acquired 96, 98% accuracy. Inversely, other authors in [24], have examined 31 predictors and 780 existing data samples, whereas only 317 data samples have left after the outliers have cleared. The accuracy of the SVM classifier has found to be 91.84 percent in this study. El-Habil et al. [20] have researched the IWRMC, where they employed 339 perennial supplies to highlight the availability of groundwater resources. Their analysis has shown that the BT algorithm has achieved 86.00%. Accuracy. However, from our BT model, we have obtained 98.99% accuracy for WQ prediction (Table 6). Table 6 shows that the results of our suggested models are extremely good when compared to prior research efforts.
8. CONCLUSION
The performance of machine learning techniques such as RF, NN, MLR, SVM, and BTM to predict the water quality components of an Indian water quality dataset was evaluated in this work. The most well-known dataset variables, such as BOD, DO, TC, Nitrate, pH, and Temp, were obtained for this purpose. The findings revealed that the applied models performed well in forecasting water quality parameters; however, the greatest performance was linked with the MLR with Accuracy Upper. Further research will be done to build models that combine the proposed method with other techniques and deep learning approaches to improve the efficacy of the selection process.
CONFLICTS OF INTEREST
The authors declare they have no conflicts of interest.
AUTHORS’ CONTRIBUTION
Md. Mehedi Hassan made significant contributions to the study’s conceptualization and design. Md. Mushfiqur Rahman, Md. Mahedi Hassan, and Sadika Zaman all assisted Md. Mehedi Hassan in evaluating data and preparing this report properly. Other authors assisted with the production of the manuscript’s draft version. All authors examined the results and gave final approval to the manuscript’s final version.
REFERENCES
Cite this article
TY  - JOUR
AU  - Md. Mehedi Hassan
AU  - Md. Mahedi Hassan
AU  - Laboni Akter
AU  - Md. Mushfiqur Rahman
AU  - Sadika Zaman
AU  - Khan Md. Hasib
AU  - Nusrat Jahan
AU  - Raisun Nasa Smrity
AU  - Jerin Farhana
AU  - M. Raihan
AU  - Swarnali Mollick
PY  - 2021
DA  - 2021/12/10
TI  - Efficient Prediction of Water Quality Index (WQI) Using Machine Learning Algorithms
JO  - Human-Centric Intelligent Systems
SP  - 86
EP  - 97
VL  - 1
IS  - 3-4
SN  - 2667-1336
UR  - https://doi.org/10.2991/hcis.k.211203.001
DO  - 10.2991/hcis.k.211203.001
ID  - Hassan2021
ER  -