
Semantic Knowledge Discovery for User Profiling for Location-Based Recommender Systems
- DOI
- 10.2991/hcis.k.210704.001How to use a DOI?
- Keywords
- Location-based recommender system; Foursquare; sentiment analysis; topic modelling; venue recommendation; places of interest
- Abstract
This paper introduces a purposed Location-based Recommender System (LBRS) that combines sentiment analysis and topic modelling techniques to improve user profiling for enhancing recommendations of Points of Interest (POIs). Using additional feature extraction, we built user profiles from a Foursquare dataset to evaluate our model and provide recommendations based on user opinions toward venues. Our combined model performed favourably against the baseline models, with an overall improved accuracy of 0.67. The limitations were the use of one dataset and that user profiles were constructed using predicted emotions extracted as features from review data with topic modelling, rather than literal user emotions. Nevertheless, this provides a step forward in user profile and emotion scoring, contributing further to the development of LBRS in the Tourism domain.
- Copyright
- © 2021 The Authors. Publishing services by Atlantis Press International B.V.
- Open Access
- This is an open access article distributed under the CC BY-NC 4.0 license (http://creativecommons.org/licenses/by-nc/4.0/).
1. INTRODUCTION
Web-based platforms have transformed the tourism and hospitality industries, as travellers no longer wholly rely on travel professionals when finding a location [34]. A survey by Pang [24] indicates that 73%–87% of users who engage with these web-based tourism platforms (e.g. hotel or restaurant) are influenced by online reviews when selecting an intended destination. The content of these platforms consist of millions of ratings, threads, social media posts, and check-in information, which can create information over-load. A Recommender System (RS) collects information on user preferences for a particular item and analyses them to predict user needs, providing personalized recommendations that may reduce overload and enable more efficient decisions [4].
The implementation of Recommender Systems in entertainment and e-commerce has shown progress, but there are still attempts to successfully apply this approach to the tourism and hospitality domain, where numerical ratings are difficult to collect and preferences toward domain items are too complex to be expressed as a scalar rating [16]. Location-based Social Networks (LBSNs) such as Foursquare, Gowalla, Facebook and Yelp encourage users to check-in, rate and comment on the locations they visited [5], but users of these platforms may not provide implicit ratings. A Location-Based Recommender System (LBRS) uses the data in LBSNs to predict user preference toward venues, then recommend a Point of Interest (POI). Many LBRSs consider only check-in data when modeling user preferences for a venue, which may be insufficient [6,38]. Although better than classical recommendations via user ratings, this fails to provide exact user preferences, as the data can create false assumptions about majorly checked-in venues (e.g. bad service at the venue), which cannot be extracted from check-in data alone [6].
For this study, we propose the development of a purposed LBRS that considers additional features from a dataset. Previous work has focused on non-textual attributes, such as categorical, temporal, spatial, and social activities. For example, Yang [36] considered sentiment analysis techniques, but did not consider semantic factors such as popular events, the most intriguing activity, environment or food. The similarity-based approach by Zheng [40] proposed user-based neighbour style explanations, which is similar to social network-based collaborative filtering approaches that give higher weight to friends of users, but does not consider user perspectives from their opinion or emotions [14,20]. Sentiment analysis for LBRS have been used in the past [36,42], but these were unable to capture the meaning of longer phrases properly and did not accurately capture the underlying phenomena presented in the data.
Our aim is to design an LBRS that employs both sentiment analysis and topic modelling to extract features from user reviews to better predict POIs. The purposed LBRS described in this paper analyses user reviews and performs sentiment analysis and topic modelling, on top of classical recommendation techniques. The ability of sentiment analysis to factor in emotions is considered more trustworthy than classical ratings by offering stronger judgement toward a venue, while topic modelling is becoming widely used as a probabilistic technique for text. The sentiment score of a user review combined with topic modelling provides stronger evaluation of a venue.
The purposed LBRS for this research leverages text mining to quantify the polarity and semantics towards the main subject of a text. Our approach includes feature extraction of previously unconsidered topics such as certain events or attractions of the POI, which will help predict user preference by capturing the subjectivity in semantic orientation associated with a text [31]. In addition, we use feature extraction to create user profiles. Topic modelling is used to learn user topics from tips information associated with review data from Foursquare. Our objective is to reveal an unobserved context between people and locations to recover semantic information.
2. BASIS OF RECOMMENDER SYSTEMS
Recommender systems filter massive information by extracting data generated from a user’s choices, interests and observed behaviour, which can be used to build his or her profile [13,26]. In research, a recommender system is broadly classified into three types: content-based filtering, collaborative filtering and hybrid systems.
Content Based Filtering (CBF) assumes that users who liked certain items in the past will also like new items with the same attributes. User profiles are automatically updated based on the feedback to individual items, and items are recommended to the user according to their profile [3]. It primarily relies on dictionary-bound relations between the terms used in user profiles and item content, so implicit associations between users are not considered [38]. Collaborative Filtering (CF) analyses user interactions and behaviours to determine their likes based on similar user choices. User-generated feedback can be used to detect taste commonalities between groups of users, then recommendations are generated based on inter-user similarities. CF locates the subset of similar users who have similar profiles and preferences, then provides suggestions on the assumption that users with similar tastes in the past will still have the same taste in future [3,21]. Memory-based algorithms use statistical techniques to determine a group of users who have a history of agreeing with a selected user, while model-based collaborative algorithms provide recommendations by firstly developing a model of user ratings. Finally, recommender systems that use a Hybrid Filtering Approach resolve the issues present in CF and CBF systems, such as cold start and gray sheep in CF and data sparsity and overspecialization problem in CBF [3]. Hybrid recommender systems combine different techniques under CF and CBF in a way that exploits the advantages and reduces the drawbacks. These can be implemented by separately making predictions and then integrating them, or by adding functions of the CBF system toa CF system, or by combining the two different models into one [27].
2.1. Social Networks Based Recommendations
Social network-based CF [14,20] gives higher weight of recommendations to friends of a user rather than a set of anonymous, similar users. As specified by Kautz [14], people who use SNs function as both “users” and “items”. Thus, suggesting recommendations of potential friends or partners based on the bilateral nature of interaction in social networks. Research by Ye et al. [38] implemented a friend-based collaborative filtering (FCF) approach for location recommendations based on heuristics derived from observed geospatial characteristics in the Foursquare dataset, which was very effective. Similarly, Bao [5] found that social activity inferred from user data at a certain location also influences recommendations. Huang [18] proposed a method to automatically detect activities using the spatial-temporal attractiveness (STPA) of POI. The system exploits the connections between the user activities and profiles in a joint learning process [43]. Location Sequential Recommendations [44] use association rule-mining and sequence-mining over sequences of locations extracted from geo-tagged photos, GPS-trajectory. Based on the user’s historical visiting pattern, the system creates an itinerary of scenic locations to visit that are popular among other users by preparing frequently travelled routes and implementing a route recommendation system [9].
2.2. Location Aware Recommendation
Location check-ins implicitly create a new social structure made up of inter-dependency between individuals derived from their locations. With inter-dependency, two persons co-occur in the same physical location, or share similar location histories and also determine the knowledge such as common interests, behaviour, and activities, inferred from user’s history of locations and location-tagged data e.g. text, photos, etc. [7]. The generated data provides an idea of the spatial, social and temporal characteristics of how people use these platforms to model patterns of human mobility, which are significant factors for designing future location-based services [8].
Traditional RS for venues use a rating matrix. The matrix has one row for each user and one column for each item, with each element of the matrix showing the preference of a user toward an item. It is rare for all users to have rated all items, so the task of an RS is to predict the “missing” ratings, i.e. a users preference toward their un-rated items [33]. In user-based CF, a rating is estimated by aggregating the ratings of other users for item, while the aggregation is based on the user-user similarity. In contrast, item-based CF estimates ratings based on users past ratings on other items as well as item-item similarity [19,29]. Among the several User Item Rating Matrix models for LBRS, the most popular has to be the 0/1 scheme model by [38,39]. It takes 0 for non-visited locations and 1 for visited locations. By using the 0/1 model, authors such as Ye [38,39] consider the frequencies of check-ins and the social and geographic impact to compute user preference in POI.
Generic recommendations provide the user with the most popular venue, ignoring individual preferences, whereas a personalized approach provides users with the most suitable location by considering personalized recommendations with techniques like CF [36]. Zheng [40] proposed a personalized system to identify experienced travellers by applying a Hypertext Induced Topic Search (HITS) inference model over a Tree-Based Hierarchical Graph of users’ historical trajectories. In this system, users with the same location history may have similarities and can be considered a friend. The connections inside the information network reflect users’ geographical histories as well as their social relationships. Based on a sequence-matching algorithm that considers location hierarchies, the system finds users with similar travelling patterns [17]. Xiao [35] extends the user similarity approach by considering available semantic data, however, it primarily focuses on the user similarities and does not account for activity analysis or semantic score to predict the data, which our work encompasses.
3. METHODOLOGY
For our purposed LBRS model, we capture the sentiment of a user “u” towards a location “l”. A sentiment-enhanced user preference model, along with feature extraction, is implemented to create recommendations. Sentiments present in the texts assist us in identifying human opinion on certain topics determined from the corpus. The purposed work eliminates data sparsity by considering feature extraction and implementing a collaborative matrix factorization method. Thus, this research suggests a hybrid preference model by application of sentiment and semantic analysis in a location recommendation approach, which will create an effective and efficient recommendation. An overview of the Purposed LBRS is shown in Figure 1. The goal is to automatically recommend a POI by using a user sentiment score and topic modelling.
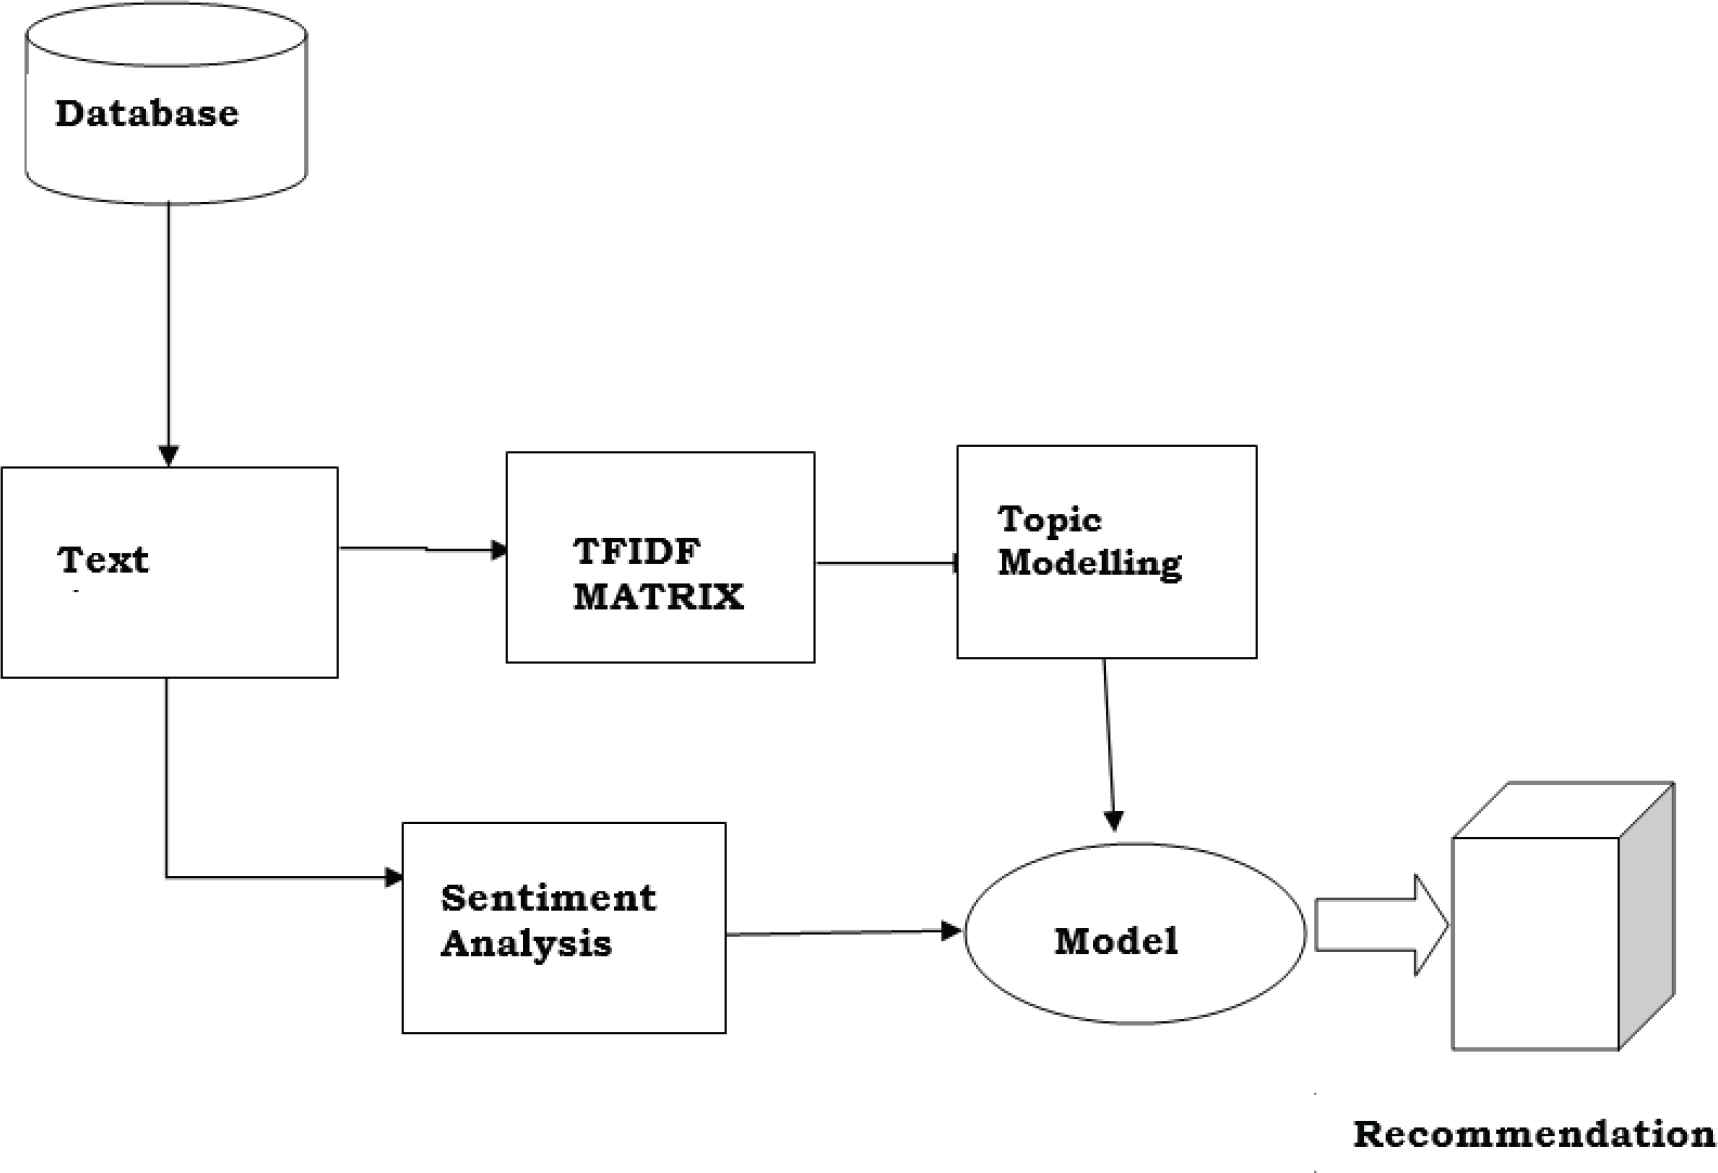
Architecture of purposed LBRS.
A user profile is a generic model that is built from data such as personal information, hobbies and travel history within the dataset, and arranged to show interactivity between a user and a system. Our purposed LBRS builds the user profile according to user venue preferences, including past travel, tips and reviews.
The model implements a user profile by creating a user model, shown in the stage before the recommendation of the POI in Figure 1. The research data did not have explicit user data, so implicit data generated is generated from user reviews to profile the user. The process of the LBRS implements sentiment analysis and topic modelling to construct a user profile from sentiments and topics classifications, in which a user clustering structure is created, forming a categorical dataset.
3.1. Data Pre-Processing
The dataset for our experiment is from the Foursquare API. Foursquare provides personalized recommendations of places to go near a user’s current location, based on their previous browsing and check-in history [15]. This dataset contains: (a) user’s tips and check-in data and (b) venue categorization. Location Data and User Opinions are available publicly by crawling the Foursquare-tagged tweets of the Twitter Public Feed, which is provided by Yang et al. [36]. The information collected does not interfere with user privacy and only acknowledges data made public by the users. Recent reviews from New York and London are extracted. The reviews of POIs from Foursquare are sourced from [36,37].
Data is considered from users who have performed one check-in per week and did not show sudden movement from a locale. The Foursquare dataset includes check-in, tip and tag data of restaurant venues in NYC collected between the 24th of October 2011 to the 20th of February 2012. It contains 3112 users and 3298 venues, with 27149 check-ins and 10377 tips. While it is diverse, it has a low sparsity value. We only considered data from users with 3 or more reviews in the database. With these parameters, a total of 924 unique users are identified, with a total of 2706 unique venues. Table 1 provides a snapshot of the Count, Unique values, Top review counts and Frequency of reviews per Venue and User.
| Venue | User | |
|---|---|---|
| Count | 3298 | 3112 |
| Unique | 2706 | 924 |
| Top | 3184 | 82569 |
| Frequency | 23 | 239 |
Details of Foursquare database
Creation of a user model is required for the hybrid approach. The dataset did not have explicit user information, so we rely on implicit data generated by user reviews to develop the user profiles, including personal data (name, age, gender), hobbies (likes, dislikes), travel history, location data and certain topics. As stated previously, only data from users who provided at least 3 reviews toward a venue are considered, to mitigate the data sparsity problem. The largest number of reviews given by a single user was 23.
Data was cleaned using tokenization, with stemming and lemmatization [12]. Noise such as hashtags, punctuation, special characters, reluctant words, along with other irrelevant data, were removed. Pre-processing and cleaning also involved the removal of Unicode characters outside of ASCII, deleting duplicate reviews and non-alphabet characters, and conversion of all words to lowercase. Finally, stop word removal and stemming was conducted, in accordance with [22]. After pre-processing, our dataset consisted of 7402 reviews.
3.2. Sentiment Analysis of the Reviews
We extracted meaningful text from the corpus to produce clean reviews for the training and test sets. This information was also used for building the recommendation system [22]. We used the unsupervised algorithm SentiStrength for its dictionary-based approach of determining sentiment strength of a document [1]. Input text was split into sentences, with each tested to see if it contains a subjective or objective sentiment, then we extracted the object about which the opinion is expressed.
For each text, the SentiStrength output is two integers: 1 to 5 for positive sentiment strength, and a separate score of 1 to 5 for negative sentiment strength. Here, 1 signifies no sentiment and 5 signifies a strong sentiment score of the respected types. For example, a text with a score of 3 for positive and 5 for negative would contain moderate positive sentiment and strong negative sentiment. A neutral text would be coded as 1, 1. Two scales are used because even short texts can contain both positivity and negativity. The goal is to detect the sentiment expressed rather than its overall polarity [32]. Positive suggestions were found to be 1.5 times higher than negative suggestions in the dataset. Figure 2 offers a comparison between the most Positive words and the most Negative words in the corpus.
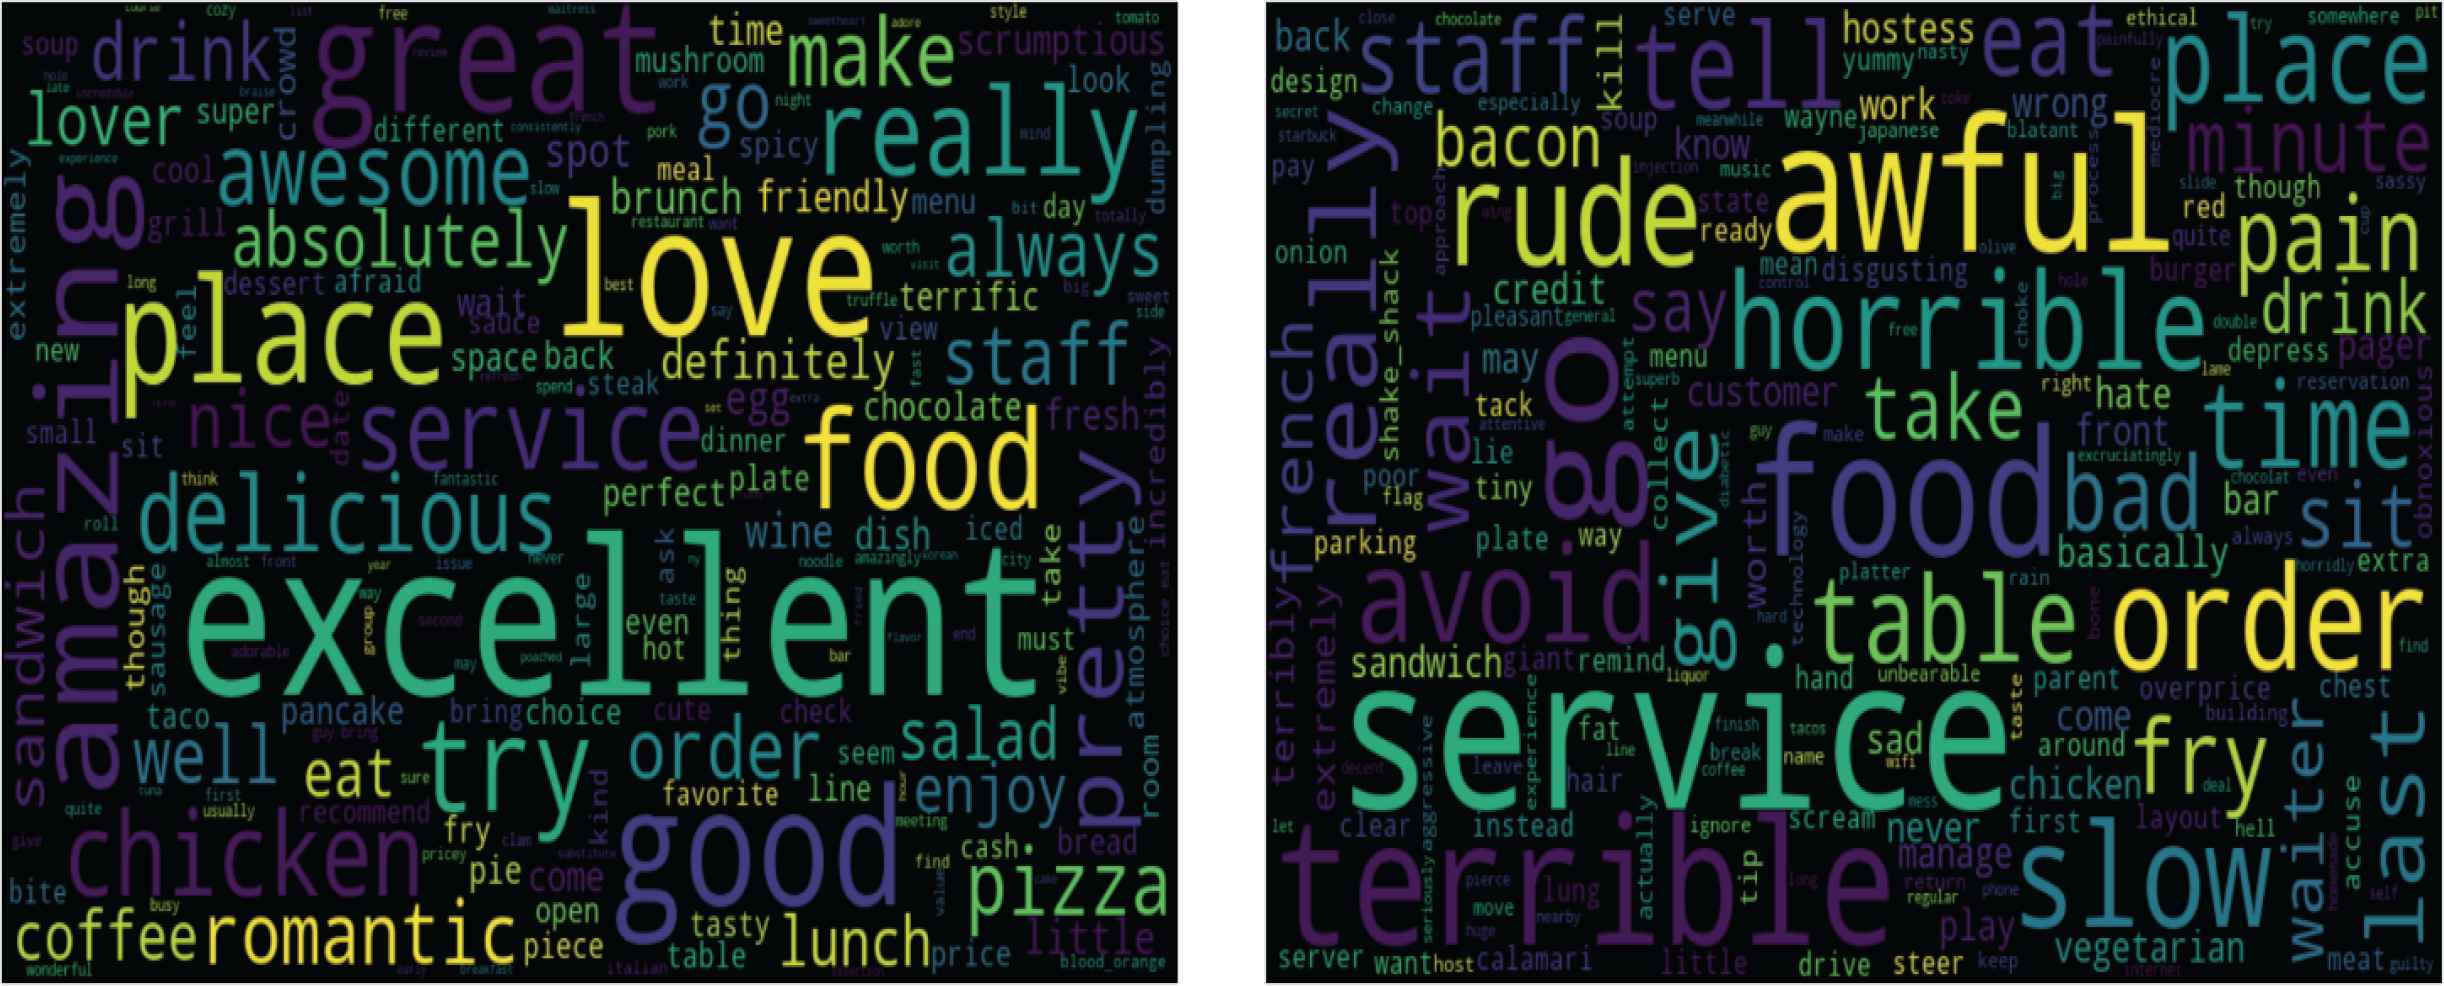
Positive words vs negative words.
From the overall range of 1 to 5 for both negative and positive sentiment score, we calculated a scale from 4 to 4 by summing the value of the sentiments. The sentences with 4 score are the Strongly Negative sentences (they had the most amount of negative words), 0 is assigned Neutral (reviews address both the negative and positive side equally), and the sentences with a score of 4 are Strongly Positive (no complaints in the sentence).
Within the reviews, some users were too lenient and some were too aggressive in providing reviews. So we scaled the user ratings from 0 to 1, with 0 being most negative and 1 being most positive. While normalizing user reviews scores, we found that positive and negative score are evenly distributed among the total users reviews. We converted the scales to binary measures as ‘recommendation’ for a positive opinion and ‘no recommendation’ for a negative opinion. A comparison between the actual sentiment scores and the normalized sentiment scores are shown in Figure 3.
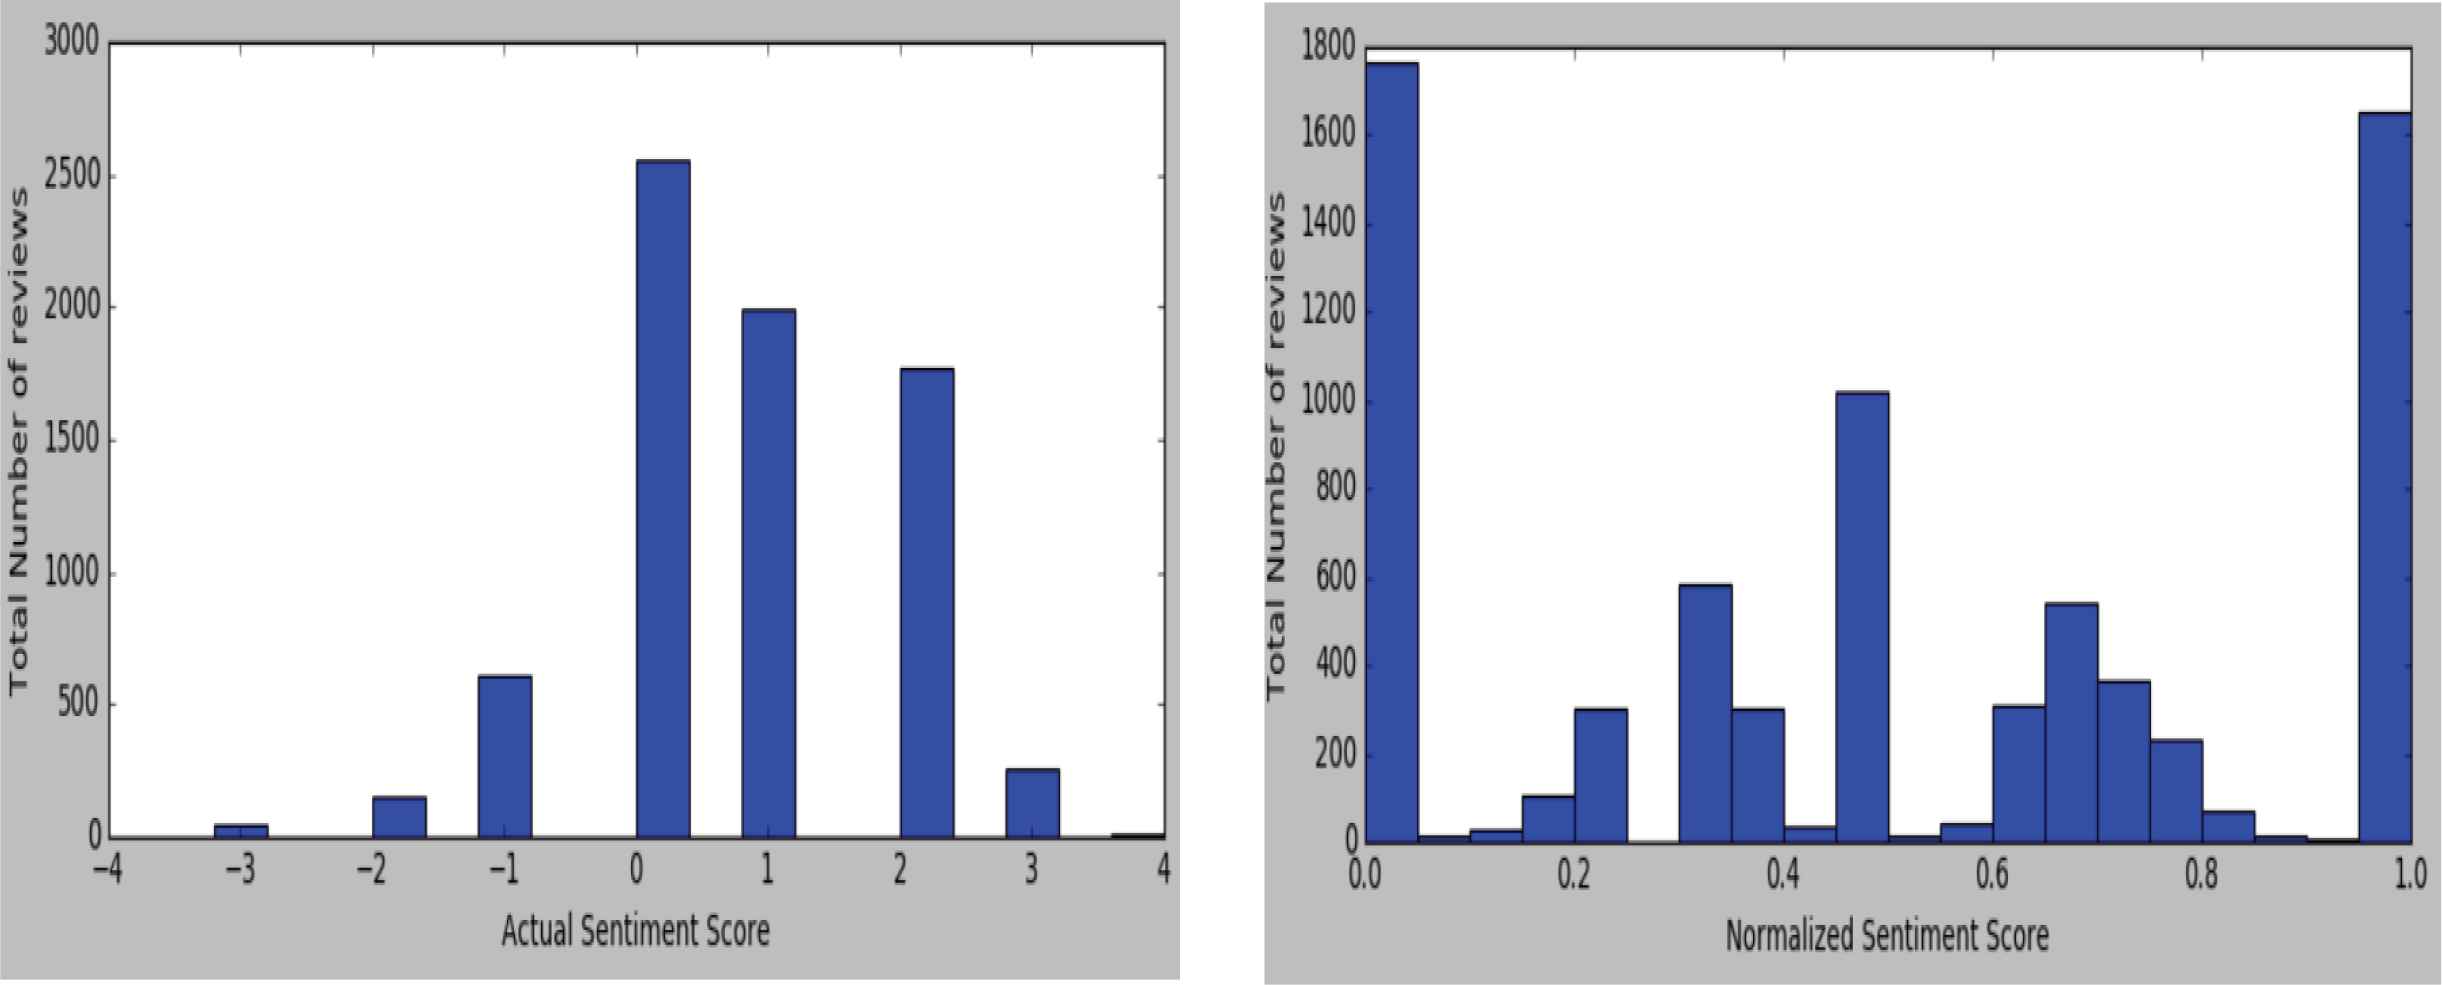
Actual vs normalized sentiment scores.
3.3. Topic Modelling
With our technique, we extracted information contained in review text and converted these into appropriate topics. Rather than representing a text ‘T’ in its feature space, we represented ‘T’ in its topic space. Topic Modelling is used for recommending a location with a topic structure similar to the location the user has already visited.
We used Term Document Frequency (TD-IDF) to analyse our normalized data and adopted Latent Dirichlet Allocation (LDA) as our topic modelling method to review texts. By using TF-IDF over bag of words, we significantly reduced the sparsity of the feature matrix from 0.57% to 0.45%, which is essential for a good LDA model. This technique was used for semantic feature extraction, where IDF represents log(N/n), with N as the number of documents and n as the number of documents a term t has appeared within.
It can be mathematically represented as:
After TF-IDF term frequencies were calculated, a Document-term matrix is created, showing TF-IDF weight for each word in a given review. This matrix is composed of every document as rows and every term as columns. This matrix is shown in Figure 4, with some examples of weighted words.
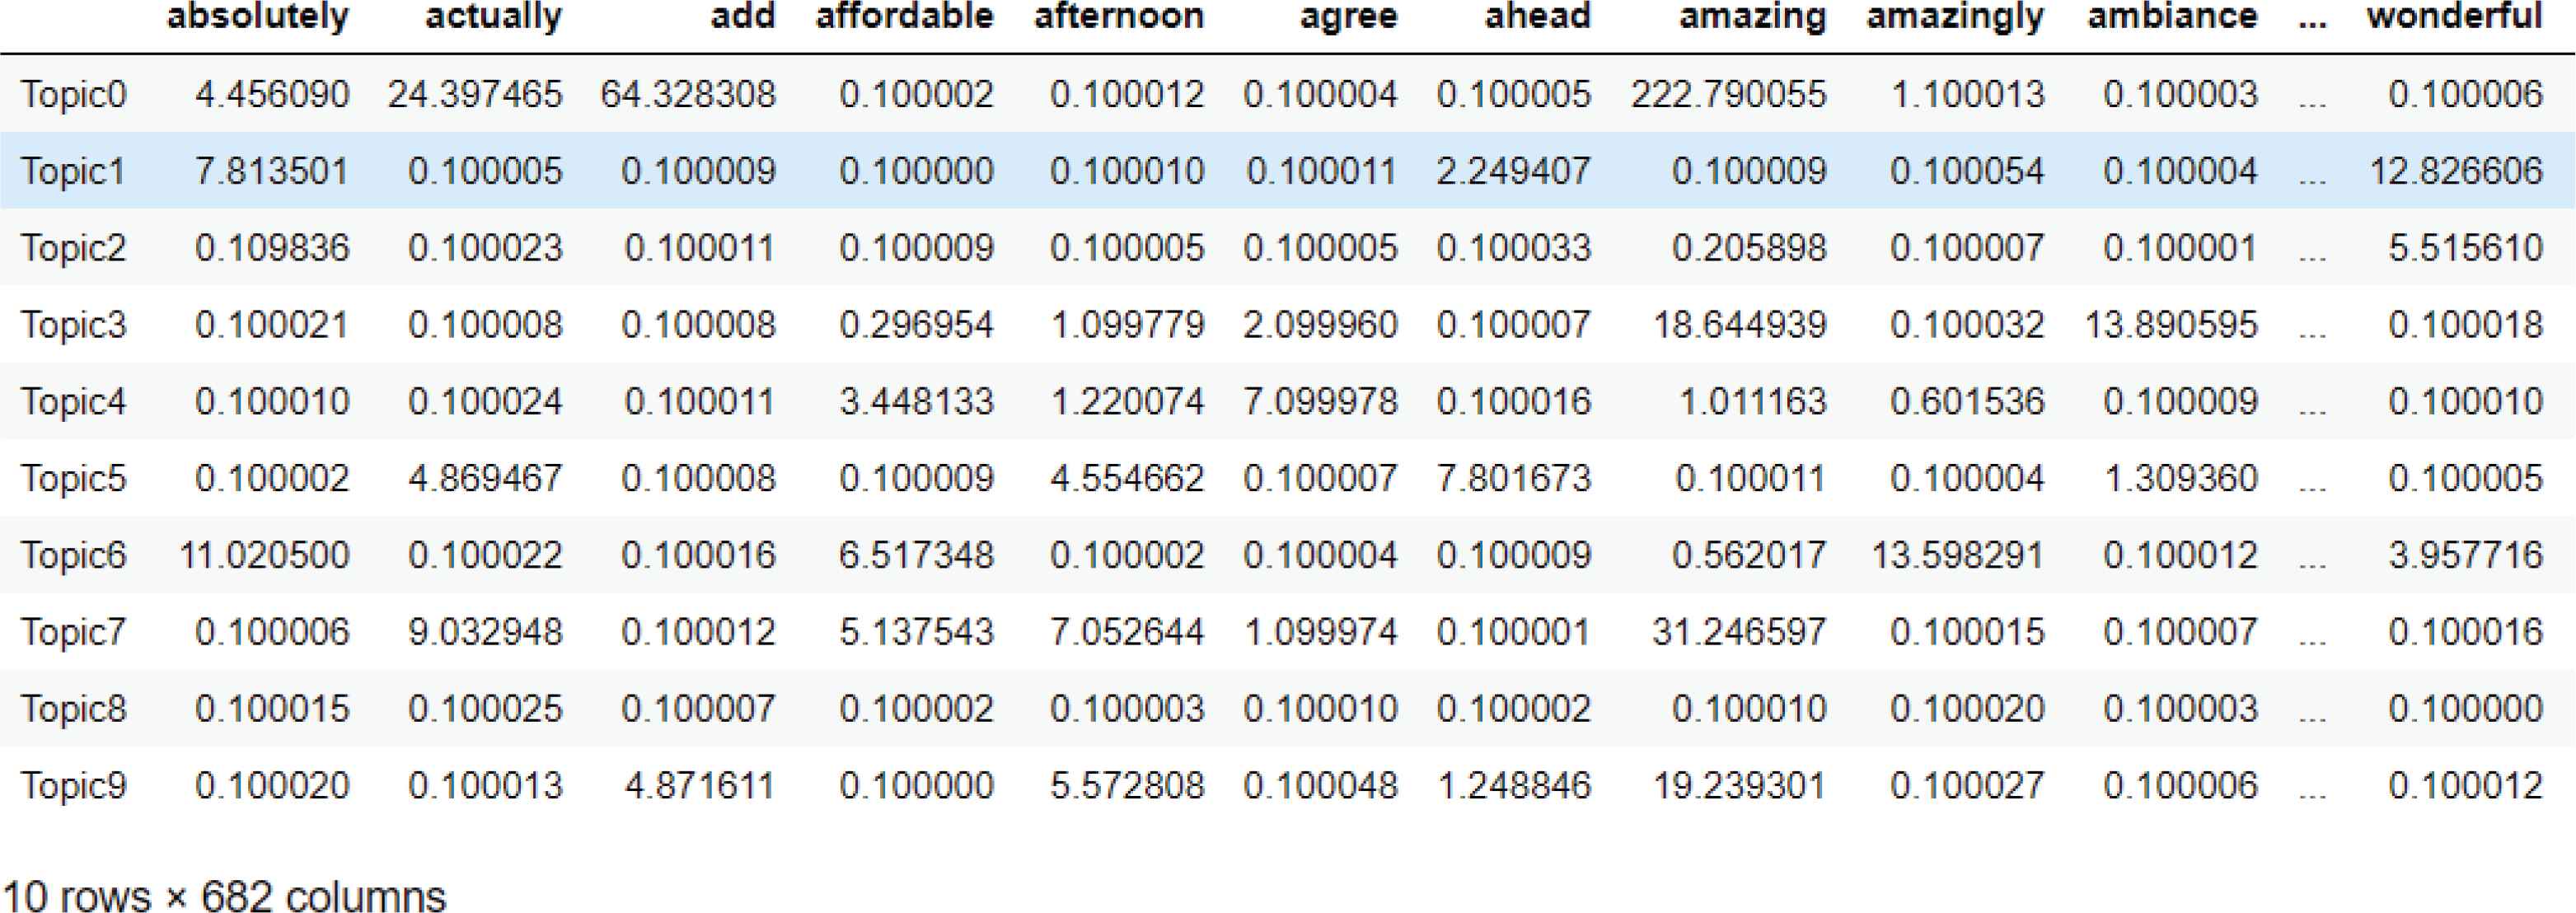
Weightage of word for each topic.
Considering each review as a document, we create one for every user. LDA is used to train our model for the constructed corpus of each POI. Our LDA model is built using the python library, scikit-learn [25]. With initial modelling, we selected 20 topics for our experiments, with 10 learning iterations and a batch size equal to 128 using all the CPU power. Following this, we calculated perplexity and log-likelihood to determine how accurately the produced model represents the statistics of the provided data.
Each topic contains specific words from which we identify the user and venue separately. This provides both a user profile based on the venue being mentioned in the reviews, and the preference toward a venue if they appear in the same topic. This follows an approach similar to Aciar et al. [2], in which consumer views are represented through clustering venues together.
To tune our LDA model, we selected the optimal number of topics to improve model efficiency. We did not regard the θ and ψ as parameters calculated directly, but considered the word posterior probability P(w—z) for the themes using Grid Search [25] to obtain the value of parameters (θ and ψ) indirectly. We observed that a significantly low optimal number of distinct topics (10), might be effective for classifying this corpus. Plotting the log-likelihood scores against number of topics shows the number of topics when using 10 has better scores and the Perplexity is also significantly low. Table 2 shows the top 10 topics extracted from reviews linked with restaurants and the top 15 words with the highest weight for each topic.
| Category | Top 15 Words |
|---|---|
| Topic 1 | order, chicken, fry, wait, line, pork, long, come, bread, table |
| Topic 2 | food, lunch, special, great, bad, staff, service, good, drink, nice |
| Topic 3 | delicious, make, sandwich, coffee, small, cold, wrong, friend, little, menu |
| Topic 4 | restaurant, amazing, know, eat, food, slice, good, list, time, choice |
| Topic 5 | place, good, love, sit, bar, night, food, great, fresh, check |
| Topic 6 | burger, chocolate, dumpling, die, worth, better, cheap, pancake, plate, shake |
| Topic 7 | spicy, salad, tea, noodle, make, cocktail, sweet, perfect, mushroom, sure |
| Topic 8 | great, pizza, spot, service, really, food, coffee, beer, favorite, brunch |
| Topic 9 | good, best, ask, pretty, coffee, city, roll, french, free, order |
| Topic 10 | try, sauce, hot, taste, egg, awesome, amazing, fry, grill, chicken |
Topics
These topics share different weight in each document and the topic with highest weightage is considered the dominant topic of the particular document. In Figure 5, we can observe the weight of each topic across the 7401 unique documents. The dominant_topic column indicates which Topic was the heighest weight for its particular document, to give us a sense of the most frequently occurring topics as recommendations.
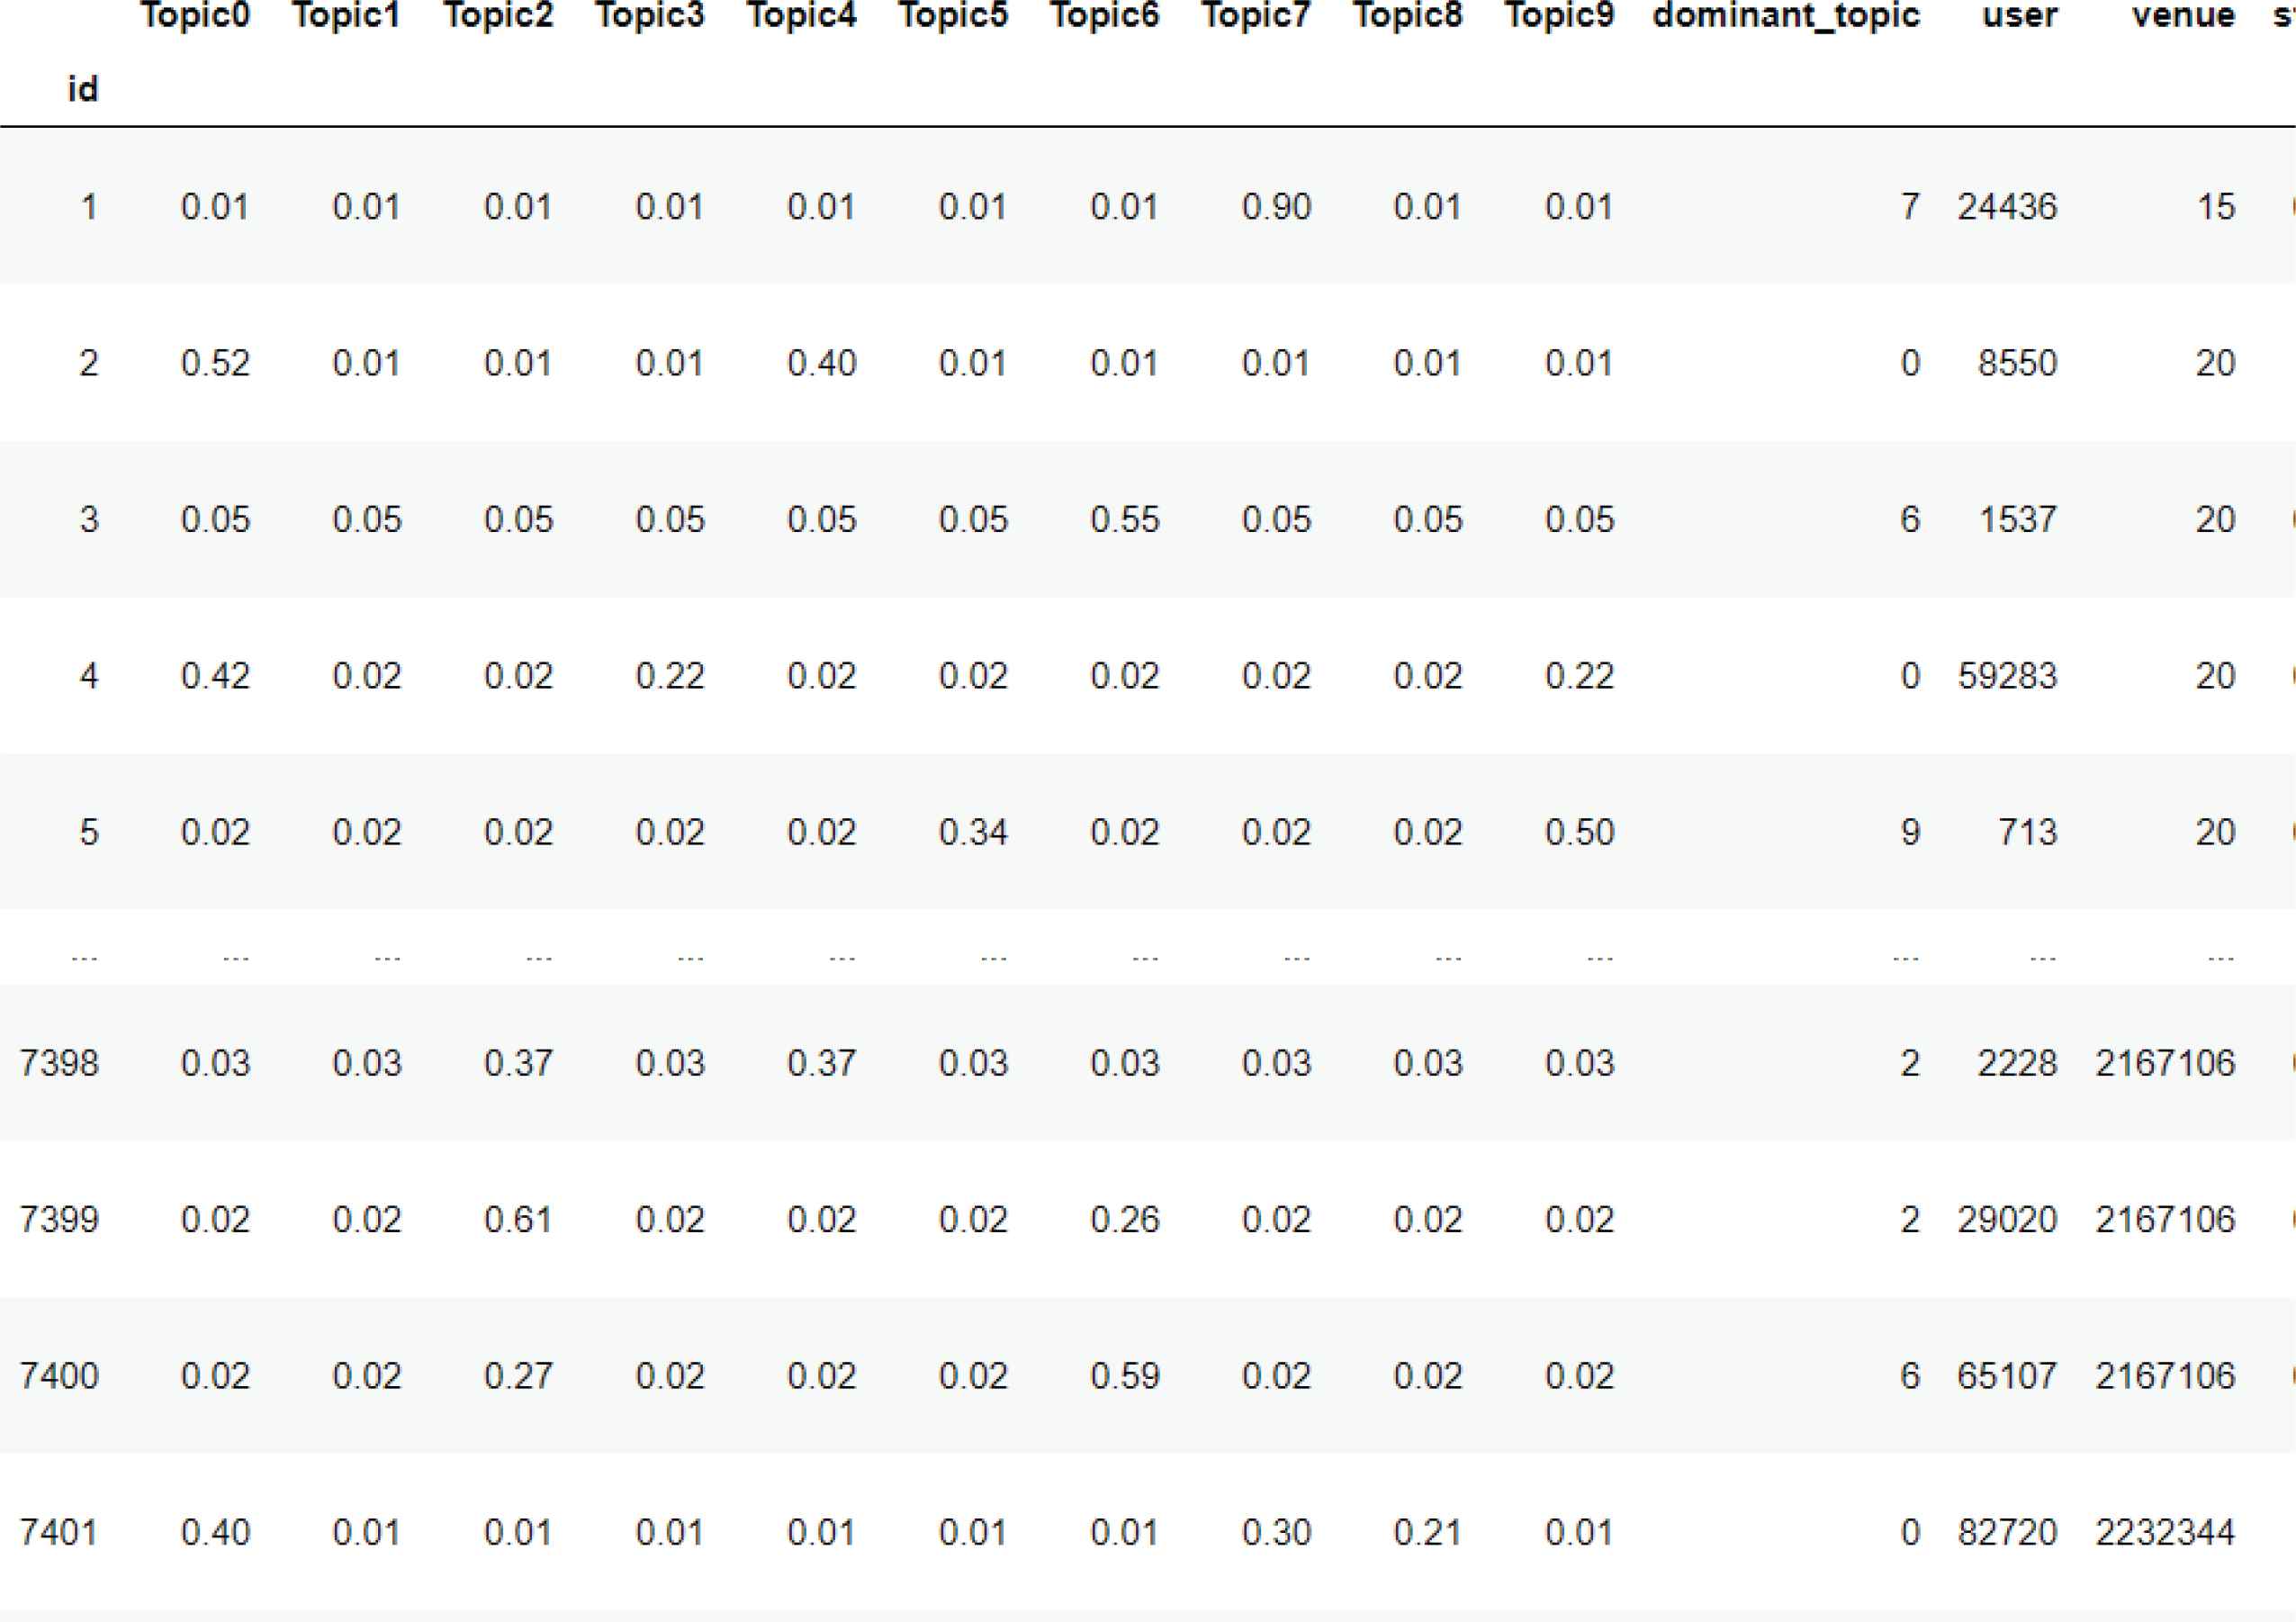
Weightage of topic for each document.
The histogram in Figure 6 presents the top 30 most salient terms from our dataset. Among all conversations in the data, Topic ‘0’ has been interacted with more than 1200 times, while the least interacted topic is “5”, which was interacted with less than 500 times. We used these topic weights for each document for our k-means experiment to properly classify the documents.
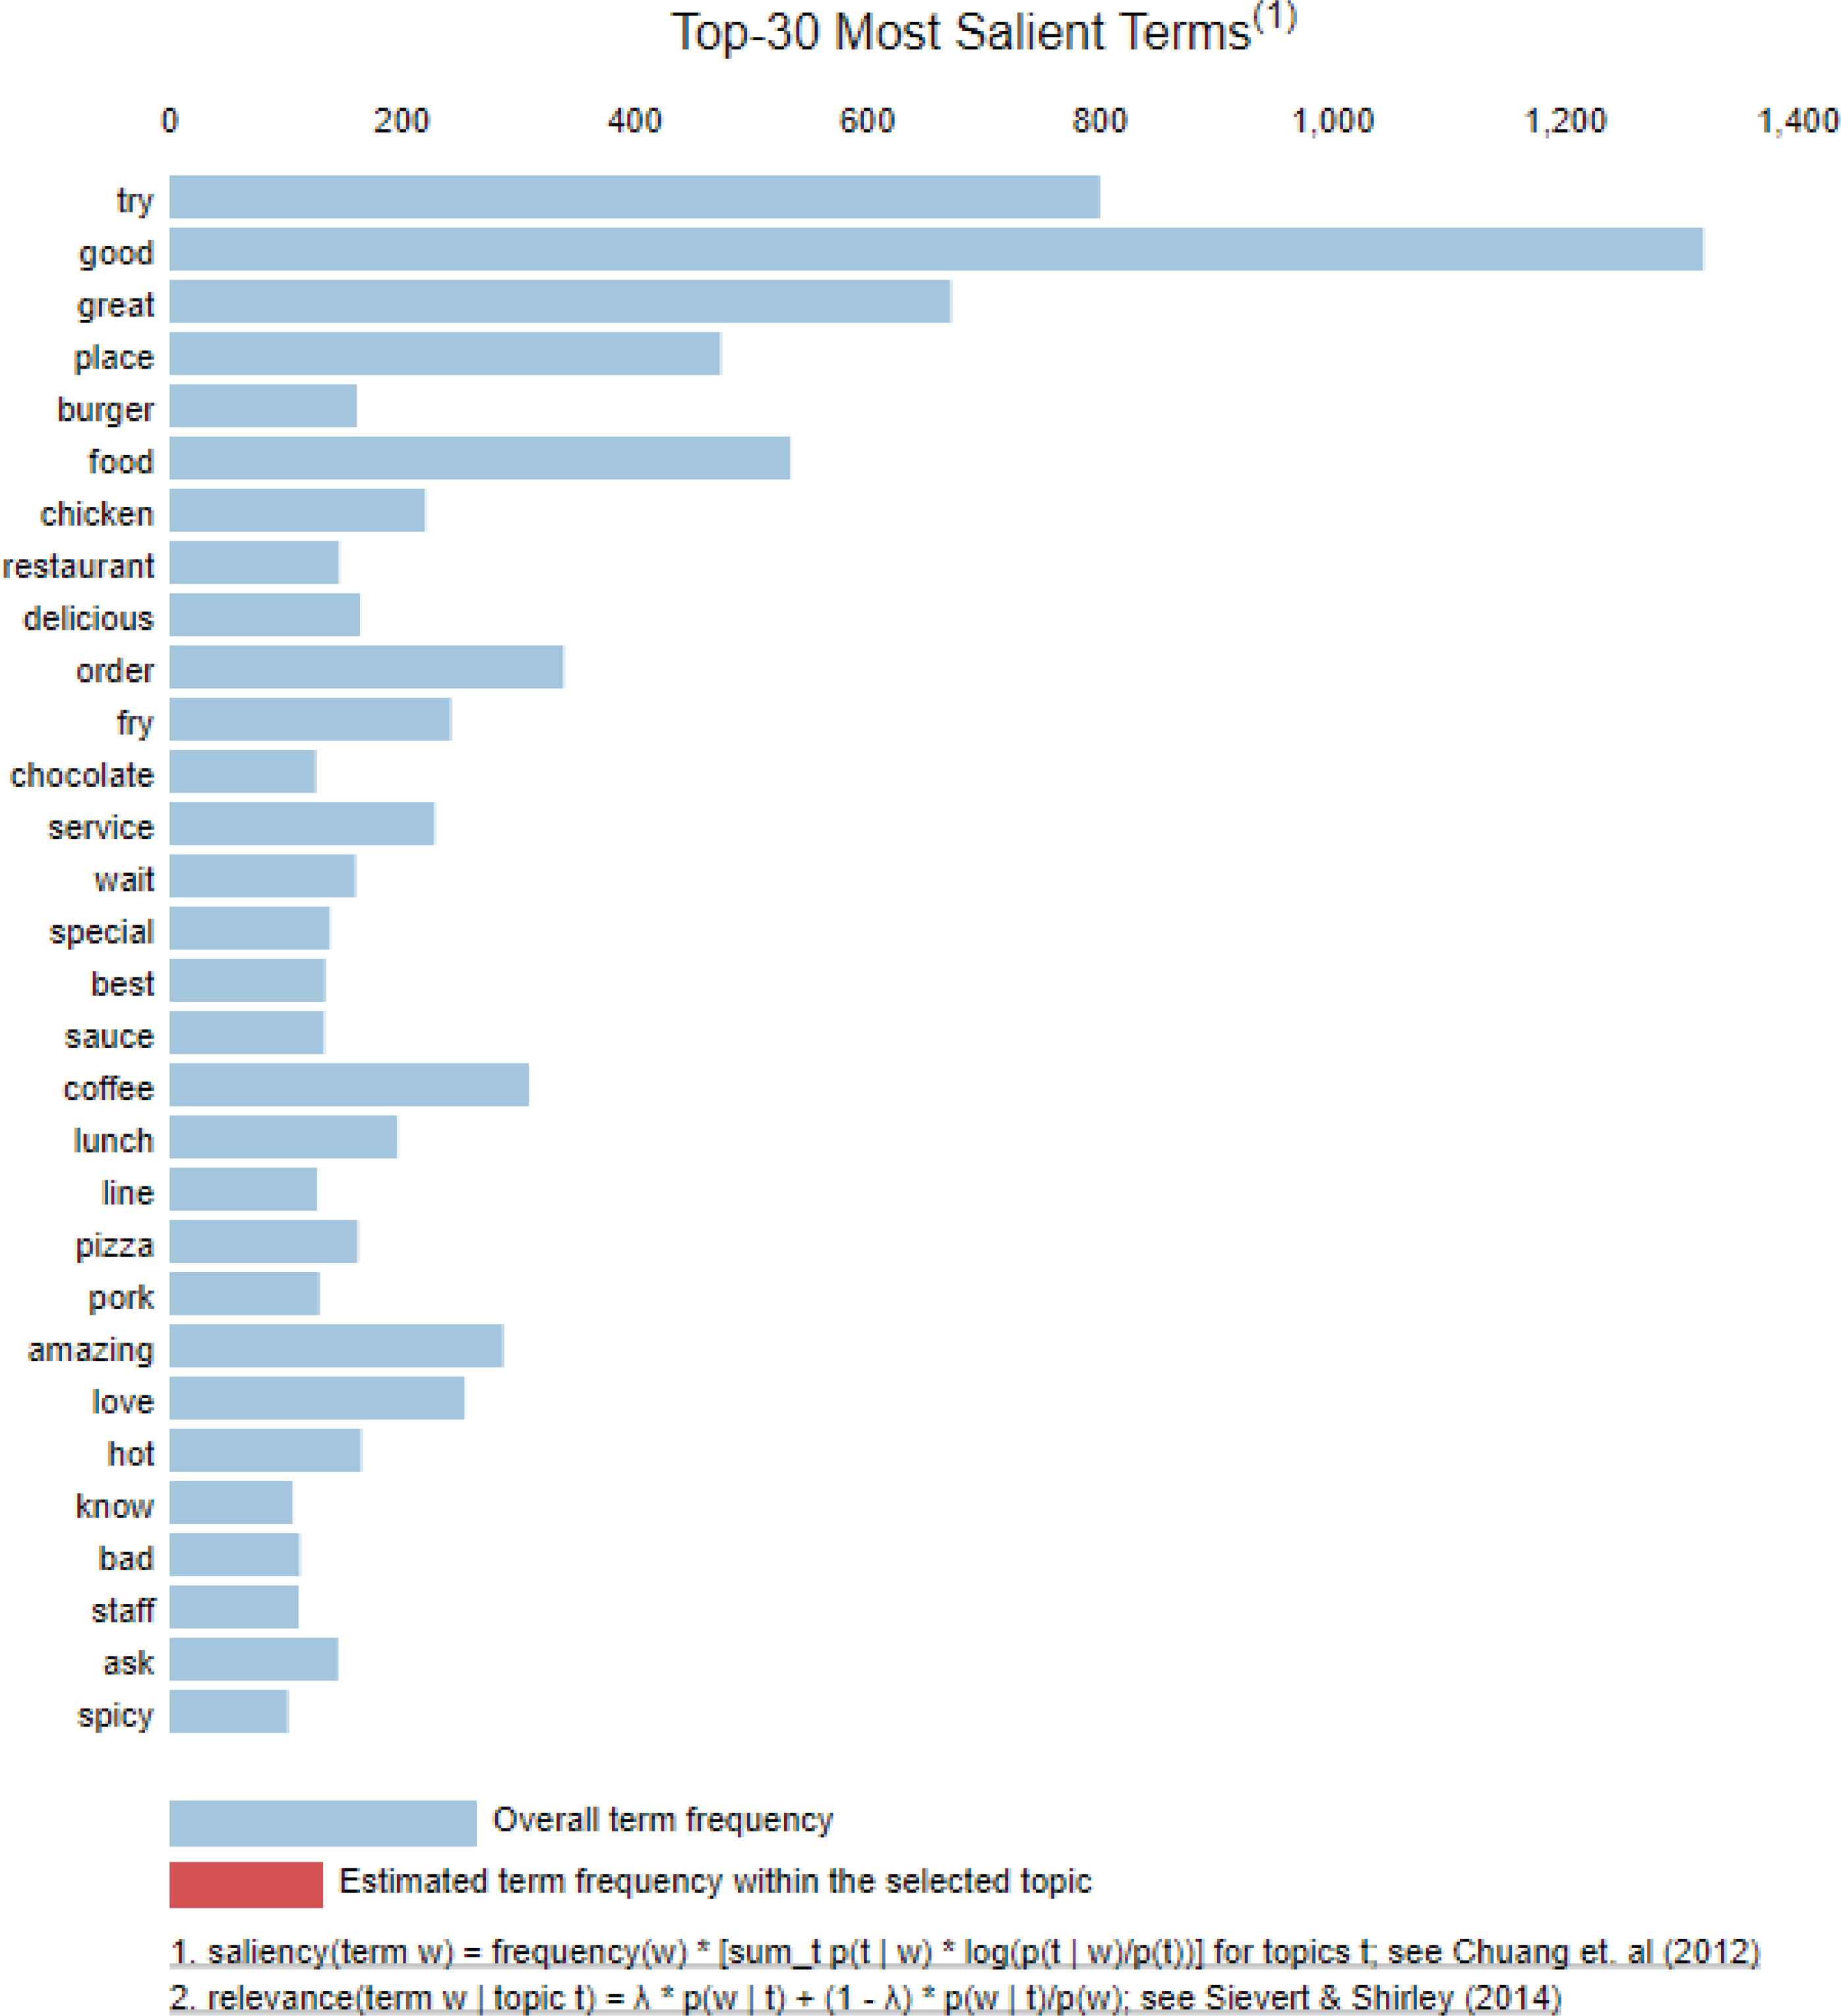
Most common words.
3.4. Document Classification Using k-Means
To categorize a document to a topic, we implement k-means clustering based on the document-topic probability matrix [11]. Since our best LDA model has 10 clusters, we set this as the number for our k-means experiment. We require theX andY axis to draw the scatter plot, which is obtained through Singular Value Decomposition (SVD) [41]. SVD on the document topic matrix object requires total components equal to 2. The combination algorithm for topic detection in the Foursquare dataset is described as follows [23]:
- 1.
Minimize the extent of the word-document matrix using SVD to form a diminished form of latent semantic-review matrix.
- 2.
Group reviews in the minimised form using k-means clustering.
- 3.
Convert the discovered centre points into the original dimension of reviews, that is, the words.
- 4.
The most heavily occurring or weighted term in each centre describe a particular topic.
All the topics were distributed evenly throughout the dataset. The results of the k-means clustering process is shown in Figure 7.
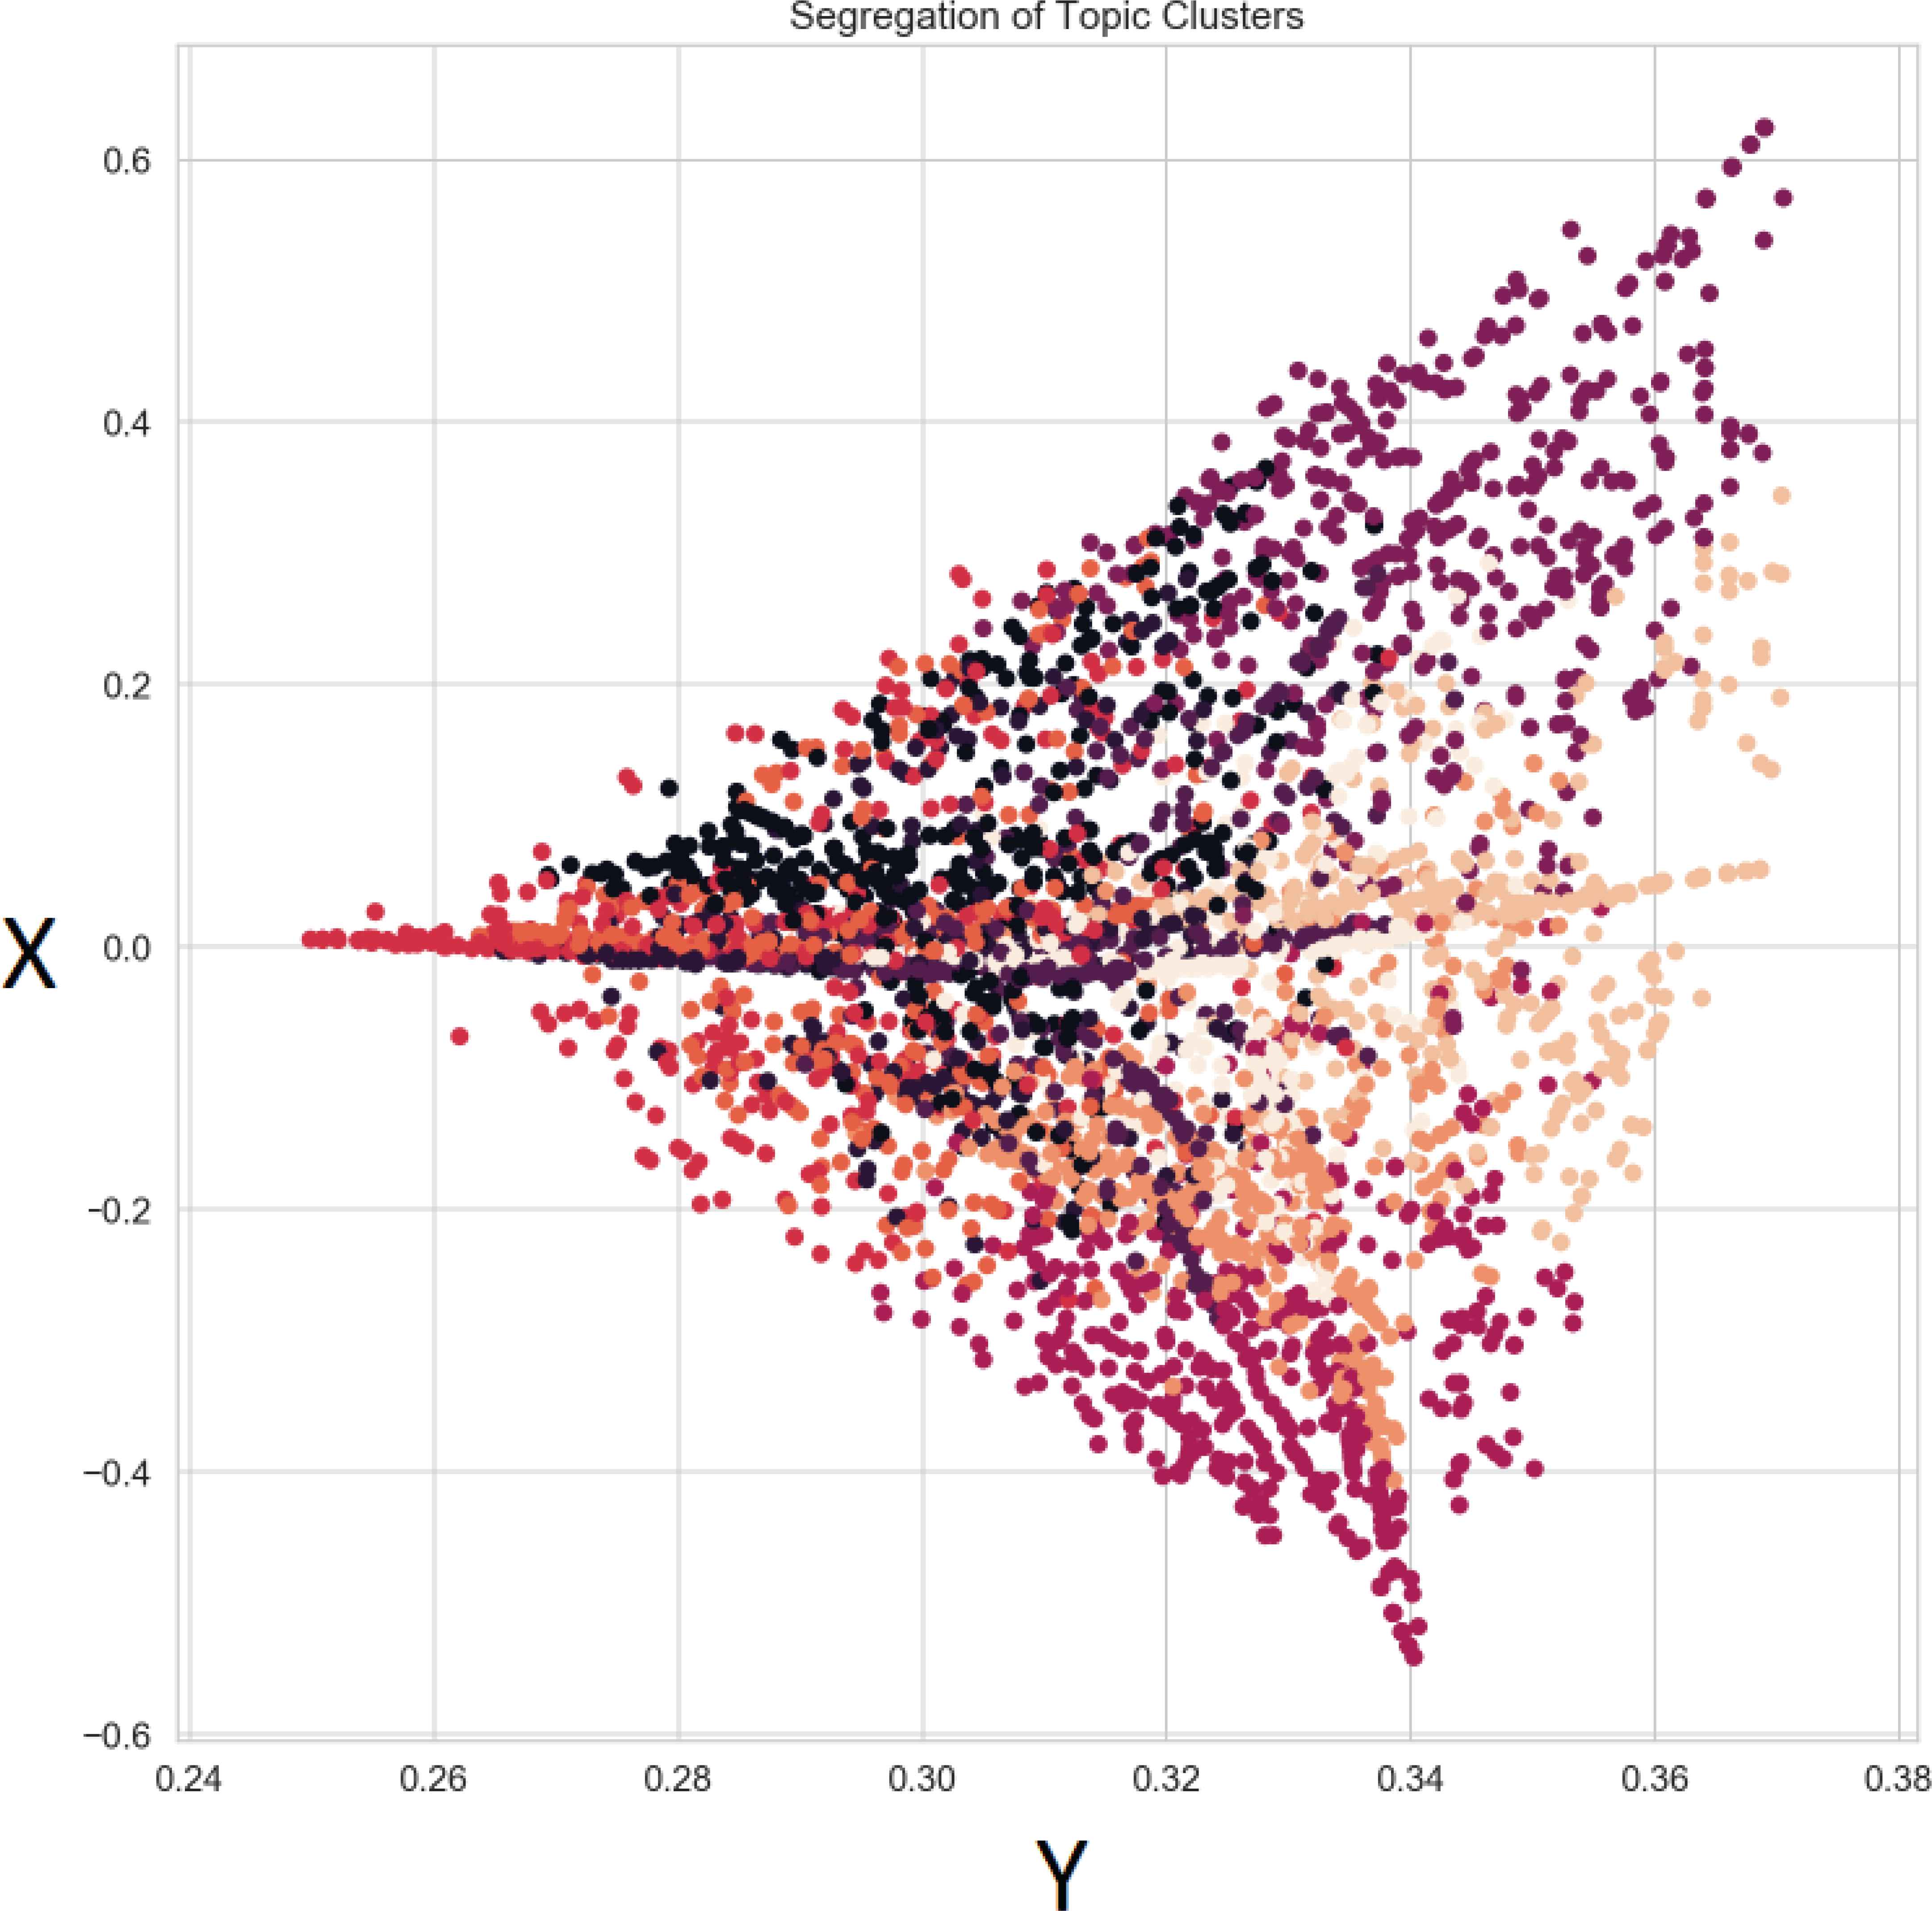
k-means clustering of data based on SVD.
4. EVALUATION
We employ an offline evaluation approach for the LBRS. We used the processed datasets discussed in 3.1, Set A and Set B, to evaluate our model. Table 3 shows the unique users and total reviews for each Set.
| Set A | Set B | |
|---|---|---|
| Unique users | 704 | 614 |
| Total reviews | 4477 | 2925 |
Details of Foursquare database
Following the guidance of Salzberg [28], data is stratified before being splitting it into k parts. Any machine learning model can only be evaluated purposefully if it is tested on unseen data. This assists us in determining if it is under-fitting, over-fitting or well-generalised. Forming test and training data through appropriate division is often not considered by researchers, and inappropriate data-splitting may lead to high difference in model performance, largely through inaccuracy. Thus, we implemented k-Fold cross validation and also injected our Set B dataset into the training set due to the sparsity of our actual training dataset to avoid the over-fitting and under-fitting problems. To apply correct data division ration for training and testing, we will apply the k-fold technique to select test and training data from the Set A for ‘k’ number of times. This technique imitates the usage of test and training sets by continuously training the algorithm k number of times.
Review data was unlabelled, so we labelled text using the emotions generated. For sentiment analysis, we passed the data to the SentiStrength model to calculate the sentiment score and label the data [32].
4.1. Baseline Models
We evaluated the proposed recommendation system that uses both topic modelling and sentiment analysis by comparing it against the performance of models built from only sentiment analysis. To measure the overall accuracy, we use the baseline models SVM, Random Forest, Logistic Regression and Naive Bayes for testing the robustness and efficiency of our new classification model. These models are selected because they are widely accepted, consistent and reliable. They were built using only sentiment score as ratings, and user and venue data as feature vectors.
4.2. Performance Measures
We used a confusion matrix to to evaluate the performance of our intended models. The following criteria was used to conduct the performance measures for our experiment:
Accuracy is a ratio of correctly anticipated outcomes to the total outcomes which help us to determine how often the classifier is correct [30].
Precision is the ratio of accurately anticipated positive outcomes to the total predicted positive outcomes [30].
Recall is the ratio of accurately anticipated true observations to the all observations in the real scenario [30].
F1 Measure is weighted mean of recall and precision [30].
4.3. Experiment
Porter Stemmer was selected for our experiment, as it is widely accepted in the discipline [10]. The dataset is divided into 5(k) nearly equal folds or segments. In these partitioned sections, training and testing is done 5 times and, in each iteration, we leave one segment for testing and train the model on the remaining 4 folds. In our case, we also merged Set B with these 4 folds to eliminate the data sparsity problem. The training set is used to train the classifier, and the test set is used to measure the performance of the predictive model. The results of the k-means evaluation is shown in Figure 8.
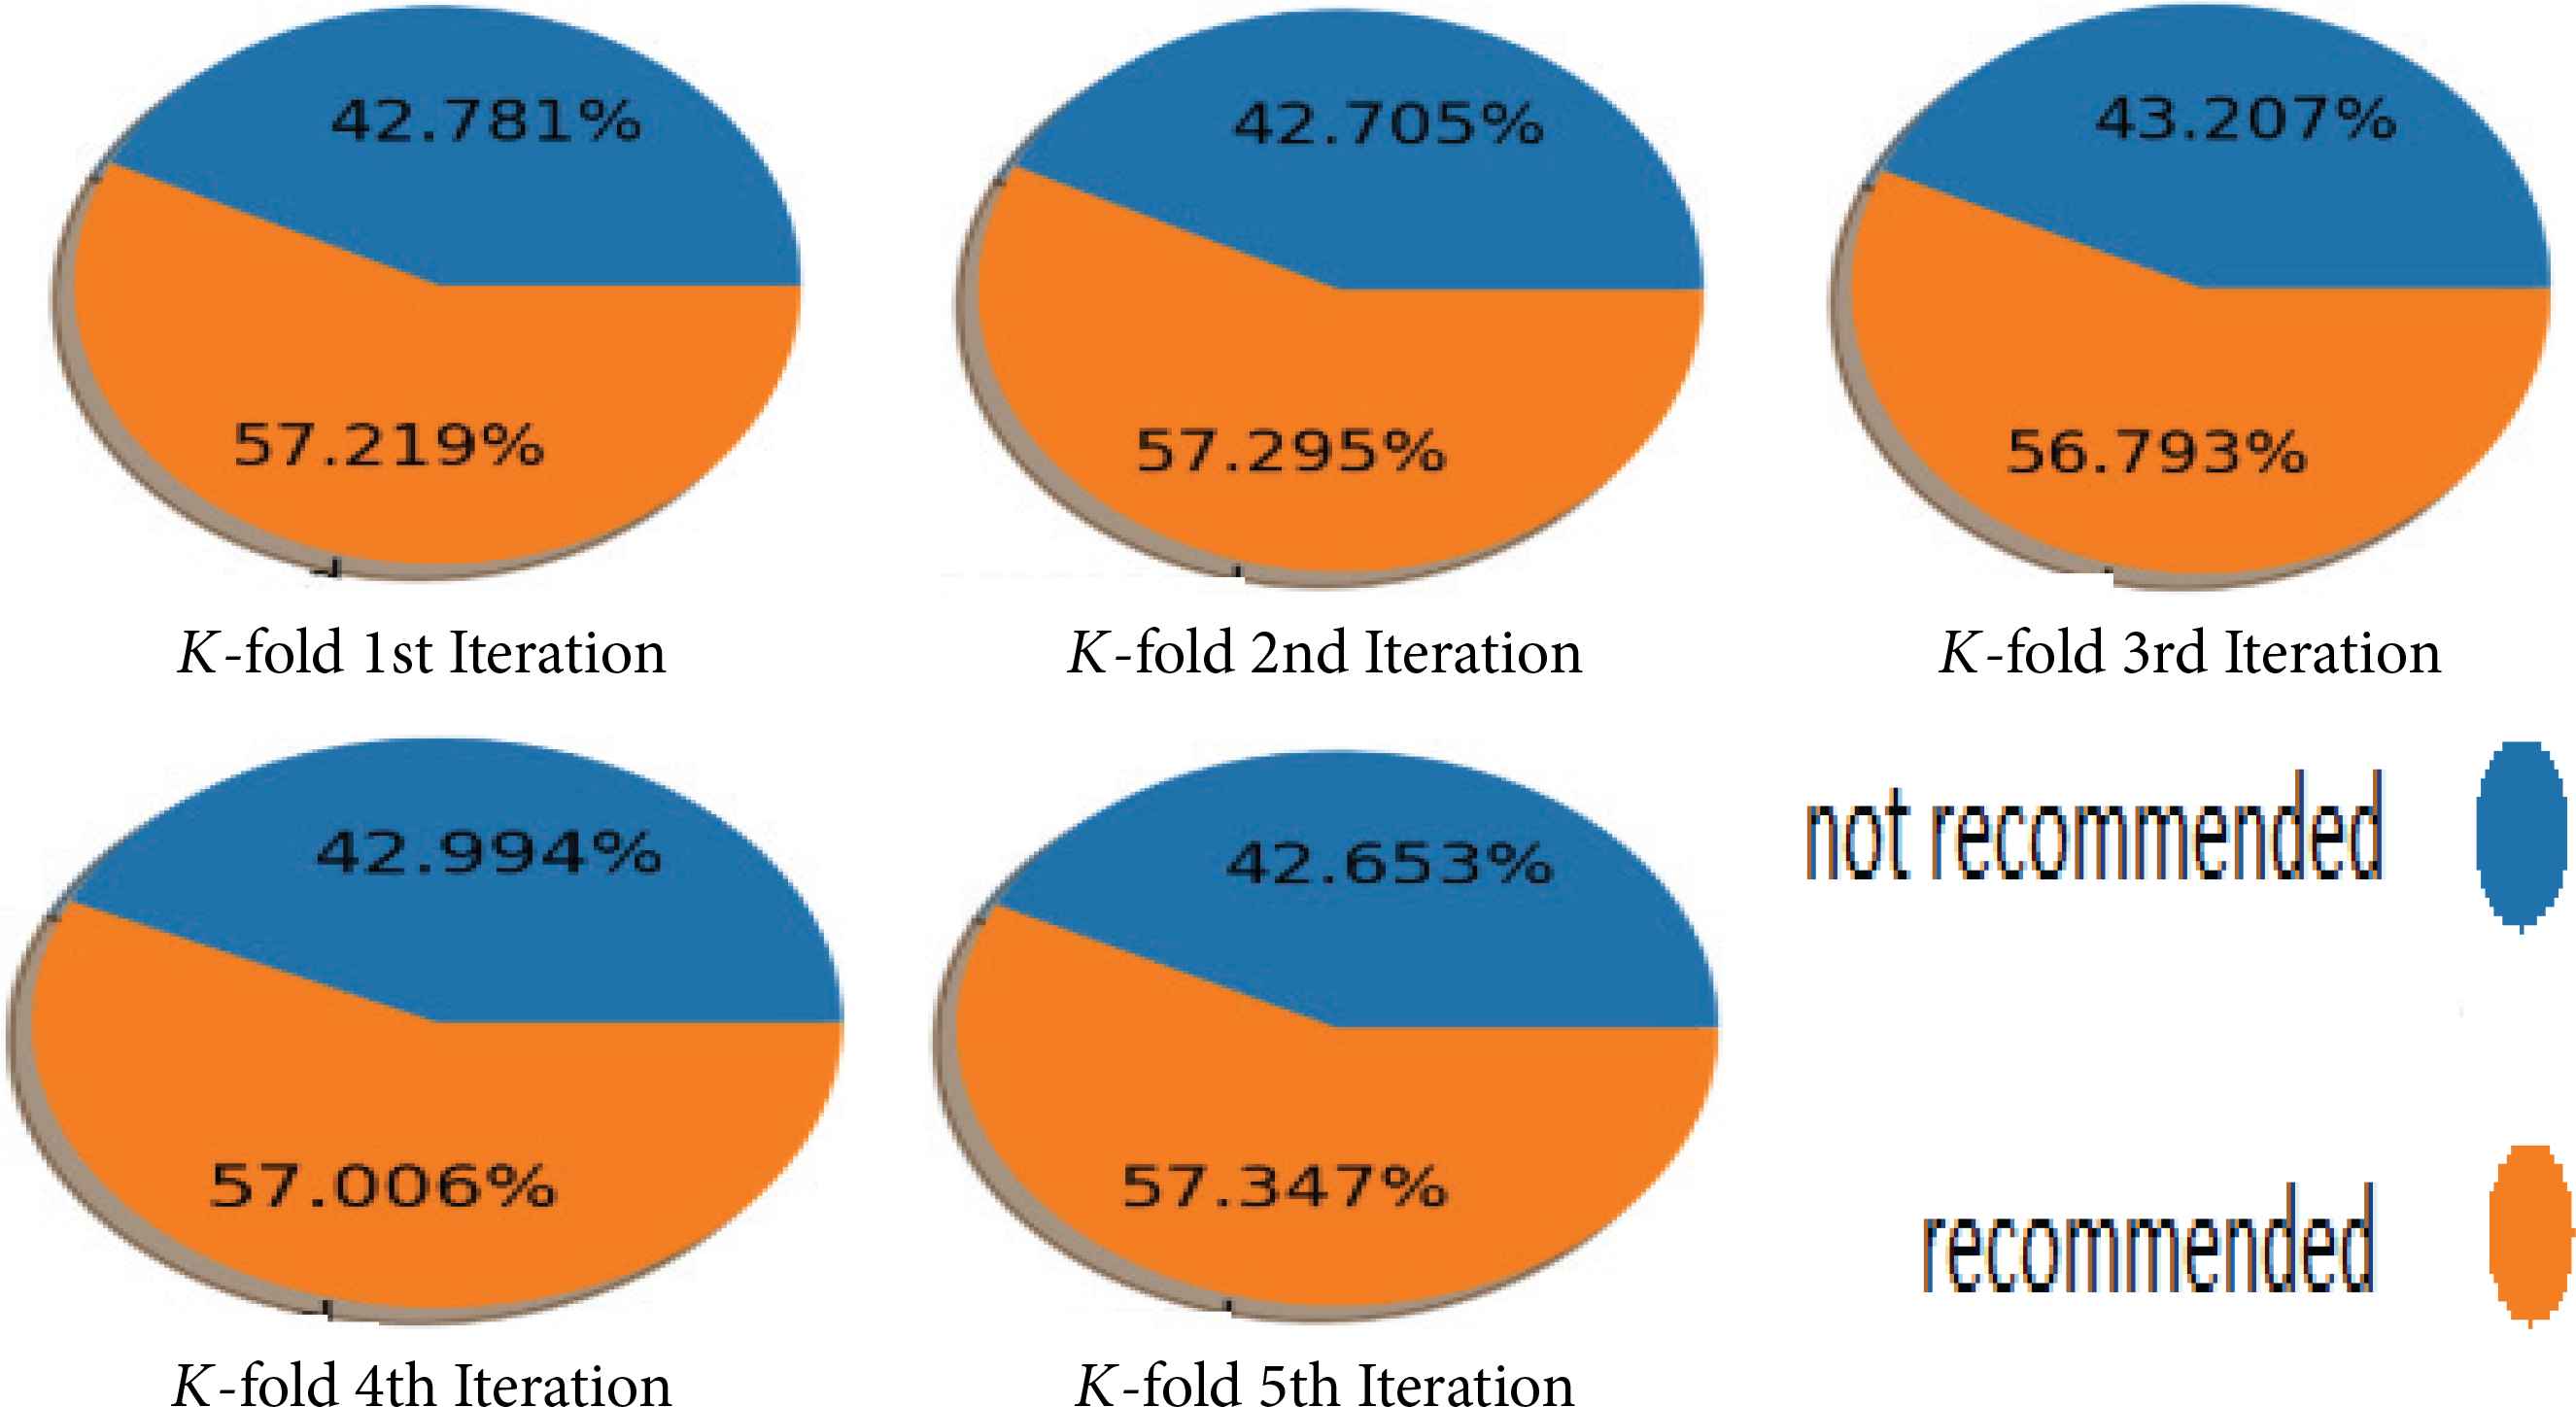
k-fold even distribution of data in each fold.
We firstly calculated the performance of different models that used only sentiment analysis. The accuracy, F1 score, precision and recall obtained in each iteration is averaged to get the model mean performance score for each metric. The results are shown in Table 4.
| Classifiers | Accuracy | F1 score | Precision | Recall |
|---|---|---|---|---|
| Naive bayes | 0.501 | 0.65 | 0.497 | 0.975 |
| Logistic regression | 0.529 | 0.483 | 0.527% | 0.457 |
| SVM | 0.559 | 0.318 | 0.87 | 0.307 |
| Random forest | 0.616 | 0.53 | 0.619 | 0.550 |
Mean score after k-fold classification with only sentiment
Random Forest performed the best for our baseline model, with 0.616 accuracy score. The F1 score of Naive Bayes is higher, but it is significantly influenced by the higher recall score. In our purposed LBRS, we focus more on precision than on recall, so despite the F1 score being high for Naive Bayes, the Precision is low compared to Random Forest. SVM has the second-best accuracy score of 0.559 and has a very good precision score of 0.87. Logistic Regression had an average performance for all the metrics.
In the second iteration of the experiment, the purposed LBRS is implemented using combined sentiment analysis and topic modelling. These results are shown in Table 5.
| Classifiers | Accuracy | F1 score | Precision | Recall % |
|---|---|---|---|---|
| Naive bayes | 0.606 | 0.63 | 0.58 | 0.686 |
| Logistic regression | 0.649 | 0.625 | 0.664 | 0.59 |
| SVM | 0.665 | 0.628 | 0.670 | 0.591 |
| Random forest | 0.675 | 0.648 | 0.686 | 0.608 |
Performance of various classifiers
As seen in Table 5, Random Forest performs well for our baseline model, with an accuracy score of 0.675, higher than any other baseline model. The weighted average of precision and recall i.e. the F1 score is also highest at 0.648. All the other classifiers performed well with our approach, producing an accuracy score of more than 0.6, which is very good for a classification model.
For performance efficiency, we use an ROC curve to plot the true positive rate (TPR) against the false positive rate (FPR) from our results. The graphs are compared in Figure 9. In the ROC graph for the baseline models, area under curve (AUC) is highest for Random Forest. Next is Logistic Regression, with a slightly better curve than the other two models, SVM and Naive Bayes. For the purposed method, all of the ROC curves were found to perform higher. But with the highest AUC, Random forest thus proved to be the best classification model using our approach.
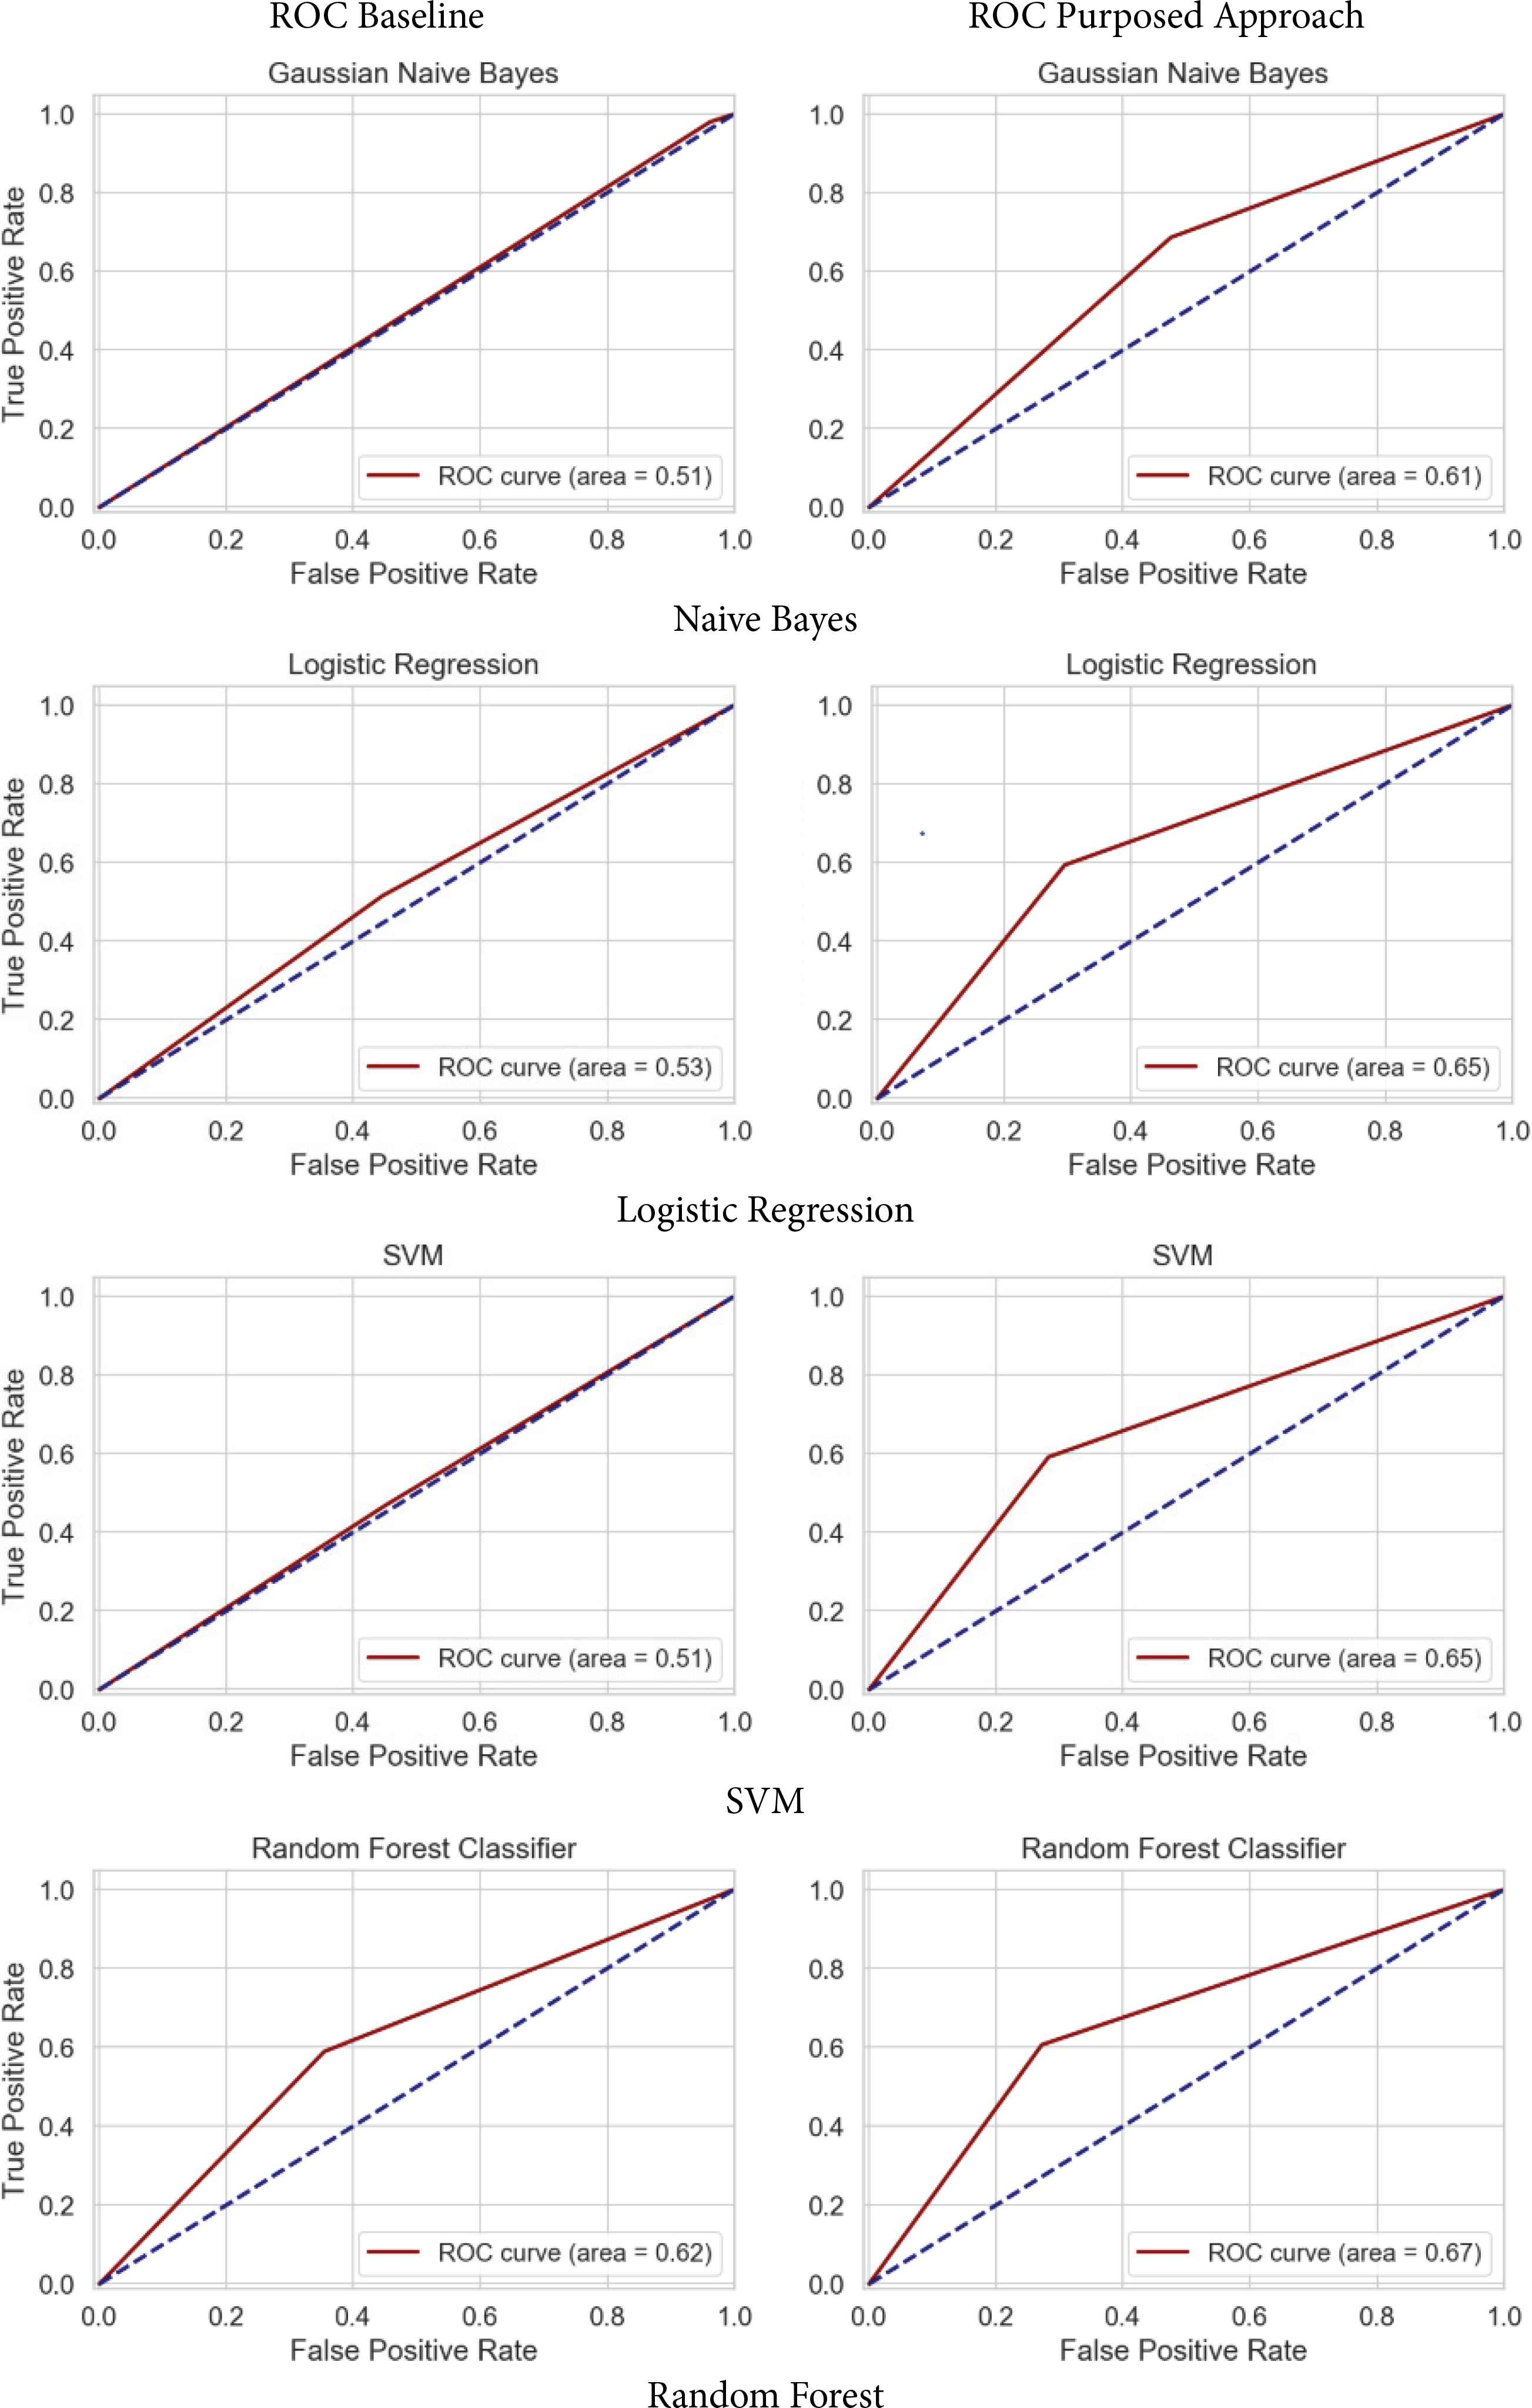
ROC curves.
We found that using sentiment score alone produced disappointing results. The low performance of sentiment in determining venue recommendations indicates that user profiles require more specific features, like interests and topics. Each classification model received a boost in performance during the experiment after the addition of topic modelling features. The highest accuracy for the hybrid model of 0.67 was obtained by Random Forest, with a 5% increase in accuracy and 9% increase in F1 score compared to its results when considering only sentiment in the training data. Precision and recall have a significant difference, meaning that our model gives more priority to a label. Especially, the Random Forest and SVM models outperformed the other models and their performance was improved in all areas compared to the baseline approaches.
In Naive Bayes, only accuracy and precision were found to be better than its baseline counterpart. However, this is not significant because in an RS, precision deals with not making any wrong recommendation whereas recall refers to not missing the right answers. Among the tested models, Random Forest has the best performance in both scenarios and was more accurate and stable than the other models overall. Compared to the models built only from sentiment analysis, our purposed LBRS shows significant improvement in all criteria of the evaluation metrics.
We can conclude that the performance of the combined model was higher than the models using sentiment analysis only. Among the various models, ROC is superior for the Random Forest classifier model, which is also the acknowledged model from evaluation metrics as well. Our results demonstrate that sentiment must be fused with topic classification for better user profiling, and tools for its analysis should be designed to generate better recommendation models. Additionally, during our experiment, we found that splitting the dataset proved a better way to balance the k-fold iterations.
5. CONCLUSION
Our proposed technique is a hybrid model implementing SentiStrength for Sentiment analysis and LDA for topic modelling to create a user profile that gives the best recommendation possible for a POI. Location reviews were collected from Foursquare, with the data labelled through sentiment analysis and fused with topic modelling to profile users according to their posting behaviour. We then used several classifiers to create a recommendation model that suggests best venues to the users. Compared to previous work that only considered user similarities, our proposed method focuses on mining semantic information like features, topics and sentiments associated with venues to generate the POI recommendation. Embedding topics is more effective than the baseline models that use sentiment score alone, as overall accuracy improved from 0.61 to 0.67 (based on our best classifier outcome using Random Forest).
This provides important insight into hybrid data mining techniques, as a combined method generates more accurate predictions. Check-in data only ranks the location as positive and negative without considering a user’s actual emotions regarding the venue, but with Sentiment analysis, we can determine a visitor’s emotion towards the venue. Practically, this enables future designers to consider review data and extract semantic features beyond check-ins when developing RS. The upshot of this research project work is the ability to group reviews in a significant way and to detect the user sentiments on the underlying category of reviews.
The limitations of this research were that we only extracted user tips from the dataset for user modelling. Future work could extend this by considering tags, geography and other features for the user profile model, which would improve recommendation effectiveness. It might be useful to profile user models according to the frequency of their visit and reviews, user similarities based on their social circle, and the propagation of their network. We could also explore the impact of users with broader travel histories and locations visited, compared to users who don’t travel as often. Considering further features may also help filter bots or spam in the reviews.
CONFLICTS OF INTEREST
The authors declare that they have no conflicts of interest.
AUTHORS’ CONTRIBUTION
Xiaohui Tao contributed in Conceptualization, Methodology, Validation, Formal analysis, Investigation, Writing. Nischal Sharma contributed in Methodology, Software, Validation, Formal analysis, Investigation, Writing. Patrick Delaney contributed in Conceptualization, Methodology, Formal analysis, Writing. Aimin Hu contributed in Conceptualization, Methodology. All authors reviewed the results and approved the final version of the manuscript.
REFERENCES
Cite this article
TY  - JOUR
AU  - Xiaohui Tao
AU  - Nischal Sharma
AU  - Patrick Delaney
AU  - Aimin Hu
PY  - 2021
DA  - 2021/07/19
TI  - Semantic Knowledge Discovery for User Profiling for Location-Based Recommender Systems
JO  - Human-Centric Intelligent Systems
SP  - 32
EP  - 42
VL  - 1
IS  - 1-2
SN  - 2667-1336
UR  - https://doi.org/10.2991/hcis.k.210704.001
DO  - 10.2991/hcis.k.210704.001
ID  - Tao2021
ER  -