
Synthesis of CdTe Quantum Dots-based Imprinting Fluorescent Nanosensor for Highly Specific and Sensitive Determination of Caffeic Acid in Apple Juices
- DOI
- 10.2991/efood.k.190802.003How to use a DOI?
- Keywords
- CdTe quantum dots; molecularly imprinted polymers; sol–gel polymerization; fluorescence detection; caffeic acid; apple juice
- Abstract
A facile method for the synthesis of molecularly imprinted polymers (MIPs) onto CdTe quantum dots (CdTe-QDs@MIPs) was successfully developed, and for the first time used as a sensitive fluorescent nanosensor for specific and rapid determination of caffeic acid (CA) in apple juices. Sol–gel polymerization was selected to fabricate hydrophilic MIPs layer using 3-(aminopropyl)triethoxysilane, tetraethyl orthosilicate, and CA as functional monomer, cross-linker and template, respectively. Under optimum experimental conditions, smaller CdTe-QDs@MIPs particles (48 nm) were synthesized with polymerization time at 2 min, which showed fast fluorescence quenching with response time at 3 min and high sensitivity with a limit of detection at 0.73 μg L−1. The fluorescence intensity of CdTe-QDs@MIPs presented excellent linearity with the concentration of CA in the range from 2 to 100 μg L−1 (R2, 0.9980). The developed method showed good repeatability with batch-to-batch relative standard deviation at 3.31%, and excellent selectivity over structural analogues. The practicability of the as-prepared CdTe-QDs@MIPs was confirmed by the analysis of CA in apple juices with satisfactory recoveries from 93.3% to 108.3%, and precisions <2.1%. Results demonstrated that a rapid, selective, and sensitive fluorescent method was successfully developed to detect CA in food samples.
- Copyright
- © 2019 International Association of Dietetic Nutrition and Safety. Publishing services by Atlantis Press International B.V.
- Open Access
- This is an open access article distributed under the CC BY-NC 4.0 license (http://creativecommons.org/licenses/by-nc/4.0/).
1. INTRODUCTION
Caffeic acid (CA) is a phenolic acid and widely distributed in fruits, vegetables, and herbs, which plays a great role in our daily diet [1]. It is of great importance to quantitatively determine CA in our daily diet because of its antioxidant, anti-inflammatory, antibacterial, antitumor, immunomodulatory, and neuroprotective effects [2,3]. To date, several analytical methods have been developed to determine CA, such as high-performance liquid chromatography (HPLC) [4], gas chromatography [5], spectrophotometry [6], electrochemical [7], and fluorometric techniques [8,9]. Although these methods present good accuracy, high precision, and sensitivity, quantification of CA is still a challenging work because of the coexistence of phenolic components with similar structures in complex matrices, and some of the modern methods are laborious, expensive, complicated, and unsuitable for rapid and/or on-site analysis. So, development of easy-to-operate, low-cost, fast, sensitive, and selective methods for assessing CA in food samples are urgently needed.
Fluorescence methods have been recently widely explored for their simple, low-cost, and sensitive characteristics. Quantum dots (QDs) are considered as one of the new promising fluorescent materials, which have been exploited in many analytical fields for the determination of various analytes due to their outstanding chemical and optical features over conventional organic fluorophores, such as facile preparation procedures, good aqueous dispersibility, superior chemical and photo stability, high photoluminescence efficiency, narrow symmetric emission profile, and excellent surface recognition ability [10,11]. Sun et al. [9] have synthesized carbon dots by the carbonization of urea and citric acid, and detected CA in red wine samples by fluorescence quenching process. Fan et al. [8] have investigated the interaction of CdTe quantum dots (CdTe-QDs) with CA and its structural similar compound, p-coumaric acid (pCA). The main limitation for the application of QDs-based fluorescence probes was their low selectivity; therefore, the surface of QDs should be modified by target-specific groups or materials to enhance specificity [8].
Molecularly imprinted polymers (MIPs) contain memory function of shape, size, and functional groups similar to template for high selectivity, which are then considered as an attractive strategy to modify the surface of QDs [12–16]. MIPs-based techniques have been developed for the selective extraction and determination of CA. Earlier, our group prepared CA-imprinted polymers as solid-phase extraction materials followed by HPLC detection [17,18]. Leite et al. [19] developed an MIPs film-based electrochemical sensor for selective determination of CA. Gültekin et al. [20] designed a CA-imprinted quartz crystal microbalance (QCM) nanosensor for selective quantification of CA. Recently, a report by Xu et al.’s [21] group covered carbon dots@MIPs for fluorescent determination of CA. MIPs are synthesized by different ways such as precipitation polymerization, bulk polymerization, suspension polymerization, and sol–gel polymerization [22–24]. It was noted that sol–gel polymerization is the most interesting method because of the simple synthesis process, water-compatible capability, and controllable particle size [25,26]. Suitable particle size of QDs@MIPs is critical to reduce the embedded recognition sites, and then gain favorable sensitivity and fast response rate [27].
In the current study, a facile and reliable fluorescence assay based on MIPs coated on the surface of CdTe-QDs (CdTe-QDs@MIPs) has been fabricated through sol–gel imprinting procedure for highly selective and sensitive determination of CA. Thioglycolic acid (TGA)-capped CdTe-QDs were produced, and then CdTe-QDs@MIPs were synthesized using 3-(aminopropyl)triethoxysilane (APTES), tetraethyl orthosilicate (TEOS), and CA as a functional monomer, cross-linker, and template, respectively. Relationships between polymerization time and particle size, fluorescence intensity, fluorescence quenching efficiency, equilibrium time, and limit of detection (LOD) for the detection of CA were exploited. The resultant CdTe-QDs@MIPs (polymerization time at 2 min, particle size at about 48 nm) were applied to detect CA in apple juices with equilibrium time within 3 min, and LOD at 0.73 μg L−1. Therefore, a rapid, selective, and sensitive method for the determination of CA was developed.
2. MATERIALS AND METHODS
2.1. Chemicals and Reagents
Tellurium powder, TGA, cadmium chloride (CdCl2·2H2O), and sodium borohydride (NaBH4) were bought from Aladdin Reagent Co., Ltd. (Shanghai, China). APTES, TEOS, anhydrous ethanol, sodium hydroxide (NaOH), and tris(hydroxymethyl)aminomethane (Tris-HCl) were purchased from Sinopharm Chemical Reagent Co., Ltd. (Shanghai, China). Standards, pCA, 4-hydroxybenzoic acid (4-HBA), vanillic acid (VA), ferulic acid (FA), CA, protocatechuic acid (PCA), and chlorogenic acid (CGA) were supplied by Xiya Reagent Co., Ltd. (Chengdu, China). All reagents were of analytical grade, used without any further treatment, and all stock solutions were prepared with ultrapure water (18.2 MΩ) from a Milli-Q water purification system (Millipore, Bedford, MA, USA).
2.2. Instrumentation
Fluorescence experiments were operated on an LS-55 fluorescence spectrometer (PerkinElmer Ltd., Washington, USA), and a Fluo Time 100 fluorescence spectrometer (PicoQuant, Germany). UV–Vis absorption spectra were accomplished on a UV-2600 spectrometer (Shimadzu, Tokyo, Japan). A Nicolet-Avatar 360 Fourier transform infrared (FTIR) spectrometer within the wavenumber from 400 to 4000 cm−1 was selected to study the functional groups. The size, structure, and morphology of CdTe-QDs@MIPs were carried out on a Tecnai G2 20S-Twin transmission electron microscope (TEM, FEI, Prague, Czech Republic). The average values of the particle size and polydispersity of microspheres were acquired on a particle size analysis (PSA) (Malvern Instruments Ltd., Malvern, UK), and 100 particles were used in the analysis process.
High-performance liquid chromatography analysis was operated on an Agilent 1260 HPLC system (Agilent Technologies, Santa Clara, CA, USA). Apple juice samples were separated on a Waters SunFire-C18 chromatographic column (250 × 4.6 mm2 i.d., 5 μm, Waters, Milford, MA, USA). Mobile phase consisting of 0.1% acetic acid/acetonitrile (85/15, v/v) was isocratic eluted with a flow rate of 0.8 mL min−1. Detection wavelength was set at 325 nm, column temperature was at 25°C, and injection volume was 20 μL.
2.3. Synthesis of CdTe-QDs@MIPs
The schematic illustration for fabrication of CdTe-QDs@MIPs was presented in Figure S1. First, TGA-capped CdTe-QDs were synthesized using a method modified from an earlier report [27]. In detail, 30.7 mg of CdCl2·2H2O and 70 μL of TGA were dissolved in 100 mL of water, and subsequently 0.5 mol L−1 of NaOH solution was selected to adjust pH to 9.0. Simultaneously, 25.5 mg of tellurium powder and 30.3 mg of NaBH4 were mixed in 2.0 mL of water, and continuously stirred under nitrogen atmosphere for 3 h to prepare NaHTe solution. The abovementioned two solutions were then rapidly blended and refluxed at 90°C for 13 h to obtain TGA-capped CdTe-QDs solution. For the synthesis of CdTe-QDs@MIPs, sol–gel polymerization was used. Briefly, 0.5 mg of CA, 4 mL of ethanol, 1 mL of H2O, and 20 μL of APTES were mixed and stirred at room temperature for 30 min. After that, 10 mL of TGA-capped CdTe-QDs solution and 10 μL of TEOS were added and continuously stirred for 1, 2, 3, 5, 10, or 15 min. Mixtures were centrifuged at 9000 rpm for 1 min. The resultant precipitate was washed with ethanol to remove CA until no CA was detected by UV–Vis spectrometry. Correspondingly, CdTe-QDs@non-imprinted polymers (CdTe-QDs@NIPs) were prepared with the same procedures as described for CdTe-QDs@MIPs in the absence of CA. Finally, the resultant CdTe-QDs@MIPs and CdTe-QDs@NIPs were dried under vacuum for 1 h and kept in a refrigerator at 4°C for subsequent experiments.
2.4. Fluorescence Measurements
Fluorescence spectroscopy was acquired under the same conditions, excitation wavelength at 380 nm, excitation and emission slit width at 10 nm, photomultiplier tube voltage at 900 V, and spectral range at 550−650 nm. For determination of CA, 0.3 mL of CdTe-QDs@MIPs or CdTe-QDs@NIPs solution (0.1 mg mL−1), 2.7 mL of Tris-HCl buffer (10 mM, pH 8.0), and 30 μL of CA standard solution (0–10.0 mg L−1) were mixed and incubated for 3 min at room temperature to record fluorescence spectra, and fluorescence intensities were recorded at 600 nm. Experiments were conducted in triplicate to calculate average data.
2.5. Determination of CA in Apple Juices
Two brands of apple juices (Huiyuan apple juice, Beijing Huiyuan Beverage and Food Co., Ltd., China; Huierkang apple juice, Xiameng Huierkang Food Co., Ltd., China) were bought from the local supermarket in Changsha. Apple juices were filtered through a 0.22 μm polytetrafluoroethylene syringe filter, and then, 30 μL of apple juices, 0.3 mL of CdTe-QDs@MIPs solution, and 2.7 mL of Tris-HCl buffer (10 mM, pH 8.0) were mixed, incubated for 3 min, and then detected.
3. RESULTS AND DISCUSSION
3.1. Synthesis and Characterization of CdTe-QDs@MIPs
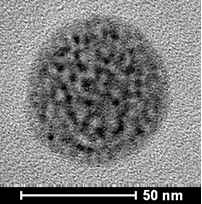
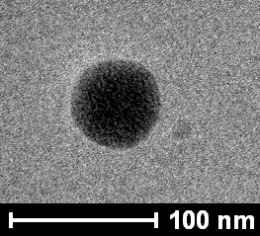
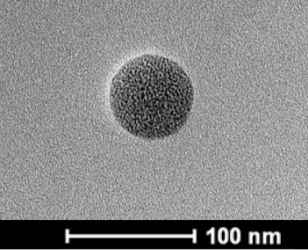
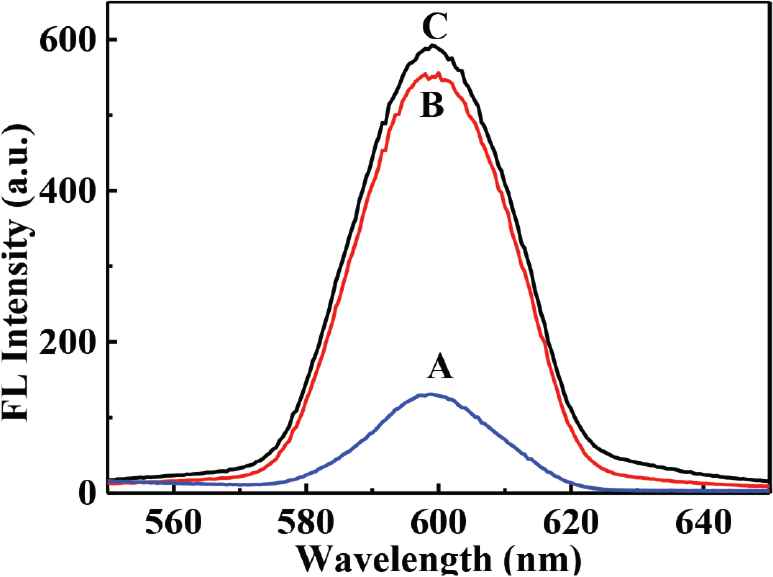
As is shown in Figure S1, surface MIPs are synthesized by sol–gel polymerization. The pKa1 and pKa2 values of CA are 4.49 and 7.64, and that of APTES is around 9.6. Therefore, at neutral condition, carboxyl group in CA is deprotonated, and the amino group in APTES can interact with hydroxyl and carboxyl groups in CA through electrostatic interaction and hydrogen bonds to form prepolymerization complex, and then hydrolysis and condensation reactions of APTES and TEOS happen to imprint CA in the composites. After the removal of CA, recognition sites are formed. As presented in Table 1, particle size increases with the increase of polymerization time. Figure 1 presents the morphology and particle size of CdTe-QDs@MIPs when the polymerization time is 2 min, which presents monodisperse particles with an average diameter of 48 nm, and high amounts of CdTe-QDs are uniformly trapped into MIPs layer. The maximum emission of CdTe-QDs@MIPs is about 600 nm when excited at 380 nm, the fluorescence intensity of CdTe-QDs@MIPs after the addition of CA is relatively weak, and restores to 93.0% that of CdTe-QDs@NIPs (Figure S2). These results indicate that CdTe-QDs@MIPs with CA recognition have been successfully synthesized, and template CA has been almost removed from the recognition sites.
| Polymerization time (min) | 1 | 2 | 3 | 5 | 10 | 15 |
|---|---|---|---|---|---|---|
| TEM |  |
 |
 |
 |
 |
 |
| Average particle size (nm) | 15 | 48 | 55 | 59 | 65 | 70 |
| Incubation time (min) | 3 | 3 | 5 | 7 | 10 | 12 |
| LOD (μg L−1) | 0.89 | 0.73 | 0.95 | 2.53 | 3.25 | 3.56 |
LOD, limit of detection; CA, caffeic acid; TEM, transmission electron microscope.
Effects of polymerization time on the particle size, incubation time, and LOD of CdTe-QDs@MIPs for detection of CA
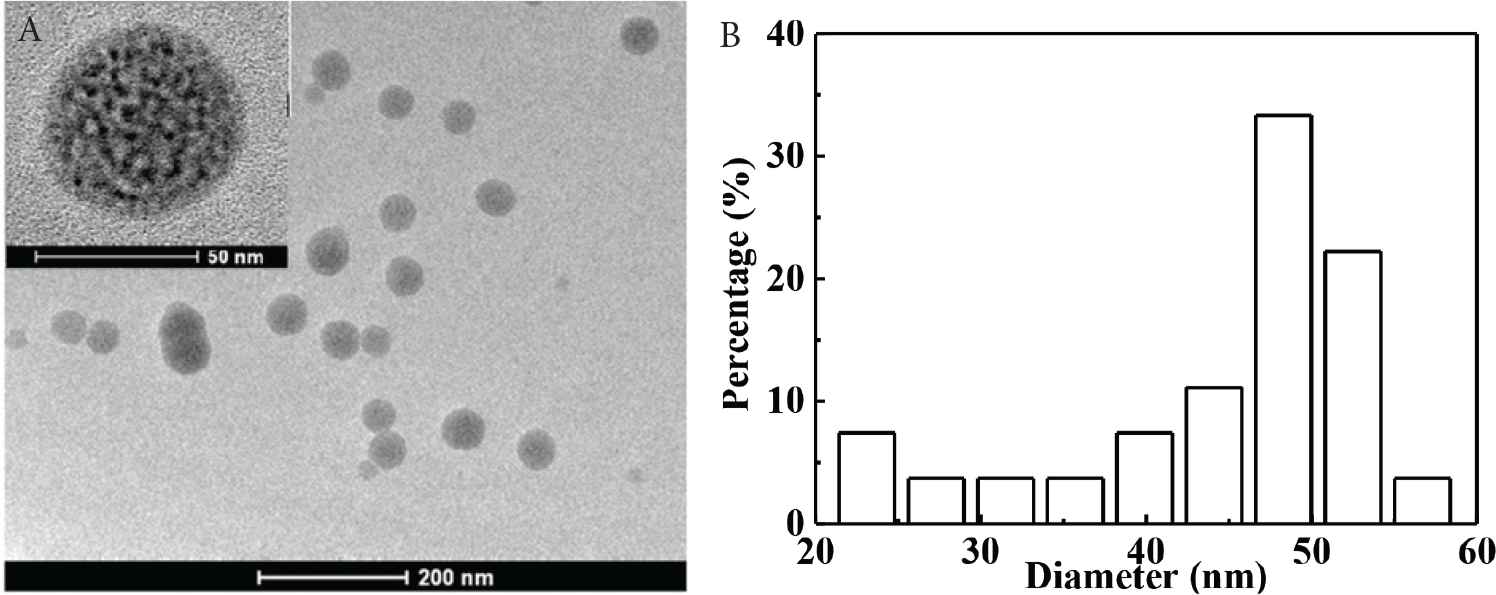
TEM image (50 nm for the inset) (A) and PSA histogram (B) of CdTe-QDs@MIPs with polymerization time at 2 min. PSA, particle size analysis.
Molar ratio of template–functional monomer–crosslinker is important to affect the recognition ability of MIPs [17]. CdTe-QDs@MIPs with different ratios of CA:APTES:TEOS (1:17:16–1:85:16) have been prepared, and the maximum fluorescence intensity and highest quenching efficiency by the addition of CA are obtained when the molar ratio of CA:APTES:TEOS is at 1:34:16 (Figure 2A). Moreover, appropriate particle size must be controlled to reduce embedded recognition sites, and provide high binding efficiency [26]. As is shown in Figure 2B, fluorescence intensity of CdTe-QDs@MIPs decreases with the increase of polymerization time perhaps because of the deeper embedded CdTe-QDs and recognition sites, and the highest quenching efficiency of CA presents with polymerization time at 2 min.
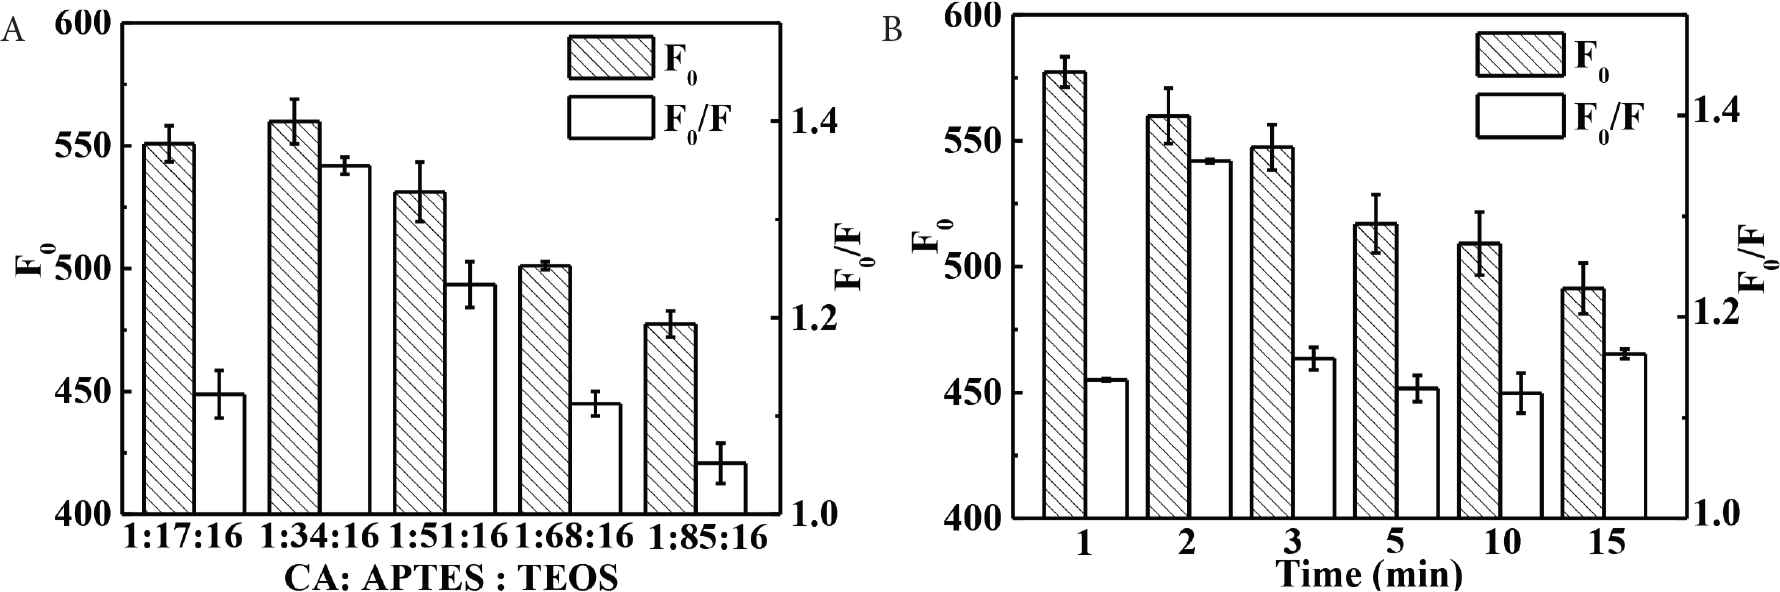
Effect of the ratio of CA:APTES:TEOS (A) and polymerization time (B) on the fluorescence response and quenching efficiency of CdTe-QDs@MIPs (concentration of CA at 10 μg L−1). CA, caffeic acid; APTES, 3-(aminopropyl)triethoxysilane; TEOS, tetraethyl orthosilicate; QD, quantum dot; MIP, molecularly imprinted polymer.
Fourier transform infrared spectra has been used to characterize CdTe-QDs@MIPs (Figure 3). The main absorption bands for TGA-modified CdTe-QDs are located at 1211 cm−1 (O––H stretching), 1403 cm−1 (C==O stretching), and 1581 cm−1 (deformation vibration of carboxylic group), respectively (Figure 3A). Also, for CdTe-QDs@MIPs, the specific peaks at 1035 cm−1 (asymmetric stretching of Si–O–Si) and 772 cm−1 (bending vibration of Si–O) indicate successful sol–gel polymerization (Figure 3B).
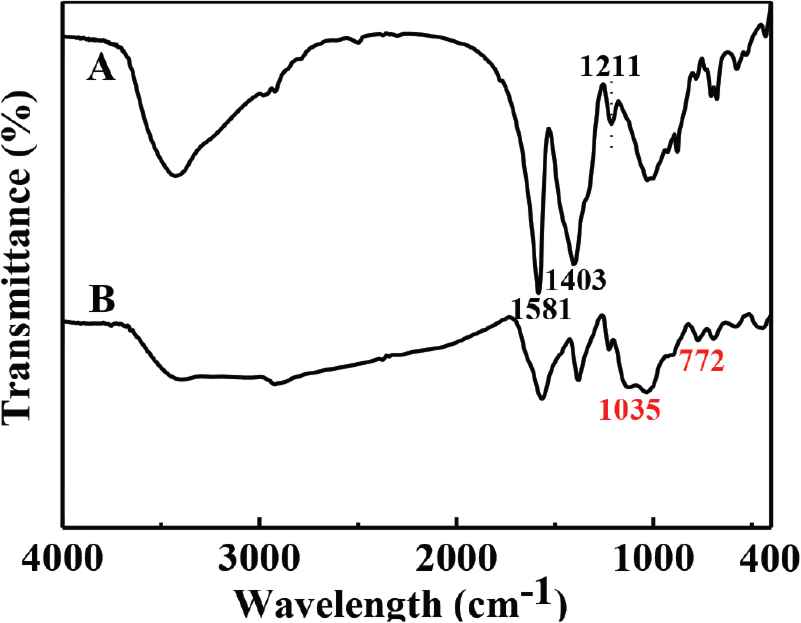
FTIR spectra of TGA-capped CdTe-QDs (A), and CdTe-QDs@MIPs (B). FTIR, Fourier transform infrared; TGA, thioglycolic acid; QD, quantum dot; MIP, molecularly imprinted polymer.
3.2. Sensing Mechanism of CdTe-QDs@MIPs
As is shown in Figure 4A, fluorescence lifetime of CdTe-QDs@MIPs is 15.56 ± 0.94 ns, which reduces to 12.28 ± 0.77 ns after the addition of CA. The reduced fluorescence lifetime suggests that energy or charge transfer should happen between CdTe-QDs and CA [28]. Maximum adsorption bands for CA are 254 and 326 nm, which are close to the band gap of CdTe-QDs [27], and far away from the emission spectrum (600 nm) of CdTe-QDs@MIPs (Figure 4B). Therefore, charges in the conduction band of CdTe-QDs can transfer to the lowest unoccupied molecular orbital of CA, and energy resonance transfer is not the possible quenching mechanism. Furthermore, hydroxyl and carboxyl groups in CA can interact with amino group in APTES through electrostatic interaction and hydrogen bond; therefore, it is concluded that the observed fluorescence quenching is attributed to the charge transfer between CA and CdTe-QDs.
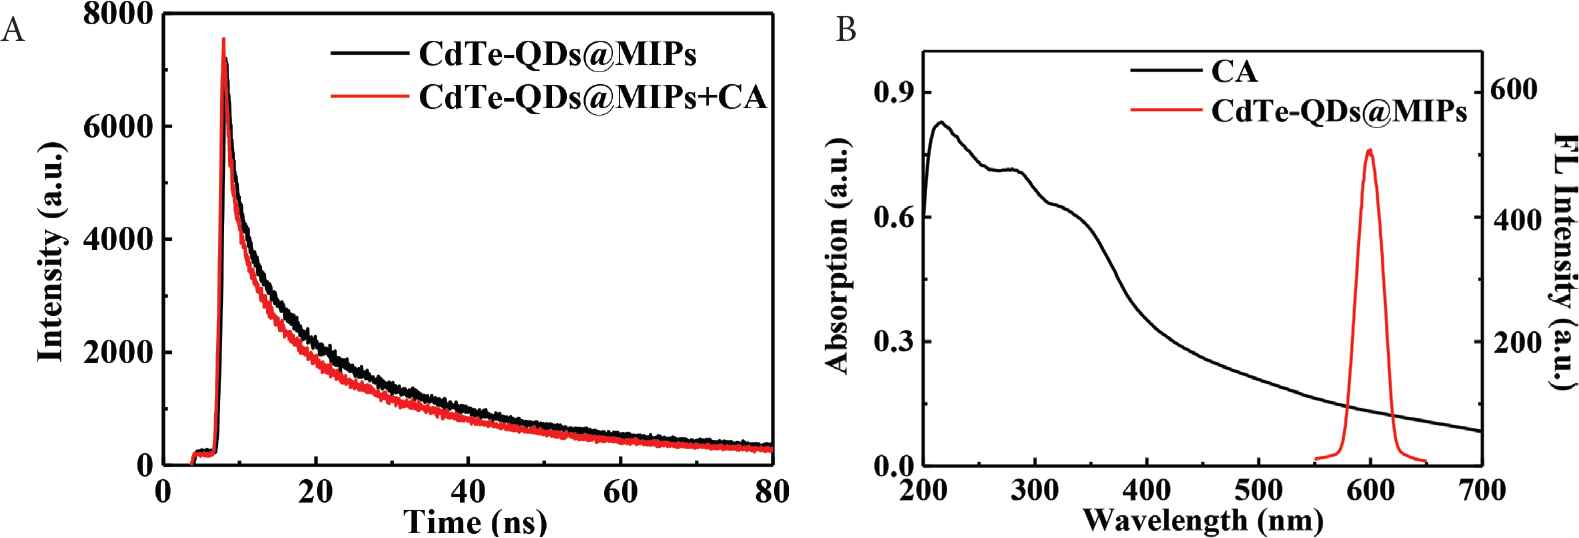
Fluorescence lifetime spectra of CdTe-QDs@MIPs in the absence and presence of CA (A). UV–Vis absorption spectrum of CA and fluorescence emission spectrum of CdTe-QDs@MIPs (B). CA, caffeic acid; QD, quantum dot; MIP, molecularly imprinted polymer.
3.3. Optimization of Determination Conditions for CA
The main factors, such as the amount of CdTe-QDs@MIPs, pH, and response time, affecting the fluorescence intensity and quenching efficiency have been optimized to improve sensitivity. Different amounts of CdTe-QDs@MIPs has been first investigated. Figure 5A indicates that fluorescence intensity increases with the increase in CdTe-QDs@MIPs concentrations from 20 to 100 μg mL−1, then provides no significant difference from 100 to 300 μg mL−1, and the highest quenching efficiency is achieved with CdTe-QDs@MIPs concentration at 100 μg mL−1. Lower CdTe-QDs@MIPs concentration results in lower fluorescence intensity and narrow linear range, whereas higher CdTe-QDs@MIPs concentration reduces slight agglomeration and then results in low sensitivity [29]. Therefore, CdTe-QDs@MIPs concentration has been optimized as 100 μg mL−1. pH from 6.0 to 9.0 has done to investigate the effect of pH (Figure 5B). Fluorescence intensity of CdTe-QDs@MIPs and quenching efficiency after the addition of CA increases by increasing the pH from 6.0 to 8.0, and then decreases from 8.0 to 9.0. Accordingly, 8.0 has been chosen as the best pH value. A certain time is required to allow an efficient recognition interaction between CA and CdTe-QDs@MIPs. As illustrated in Figure 5C, quenching efficiency of CdTe-QDs@MIPs increases sharply at first, and then shows stabilizes after 3 min incubation. Therefore, incubation time has been set at 3 min, which indicates that CdTe-QDs@MIPs can be used to rapidly detect CA in aqueous solution. Earlier, the incubation time for QDs@MIPs with particle size over 200 nm (polycondensation time from 6 to 16 h) was 30–60 min [27]. From Table 1, we can also see that incubation times are 3, 3, 5, 7, 10, and 12 min for CdTe-QDs@MIPs with polymerization time at 1, 2, 3, 5, 10, and 15 min. The fast mass transfer rate is assigned to CdTe-QDs@MIPs with smaller particle size where recognition sites is easily entered for binding.
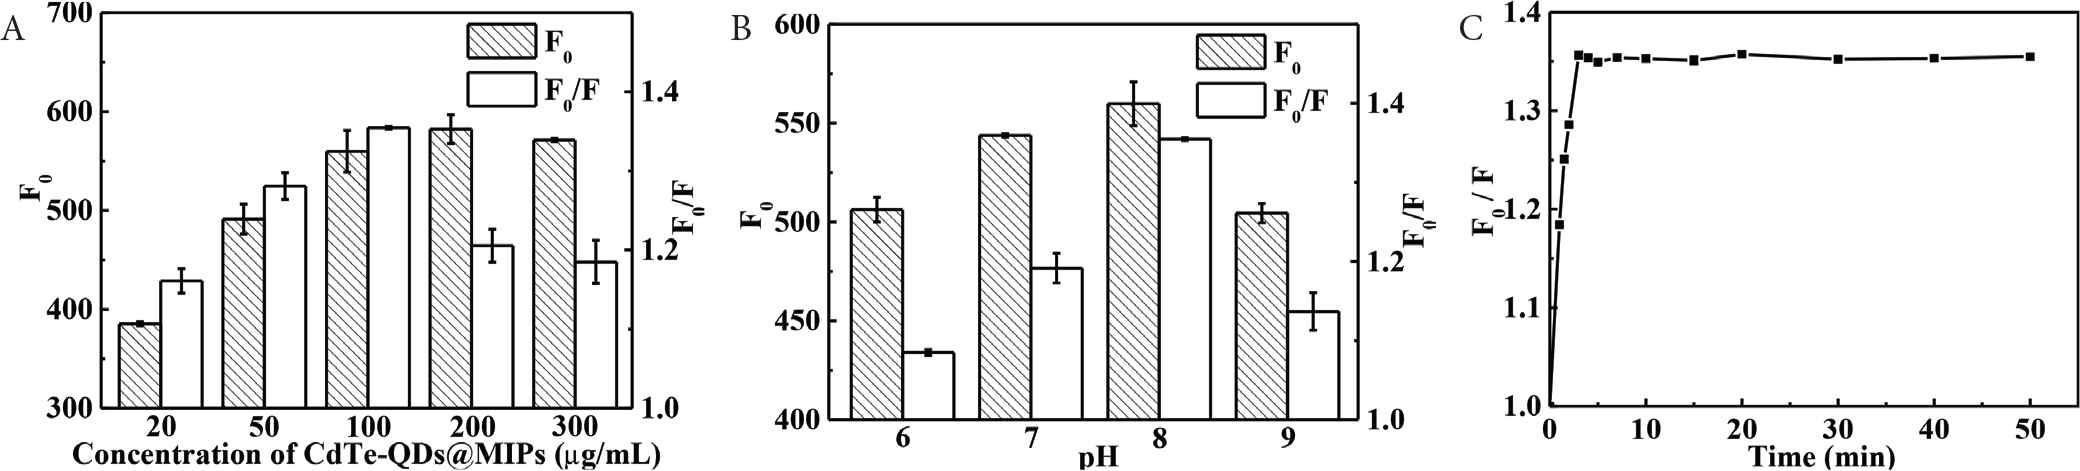
Effect of the amount of CdTe-QDs@MIPs (A), pH (B), and incubation time (C) on the response of CdTe-QDs@MIPs to CA (concentration of CA at 10 μg L−1). CA, caffeic acid; QD, quantum dot; MIP, molecularly imprinted polymer.
3.4. Specificity and Stability Study
Six structural analogues (FA, CGA, pCA, VA, 4-HBA, and PCA) with concentration at 10 μg L−1 have been used to investigate their fluorescence response to CdTe-QDs@MIPs and CdTe-QDs@NIPs. As is shown in Figure 6, the quenching efficiency of CA to CdTe-QDs@MIPs (F0/F, 1.35) is much higher than that for CdTe-QDs@NIPs (F0/F, 1.03), which verifies that CdTe-QDs@MIPs have imprinted cavities for specific recognition of CA. Furthermore, no significant differences of quenching efficiencies (all close to 1.00) have been observed among FA, CGA, pCA, VA, 4-HBA, and PCA to CdTe-QDs@MIPs and CdTe-QDs@NIPs because of the absence of tailor-made recognition sites.
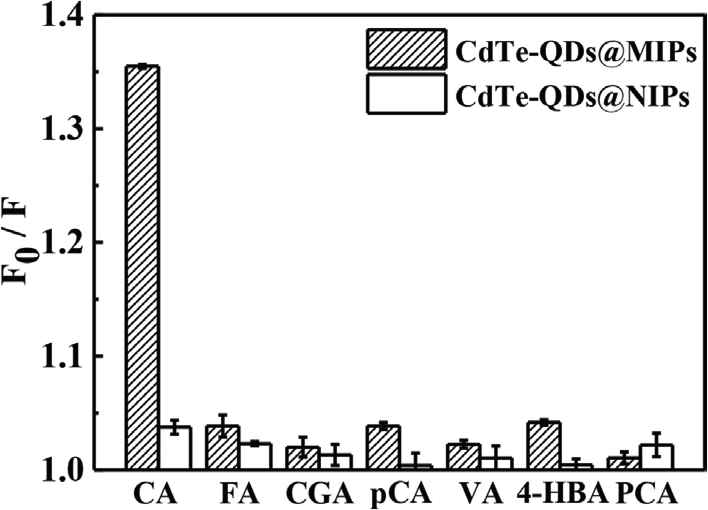
Quenching efficiencies of CA, FA, CGA, pCA, VA, 4-HBA, and PCA (each concentration at 10 μg L−1) on CdTe-QDs@MIPs and CdTe-QDs@NIPs. CA, caffeic acid; FA, ferulic acid; CGA, chlorogenic acid; pCA, p-coumaric acid; VA, vanillic acid; HBA, hydroxybenzoic acid; PCA, protocatechuic acid; QD, quantum dot; MIP, molecularly imprinted polymer; NIP, non-imprinted polymer.
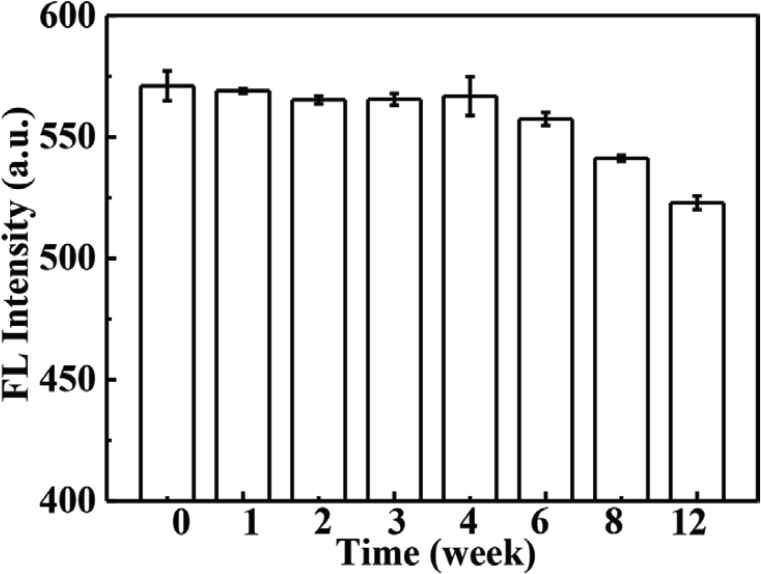
The stability of CdTe-QDs@MIPs in an aqueous solution at 4°C has been evaluated over a period of 12 weeks. As presented in Figure S3, no discernible changes are found during the first 6 weeks, as the fluorescence intensity retains 97.61% of its initial fluorescence response. In addition, five batches of CdTe-QDs@MIPs have been prepared, and batch-to-batch relative standard deviation (RSD) is 3.31%, probably because MIPs shell plays an important role in the protection of CdTe-QDs@MIPs from self-fluorescence quenching effect.
3.5. Analytical Figures for the Determination of CA
Under the optimized experimental conditions, fluorescence intensities of CdTe-QDs@MIPs and CdTe-QDs@NIPs have been investigated by addition of different concentrations of CA from 0 to 100 μg L−1 to evaluate their analytical performances, such as linearity, LOD (3 σ/k), limit of quantification (LOQ, 10 σ/k), precision, and specificity. As is depicted in Figure 7, fluorescence intensities of CdTe-QDs@MIPs apparently decrease with the increase of CA concentrations, and that for CdTe-QDs@MIPs is not obvious. Fluorescence quenching efficiencies can be depicted by Stern–Volmer type equation: F0/F = 1 + Ksv[C], where Ksv and [C] are the quenching constant and concentration of CA, respectively. As is shown in the inset of Figure 7, Ksv for CdTe-QDs@MIPs is considerably larger than that for CdTe-QDs@NIPs, and the ratio of Ksv values (i.e., imprinting factor) is 13.6, which also indicates the presence of specific recognition sites on CdTe-QDs@MIPs. Good linearity (F0/F = 1.0028 + 0.0175C) with wide linear range (2–100 μg L−1) and high coefficient (R2 = 0.9980) has been obtained for CA by CdTe-QDs@MIPs. Based on the results, LOD (0.73 μg L−1) and LOQ (2.40 μg L−1) have been achieved for CA. In comparison, LOD (0.89, 0.95, 2.53, 3.25, and 3.56 μg L−1) has been calculated for CA detection by CdTe-QDs@MIPs with polymerization time for 1, 3, 5, 10, and 15 min, respectively (Table 1). Therefore, smaller particle size with appropriate recognition sites result in higher sensitivity detection. Intra-day RSD value at 1.3% indicates the high reproducibility, and the inter-day RSD value at 6.4% over a 6-day span also presents the small signal variability. Accordingly, the developed method is sufficiently practical for the quantification of CA. Compared with previously reported quantitative methods for CA [4,7–9,18–21] (Table 2), the developed method demonstrates higher sensitivity.
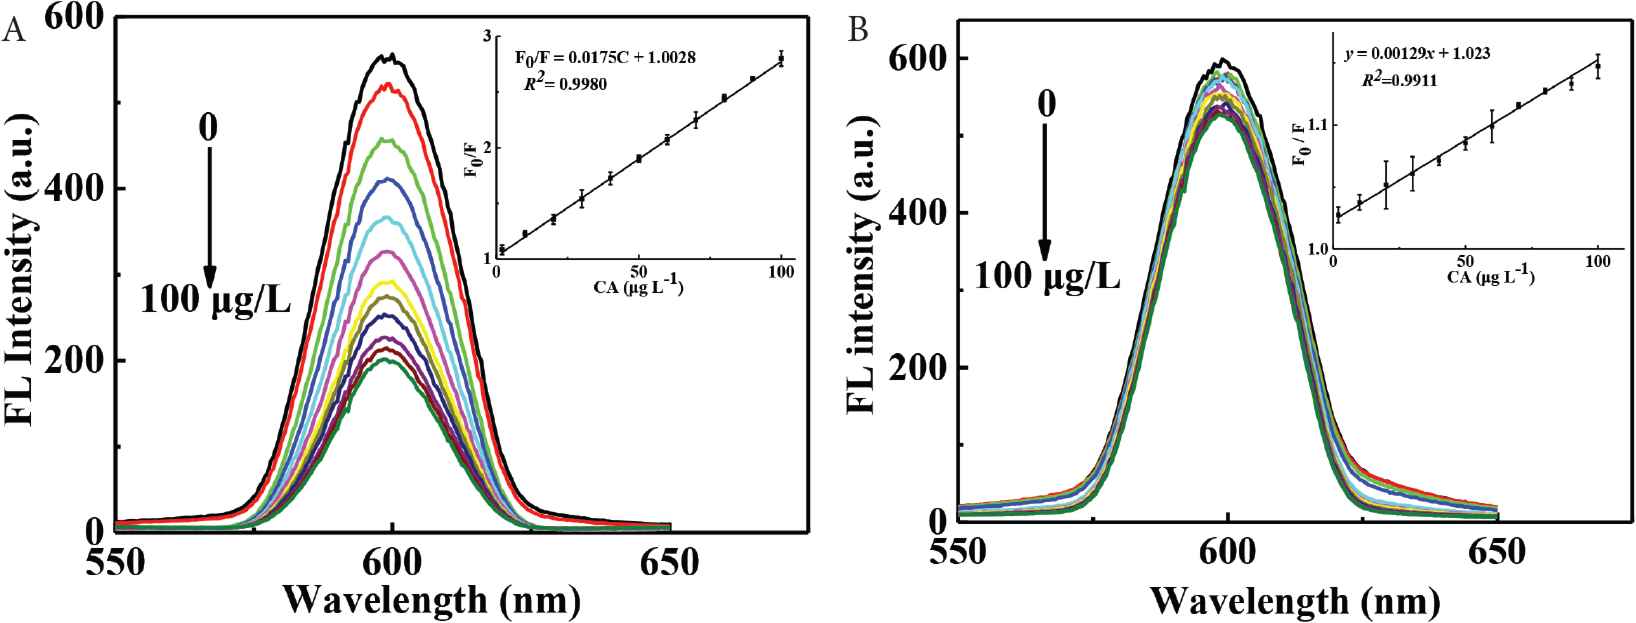
Fluorescence spectra of CdTe-QDs@MIPs (A) and CdTe-QDs@NIPs (B) on addition of different concentrations of CA (0–100 μg L−1), inset was the calibration graph. CA, caffeic acid; QD, quantum dot; MIP, molecularly imprinted polymer; NIP, non-imprinted polymer.
| Detection scheme | Real sample | Linear range (μg L−1) | LOD (μg L−1) | Reference |
|---|---|---|---|---|
| HPLC-electrochemical detector | Honeysuckle | 50–1.0 × 10⁴ | 1.6 | Ye et al. [4] |
| Au electrode@MIPs | Wines | 90–1.1 × 10⁴ | 27.0 | Leite et al. [19] |
| Electrochemical method | Plasma | 4.5 × 10³–3.6 × 10⁵ | 901.5 | Valentini et al. [7] |
| QCM@MIPs | Plant materials | 1.8–1.8 × 10⁵ | 1.4 | Gültekin et al. [20] |
| MIPs–HPLC | Fruits | 1.0 × 10³–1.0 × 10⁵ | 200 | Fan et al. [18] |
| CdTe-QDs | – | 667.8–2.0 × 10⁴ | 216 | Fan et al. [8] |
| Carbon dots | Red wine | 140–1.8 × 10⁴ | 43.2 | Sun et al. [9] |
| Carbon dots@MIPs | Plasma | 90.1–3.6 × 10⁴ | 19.8 | Xu et al. [21] |
| CdTe-QDs@MIPs | Apple juices | 2.0–100.0 | 0.73 | This work |
CA, caffeic acid; HPLC, high-performance liquid chromatography; MIP, molecularly imprinted polymer; QCM, quartz crystal microbalance; QD, quantum dot.
Comparison of the developed method with other reported methods for CA determination
3.6. Real Sample Measurement
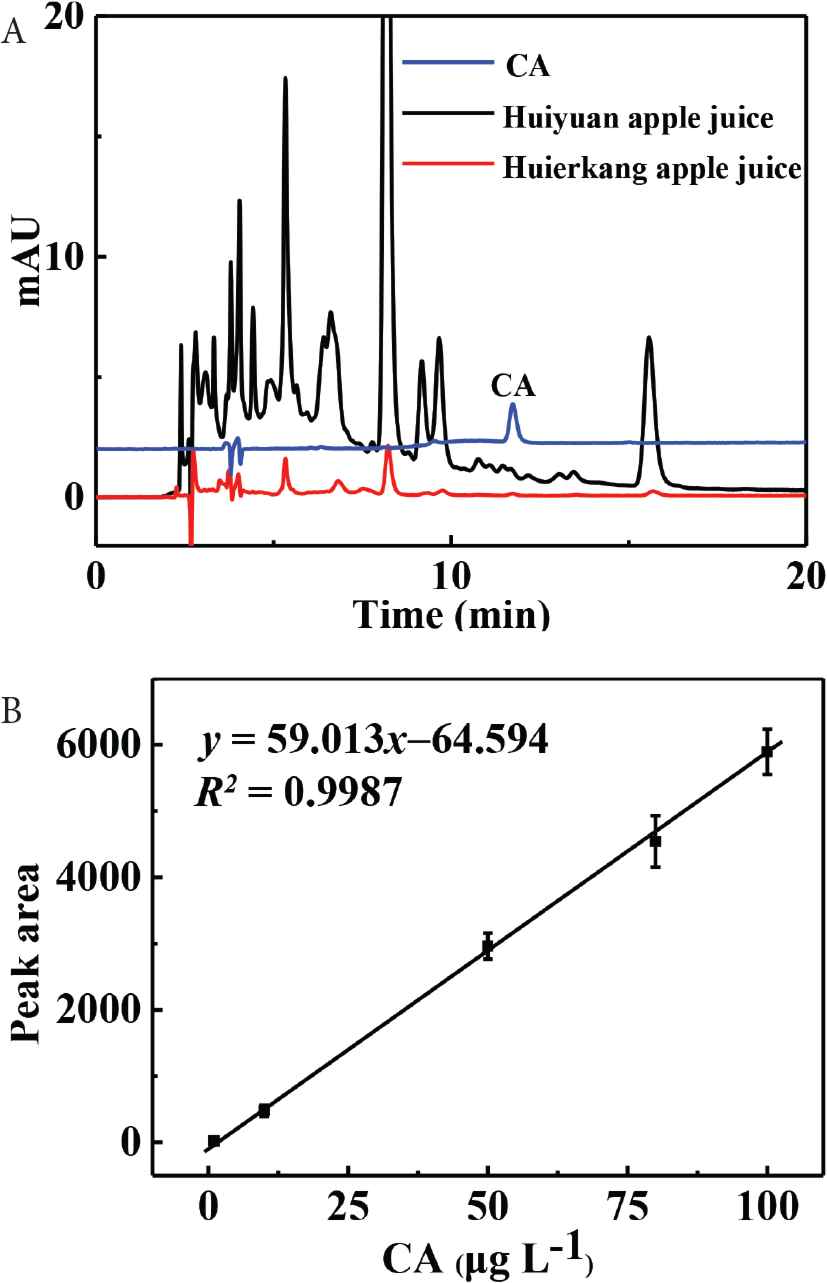
The practical feasibility of this CdTe-QDs@MIPs fluorescence sensor has been evaluated for the quantitative analysis of CA in apple juices. Samples were just diluted 100-fold without any additional pretreatment procedures. The recoveries of CA range from 93.3% to 108.3% with excellent RSD values <2.10% (Table 3), which suggests that the proposed method is sufficiently accurate for selective determination of CA. Finally, CA has been estimated in Huiyuan apple juice and Huierkang apple juice at concentrations of 1180 ± 47 and 992 ± 53 μg L−1, respectively.
| Sample | Added (μg L−1) | Founda (μg L−1) | Recovery (%) | RSD (%) |
|---|---|---|---|---|
| Huiyuan apple juice | 0 | 11.80 | –b | 3.95 |
| 5.0 | 17.14 | 106.7 | 0.55 | |
| 20.0 | 32.14 | 101.7 | 2.10 | |
| 50.0 | 59.45 | 95.3 | 0.76 | |
| Huierkang apple juice | 0 | 9.92 | –b | 5.30 |
| 5.0 | 14.59 | 93.3 | 0.70 | |
| 20.0 | 31.58 | 108.3 | 1.78 | |
| 50.0 | 56.92 | 94.0 | 1.90 |
Mean of three determinations,
Not be detected.
Recoveries of CA in apple juices (diluted 100-fold) by CdTe-QDs@MIPs based sensor (n = 3)
In the Pharmacopoeia of the People’s Republic of China, CA is always quantified by HPLC–UV. Then, the quantitative analysis of CA in Huiyuan apple juice and Huierkang apple juice has been proposed to be performed using HPLC–UV as reported in our earlier studies [17,18] (see Figure S4). Results indicate the concentrations of CA in Huiyuan apple juice and Huierkang apple juice are 1150 ± 41 and 1080 ± 60 μg L−1, which is in consistence with those determined by our developed CdTe-QDs@MIPs-based method.
4. CONCLUSION
In this work, we have fabricated a facile synthesis of CdTe-QDs@MIPs for rapid, sensitive, and selective determination of CA in apple juices for the first time. CdTe-QDs@MIPs can be simply synthesized by anchoring MIPs layer on the surface of CdTe-QDs via sol–gel polymerization. Combining the selectivity of MIPs with the sensitivity of CdTe-QDs, CdTe-QDs@MIPs present overwhelming properties. Small particle size with appropriate recognition sites largely shortens the response time and improves sensitivity. The excellent properties of CdTe-QDs@MIPs have revealed their great potentials in advanced analytical applications.
CONFLICTS OF INTEREST
The authors declare they have no conflicts of interest.
AUTHORS’ CONTRIBUTION
RL contributed in data curation, and writing–original draft. RL and TL contributed in formal analysis and investigation. RL and LW contributed in methodology and validation. RL and SS contributed in supervision. SS contributed in funding acquisition, project administration and writing–review & editing.
ACKNOWLEDGMENTS
The authors acknowledge the financial support of the
SUPPLEMENTARY FIGURES
Schematic illustration of the synthesis of CdTe-QDs@MIPs. QD, quantum dot; MIP, molecularly imprinted polymer. Fluorescence spectra of CdTe-QDs@MIPs before (A) and after (B) removal of CA, and fluorescence spectra of CdTe-QDs@NIPs (C). Qd, quantum dot; MIP, molecularly imprinted polymer; NIP, non-imprinted polymer; CA, caffeic acid. Effect of store time on the response of CdTe-QDs@MIPs. QD, quantum dot; MIP, molecularly imprinted polymer. HPLC chromatograms of CA, Huiyuan apple juice and Huierkang apple juice (A), and the calibration graph (B). HPLC, high-performance liquid chromatography; CA, caffeic acid.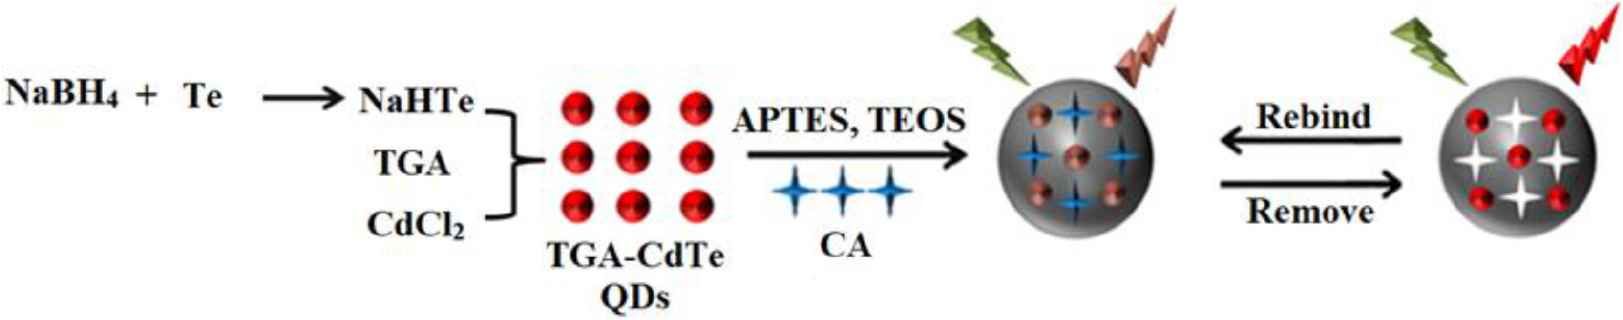
Footnotes
REFERENCES
Cite this article
TY  - JOUR
AU  - Ruiqing Long
AU  - Te Li
AU  - Lihui Wu
AU  - Shuyun Shi
PY  - 2019
DA  - 2019/08/23
TI  - Synthesis of CdTe Quantum Dots-based Imprinting Fluorescent Nanosensor for Highly Specific and Sensitive Determination of Caffeic Acid in Apple Juices
JO  - eFood
SP  - 165
EP  - 172
VL  - 1
IS  - 2
SN  - 2666-3066
UR  - https://doi.org/10.2991/efood.k.190802.003
DO  - 10.2991/efood.k.190802.003
ID  - Long2019
ER  -