
Assessment of peripheral vascular function with photoplethysmographic pulse amplitude
- DOI
- 10.1016/j.artres.2011.03.001How to use a DOI?
- Keywords
- Population; Vasodilation; Photoplethysmography; Endothelial function
- Abstract
Background: Vasodilation of the peripheral arteries after reactive hyperaemia depends in part on the release of nitric oxide from endothelial cells. Previous studies mainly employed a fingertip tonometric device to derive pulse wave amplitude (PWA) and, therefore, measure PWA hyperaemic changes. Another approach to derive information about PWA is based on photoplethysmography (PPG). We sought to evaluate the correlates of digital PPG PWA hyperaemic responses as a measure of peripheral vascular function.
Methods: Using a fingertip PPG device, we measured digital PWA in 63 subjects enrolled in a population study (55.5% women; mean age, 55 years; 58.7% hypertensive) at baseline and at 30-s intervals for 4 min during reactive hyperaemia induced by a 5-min forearm cuff occlusion. We performed stepwise regression to identify correlates of the hyperaemic response ratio for each 30-s interval after cuff deflation.
Results: With age forced into the models, the explained variance for the PPG PWA ratio totalled from 17.1% at the 210–240-s time interval to 31.3% at 30–60-s time interval. The hyperaemic response at each 30-s interval was significantly higher in women compared to men (P < 0.001). The PPG PWA changes at 0–60-s intervals decreased with higher blood pressure (BP) (P < 0.03). These associations with sex and systolic BP were mutually independent.
Conclusions: Our study described in a population sample the determinants of PPG PWA hyperaemic changes. We demonstrated that measurement of the hyperaemic response by PPG might be a useful tool in the detection of endothelial dysfunction associated with higher BP and male gender.
- Copyright
- © 2011 Association for Research into Arterial Structure and Physiology. Published by Elsevier B.V. All rights reserved.
- Open Access
- This is an open access article distributed under the CC BY-NC license.
Introduction
Experimental and clinical studies suggest that the development of endothelial dysfunction, including reduced nitric bioavailability, contributes to atherosclerosis and the pathogenesis of cardiovascular disease.1 In humans, endothelial dysfunction precedes the development of clinically apparent atherosclerosis in individuals with cardiovascular risk factors such as hypertension.2 Vasodilation of the peripheral arteries after reactive hyperaemia depends in part on the release of nitric oxide from endothelial cells in response to increased shear stress.3 This physiological response allows the non-invasive assessment of endothelial vasomotor function which can be measured based on the flow-mediated dilation (FMD) of the brachial artery4 or on the fingertip pulse amplitude hyperaemic response.3,5,6 Previous studies mainly employed a fingertip tonometric device to derive pulse wave amplitude and, therefore, to measure the pulse amplitude changes during hyperaemia.3,5,6 Another approach to derive information about the arterial pulse wave is based on photoplethysmography (PPG).7 This optical technique enables detecting blood volume changes in microvascular beds in response to hyperaemia.7 We sought to evaluate the correlates of digital PPG pulse amplitude hyperaemic responses as a measure of peripheral arterial function in a sample of a general population.
Methods
Study participants
The Ethics Committee of the University of Leuven approved the Flemish Study on Environment, Genes and Health Outcomes (FLEMENGHO).8 For the current analysis, our sample consisted of 75 subjects, who were examined from January 2010 to May 2010 (response rate 64.7%), including measurement of endothelial function with the PPG technique. We excluded 5 subjects with cardiac dysrhythmias, such as atrial fibrillation and frequent extrasystole. Because the PPG pulse amplitude was of insufficient quality to assess vascular function (n = 2) or because the hyperaemic test was discontinued (n = 5), we discarded analysis from 7 subjects. Thus, the number of participants statistically analysed totalled 63.
Determination of PPG pulse amplitude
We studied endothelial function in an air-conditioned room after the subjects had rested for at least 20 min in the supine position. The participants refrained from smoking, heavy exercise, and drinking alcohol or caffeine-containing beverages for at least 3 h before assessment of endothelial function. The blood pressure was the average of 5 auscultatory readings, obtained with a standard sphygmomanometer.
Digital pulse amplitude was measured with a PPG device (FLOMEDI Company, Brussels) transmitting infrared light at a wavelength of 940 nm and positioned on the tip of each index finger. Digital output from the PPG device was recorded through an analogue-to-digital converter (10 bit, sampling frequency 250 Hz). To determine the amplitude changes of the digital pulse curve in response to hyperaemia, we used a protocol as described by Hamburg et al.6 Baseline PPG pulse amplitude was measured at each of the two index fingertips for 2 min 20 s. Arterial flow was interrupted for 5 min by a cuff placed on a proximal forearm with an occlusion pressure of 200–220 mmHg. After cuff deflation, we analysed the PPG pulse amplitude at both fingers using a computerised, automated algorithm (FLOMEDI Company, Brussels) that provided the averaged pulse amplitude for each 30-s interval up to 4 min (see the PPG pulse tracking in Fig. 1).
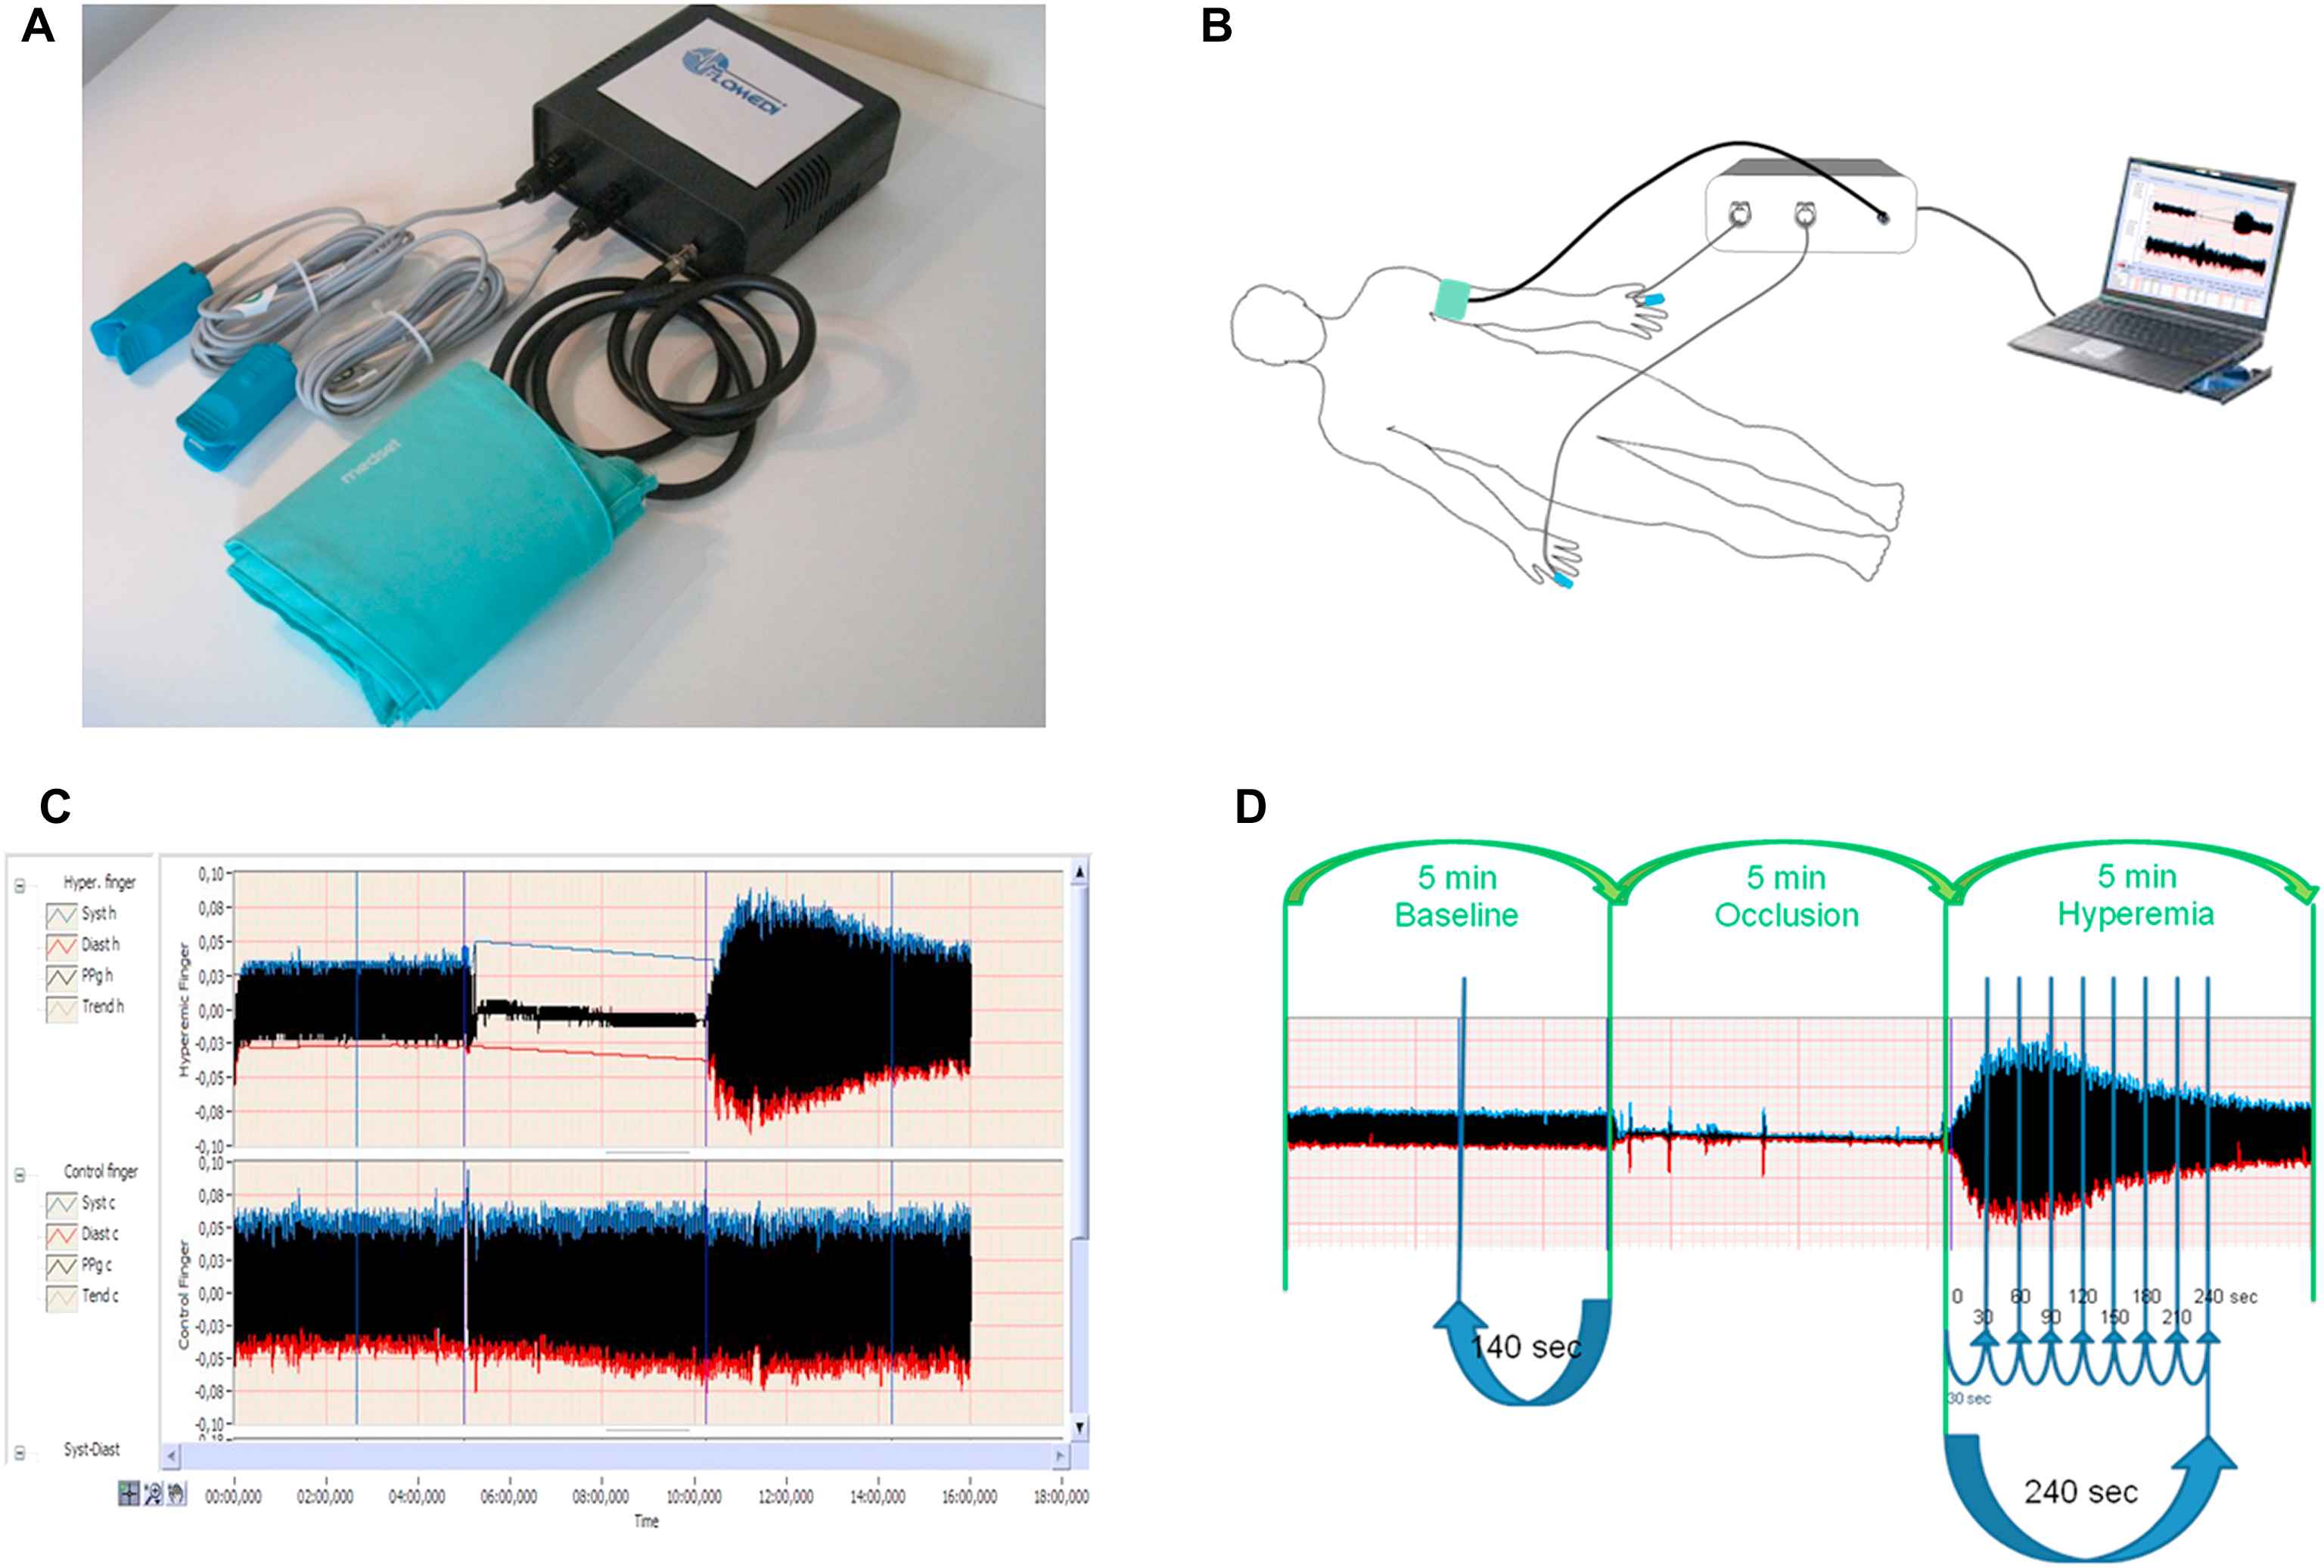
Panel A shows a system incorporating two PPG devices transmitting infrared light, analogue-to-digital converter and forearm pressure cuff. Panel B shows the position of cuff and two PPG devices during the test. Panel C and D show recorded pulse amplitude tracing. In the arm undergoing hyperaemia (panel C, top tracing, and panel D), baseline amplitude is recorded. During cuff inflation, flow is occluded and restores after cuff release (hyperaemic period). In the contralateral control finger (panel C, bottom tracing), flow continues throughout, and pulse amplitude undergoes minimal changes.
For each 30-s interval, the response of the PPG pulse wave amplitude to hyperaemia was calculated from the hyperaemic fingertip as the ratio of the post-deflation PPG pulse amplitude to the baseline amplitude (PAht/PAh0, where PA is the pulse amplitude, h is the hyperaemic finger, t is time interval, and 0 is baseline). To obtain the PPG pulse amplitude ratio we divided PAht/PAh0 ratio by the corresponding ratio at the control hand (PAct/PAc0, where c is the control finger).
To determine the inter-session reproducibility of the hyperaemic response, we analysed PPG ratios measured on two different occasions in 5 subjects. We determined the absolute and relative biases of the averaged and peak PPG pulse amplitude ratios between the two sessions as well as 95% limits of agreement between sessions. Absolute and relative biases between the two sessions were calculated according to Bland and Altman’s method as (x1 – x2) vs averaged and (100*(x1 – x2)/averaged) vs averaged, respectively.
Other measurements
At the examination centre, trained study nurses administered a questionnaire to collect detailed information on each subject’s medical history, smoking and drinking habits, and intake of medications. Hypertension was defined as a blood pressure of at least 140 mm Hg systolic or 90 mm Hg diastolic (average of 5 consecutive auscultatory readings at the examination centre) or the use of antihypertensive drugs. Body mass index was defined as weight in kilogrammes divided by the square of height in metres.
Statistical methods
For database management and statistical analysis, we used SAS software, version 9.1 (SAS Institute, Cary, NC). The central tendency and the spread of the data are reported as mean ± SD. Departure from normality was evaluated by Shapiro–Wilk’s statistic and skewness by computation of the coefficient of skewness, i.e., the third moment about the mean divided by the cube of the standard deviation. We compared means and proportions by means of a sample t-test and by the χ2-test, respectively. Significance was P < 0.05 on two-sided test.
We performed single and stepwise multiple regression to assess the independent correlations of the PPG pulse amplitude ratio during each 30-s interval with sex, age, body mass index, heart rate, systolic and diastolic blood pressures, current smoking, total cholesterol, treatment with antihypertensive or lipid-lowering drugs, and previous history of ischaemic heart disease. We set the P-values for variables to enter and to stay in the regression models at 0.20.
Results
Characteristics of participants and PPG pulse amplitude
The 63 participants included 35 (55.5%) women, and 37 (58.7%) hypertensive patients of whom 23 (36.5%) were on antihypertensive drug treatment. Table 1 shows the clinical characteristics and PPG pulse amplitude measures of the study participants by sex. In this cohort, women had lower systolic blood pressure than men, and had no history of ischaemic heart disease. Table 1 lists the mean values of the baseline PPG amplitude at the hyperaemic and control finger and the post-deflation PPG pulse amplitude ratio at each 30-s interval by sex.
| Characteristic | Women (n = 35) | Men (n = 28) | P-value |
|---|---|---|---|
| Clinical measurements | |||
| Anthropometrics | |||
| Age, y | 56.3 ± 10.4 | 53.1 ± 18.3 | 0.41 |
| Body mass index, kg/m2 | 26.8 ± 3.4 | 27.4 ± 4.0 | 0.47 |
| Systolic pressure, mm Hg | 126.3 ± 14.1 | 137.3 ± 15.3 | 0.005 |
| Diastolic pressure, mm Hg | 82.8 ± 8.6 | 84.0 ± 10.9 | 0.64 |
| Heart rate, beats/minute | 68.0 ± 10.8 | 63.8 ± 10.1 | 0.11 |
| Questionnaire data | |||
| Current smoking, n (%) | 5 (14.3) | 1 (3.6) | 0.15 |
| Diabetes, n (%) | 1 (2.9) | 1 (3.6) | 0.89 |
| Hypertensive, n (%) | 17 (48.6) | 20 (71.4) | 0.07 |
| Treated for hypertension, n (%) | 11 (31.4) | 12 (42.9) | 0.35 |
| Beta-blockers, n (%) | 3 (8.6) | 8 (28.6) | 0.04 |
| ACE or ARB, n (%) | 3 (8.6) | 5 (17.9) | 0.27 |
| Diuretics or CCB, n (%) | 9 (25.7) | 8 (28.6) | 0.80 |
| Previous history of IHD, n (%) | 0 (0) | 4 (14.3) | 0.02 |
| Total cholesterol, mmol/l | 5.3 ± 0.89 | 4.8 ± 1.06 | 0.07 |
| Lipid-lowering agents, n (%) | 10 (28.6) | 8 (28.6) | 0.99 |
| PPG pulse amplitude measures | |||
| Baseline pulse amplitude | |||
| Hyperaemic finger | 0.15 (0.07–0.23) | 0.17 (0.08–0.29) | 0.42 |
| Control finger | 0.17 (0.09–0.30) | 0.17 (0.09–0.30) | 0.75 |
| PPG ratio | |||
| Time interval (sec) | |||
| 0–30 | 1.74 (1.19–2.40) | 1.38 (0.93–1.95) | 0.002 |
| 30–60 | 2.20 (1.37–3.14) | 1.57 (1.05–2.52) | 0.0001 |
| 60–90 | 2.03 (1.23–2.70) | 1.51 (0.97–2.30) | 0.0005 |
| 90–120 | 1.83 (1.28–2.43) | 1.35 (0.96–2.00) | 0.0003 |
| 120–150 | 1.67 (1.22–2.09) | 1.29 (0.93–1.81) | 0.0005 |
| 150–180 | 1.54 (1.17–1.98) | 1.24 (0.89–1.64) | 0.0007 |
| 180–210 | 1.46 (1.14–1.89) | 1.20 (0.92–1.58) | 0.0003 |
| 210–240 | 1.37 (1.09–1.70) | 1.17 (0.86–1.45) | 0.001 |
Values are mean (±SD), mean (10–90%), or number of subjects (%). PPG indicates photoplethysmography, ACE indicates angiotensin-converting enzyme; ARB indicates angiotensin receptor blockers, CCB indicates calcium channel blockers.
Characteristics of participants.
As shown in Fig. 2, after forearm cuff deflation, the ratio of the PPG pulse amplitude to baseline rose rapidly in the hyperaemic fingertip, with the maximal response occurring in the 30–60-s interval, whereas the changes of PPG amplitude in the control finger were minimal.
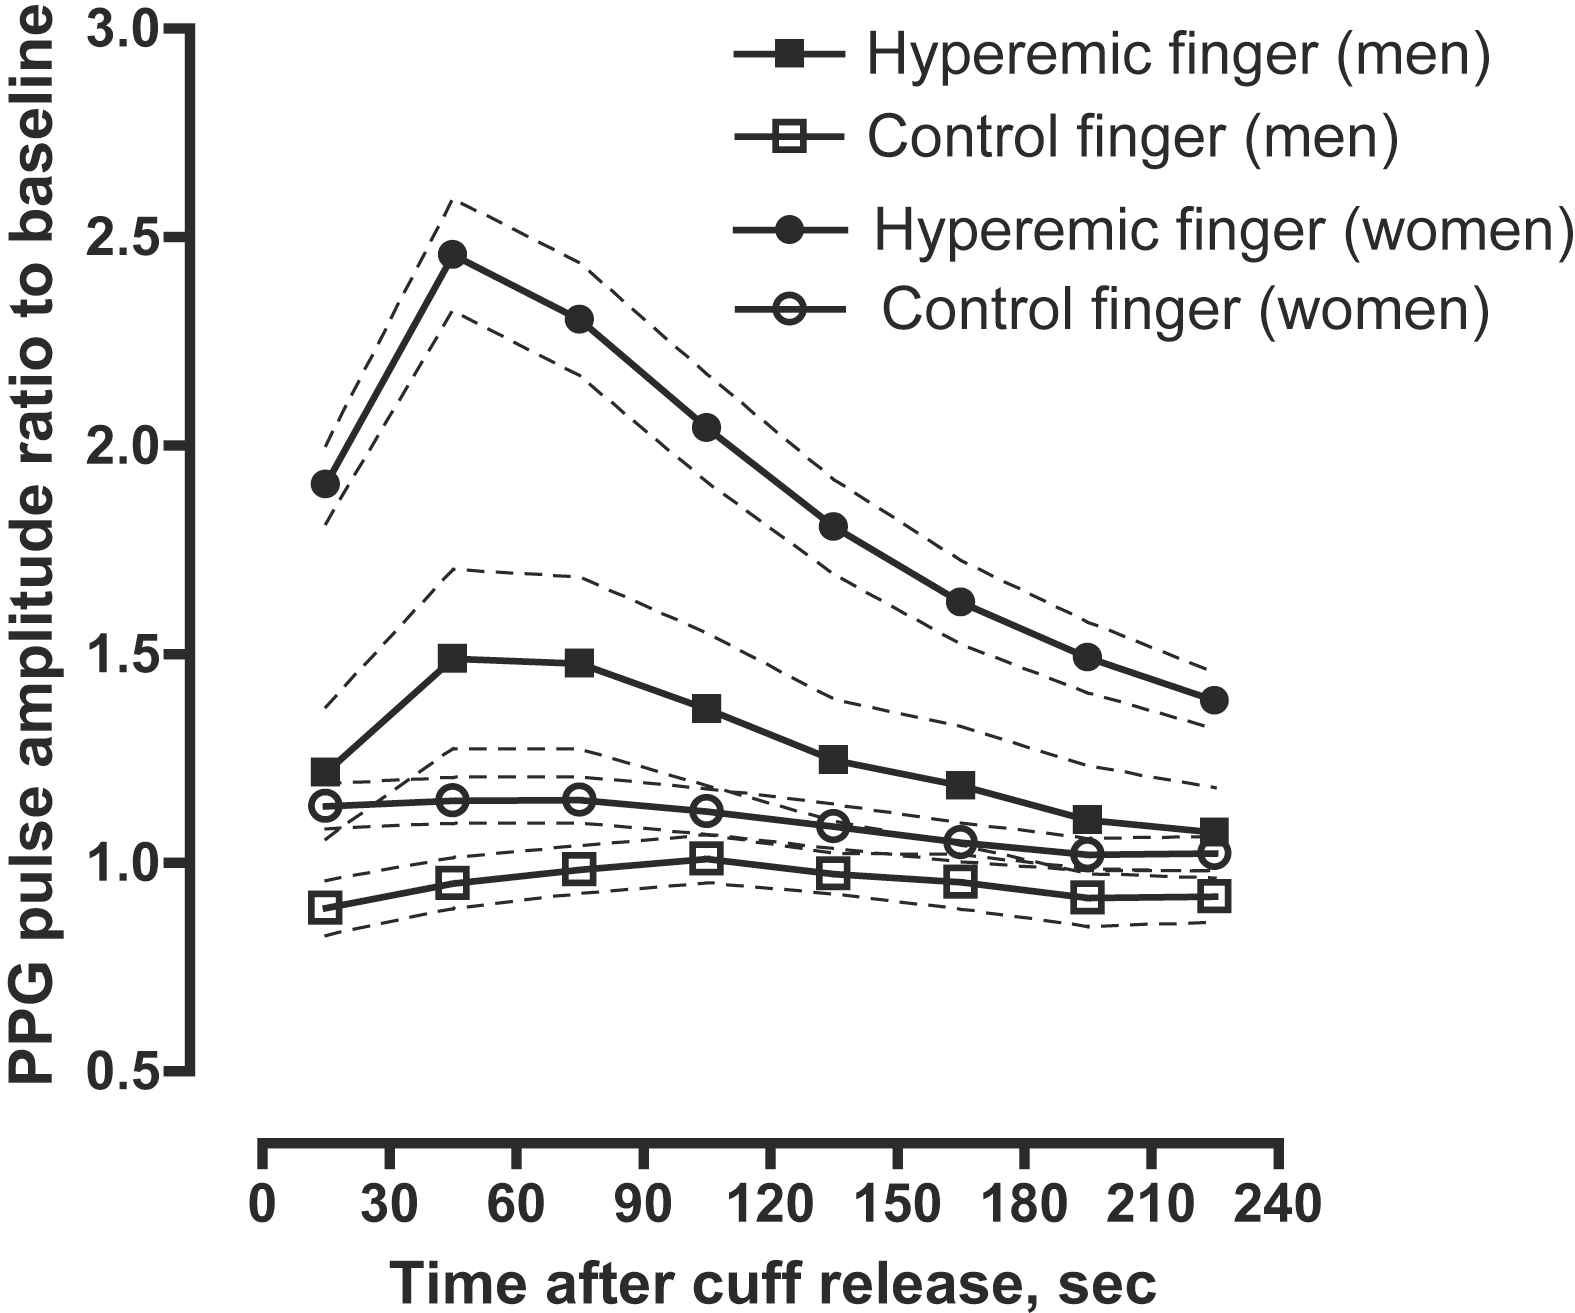
PPG pulse amplitude response for the hyperaemic (closed symbols) and control (open symbols) finger in women (circles) and men (squares). Women had more pronounced responses than men. Symbols are means, dashed line – 95% confidence interval.
The absolute biases of the averaged and peak PPG pulse amplitude ratios between the two sessions were 0.062 (95% confidence interval [CI]: −0.10–0.23) and 0.072 (95% CI: −0.049–0.19), respectively. The relative inter-session biases of the averaged and peak PPG pulse amplitude ratios were 3.29% (95% CI: −8.8–15.4%) and 4.87% (95% CI: –3.5–13.2%), respectively.
Determinants of PPG pulse amplitude ratio
We performed stepwise regression to assess the independent correlations of the hyperaemic response for each 30-s interval after cuff deflation with sex, age, body mass index, heart rate, systolic and diastolic blood pressures, total cholesterol, lipid-lowering treatment and previous history of ischaemic heart disease. With age forced in the models, the explained variance for the PPG pulse amplitude ratio totalled from 17.1% at 210–240-s time interval to 31.3% at 30–60-s time interval (Table 2). While adjusting for age, the hyperaemic response at each 30-s interval was significantly higher in women compared to men (Table 2). Moreover, the PPG pulse amplitude ratios at 0–60-s intervals decreased with higher blood pressure (P < 0.03; Table 2). These associations with sex and systolic blood pressure were mutually independent. In addition, the PPG pulse amplitude ratio at 30–90-s intervals decreased with the intake of lipid-lowering drugs, but this association reached only borderline significance (P < 0.07; Table 2).
| Parameter | PPG ratio | |||||||
|---|---|---|---|---|---|---|---|---|
| Time Intervals (sec) | ||||||||
| 0–30 | 30–60 | 60–90 | 90–120 | 120–150 | 150–180 | 180–210 | 210–240 | |
| Regression statistic | ||||||||
| Model R2 (%) | 27.7 | 31.3 | 25.6 | 22.3 | 17.9 | 17.7 | 19.6 | 17.1 |
| Age (+10 years)* | ||||||||
| β ± SE | 0.036 ± 0.047 | 0.069 ± 0.063 | 0.050 ± 0.059 | 0.012 ± 0.051 | −0.015 ± 0.037 | −0.019 ± 0.030 | −0.018 ± 0.024 | −0.021 ± 0.021 |
| P = 0.46 | P = 0.28 | P = 0.40 | P = 0.82 | P = 0.69 | P = 0.53 | P = 0.46 | P = 0.32 | |
| Partial r2 (%) | 0.9 | 0.02 | 0.01 | 0.04 | 0.01 | 0.07 | 0.13 | 0.5 |
| Female (0,1) | ||||||||
| β ± SE | 0.22 ± 0.13 | 0.46 ± 0.17 | 0.41 ± 0.16 | 0.39 ± 0.14 | 0.39 ± 0.11 | 0.31 ± 0.09 | 0.26 ± 0.07 | 0.21 ± 0.06 |
| P = 0.08 | P = 0.0002 | P = 0.0006 | P = 0.0003 | P = 0.0006 | P = 0.0007 | P = 0.0003 | P = 0.001 | |
| Partial r2 (%) | 3.9 | 21.1 | 18.1 | 19.4 | 17.9 | 17.7 | 19.5 | 16.6 |
| Systolic BP (+10 mm/Hg) | ||||||||
| β ± SE | ─0.12 ± 0.04 | ─0.13 ± 0.06 | ─0.09 ± 0.06 | ─0.07 ± 0.05 | – | – | – | – |
| P = 0.008 | P = 0.03 | P = 0.13 | P = 0.15 | |||||
| Partial r2 (%) | 20.0 | 5.9 | 3.1 | 2.9 | ||||
| Lipid-lowering treatment (0,1) | ||||||||
| β ± SE | ─0.20 ± 0.13 | ─0.33 ± 0.17 | ─0.30 ± 0.16 | – | – | – | – | – |
| P = 0.13 | P = 0.06 | P = 0.07 | ||||||
| Partial r2 (%) | 2.9 | 4.3 | 4.5 | |||||
Values are mutually adjusted partial regression coefficients ±SE.
Age was forced into all models. Stepwise models included sex, systolic and diastolic blood pressures, heart rate, body mass index, current smoking, total cholesterol, antihypertensive or lipid-lowering drug treatment, and previous history of ischaemic heart disease.
Correlates of PPG ratios selected by stepwise regression.
Hypertension and PPG pulse amplitude hyperaemic response
Figure 3 illustrates the hyperaemic response in normotensive and hypertensive subjects. Hypertensive subjects had a significantly (P ≤ 0.05) lower age-, sex- and antihypertensive treatment adjusted PPG pulse amplitude ratio throughout the 0–90-s post-deflation intervals.
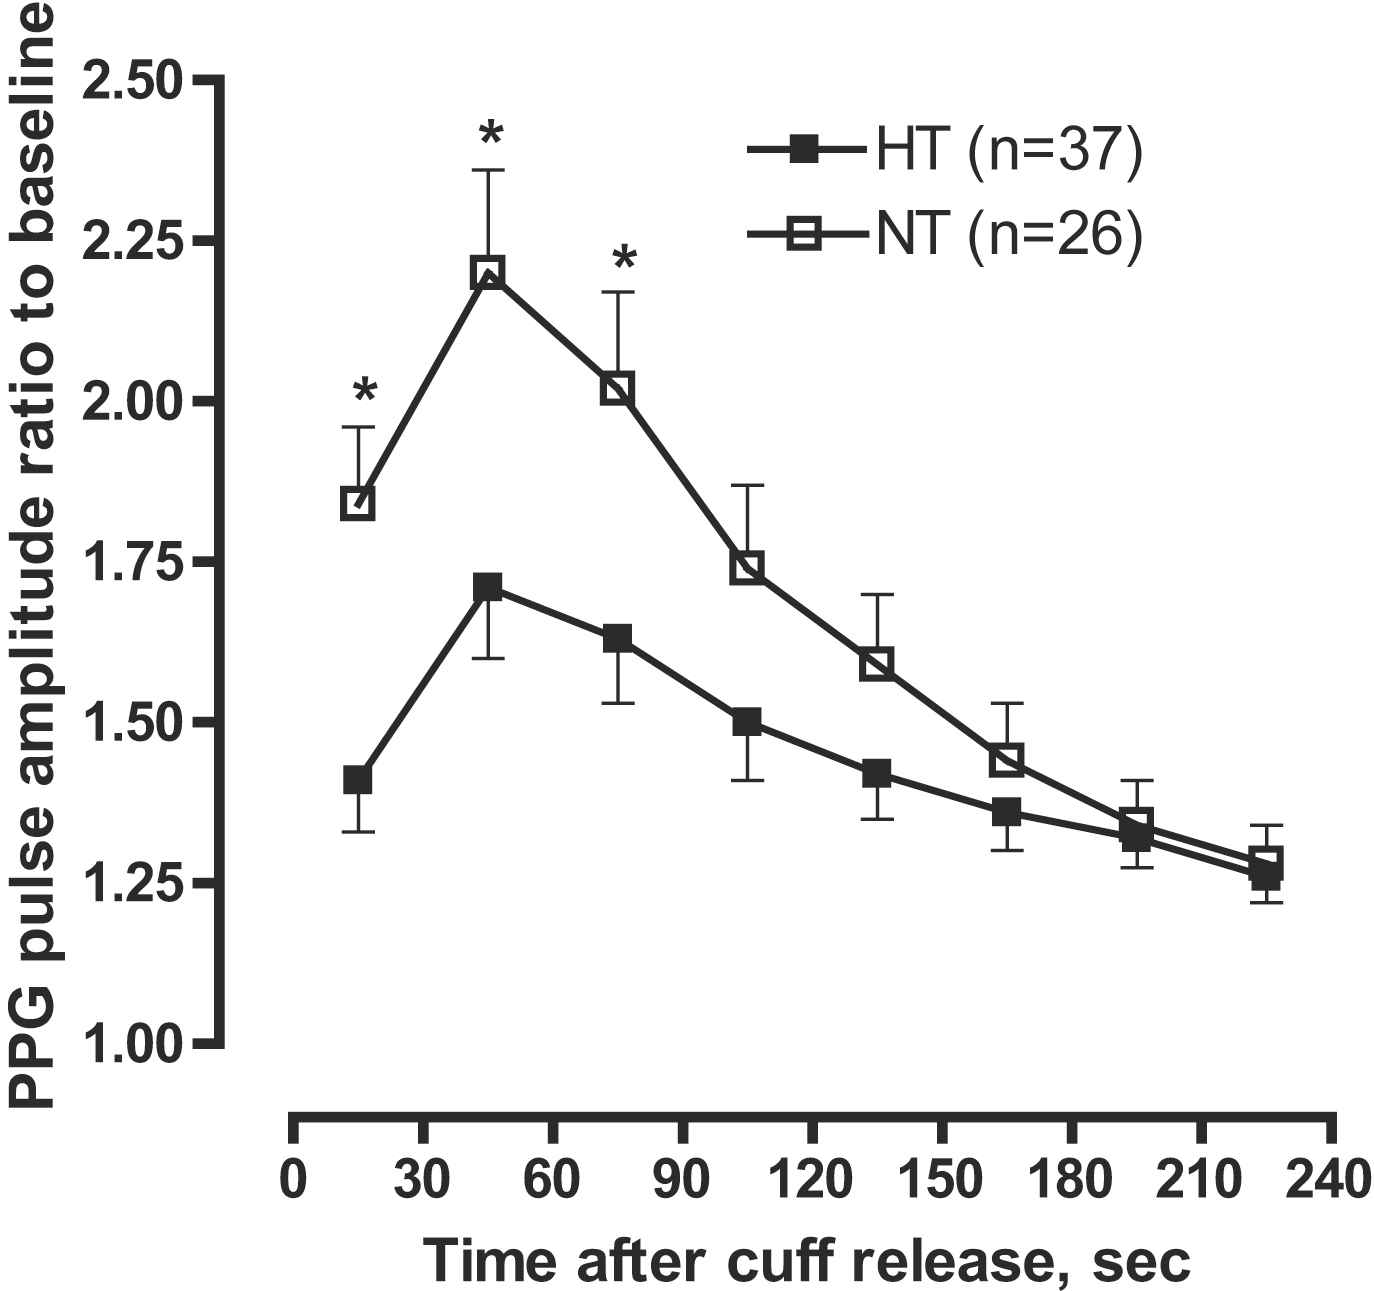
PPG ratio of pulse amplitude for each 30 s time interval after cuff deflation to the baseline pulse amplitude divided by the corresponding ratio in the control finger in hypertensive (HT) and normotensive (NT) subjects. Hypertensive subjects had significantly lower response throughout the 0–90-s post-deflation intervals. Symbols are means and SE. Models are adjusted for sex, age, lipid-lowering treatment, and antihypertensive treatment.
Discussion
In our cohort recruited from a population study, we evaluated the relation of PPG pulse amplitude hyperaemic response, a non-invasive measure of peripheral arterial function, to anthropometric and haemodynamic characteristics. We observed a time-dependent increase in PPG pulse amplitude that peaked in the 30–60-s interval after induction of reactive hyperaemia. In keeping with the literature,6,9 we found that PPG pulse amplitude hyperaemic response was higher in women than in men. Moreover, vasodilator function as measured by the PPG techniques was lower in hypertensive subjects as compared to normotensive subjects.
Endothelial function is often assessed non-invasively by vascular reactivity tests. Several methods are available to study endothelial function in the peripheral macrocirculation (conduit arteries) and microcirculation (resistance arteries and arterioles).10 Measurement of the brachial artery diameter before and after several minutes of occlusion of the arterial flow to the forearm is the most widely used test to assess endothelium-dependent vasodilation.2,9 The change in arterial diameter gives a measure of flow-mediated vasodilatation. This technique, however, is operator dependent and requires high cost and a long post-processing time. Moreover, because the measurements at the brachial artery diameter are typically done at a few fixed time points after the cuff deflation, the peak hyperaemic response can be easily missed. Changes in the temporal characteristics of the hyperaemic response will be, therefore, misinterpreted. Measurement of microcirculatory reactive hyperaemia can be assessed by digital pulse amplitude measured by photoplethysmography.11,12 Lund13 described the potential of the PPG technique for the assessment of vasodilation by using this technique to measure haemodynamic response to nitroglycerin. A finger PPG is a low-cost and operator-independent technique compared to ultrasonography in the assessment of peripheral vascular function.
We observed similar digital pulse amplitude changes during the hyperaemic response compared with another method based on finger applanation tonometry.6 In the Framingham study6 as well as in the present study, the ratio of the digital pulse amplitude to baseline rose rapidly in the hyperaemic fingertip after forearm cuff deflation, and then slowly decreased towards the baseline (Fig. 2). However, we detected the maximal hyperaemic response in the 30–60-s interval, whereas in the Framingham study the pressure amplitude ratio was highest in the 60–90-s interval. The difference in the time of maximal hyperaemic response between the Framingham study and our report might be related to the fact that finger applanation tonometry measures pressure changes while photoplethysmography measures changes of the relative amount of blood volume. In a visco-elastic medium pressure and volume changes might be out-of-phase.
We observed the expected relations between the hyperaemic PPG pulse amplitude response and cardiovascular risk factors. For example, in our current study and in Framingham report,6 women had a more pronounced hyperaemic response than men. In line with another study14 which used FMD to evaluate endothelial function, we demonstrated a significant association between PPG amplitude changes and hypertension. Higher systolic blood pressure was associated with lower hyperaemic response in age- and sex-adjusted analysis. Similar to the Framingham study, in which finger applanation tonometry was used to assess the endothelial function,6 we observed a non-significant relation between hyperaemic PPG pulse amplitude changes and advancing age. On the other hand, previous studies reported lower endothelial function as assessed by FMD with advancing age.14,15 Differences in the age-related hyperaemic responses between microcirculatory and macrocirculatory reactivity might explain these divergent findings.9
The present study must be interpreted within the context of its potential limitations and strengths. First, PPG pulse amplitude registration is prone to measurement error due to higher variability in comparisons with the FMD technique.16 On the other hand, assessment of the hyperaemic PPG pulse wave amplitude changes requires little training and is operator-independent. Moreover, under strictly controlled conditions, we were able to demonstrate a good inter-session reproducibility of the hyperaemic response as measured by the PPG techniques. Second, our sample size was smaller than in the Framingham study.6 On the other hand, the correlates of hyperaemic response were as expected and constitute an internal validation of the PPG techniques in assessment of arterial function.
In conclusion, our study is the first to describe in a sample of a general population the determinants of pulse amplitude hyperaemic changes measured by PPG technique. We demonstrated that measurement of the hyperaemic response by the PPG technique might be a useful tool in the detection of endothelial dysfunction associated with higher blood pressure, while accounting for the differential response to hyperaemia between men and women. Further studies are required to validate the PPG technique for the non-invasive assessment of endothelial function.
Funding
Disclosures
GC and DJ work at FLOMEDI, a spin-off company of the Engineering School in Brussels. The company designs and develops software and electronic medical devices in order to facilitate, simplify, and increase accuracy of non-invasive assessment of vascular stiffness.
Acknowledgements
The authors gratefully acknowledge the expert assistance of Linda Custers, Marie-Jeanne Jehoul, and Hanne Truyens (Leuven, Belgium).
References
Cite this article
TY  - JOUR
AU  - Tatiana Kuznetsova
AU  - Gregory Szczesny
AU  - Lutgarde Thijs
AU  - Dominique Jozeau
AU  - Jan D’hooge
AU  - Jan A. Staessen
PY  - 2011
DA  - 2011/04/06
TI  - Assessment of peripheral vascular function with photoplethysmographic pulse amplitude
JO  - Artery Research
SP  - 58
EP  - 64
VL  - 5
IS  - 2
SN  - 1876-4401
UR  - https://doi.org/10.1016/j.artres.2011.03.001
DO  - 10.1016/j.artres.2011.03.001
ID  - Kuznetsova2011
ER  -