
Aortic pulse wave velocity measured by pulse wave imaging (PWI): A comparison with applanation tonometry
Present address: LSIIT, UMR 7005 CNRS-Strasbourg University, France.
- DOI
- 10.1016/j.artres.2011.03.002How to use a DOI?
- Keywords
- Arterial stiffness; Pulse wave velocity; Ultrasound imaging; Applanation tonometry
- Abstract
Background: Arterial stiffness is a well-established indicator of cardiovascular disease outcome. Pulse Wave Velocity (PWV) is a surrogate for arterial stiffness that is measured either globally using carotid-to-femoral applanation tonometry or locally using biomedical imaging methods. Pulse Wave Imaging (PWI) is an ultrasound-based method for both qualitative visualization of the pulse wave propagation and quantitative estimation of arterial stiffness. The objective of this study is to assess the PWI performance in PWV estimation by comparing local abdominal aortic PWV values obtained by PWI to the carotid-femoral PWV measured by applanation tonometry.
Methods: A total of 18 subjects (age 18–66, 32.5 ± 14.5) with no history of cardiovascular disease were consecutively tested by both PWI and tonometry.
Results: The correlation coefficient r between values estimated with the two methods was found to be equal to 0.68. A linear regression yielded PWVPWI = 1.02* PWVtonometry +0.15. Tukey mean-difference plots indicated that PWVPWI was significantly lower than PWVtonometry (−0.3 m/s) at lower PWV values (PWV ≤ 7 m/s), whereas PWVPWI was significantly higher (+1.4 m/s) than PWVtonometry at higher PWV values (PWV > 7 m/s).
Conclusions: Despite the regional nature of the PWVPWI measurements, as opposed to the global PWVtonometry measurements, abdominal PWVPWI and carotid-femoral PWVtonometry values were found to be similar, with an average bias equal to 0.25 m/s. Such a bias and its variation with PWV may be partially explained by both physiological variations of PWV along the arterial tree and by the increasing uncertainty of the PWV estimate by PWI as PWV increases.
- Copyright
- © 2011 Association for Research into Arterial Structure and Physiology. Published by Elsevier B.V. All rights reserved.
- Open Access
- This is an open access article distributed under the CC BY-NC license.
Introduction
Over the past two decades, the arterial stiffness has gained clinical significance, as a parameter that has been shown to be well correlated with a risk of cardiovascular disease and to be an independent predictor of cardiovascular outcome.1–7 The pulse wave velocity (PWV) is directly and quantitatively related to the underlying mechanical properties of the arterial wall. As a consequence, PWV is a common surrogate for the measurement of arterial stiffness. The most common approach used clinically for PWV estimation consists of measuring pulse wave profiles by applanation tonometry at two distant locations (e.g., carotid and femoral) and to measure the delay in the onset of the wave between these two locations. The PWV is calculated by dividing the distance between the two measurement points by the time difference. Although carotid-to-femoral PWV tonometry-based methods have been used in numerous clinical studies, they typically suffer from significant technical and fundamental limitations.8 In addition to the technical limitations related to the practice of tonometry and the uncertainty of the path traveled by the PWV, one of the major fundamental limitations is that a global PWV estimate is provided. However, as it has been attested invasively, PWV varies significantly along the entire arterial tree due to variations in both the geometry and structure of the arteries.9–11 The carotid-to-femoral PWV estimate represents therefore an average of the local PWV values all along this arterial segment. Different arteries will stiffen at different rates and magnitudes during aging, with central arteries undergoing significantly higher stiffening than peripheral arteries.10 More importantly, a large number of pathologies result in localized arterial stiffening. For these reasons, it is particularly interesting to be able to measure the PWV locally.
Several biomedical Imaging methods have been previously proposed for the purpose of estimating PWV locally, mainly using MRI12–17 and ultrasound.18–21 Pulse Wave Imaging (PWI)22 was developed by our group as a method for both qualitative visualization of the pulse wave propagation in real time23 and for quantitative estimation of the PWV within the imaged arterial segment.24 PWI relies on the tracking of the arterial wall displacement using cross-correlation methods on the RF ultrasound signals acquired at high frame rate. While the quantitative nature and the reliability of PWI have been demonstrated in aortic phantoms,24 the method has not been compared to any other method for PWV estimation in human subjects. The objective of this study is to compare PWV values measured by PWI in the abdominal aorta to those obtained by the conventional, carotid-femoral applanation tonometry method.
Methods
Protocol
Experiments were performed in a population with no history of cardiovascular disease (N = 18, age = 32.5 ± 14.5, ranging from 18 to 66 y.o.). All experiments were approved by the Institutional Review Board of Columbia University. PWI and tonometry experiments were consecutively performed in order to minimize the effect of possible variations in PWV. Experiments lasted on the average 5 min and 10 min for the PWI and applanation tonometry, respectively.
PWI
Ultrasound images were acquired transabdominally at the renal branch of the abdominal aorta. Ultrasound RF data were acquired on a clinical scanner (Sonix Touch, Ultra-Sonix, BC, Canada). The incremental (interframe) arterial wall displacements were estimated using a fast cross-correlation method on raw RF ultrasound signals.23 The abdominal aorta was imaged using a curvilinear array (fc = 3.3 MHz). The sector of the acquired image varied between 50° and 70°, and the depth between 70 mm and 120 mm, depending on the subject. For all subjects, a line density of 32 beams per full sector was used, yielding a frame rate within the 248–392 Hz range. For each subject, several acquisitions (n = 3–6) were performed at the same location. Each acquisition lasting approximately 2.5 s, there were generally at least two full cardiac cycles in a single acquisition. PWV values were averaged among the total number of cycles in every subject (total number of cycles = 6–12). Subjects were asked to hold their breath during each acquisition (approximately 2.5 s).
Details on the PWV estimation method used here have already been reported elsewhere.24,25 In summary, the arterial segment is imaged longitudinally and incremental displacement of the arterial wall is estimated (see for example Fig. 1). A spatiotemporal diagram is obtained that represents the displacement of the arterial wall versus time along each ultrasound beam (Fig. 2a). The onset of the wave is tracked versus time and distance from the heart. This fiduciary point (close to the “foot” of the waveform) was calculated on the incremental displacement waveform.25,26 It was defined as 50% of the maximum upstroke of the incremental displacement, which corresponded approximately to 25% of the maximum distension (Fig. 3). Fig. 3 illustrates how the fiduciary point is calculated from the measured incremental displacement. The linear regression of the spatiotemporal coordinates of the fiduciary point yields an average PWV value within the imaged segment (Fig. 2b). In this study, we also propose the use of the correlation coefficient obtained from this linear regression as an index of reliability of the estimated PWV measure. Finally, it is important to note that a time delay exists between acquisitions of two neighboring ultrasound beams, due to the finite ultrasound speed. The beam sweeping acquisition speed at a line density of 32/sector is approximately 15° per millisecond, depending on the depth of the image. This induces artifactual time delays between two successive lines that need to be corrected in order to ensure appropriate PWV estimation. Such a correction was performed in the PWI acquisitions used here by subtracting the artifactual time delays.
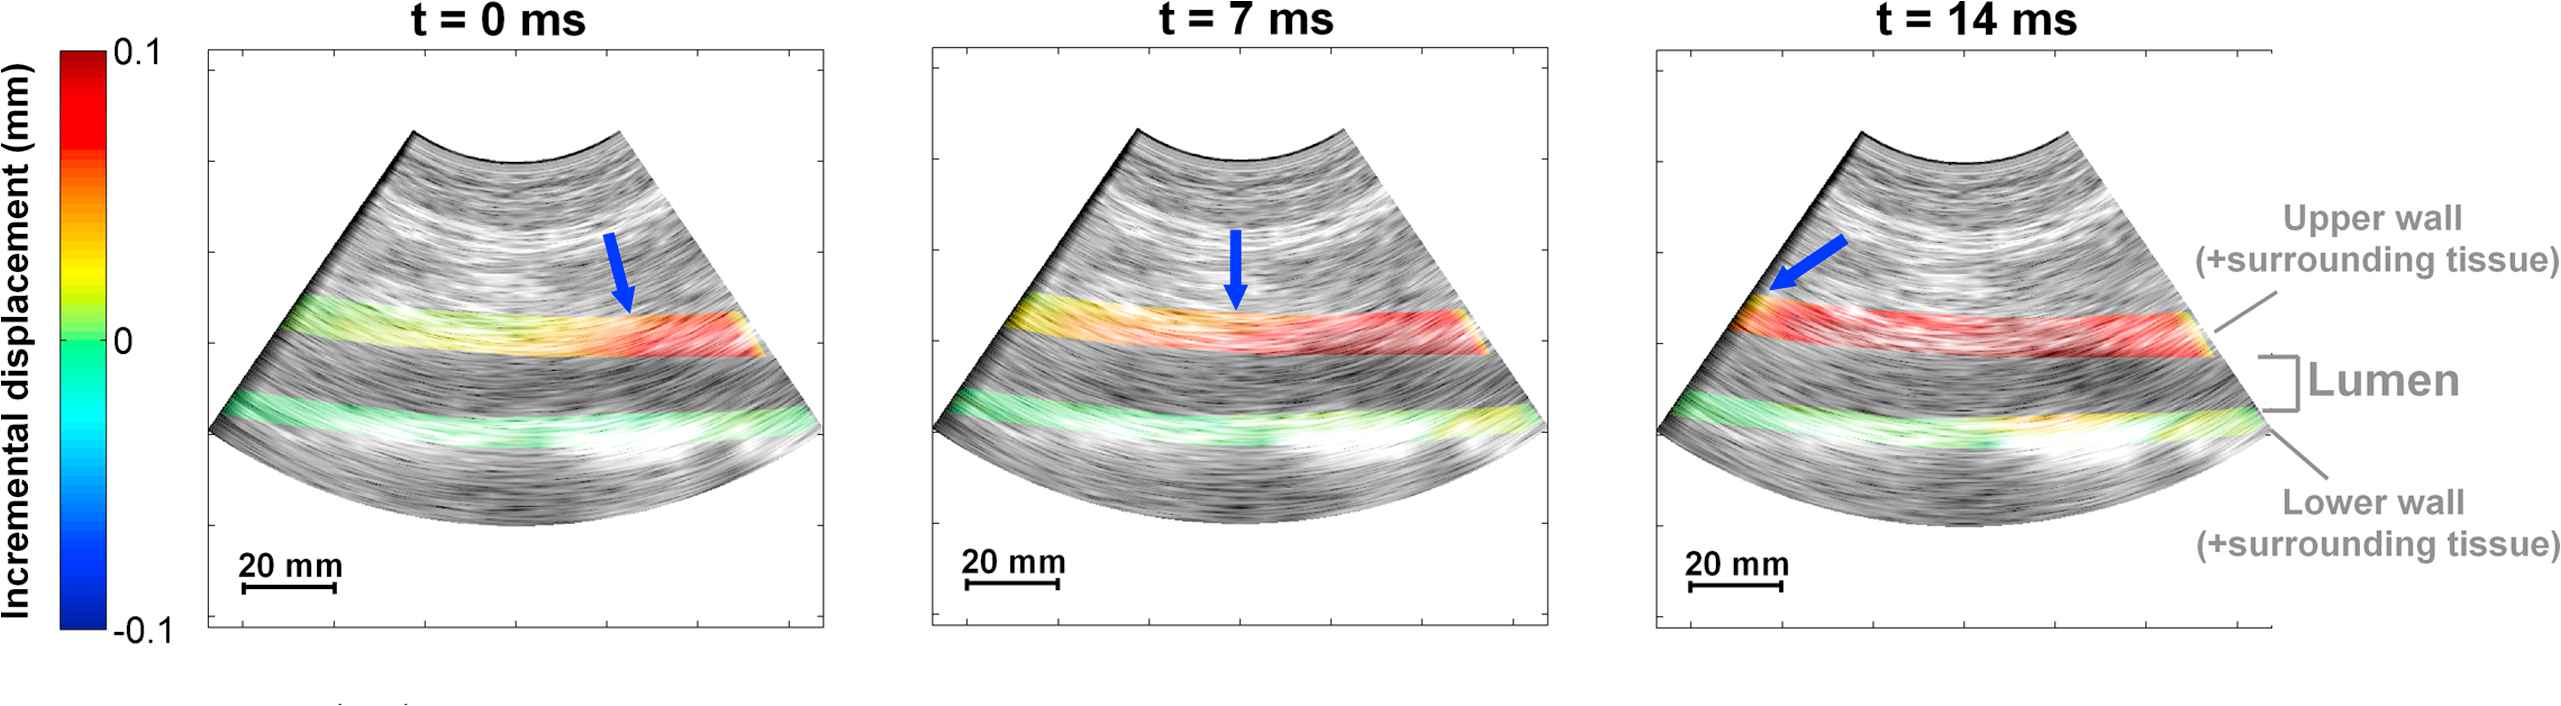
Example of PWI images in one subject. The incremental displacement of the arterial wall and the surrounding tissue is illustrated at three consecutive time points. The wave propagates from right to left (proximal to distal). The arrow depicts the pulse wavefront, which is tracked versus time and distance.

(a) Spatiotemporal diagram representing the wall displacement versus time and distance. The circular points depict the onset of the wave. (b) The fitting of the spatiotemporal coordinates of these points yields the PWV.
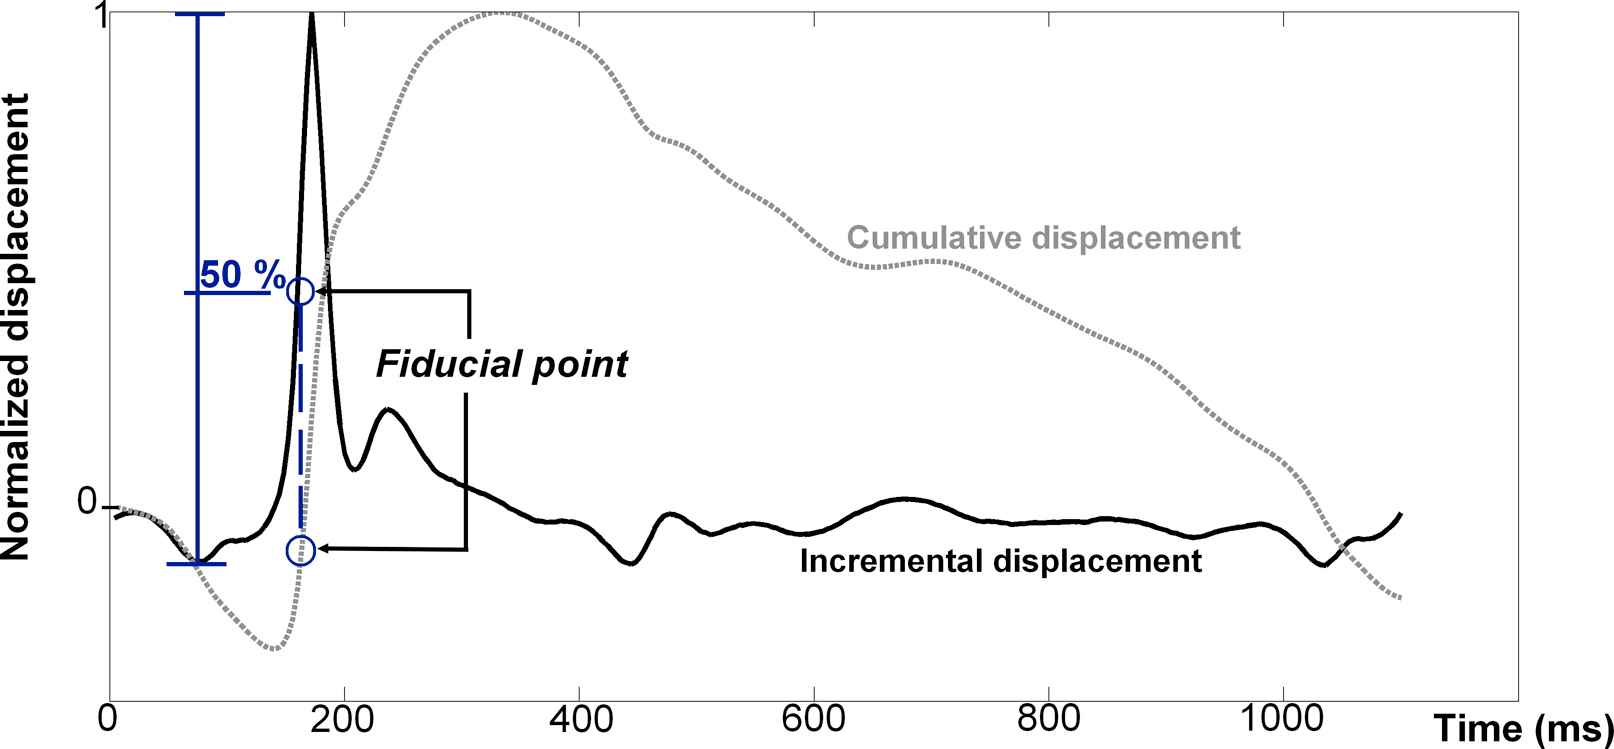
The fiduciary point is determined as 50% of the maximum amplitude of the incremental displacement. The cumulative displacement is also represented for information.
Applanation tonometry
The carotid-to-femoral PWV was measured using a commercially available system (Sphygmocor, AtCor Medical, Sydney, Australia). The pressure waveforms were acquired at both the left common carotid and the left common femoral locations sequentially, and were synchronized on the ECG waveform. The measurement obtained was the average over 10 cardiac cycles. The foot of the wave was estimated using an intersecting tangents algorithm. The distance assumed to be traveled by the pulse wave was the difference between the suprasternal notch to femoral and the suprasternal notch to carotid distances, which were measured using a measuring tape provided as part of the system.
Results
Figure 1 illustrates an example of PWI sequential images during pulse wave propagation in one subject, showing the propagation of the pulse wave. Fig. 2 illustrates the corresponding spatiotemporal diagram and the spatiotemporal coordinates of the fiduciary point, yielding the estimate of the PWV value in this case.
Figure 4a illustrates the average correlation coefficient resulting from linear regression on the spatiotemporal coordinates of the fiduciary point for all subjects. As previously explained, this coefficient can be considered as an index of reliability of the PWV measurement. It is clearly evident that excellent correlation (r > 0.945) is obtained for the PWV values smaller than 8 m/s, while this correlation decreases to 0.9 < r < 0.945 for the PWV values higher than 8 m/s.
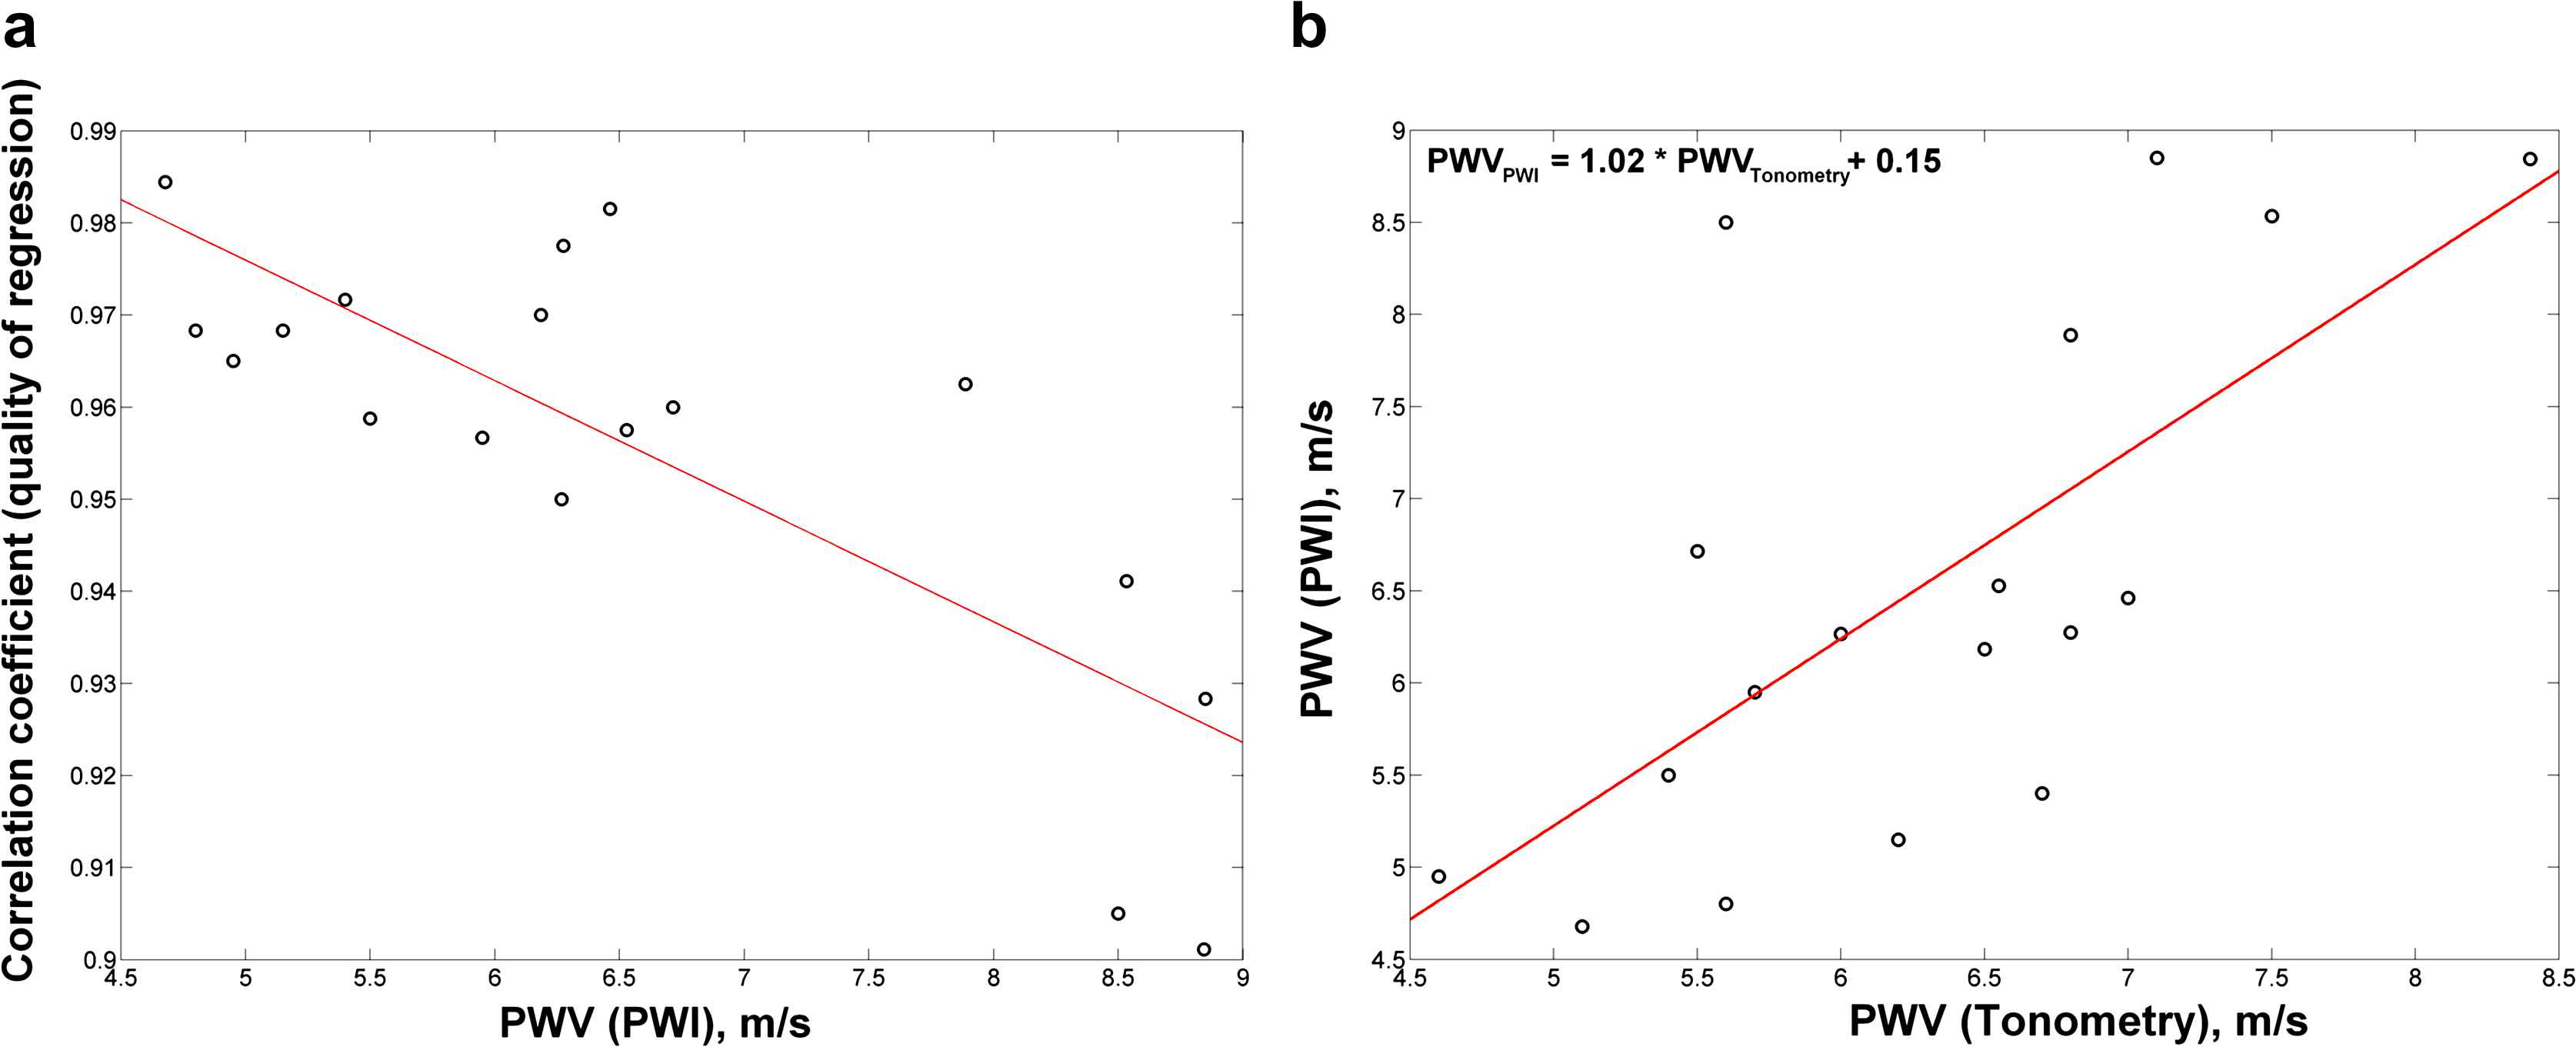
(a) Correlation coefficient from the fitting of the fiduciary point, plotted against the estimated PWV. This plot suggests that the quality of the estimate decreases for PWV values higher than 8 m/s. (b) Correlation plot between PWI and carotid-femoral tonometry results (r = 0.68).
PWV values obtained by PWI against those obtained by tonometry are represented in Fig. 4b. The correlation coefficient r was found to be equal to 0.68. A linear regression between PWVtonometry and PWVPWI yielded:
PWV values obtained by the two methods are represented in Fig. 5 against the age of the subjects. Although the number of subjects is limited, the results obtained by both tonometry and PWI indicate that PWV increases with age.
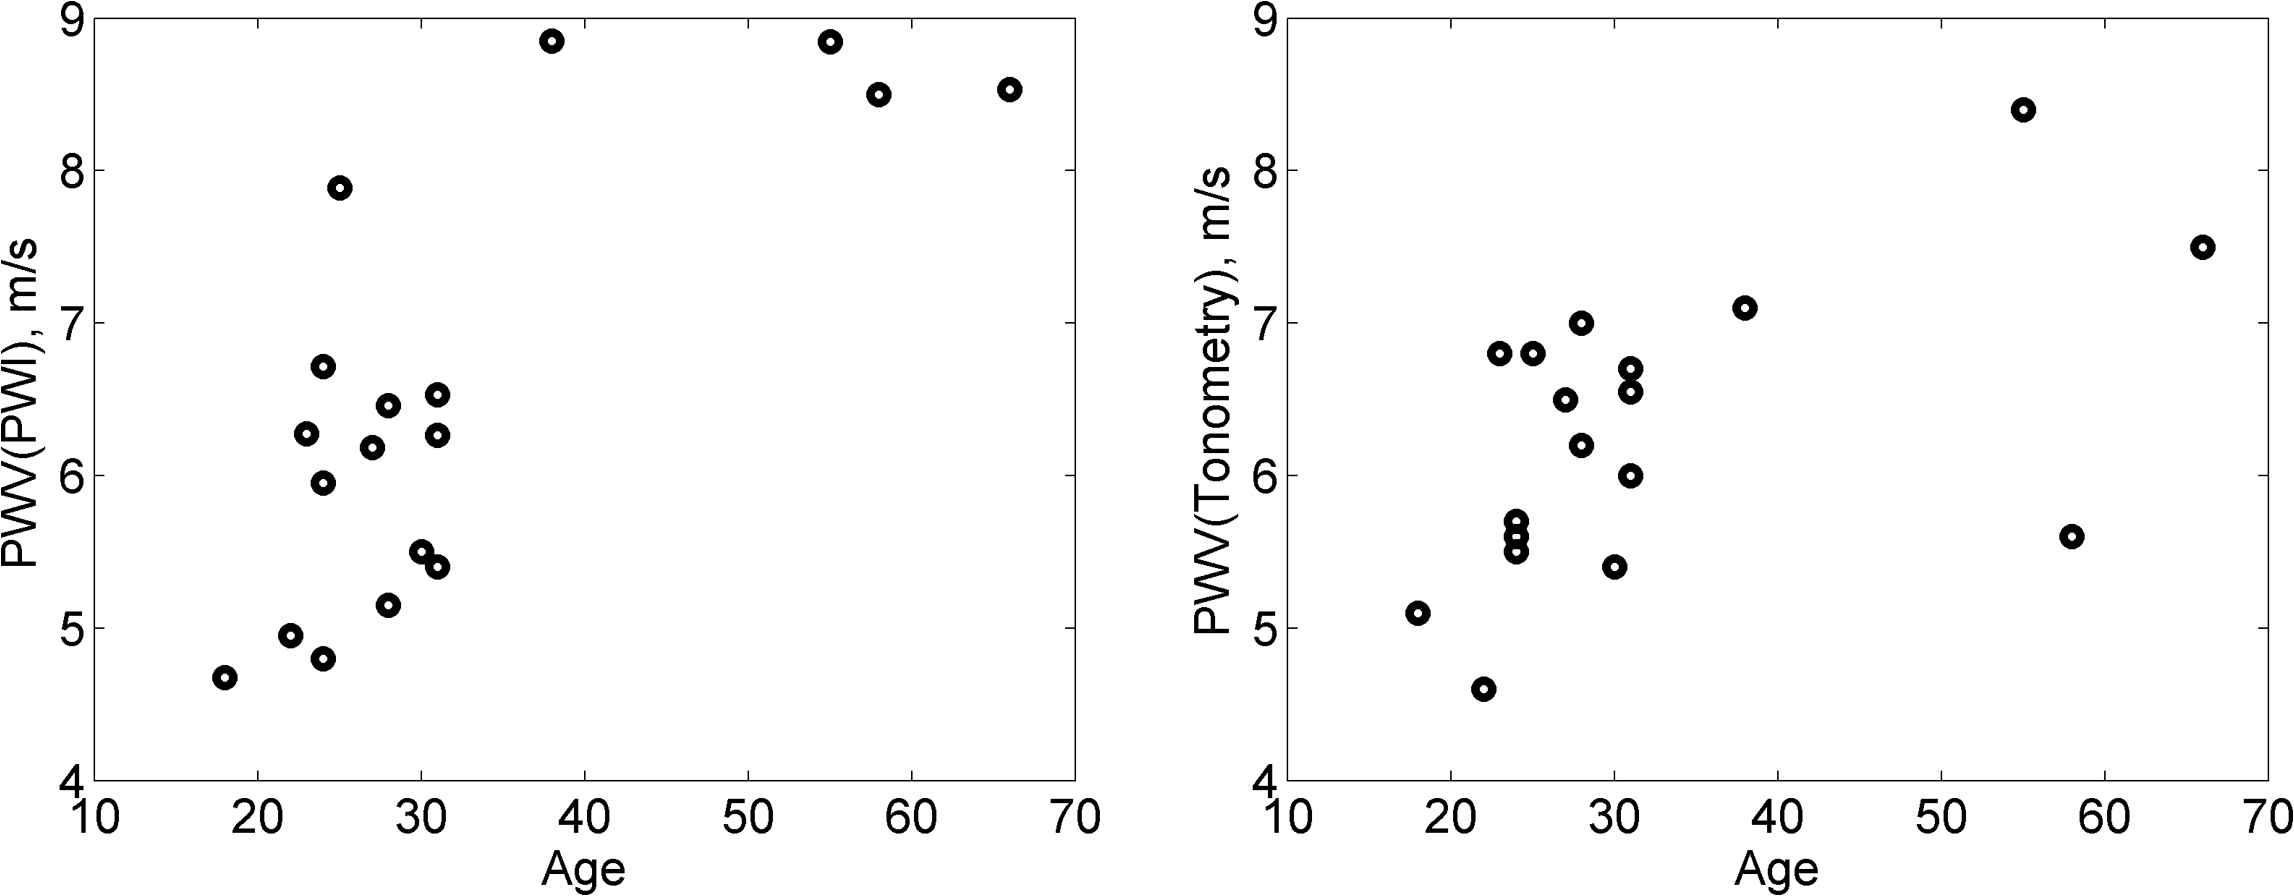
PWV versus age for both PWI and tonometry.
Figure 6 illustrates the identity plot and the Tukey mean-difference plot (also known as Bland–Altman plot), representing PWVPWI – PWVtonometry against the average of the two measurements, i.e., 0.5 * (PWVtonometry + PWVPWI). A bias of 0.25 m/s and a standard deviation of 1.05 m/s were found. This plot suggests that PWVPWI values are on the average lower than carotid-femoral PWVtonometry at lower PWV (PWV≤7 m/s), while the opposite is true at relatively higher PWV (PWV>7 m/s).
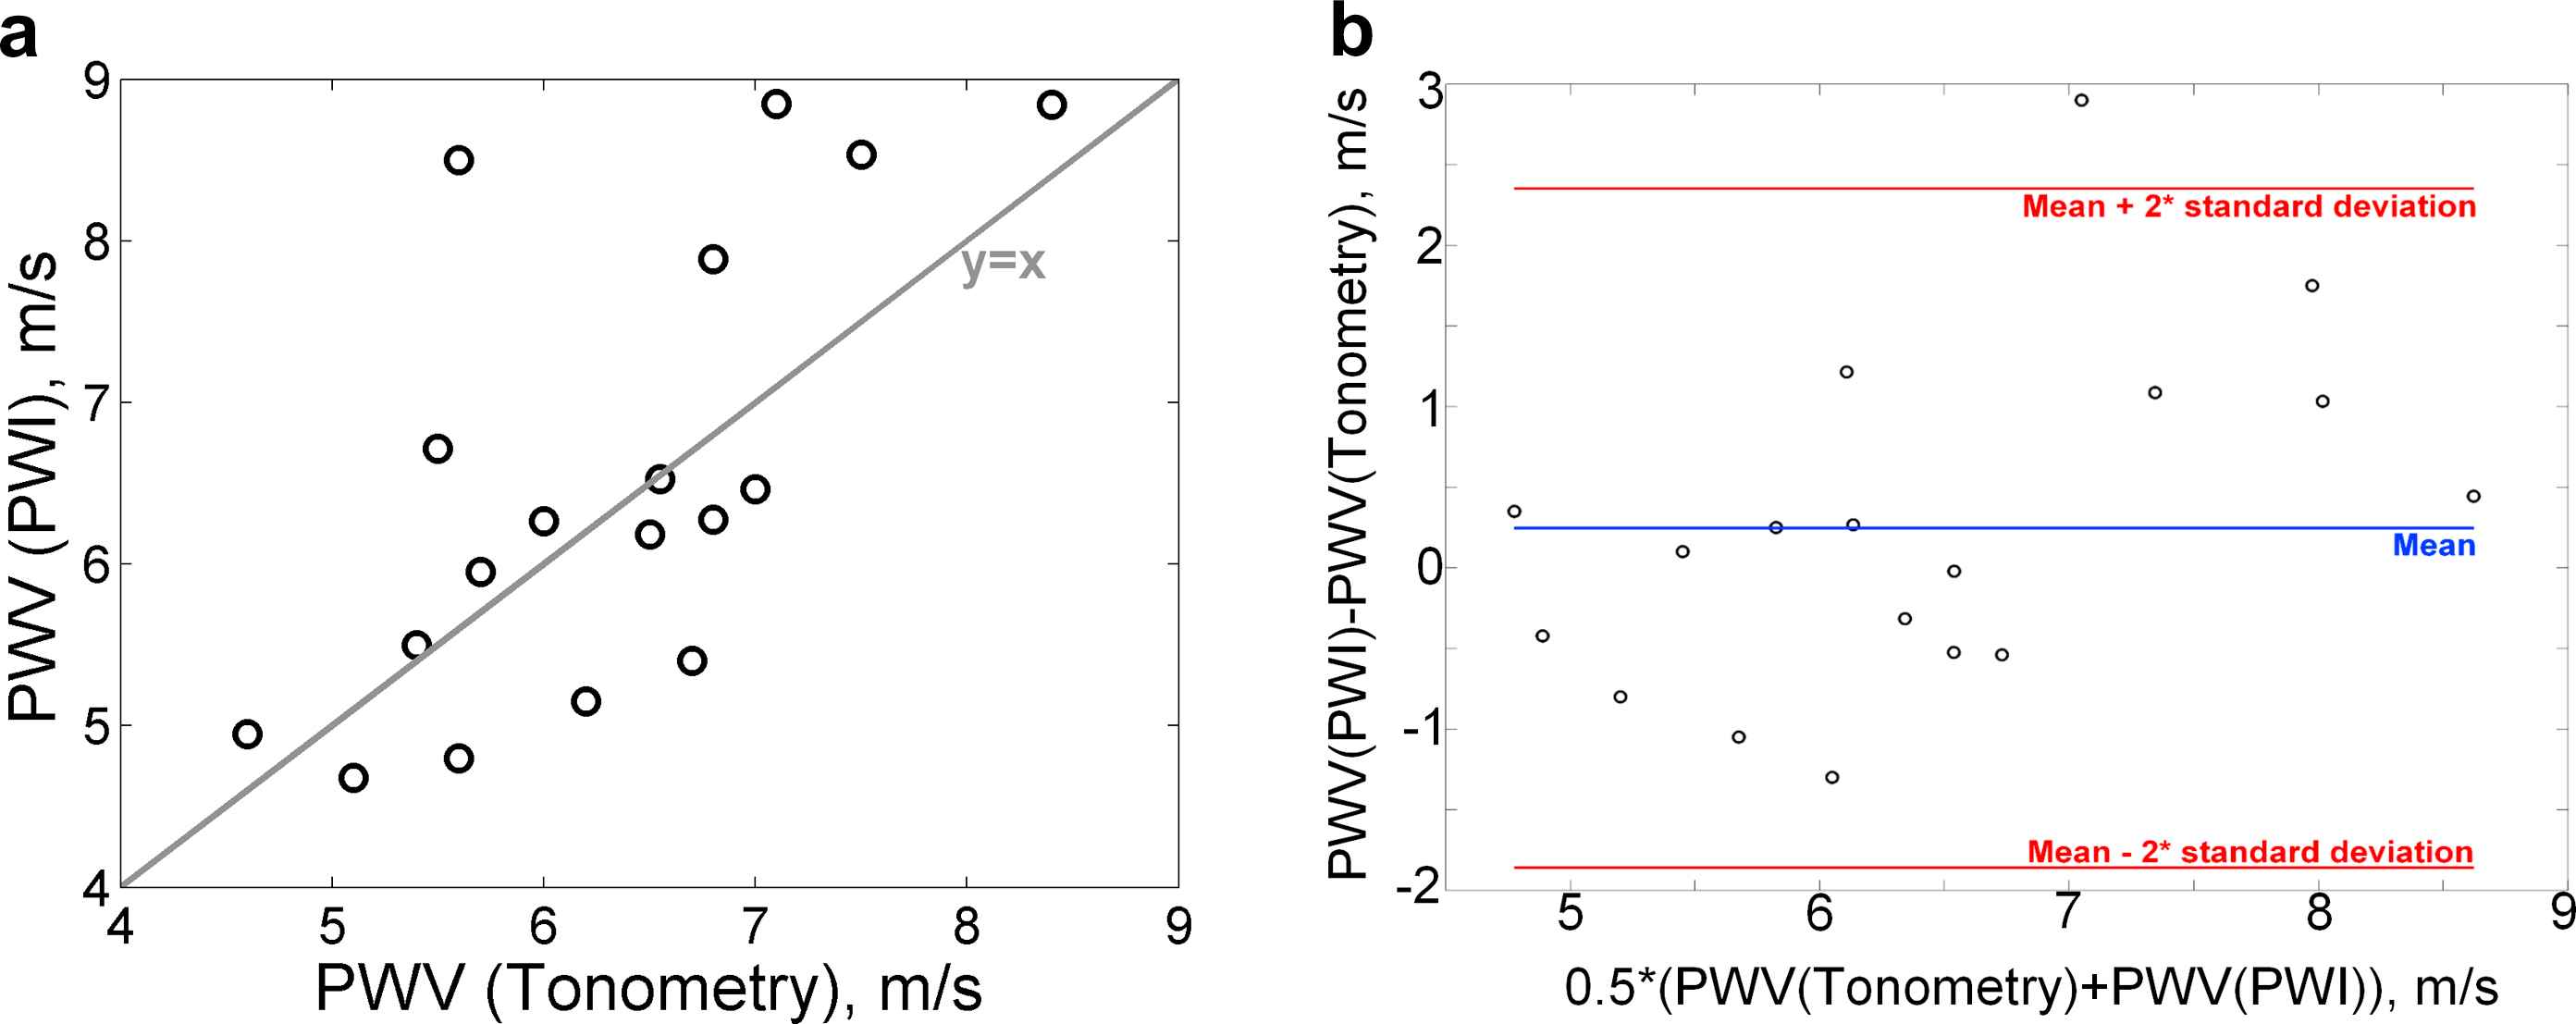
Bland and Altman analysis, featuring (a) the identity plot and (b) the Tukey mean-difference plot, also known as Bland–Altman plot, representing the difference between PWVPWI and PWVtonometry versus the average of the two measurements.
Discussion
In this study, local PWV values measured by the non-invasive ultrasound PWI method were compared to global carotid-to-femoral PWV values measured by applanation tonometry. The correlation coefficient between PWI and tonometry measurements was found to be equal to 0.68, and the linear regression coefficient was found to be close to 1 (PWVPWI = 1.02 * PWVtonometry +0.15, Fig. 4b). Such numbers indicate that there is a good agreement between the two methods on the population that was studied.
The mean-difference plot indicates a bias of +0.25 m/s and the linear regression yields an intercept of +0.15 m/s. This indicates a low bias, which will be verified in future, larger population studies.
This study also proposed to use the correlation coefficient of the linear regression fit of the PWI spatiotemporal variations as an index of reliability of PWVPWI. Excellent correlation was found for PWV values lower than 8 m/s, while this correlation decreased for PWV values higher than 8 m/s. There are two possible causes for such an observation. The first is that higher PWV values may be generally associated with higher non-uniformity of the structural and mechanical properties of the arterial wall, as PWV increases with age. Hence, there may be physiologically natural PWV changes within the imaged arterial segment, resulting in lower correlation coefficient when a global linear regression is performed. Part of the ongoing research is focused on using the ability of PWI for estimating local PWV, the final objective being to map local PWV variations along the arterial wall within the imaged segment. The second possible cause is related to the technical limitations of the PWI method, as the uncertainty of the PWV estimate depends on the frame rate.
A clear trend can be observed from the mean-difference plot. PWV values measured by PWI seem to be lower compared to those obtained by tonometry for lower PWV values (PWV≤7 m/s), while the trend seems to be reversed for higher PWV values. The average value of PWVPWI – PWVtonometry for the (PWV≤7 m/s) group was found equal to −0.3 m/s, while the average value of PWVPWI – PWVtonoetry for the (PWV>7 m/s) group was found equal to +1.4 m/s. However, a larger population will need to be considered to further confirm this trend, especially in subjects of the latter group (PWV>7 m/s).
The discrepancy between PWVPWI and PWVtonometry values observed in this study could also be explained by normal variations of aortic stiffness along the arterial tree. As previously indicated, we have compared local measurements performed in the abdominal aorta to global measurements representing an average of the PWV between the carotid and femoral sites. Variations of the PWV along the arterial tree have been previously observed.9,11 Such invasive studies have reported a centrifugal increase of the PWV. For example, Nichols and McDonald9 have reported average PWV values of 4 m/s, 6 m/s and 10 m/s for the ascending aorta, abdominal aorta and iliac artery, respectively. Latham et al.11 have reported PWV values of 4.4 m/s, 5.7 m/s and 8.8 m/s at the aortic root, the abdominal aorta and the femoral artery, respectively. Since the carotid-femoral PWV represents an average value of the PWV between these two sites of measurement, it is expected to be higher than the thoracic aortic PWV. However, no definite hypothesis can be a priori established regarding the relationship between abdominal aortic PWV and carotid-to-femoral PWV, since the former is expected to be higher than the thoracic PWV but lower than the iliac-femoral PWV. According to our observations, abdominal PWVPWI values were found to be significantly lower than carotid-femoral PWV values for lower PWV values (PWV ≤ 7 m/s), while the opposite was found to be true for higher PWV values (PWV > 7 m/s). Such observations are in agreement with the hypothesis that the abdominal aorta is the aortic segment that stiffens the most during aging, as attested by phase contrast MRI PWV measurements.27 This could explain that PWI abdominal aortic measurements have a larger spread than tonometry PWV measurements. However, these conclusions must be considered with caution, due to the increasing uncertainty of PWI as PWV increases and transit time decreases. This limitation of the PWI method will be explained in more detail further in this discussion, as it may also be partially responsible for the observed differences between PWI and tonometry.
Overall, an important conclusion of this study is that abdominal PWVPWI and carotid-femoral PWVtonometry values were found to be very similar in magnitude, with an average bias lower than 0.5 m/s.
The limitations of both methods have to be considered. For tonometry, the distance measured in this study was the difference in distances between the suprasternal notch to the femoral and the suprasternal notch to the carotid. The effect of the arterial pathway on the resulting PWV values has been previously shown. For example, Sugawara et al.28 have reported up to a 31% relative difference in PWV values measured along the different arterial paths on the same subjects. Another major limitation of tonometry is the lack of knowledge of the actual, patient-specific geometry, along which the pulse wave travels. Therefore, there is a systematic uncertainty in the PWV estimated by carotid-to-femoral tonometry. In PWI, the main critical limitation is the one related to the frame rate of acquisition. The frame rate varied within 248–392 Hz depending on the subject and the depth of scanning required. Since the PWV is estimated from the spatiotemporal fitting of the foot of the distension wave, the accuracy of the measurement is strongly dependent on the ratio between the time of propagation of the pulse wave within the imaged segment and the time of acquisition of one frame (1/frame rate). Such a ratio varied approximately between 2.5 and 6 for the fastest and slowest PWV measurements, respectively. As a consequence, the uncertainty regarding higher PWV measures is significantly greater than the one regarding lower PWV values. This increasing uncertainty as the PWV increases was observed in the decrease of the correlation coefficient resulting from the fitting of the fiduciary point (Fig. 4a). Achieving higher frame rates, and therefore increasing the accuracy of higher PWV estimates, are part of ongoing technical developments of the PWI method.
In addition to specific limitations relative to each method, it is important to keep in mind that in this study, a local PWV measure (abdominal aortic PWV) was compared to a global PWV measure (carotid-to-femoral) as the latter remains the state of the art of non-invasive PWV estimation. Despite this, and despite specific limitations related to each method, a significant correlation was found between PWVPWI and PWVtonometry and the bias between values obtained by the two methods was found to be relatively low.
In summary, good correlation (r = 0.68) and a small bias (0.25 m/s) were found between global PWV measured by tonometry and PWV measured locally in the abdominal aorta using PWI. A larger population that includes pathological subjects must be considered to confirm the trends presented in this study. However, this study illustrated the feasibility and the quantitative nature of PWI as a non-invasive method for local estimation of arterial stiffness. Ongoing studies are focused on using the localized nature of PWI to quantify arterial stiffness variations within the arterial tree, by measuring the PWV at other arterial sites such as the thoracic aorta and the common carotid.
Disclosure
None.
Acknowledgments
This study was supported by
References
Cite this article
TY  - JOUR
AU  - Jonathan Vappou
AU  - Jianwen Luo
AU  - Kazue Okajima
AU  - Marco Di Tullio
AU  - Elisa Konofagou
PY  - 2011
DA  - 2011/04/03
TI  - Aortic pulse wave velocity measured by pulse wave imaging (PWI): A comparison with applanation tonometry
JO  - Artery Research
SP  - 65
EP  - 71
VL  - 5
IS  - 2
SN  - 1876-4401
UR  - https://doi.org/10.1016/j.artres.2011.03.002
DO  - 10.1016/j.artres.2011.03.002
ID  - Vappou2011
ER  -