
Retinal arteriolar and venular phenotypes in a Flemish population: Reproducibility and correlates
Contributed equally to this work.
- DOI
- 10.1016/j.artres.2011.03.004How to use a DOI?
- Keywords
- Arterioles; Microcirculation; Population research; Reproducibility; Retina; Venules
- Abstract
Background: To our knowledge, no previous study assessed the reproducibility of non-mydriatic imaging of retinal microvessels using state-of-the-art Bland and Altman statistics.
Methods: In 194 subjects randomly selected from a Flemish population, we post-processed retinal images (Canon Cr-DGi) using IVAN software to generate the retinal arteriole and venule equivalents (CRAE and CRVE) and the arteriole-to-venule ratio (AVR). We searched for significant (p ≤ 0.05) correlates of the retinal phenotypes, using stepwise multiple regression. To study intra- and inter-observer variability, 2 observers post-processed a random subset (n = 84) in duplicate. According to Bland and Altman’s approach, reproducibility was twice the standard deviation of the pairwise differences between duplicate measurements, expressed as a percentage of the average of all measurements.
Results: In 194 participants (age range, 18–79 years; 52.5% women), CRAE, CRVE, and AVR averaged (±SD) 175.3 ± 22.8 μm, 284.3 ± 20.5 μm, and 0.62 ± 0.10, respectively. CRAE increased with female sex (+8.4 μm) and current smoking (+9.1 μm) and decreased with age (−0.30 μm/year) and mean arterial pressure (−0.41 μm/mmHg). CRVE decreased with age (−0.42 μm/year). AVR increased with female sex (+0.03 units). The intra-observer reproducibility of CRAE, CRVE and AVR was 13.2%, 8.4% and 9.0% for observer 1 and 10.3%, 10.8% and 16.0% for observer 2. Inter-observer reproducibility amounted to 10.8%, 9.9% and 14.6%, respectively.
Conclusion: Our study further validates the non-mydriatic approach to phenotype retinal microvessels, because it showed acceptable intra- and inter-observer variability and because the correlates of these retinal phenotypes were consistent with those reported in the literature.
- Copyright
- © 2011 Association for Research into Arterial Structure and Physiology. Published by Elsevier B.V. All rights reserved.
- Open Access
- This is an open access article distributed under the CC BY-NC license.
Introduction
Since 1898, clinicians recognised narrowing of the retinal arterioles, as observed during fundoscopy, as an early sign of hypertensive retinopathy and a prognostic indicator in hypertensive patients.1–3 Non-mydriatic visualisation of retinal arterioles and venules provides a means to assess early structural changes and pathologies of the microcirculation. Using this non-mydriatic approach, population studies revealed associations of retinal arteriolar calibre with ethnicity, sex, age, blood pressure, smoking and measures of obesity.4–8 Retinal venular calibre, on the other hand, is associated with age, blood pressure, blood sugar, smoking habits, measures of obesity and inflammation.5–7,9,10
Currently available semi-automated computer-based retinal imaging programs are highly accurate and reproducible for measuring retinal vessel calibre. However, the observer still introduces an amount of error during post-processing. In the aforementioned previously published population studies, investigators assessed the intra- and inter-observer variability of the central retinal arteriolar equivalent (CRAE), the central arteriolar equivalent (CRVE) and the arteriole-to-venule ratio (AVR) using correlation coefficients.11–15 However, correlation coefficients reflect the strength of a relation between two sets of measurements and not the agreement between them and might therefore be less suitable for assessing reproducibility.16 The goal of our current study was to assess the intra- and inter-observer variability of CRAE, CRVE and AVR, using the state-of-the-art Bland and Altman approach, and to study the consistency of the correlates of these phenotypes across population studies.
Methods
Study population
The Ethics Committee of the University of Leuven approved the Flemish Study on Environment, Genes and Health Outcomes (FLEMENGHO).17 As described elsewhere, from August 1985 until December 2008, we identified a population sample randomly recruited from a geographically defined area in Northern Belgium. From January 2008 to November 2009, we re-invited 305 former participants, for a follow-up examination at our field centre, including imaging of the retinal microvessels. After excluding 58 patients who were bedridden or institutionalized, we obtained informed written consent from 247 participants for fundoscopy (participation rate 81.3%). We excluded 53 subjects in whom none of the retinal images was technically gradable, leaving 194 individuals for analysis of the correlates of the retinal phenotypes. We randomly identified a subset of 84 participants for the assessment of the intra- and inter-observer variability of CRAE, CRVE and AVR.
Measurements
Subjects had to refrain from smoking, heavy exercise, and drinking alcohol or caffeinated beverages for at least 2 h prior to the examination. To facilitate pupil dilation, retinal imaging took place in a dimly lit room, after the subjects had accommodated to darkness for at least 5 min. A single observer (TR) obtained one image per eye with a Canon Cr-DGi (Canon Co., Ltd., Kyoto, Japan) non-mydriatic retinal visualisation system, combined with a digital camera (Canon D-50, Canon Co., Ltd., Kyoto, Japan). He performed 5 consecutive blood pressure readings to the nearest 2 mmHg at the subjects’ right arm, using a standard mercury sphygmomanometer (Riester GmbH, Jungingen, Germany). He applied the Korotkoff technique as outlined in the 2003 guidelines of the European Society of Hypertension.18 For analysis, the 5 readings were averaged. Mean arterial pressure was diastolic pressure plus one third of the difference of systolic minus diastolic blood pressure. Hypertension was a brachial blood pressure of at least 140 mmHg systolic or 90 mmHg diastolic or use of antihypertensive drugs.
At each visit, trained nurses measured body height to the nearest 0.5 cm with a pliable measurer and the participant standing against a wall. Participants wore light indoor clothing without shoes for body weight measurement. Body mass index was weight in kilogrammes divided by the square of height. The nurses administered a validated questionnaire to obtain information on each participant’s medical history, prescription lenses, intake of medications, and smoking and drinking habits.
Post-processing of retinal images
After converting JPEG images to the TIFF format using Phatch (http://photobatch.stani.be/), two trained observers (YL, TR), masked to the participants’ characteristics, systematically and independently identified individual arterioles and venules in duplicate for each image, using a validated computer-assisted program IVAN (Vasculomatic ala Nicola, version 1.1, Department of Ophthalmology and Visual Science, University of Wisconsin–Madison, Madison, WI).12 This software combines the individual measurements into summary indexes: the central retinal arteriolar equivalent (CRAE) and the central retinal venular equivalent (CRVE), based on formulae by Parr et al.19,20 and Hubbard et al.21 The arteriole-to-venule ratio (AVR) was CRAE divided by CRVE.
Review of the literature
We systematically searched for publications relevant to our current research on PubMed using the following keywords: retinal microcirculation (1064 hits), retinal vascular calibre (136), retinal vessel diameters (371), retinal arteriole (1063), retinal venule (430), arteriole-to-venule ratio (157), arterio-venous ratio (1028) and Parr-Hubbard (8). To refine our search of the literature, we combined the aforementioned search terms with the following keywords one at a time: reproducibility, variability, repeatability, intra-observer and intra-observer. We selected 5 articles,11–15 which complied with the following criteria: (1) subjects randomly recruited from a population study; (2) use of the Parr-Hubbard-method to assess retinal vessel calibre; and (3) availability of intra- and inter-observer variability.
Statistical methods
For database management and statistical analyses, we used the SAS software, version 9.2 (SAS Institute Inc, Cary, NC) with its JMP add-on, version 7. Our statistical methods included Student’s t-test for paired observations to compare means and stepwise regression analysis to identify covariables of phenotypes and determinants of reproducibility. In stepwise regression, p-values for covariables to enter and stay in the models were set at 0.15. The covariables considered were sex, age, body mass index, mean arterial pressure, current smoking, current alcohol intake, serum total-to-HDL cholesterol ratio, serum triglycerides, fasting blood glucose, fasting serum insulin and the presence of hypertension.
We assessed the agreement between paired measurements by Bland and Altman’s method. Reproducibility was twice the standard deviation of the pairwise differences between duplicate measurements, expressed as a percentage of the average of all first and repeat measurements. To compare our reproducibility results with those reported in the literature, we also assessed reproducibility from the coefficient of variation, defined as the standard deviation of the pairwise differences between duplicate measurements divided by its mean. We also calculated intraclass correlation coefficients between first and repeat measurements. We compared intraclass correlation coefficients across studies, using Fischer’s Z-transform.22
Results
Characteristics of the participants
Table 1 lists the characteristics of 194 participants used to study the correlates of retinal phenotypes and 84 subjects included in the reproducibility study. In the entire study population, age ranged from 18 to 79 years. Brachial blood pressure averaged 126.4 ± 14.1 mmHg systolic and 79.3 ± 10.3 mmHg diastolic. Of all participants, 69 (35.6%) were hypertensive, and 41 (21.1%) were taking antihypertensive drug treatment. CRAE, CRVE, and AVR averaged (±SD) 175.3 ± 22.8 μm, 284.3 ± 20.5 μm, and 0.62 ± 0.10, respectively. In smokers, the median tobacco use per day was 16 cigarettes (interquartile range, 10–25). In drinkers, the median alcohol consumption was 20 g per day (10–50).
| Characteristic | Entire population | Subset |
|---|---|---|
| Number | 194 | 84 |
| Number with characteristic (%) | ||
| Women | 102 (52.5) | 43 (51.2) |
| Hypertensive | 69 (35.6) | 29 (34.5) |
| On antihypertensive drugs | 41 (21.1) | 16 (19.0) |
| Diabetics | 5 (2.6%) | 2 (2.4%) |
| Current smoker | 40 (20.6) | 16 (19.0) |
| Intake of alcohol | 117 (60.3) | 52 (61.9) |
| Mean values ± SD | ||
| Age (years) | 48.9 ± 16.4 | 47.0 ± 11.6 |
| Body mass index (kg/m2) | 26.6 ± 4.7 | 26.2 ± 4.7 |
| Systolic pressure (mmHg) | 126.4 ± 14.1 | 127.9 ± 12.8 |
| Diastolic pressure (mmHg) | 79.3 ± 10.3 | 80.5 ± 9.8 |
| Mean arterial pressure (mmHg) | 95.0 ± 11.6 | 96.3 ± 10.8 |
| Central retinal arteriolar equivalent (μm) | 175.3 ± 22.8 | 176.3 ± 16.2 |
| Central retinal venular equivalent (μm) | 284.3 ± 20.5 | 290.6 ± 19.5 |
| Arteriole-to-venule ratio (units) | 0.62 ± 0.10 | 0.61 ± 0.05 |
| Fasting glucose (mmol/L) | 4.91 ± 0.62 | 4.92 ± 0.42 |
| Insulin (μU/mL) | 4.79 ± 1.91 | 4.73 ± 1.89 |
| Total cholesterol (mmol/L) | 5.21 ± 0.92 | 5.14 ± 0.96 |
| HDL cholesterol (mmol/L) | 1.46 ± 0.34 | 1.51 ± 0.36 |
Body mass index was body weight in kilogramme divided by height in metres squared. Mean arterial pressure was diastolic pressure plus one third of the difference between systolic and diastolic blood pressure. Hypertension was a brachial blood pressure (mean of 5 consecutive readings) of at least 140 mmHg systolic or 90 mmHg diastolic or use of antihypertensive drugs.
Characteristics of participants.
Correlates of retinal phenotypes
Table 2 lists the partial regression coefficients for CRAE, CRVE and AVR in the entire study sample (n = 194). CRAE increased with female sex (8.42 μm; p = 0.009) and current smoking (9.06 μm; P = 0.02) and decreased with age (−0.30 μm/year; p = 0.007) and mean arterial pressure (−0.41 μm/mmHg; p = 0.013). Mean CRVE decreased with age (−0.42 μm/year; p < 0.0001). AVR was higher in women than in men (+0.034 units; p = 0.02), slightly increased with current smoking (0.028 μm; p = 0.12) and tended to decrease with mean arterial pressure (−0.001 μm/mmHg; p = 0.11).
| Characteristic | CRAE (μm) | CRVE (μm) | AVR (units) | |||
|---|---|---|---|---|---|---|
| Estimate ± SE | r2 | Estimate ± SE | r2 | Estimate ± SE | r2 | |
| Total variance explained | 0.19 | 0.09 | 0.07 | |||
| Partial regression coefficients | ||||||
| Women (0,1) | 8.42 ± 3.19c | 0.02 | 0.034 ± 0.015b | 0.04 | ||
| Age (years) | −0.30 ± 0.11c | 0.02 | −0.42 ± 0.10c | 0.09 | ||
| Mean arterial pressure (mmHg) | −0.41 ± 0.16b | 0.12 | −0.001 ± 0.0007a | 0.01 | ||
| Current smoking | 9.06 ± 3.88b | 0.02 | 0.028 ± 0.017a | 0.00 | ||
CRAE, CRVE and AVR refer to central retinal arteriolar equivalent, central retinal venular equivalent and arteriole-to-venule ratio.
Significance of the partial regression coefficients: P = 0.12.
Significance of the partial regression coefficients: P < 0.05.
Significance of the partial regression coefficients: P < 0.001.
Correlates of the retinal phenotypes in stepwise regression analysis.
Intra-observer reproducibility of repeat measurements
Table 3 lists for the current and previously published studies intra-observer variability, as estimated by Bland and Altman’s approach, the coefficient of variation, and the intraclass correlation coefficient. In the current study, for observer 1 (YL; Fig. 1), the mean differences (±SD) between repeat readings (second minus first) were −1.010 ± 9.250 μm (p = 0.32), 1.834 ± 15.837 μm (p = 0.29) and −0.007 ± 0.049 units (p = 0.19) for CRAE, CRVE and AVR, respectively. As shown in Table 3, the corresponding statistics for the intra-observer differences were 13.2%, 8.4% and 9.0% for reproducibility according to Bland and Altman’s method; 6.76%, 4.59%, and 4.29% for the coefficients of variation; and 0.81, 0.63, and 0.70 for the intraclass correlation coefficients.

Bland–Altman plots for intra-observer variability of observer 1 in post-processing the retinal phenotypes. Mean differences between repeat measurements and ±1.96 SD are represented by full and dotted lines, respectively. Abbreviations: CRAE, central retinal arteriolar equivalent (μm); CRVE, central retinal venular equivalent (μm); AVR, arteriole-to-venule ratio (units).
| Characteristic | N | Age range | CRAE | CRVE | AVR |
|---|---|---|---|---|---|
| Reproducibility (%) | |||||
| Current study, observer 1 | 84 | 18–79 | 13.2 (−14.3 to 12.2) | 8.4 (−7.5 to 9.3) | 9.0 (−9.1 to 8.9) |
| Current study, observer 2 | 84 | 18–79 | 10.3 (−6.7 to 9.8) | 10.8 (−10.2 to 11.4) | 16.0 (−17.0 to 15.0) |
| Coefficient of variation (%) | |||||
| Current study, observer 1 | 84 | 18–79 | 6.76 | 4.59 | 4.29 |
| Current study, observer 2 | 84 | 18–79 | 5.27 | 5.50 | 8.16 |
| Hoorn15 | 256 | 60–85 | 8 | 5 | 9 |
| Intraclass correlation coefficient | |||||
| Current study, observer 1 | 84 | 18–79 | 0.81b | 0.63c,d | 0.70c |
| Current study, observer 2 | 84 | 18–79 | 0.69d | 0.71c,d | 0.70c |
| ARIC13 | 12,642 | 51–72 | 0.69 | 0.89 | 0.84 |
| BDES11 | 4926 | 43–86 | 0.78 to 0.99a | ||
| BMES12 | 187 | 49–87 | 0.88 | 0.90 | 0.79 |
| CHS14 | 2824 | 69–97 | 0.67 to 0.91a | ||
CRAE: central retinal arteriole equivalent; CRVE: central retinal venular equivalent; AVR: arteriole-to-venule ratio; ARIC: Atherosclerosis Risk In Communities, CHS: Cardiovascular Health Study, BDES: Beaver Dam Eye Study, BMES: Blue Mountain Eye Study. Reproducibilty (95% confidence interval) was twice the standard deviation of the pairwise differences between duplicate measurements, expressed as a percentage of the average of all first and repeat measurements. Coefficient of variation was the standard deviation of the pairwise differences between duplicate measurements divided by its mean.
The BDES and CHS investigators only reported a range of intraclass correlation coefficients for all phenotypes.
P < 0.05 for the difference between the current study and ARIC.
P < 0.001 for the difference between the current study and ARIC.
P < 0.001 for the difference between the current study and BMES.
Intra-observer repeatability.
For observer 2 (TR; Fig. 2), the mean differences between repeat readings were −0.109 ± 7.956 μm (p = 0.92), 2.726 ± 12.967 μm (p = 0.05) and −0.006 ± 0.039 units (p = 0.16) for CRAE, CRVE and AVR, respectively. The corresponding statistics for the intra-observer differences (Table 3) were 10.3%, 10.8% and 16.0% for reproducibility according to Bland and Altman’s method; 5.27%, 5.50%, and 8.16% for the coefficients of variation; and 0.69, 0.71, and 0.70 for the intraclass correlation coefficients.
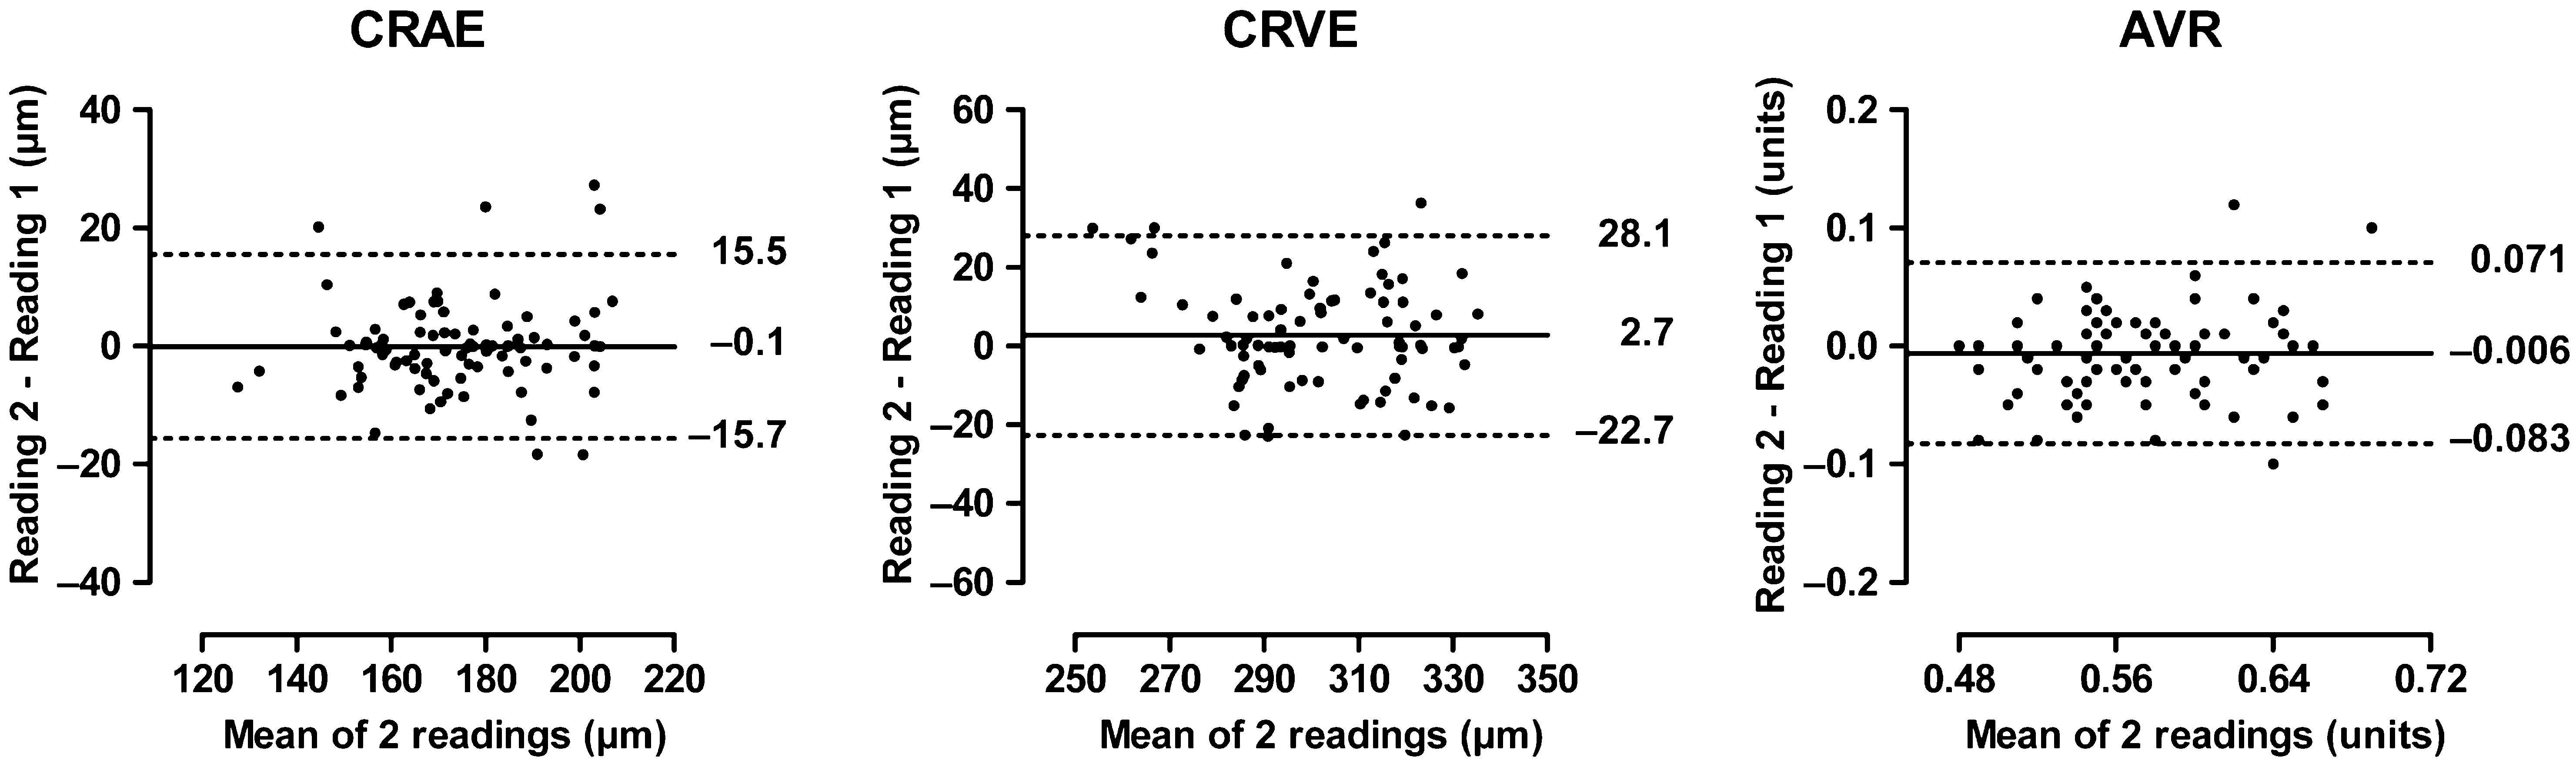
Bland–Altman plots for intra-observer variability of observer 2 in post-processing the retinal phenotypes. For further explanation, see Fig. 1.
Four population studies reported intra-observer differences, using intraclass correlation coefficients, while one population study reported coefficients of variation (Table 3). For CRAE and CRVE, the intraclass correlation coefficients ranged across studies from 0.63 to 0.90 without consistent pattern for CRAE, whereas for CRVE the estimates from both observer 1 and observer 2 were significantly lower (p ≤ 0.001) than those reported in ARIC (Atherosclerosis Risk In Communities) and BDES (Beaver Dam Eye Study). In our current study, the coefficients of variation for the retinal phenotypes ranged from 4.29% to 8.16%, while in the Hoorn Study this range encompassed 5% and 9%.15
Inter-observer reproducibility of repeat measurements
Mean differences between readings from the two observers (observer 2 minus observer 1; Fig. 3) were −1.600 ± 6.300 μm (p = 0.90), 14.168 ± 14.955 μm (p = 0.07) and 0.033 ± 0.044 units (p = 0.09) for CRAE, CRVE and AVR, respectively. As shown in Table 4, the corresponding statistics for the intra-observer differences were 10.8%, 9.9% and 14.6% for reproducibility according to Bland and Altman’s method; 5.51%, 5.06%, and 7.47% for the coefficients of variation; and 0.70, 0.72, and 0.71 for the intraclass correlation coefficients.

Bland–Altman plots for the inter-observer variability in post-processing the retinal phenotypes. For further explanation, see Fig. 1.
| Characteristic | N | Age range | CRAE | CRVE | AVR |
|---|---|---|---|---|---|
| Reproducibility (%) | |||||
| Current study | 84 | 18–79 | 10.8 (−5.1 to 14.7) | 9.9 (−11.7 to 9.9) | 14.6 (−20.4 to 8.9) |
| Coefficient of variation | |||||
| Current study | 84 | 18–79 | 5.51 | 5.06 | 7.47 |
| Intraclass correlation coefficient | |||||
| Current study | 84 | 18–79 | 0.70b | 0.72b | 0.71 |
| ARIC13 | 12,642 | 51–72 | 0.74 | 0.77 | 0.79 |
| BDES11 | 4926 | 43–86 | 0.78–0.99a | ||
| BMES12 | 187 | 49–87 | 0.90 | 0.92 | 0.80 |
| CHS14 | 2824 | 69–97 | 0.67–0.91a | ||
CRAE: Central retinal arteriole equivalent; CRVE: Central retinal venular equivalent; AVR: Arteriole-to-venule ratio; ARIC: Atherosclerosis Risk In Communities, CHS: Cardiovascular Health Study, BDES: Beaver Dam Eye Study, BMES: Blue Mountain Eye Study. Reproducibilty (95% confidence interval) was twice the standard deviation of the pairwise differences between duplicate measurements, expressed as a percentage of the average of all first and repeat measurements. Coefficient of variation was the standard deviation of the pairwise differences between duplicate measurements divided by its mean.
The BDES and CHS investigators only reported a range of intraclass correlation coefficients for all phenotypes.
P < 0.001 for the difference between the current study and ARIC.
Inter-observer repeatability.
In single and stepwise regression analyses, we could not identify any significant association (0.10 < p < 0.62) of the between-observer differences with possible explanatory variables, including sex, age, body mass index, systolic and diastolic blood pressures, diagnosis of hypertension, and use of antihypertensive medication.
Discussion
In the present study, we assessed the reproducibility of retinal phenotypes and identified their correlates in a general Flemish population. Both intra- and inter-observer variability were within acceptable limits. In our hands, variability calculated using Bland and Altman’s method ranged from 8% to 16%. Other groups reported the reproducibility of the retinal phenotypes as correlation coefficients (CC)11–14 or coefficient of variation (CV).15 For sake of comparison, we also calculated these parameters. However, as outlined by Bland and Altman, the use of a correlation coefficient for comparing repeat measurements can be inaccurate, as it measures the strength of a relation, but not the agreement between two variables.16 The Hoorn investigators reported coefficients of variation.15 This parameter represents a normalised measure of dispersion of a probability distribution. When the mean value is near zero, which should be the case when repeat measurements are in agreement, the coefficient of variation is sensitive to small changes in the mean. The Blue Mountain Eye Study (BMES) researchers reported kappa statistics. This parameter is a test for assessing inter-grader differences in categorical, but not continuous, variables.
We noticed that the calibre of the retinal vessels decreased with age, an association which has been consistently demonstrated across different study populations like BDES,4 BMES,11 the Multi-Ethnic Study of Atherosclerosis (MESA)7 and the Funagata study.5 In the Wisconsin Epidemiological Study of Diabetic Retinopathy (WESDR), this association was also consistent in patients with type I23 and type II24 diabetes. In line with BMES11 and MESA7 investigators, we found that the retinal arteriolar diameter was greater in women than in men. In the current study, mean arterial pressure was associated with narrower arterioles, which is consistent with previous reports.4–7,11,23 We did not find a significant association of mean arterial pressure with retinal venular calibre, in line with results from ARIC,25 BDES10 and MESA.7 On the other hand, the Rotterdam Study,6 the Cardiovascular Health study (CHS)8 and the Funagata study5 reported negative associations of mean arterial pressure with retinal venular calibre, while a positive association was reported in the BMES.26
We confirmed the positive association of increased arteriolar and venular diameters with current cigarette smoking reported in previous population reports.6–8,10,23 Smoking acutely raises blood pressure through sympathetic stimulation,27 and is associated with higher blood pressure, at least if the latter is continuously recorded.28 In contrast, in epidemiological studies, in which the conventional blood pressure was measured after a smoking-free interval, smokers showed a slightly lower blood pressure than non-smokers.29 This might be due to the reduction in sympathetic activity in the intervals between smoking30 and the development of tolerance to catecholamines.31 Along similar lines, decreased levels of circulating catecholamines during the smoking-free interval preceding the retinal imaging might explain the increased arteriolar diameter in smokers. Probably due to the low prevalence of diabetes and the low frequency elevated fasting glucose levels in our cohort, we did not find any associations of the retinal phenotypes with markers of insulin resistance (HOMA-IR). Furthermore, we did not observe any significant associations between retinal vascular calibre and blood lipids. In previous reports, AVR was not associated with increased total cholesterol,6,32,33 while associations with HDL cholesterol were inconclusive.
Our current study supports the use of non-mydriatic imaging of the retinal arterioles and venules. However, several issues still remain to be addressed. We know that changes in the retinal vasculature are associated with cardiovascular risk factors and predict the incidence of hypertension,34–36 coronary heart disease-related mortality37 and stroke.38–40 However, for the measurements under study, reference values still need to be established in a healthy reference group. For risk stratification and use in clinical practice, outcome-driven sex- and age-specific cut-off values are needed. Furthermore, genetic variation might underlie early changes in the microvasculature. Genetic studies, over and beyond the genome-wide association study performed in the BDES41 are needed to identify genes associated with retinal vascular calibre. In the BDES, the linkage results for retinal vessel diameters indicated genetic contributions that remained significant after adjusting for hypertension and other covariables. For CRAE, regions 3q28, 5q35, 7q21, 7q32, 11q14, 11q24, and 17q11 showed linkage signals at the nominal multipoint significance level of 0.01, while these regions were 1p36, 6p25, 6q14, 8q21, 11p15, 13q34, and 14q21 for CRVE.41 However, specific genes still need to be identified.
Our current study should be interpreted according to its strengths and limitations. Although all correlates were in line with previously published reports, the relatively small size of the cohort and especially the low prevalence of diabetes might underlie the lack of association with fasting glucose, insulin and HOMA-IR. On the other hand, the concordance of correlates in the current study with previously published findings proves the validity of the phenotype. Furthermore, in contrast with previous reports, we used state-of-the art statistics to assess the reproducibility of the phenotype.
To conclude, our study further validates the non-mydriatic approach to phenotype retinal microvessels, because it showed acceptable intra- and inter-observer variability and because the correlates of these retinal phenotypes were consistent with those reported in the literature.
Conflict of interest
None of the authors declares a conflict of interest.
Acknowledgements
References
Cite this article
TY  - JOUR
AU  - Yan-Ping Liu
AU  - Tom Richart
AU  - Yu Jin
AU  - Harry A. Struijker-Boudierc
AU  - Jan A. Staessen
PY  - 2011
DA  - 2011/04/22
TI  - Retinal arteriolar and venular phenotypes in a Flemish population: Reproducibility and correlates
JO  - Artery Research
SP  - 72
EP  - 79
VL  - 5
IS  - 2
SN  - 1876-4401
UR  - https://doi.org/10.1016/j.artres.2011.03.004
DO  - 10.1016/j.artres.2011.03.004
ID  - Liu2011
ER  -