
Oxidative stress and arterial stiffness in strength- and endurance-trained athletes
- DOI
- 10.1016/j.artres.2010.04.002How to use a DOI?
- Keywords
- Strength training; Endurance training; Pulse-wave velocity; Arterial compliance; AOPP
- Abstract
Background: Endurance exercise training decreases arterial stiffness, whereas high-intensity strength exercise training increases arterial stiffness. However, the mechanisms underlying the adaptations to the 2 types of exercise training remain unclear. Increased oxidative stress induces vasoconstriction and endothelial dysfunction. Plasma advanced oxidation protein products (AOPP)—a novel marker of oxidative stress—have recently been reported to be positively associated with arterial stiffness in healthy subjects. We hypothesized that AOPP are involved in the adaptation of arterial stiffness in different types of exercise training.
Methods: We investigated plasma AOPP concentration and arterial stiffness in strength- and endurance-trained athletes. The subjects included young strength-trained athletes (SA group) (shot put, hammer, or javelin throwers; n = 12), endurance-trained athletes (EA group) (long- or middle-distance runners; n = 10), and sedentary individuals (Control group) (n = 12). We measured aortic pulse-wave velocity (PWV), systemic arterial compliance (SAC), and plasma AOPP concentrations.
Results: PWV was higher in the SA than in the EA or control groups (SA: 6.48 ± 0.47, EA: 6.00 ± 0.67, Control: 5.65 ± 0.52 m/s, mean ± SD), and SAC was lower in the SA than in the EA or control groups (SA: 1.04 ± 0.24, EA: 1.56 ± 0.44, Control: 1.38 ± 0.35 ml/mmHg); thus, arterial stiffness was higher in the SA group. Plasma AOPP concentrations were higher in the SA group than in the EA group (SA: 31.7 ± 8.5, EA: 23.9 ± 6.9, Control: 27.2 ± 3.9 μmol/l). We found that plasma AOPP levels tended to be related to SAC (P = 0.073, r = −0.31).
Conclusions: The present study provides a possibility that exercise training-induced oxidative stress may be partly involved in the mechanism underlying the adaptation of arterial stiffness in strength- and endurance-trained athletes.
- Copyright
- © 2010 Published by Elsevier B.V. on behalf of Association for Research into Arterial Structure and Physiology. All rights reserved.
- Open Access
- This is an open access article distributed under the CC BY-NC license.
Introduction
The central artery acts as a conduit that carries blood to tissues and organs and performs a buffering function to level off fluctuations in blood pressure, which are generated by cardiac pulsation and intermittent blood flow. Increase in arterial stiffness reduces this buffering function and subsequently leads to an increase in blood pressure. Exercise training can affect arterial stiffness. We and other groups showed that endurance exercise training decreased arterial stiffness.1–3 In contrast, high-intensity strength exercise training may increase arterial stiffness,3–8 although there are some conflicting reports.9–11 The mechanisms underlying these different adaptations to the 2 types of exercise training remain unclear.
Increased oxidative stress induces vasoconstriction and endothelial dysfunction.12–14 Thus, oxidative stress may play an important role in the regulation of vascular function.15 Plasma advanced oxidation protein products (AOPP)—a novel marker of oxidative stress—have been recently reported to be positively associated with arterial stiffness in healthy subjects.16 AOPP are formed during oxidative stress by the reaction of plasma proteins with chlorinated oxidants and are novel markers of oxidant-mediated protein damage.17 Furthermore, AOPP act as mediators of inflammation.17 Since inflammation is thought to contribute to the process of arterial stiffening,18 alteration in the plasma AOPP concentration may have important clinical significance in vascular function.
A large number of studies have shown that endurance exercise training leads to decreased oxidative stress,19–24 although there are some conflicting reports.25–28 On the other hand, it has been reported that high-intensity strength exercise training increases oxidative stress.29,30 Therefore, exercise training-induced oxidative stress may play a role in the difference in the adaptation of arterial stiffness observed between strength exercise training and endurance exercise training. Furthermore, the plasma AOPP concentrations may be implicated in arterial stiffness.16 Thus, we hypothesized that AOPP participates in the adaptation of arterial stiffness to different types of exercise training. The purpose of this study was to investigate plasma AOPP concentration and arterial stiffness in strength- and endurance-trained athletes. We measured aortic pulse-wave velocity (PWV), which is an index of arterial stiffness; systemic arterial compliance (SAC), and plasma AOPP concentrations in strength- and endurance-trained athletes.
Methods
Subjects
The subjects of this study comprised (1) 12 young male strength-trained athletes who were shot put, hammer, or javelin throwers (the SA group), (2) 10 male endurance-trained athletes who were long- or middle-distance runners (the EA group), and (3) 12 sedentary individuals who were used as the controls. All the athletes were members of an intercollegiate track and field team. Members of the SA group had been mainly undergoing high-intensity resistance training on an average of 5.2 ± 0.1 sessions per week (3.1 ± 0.3 h/session); those of the EA group had been mainly undergoing aerobic training on an average of 5.3 ± 0.4 sessions per week (2.7 ± 0.3 h/session); and those of the control group had led a sedentary lifestyle (no regular physical activity) for at least 2 years. None of the subjects exhibited signs or symptoms, or had a history of any chronic diseases. All of them were non-smokers, and none of them were under any medications, anabolic steroids, or antioxidant-containing dietary supplements at the time of the study. The subjects were asked to refrain from alcohol consumption and intense physical activity (exercise) for 24 h and caffeine consumption for 4 h prior to the tests in order to rule out possible acute effects. All measurements were taken at a constant room temperature (25 °C).
The present study was approved by the Ethical Committee of the University of Tsukuba. This study conformed to the principles outlined in the Helsinki Declaration, and all the subjects provided their written informed consent prior to participation in this study.
Aortic pulse-wave velocity
Aortic pulse-wave velocity (PWV) was measured after a minimum resting period of 20 min by applanation tonometry as previously described with minor modifications in the method.31 In brief, carotid and femoral arterial pulse waves were obtained in triplicate using arterial applanation tonometry incorporating an array of 15 transducers (form PWV/ABI; Colin Medical Technology, Komaki, Japan). The distance between the 2 applanation sites was assessed in triplicate with a random zero-length measurement of the surface of body, using a non-elastic tape. Pulse wave transit time was determined on the basis of the delay in time between the proximal and distal ‘foot’ waveforms. The foot of the pulse wave was identified as the commencement of the sharp systolic upstroke, which was automatically detected. Aortic PWV was calculated as the distance divided by the transit time and was expressed in metres per seconds.
At the same time as PWV measurement, the resting brachial arterial blood pressure and heart rate were measured in triplicate using oscillometry and ECG (form PWV/ABI; Colin Medical Technology, Komaki, Japan).
Systemic arterial compliance
Systemic arterial compliance (SAC) in the carotid artery was measured by applanation tonometry and Doppler echocardiography as previously described, with minor modifications in the methods.32,33 In brief, carotid arterial pressure waveforms were obtained by applanation tonometry (form PWV/ABI; Colin Medical Technology, Komaki, Japan) after a minimum resting period of 20 min. At the time of waveform recording, the systolic, diastolic, and mean blood pressure (SBP, DBP, and MBP, respectively) in the brachial arterial were measured by oscillometry (form PWV/ABI; Colin Medical Technology, Komaki, Japan). The pressure signal obtained by tonometry was calibrated by equating the carotid MBP and DBP to the brachial arterial values. SAC was calculated as follows: SAC = Ad/(dP × R), where Ad is the area under an arbitrary portion of the diastolic pressure waveform, dP is the pressure change in this portion, and R is systemic vascular resistance, given as MBP divided by the mean blood flow. Since the calculation of SAC is based on the assumption that diastolic pressure decay is a mono-exponential function of time, the diastolic pressure waveform was used to calculate SAC according to a method described in previous studies.32,33 Mean blood flow was measured with a Doppler-echocardiographic system (EnVisor; Koninklijke Philips Electronics, Eindhoven, Netherlands) as previously described by us.34 The insertion point of the aortic valve tips at end-diastole was determined by two-dimensional imaging in the para-sternal long-axis view with a 3.5-MHz transducer, and the M-mode echocardiogram obtained at that level was saved on a computer. Simultaneously, Doppler ultrasonographic flow velocity curves in the ascending aorta were recorded using a 1.9-MHz probe held in the supra-sternal notch. Mean blood flow was calculated as a product of the aortic cross-sectional area and the mean flow velocity (ImageJ; National Institutes of Health, Bethesda, MD).
Blood biochemistry
Before blood sampling was performed, the subjects were instructed to stop oral intake of solid food and water, for 12 h overnight. Each blood sample was placed in a chilled tube containing aprotinin (300 kallikrein-inactivating U/ml) and ethelenediaminetetraacetic acid (EDTA) (2 mg/ml) and was subsequently centrifuged at 2000 g for 15 min at 4 °C. Plasma was stored at −80 °C until analysis. The plasma AOPP concentration was measured using a commercial assay kit (Immundiagnostik AG, Germany) according to the manufacturer’s instructions. In our laboratory, the coefficient of variation for the assay of the AOPP was 1.5%. Serum concentrations of cholesterol and insulin and plasma concentrations of glucose were determined by the standard enzymatic techniques.
Maximal handgrip strength and maximal oxygen uptake
Maximal handgrip strength and maximal oxygen uptake were measured. Maximal handgrip strength was determined by using a hand dynamometer (HK51020; SUNCREA, Tokyo, Japan). Subjects performed 2 maximal contractions with each hand, each lasting for 3–5 s and separated by a minimum interval of 15 s. The higher strength score obtained with the 2 trials was considered the maximum handgrip strength.
The subjects performed an incremental cycling test (a 3 min at 80 W, with a 30-W increase every 3 min) until they were exhausted. Maximum oxygen uptake was determined by monitoring breath-by-breath oxygen consumption and carbon dioxide production (AE280S; Minato Medical Science, Osaka, Japan), heart rate, and ratings of perceived exertion (Borg scale).
Statistical analysis
All the values are expressed as means ± SD. Statistical analysis was performed using one-way ANOVA followed by Fisher’s protected least significant difference (PLSD) test for multiple comparisons. Analysis of covariance (ANCOVA) was performed to correct the influence of blood pressure (MBP and DBP)3 or BMI on arterial stiffness. Statistical significance was set at P < 0.05.
Results
Table 1 summarizes the characteristics of all the groups. There were no significant differences in the age and height of the subjects. Body weight and body mass index (BMI) were significantly higher in individuals of the SA group than in those of the control and EA groups. Body circumferences of individuals of the SA group were significantly greater than those individuals in the control and EA groups. Serum high-density lipoproteins (HDL) cholesterol levels were lower in subjects of the SA group than those of the EA and control groups. No significant differences were observed in the serum concentrations of total cholesterol, low-density lipoproteins (LDL) cholesterol, and insulin and plasma glucose concentrations among the 3 groups. Maximal oxygen uptake was found to be significantly higher in the EA group than in the control and SA groups. Maximal handgrip strength was significantly greater in the SA group than in the control and EA groups. Table 2 presents the hemodynamics of all the subjects. Blood pressure was higher in subjects of the SA than in those of the control and EA groups.
| Control (n = 12) | Endurance (n = 10) | Strength (n = 12) | |
|---|---|---|---|
| Age, years | 21.1 ± 2.6 | 20.6 ± 2.0 | 20.5 ± 1.6 |
| Age at beginning of sport career, years | – | 14.1 ± 2.4 | 15.3 ± 1.5 |
| Sport careers, years | – | 6.5 ± 3.6 | 5.3 ± 1.9 |
| Height, cm | 172 ± 7 | 173 ± 6 | 176 ± 4 |
| Weight, kg | 63.5 ± 7.9 | 62.8 ± 5.5 | 88.0 ± 12.3**†† |
| Body mass index, kg/m2 | 21.5 ± 1.8 | 20.9 ± 1.3 | 28.3 ± 3.1**†† |
| Chest, cm | 86 ± 5 | 85 ± 4 | 102 ± 6**†† |
| Waist, cm | 72 ± 4 | 72 ± 3 | 87 ± 6**†† |
| Hip, cm | 94 ± 5 | 91 ± 4 | 106 ± 6**†† |
| Waist-to-hip ratio | 0.77 ± 0.02 | 0.79 ± 0.02 | 0.82 ± 0.03**†† |
| Upper arm, cm | 26.3 ± 0.3 | 25.0 ± 0.9 | 34.0 ± 2.4**†† |
| Thigh, cm | 50.0 ± 3.2 | 50.0 ± 2.2 | 59.3 ± 4.4**†† |
| Total cholesterol, mg/dl | 168 ± 34 | 177 ± 25 | 178 ± 27 |
| HDL cholesterol, mg/dl | 61 ± 12 | 66 ± 10 | 51 ± 11*†† |
| LDL cholesterol, mg/dl | 95 ± 39 | 100 ± 26 | 109 ± 29 |
| Glucose, mg/dl | 92 ± 7 | 88 ± 8 | 89 ± 10 |
| Insulin, μU/ml | 11.4 ± 3.8 | 9.1 ± 4.2 | 10.5 ± 3.8 |
| Maximal oxygen uptake, ml/kg/min | 45.6 ± 5.0 | 60.3 ± 3.2** | 42.6 ± 3.6†† |
| Maximal handgrip strength, kg | 39.5 ± 5.6 | 44.2 ± 4.3* | 57.0 ± 5.6**†† |
Values are means ± SD. Control, sedentary control men; Endurance, endurance-trained men; Strength, strength- trained men.
P < 0.05 vs. Control;
P < 0.01 vs. Control;
P < 0.01 vs. Endurance.
Characteristics of strength- and endurance-trained men and sedentary control men.
| Control | Endurance | Strength | F value | P value | |
|---|---|---|---|---|---|
| Systolic blood pressure, mmHg | 115 ± 8 | 115 ± 9 | 130 ± 11**†† | 10.465 | <0.05 |
| Mean blood pressure, mmHg | 83 ± 6 | 84 ± 7 | 93 ± 8** | 5.932 | <0.05 |
| Diastolic blood pressure, mmHg | 64 ± 5 | 60 ± 4 | 69 ± 7*†† | 6.677 | <0.05 |
| Pulse pressure, mmHg | 52 ± 5 | 56 ± 6 | 62 ± 6**† | 10.517 | <0.05 |
| Heart rate, beats/min | 64 ± 11 | 56 ± 12 | 60 ± 6 | 1.53 | 0.232 |
Values are means ± SD. Control, sedentary control men; Endurance, endurance-trained men; Strength, strength-trained men.
P < 0.05 vs. Control;
P < 0.01 vs. Control;
P < 0.05 vs. Endurance;
P < 0.01 vs. Endurance.
Hemodynamics of strength- and endurance-trained men and sedentary control men.
The aortic PWV was found to be significantly higher in the SA group than in the control and EA groups, whereas it did not differ between the EA and control groups (SA: 6.48 ± 0.47, EA: 6.00 ± 0.67, Control: 5.65 ± 0.52 m/s; Fig. 1a). SAC, which is inversely proportional to arterial stiffness, was significantly lower in the SA group than in the control and EA groups, whereas it did not differ between the EA and control groups (SA: 1.04 ± 0.24, EA: 1.56 ± 0.44, Control: 1.38 ± 0.35 ml/mmHg; Fig. 1b). ANCOVA revealed that the difference in SAC between strength- and endurance-trained men was statistically independent of MBP (F = 3.3, P < 0.05) and DBP (F = 3.4, P < 0.05). Furthermore, ANCOVA revealed that the difference in SAC between strength- and endurance-trained men or control group was statistically independent of BMI (F = 3.7, P < 0.05). However, the effect of exercise training on PWV, which was tested by ANCOVA, was not found to be independent of blood pressure or BMI. Plasma AOPP concentrations were found to be significantly higher in the SA group than in the EA group (SA: 31.7 ± 8.5, EA: 23.9 ± 6.9, Control: 27.2 ± 3.9 μmol/l; Fig. 2). Plasma AOPP levels tended to be related to SAC (P = 0.073, r = −0.31).
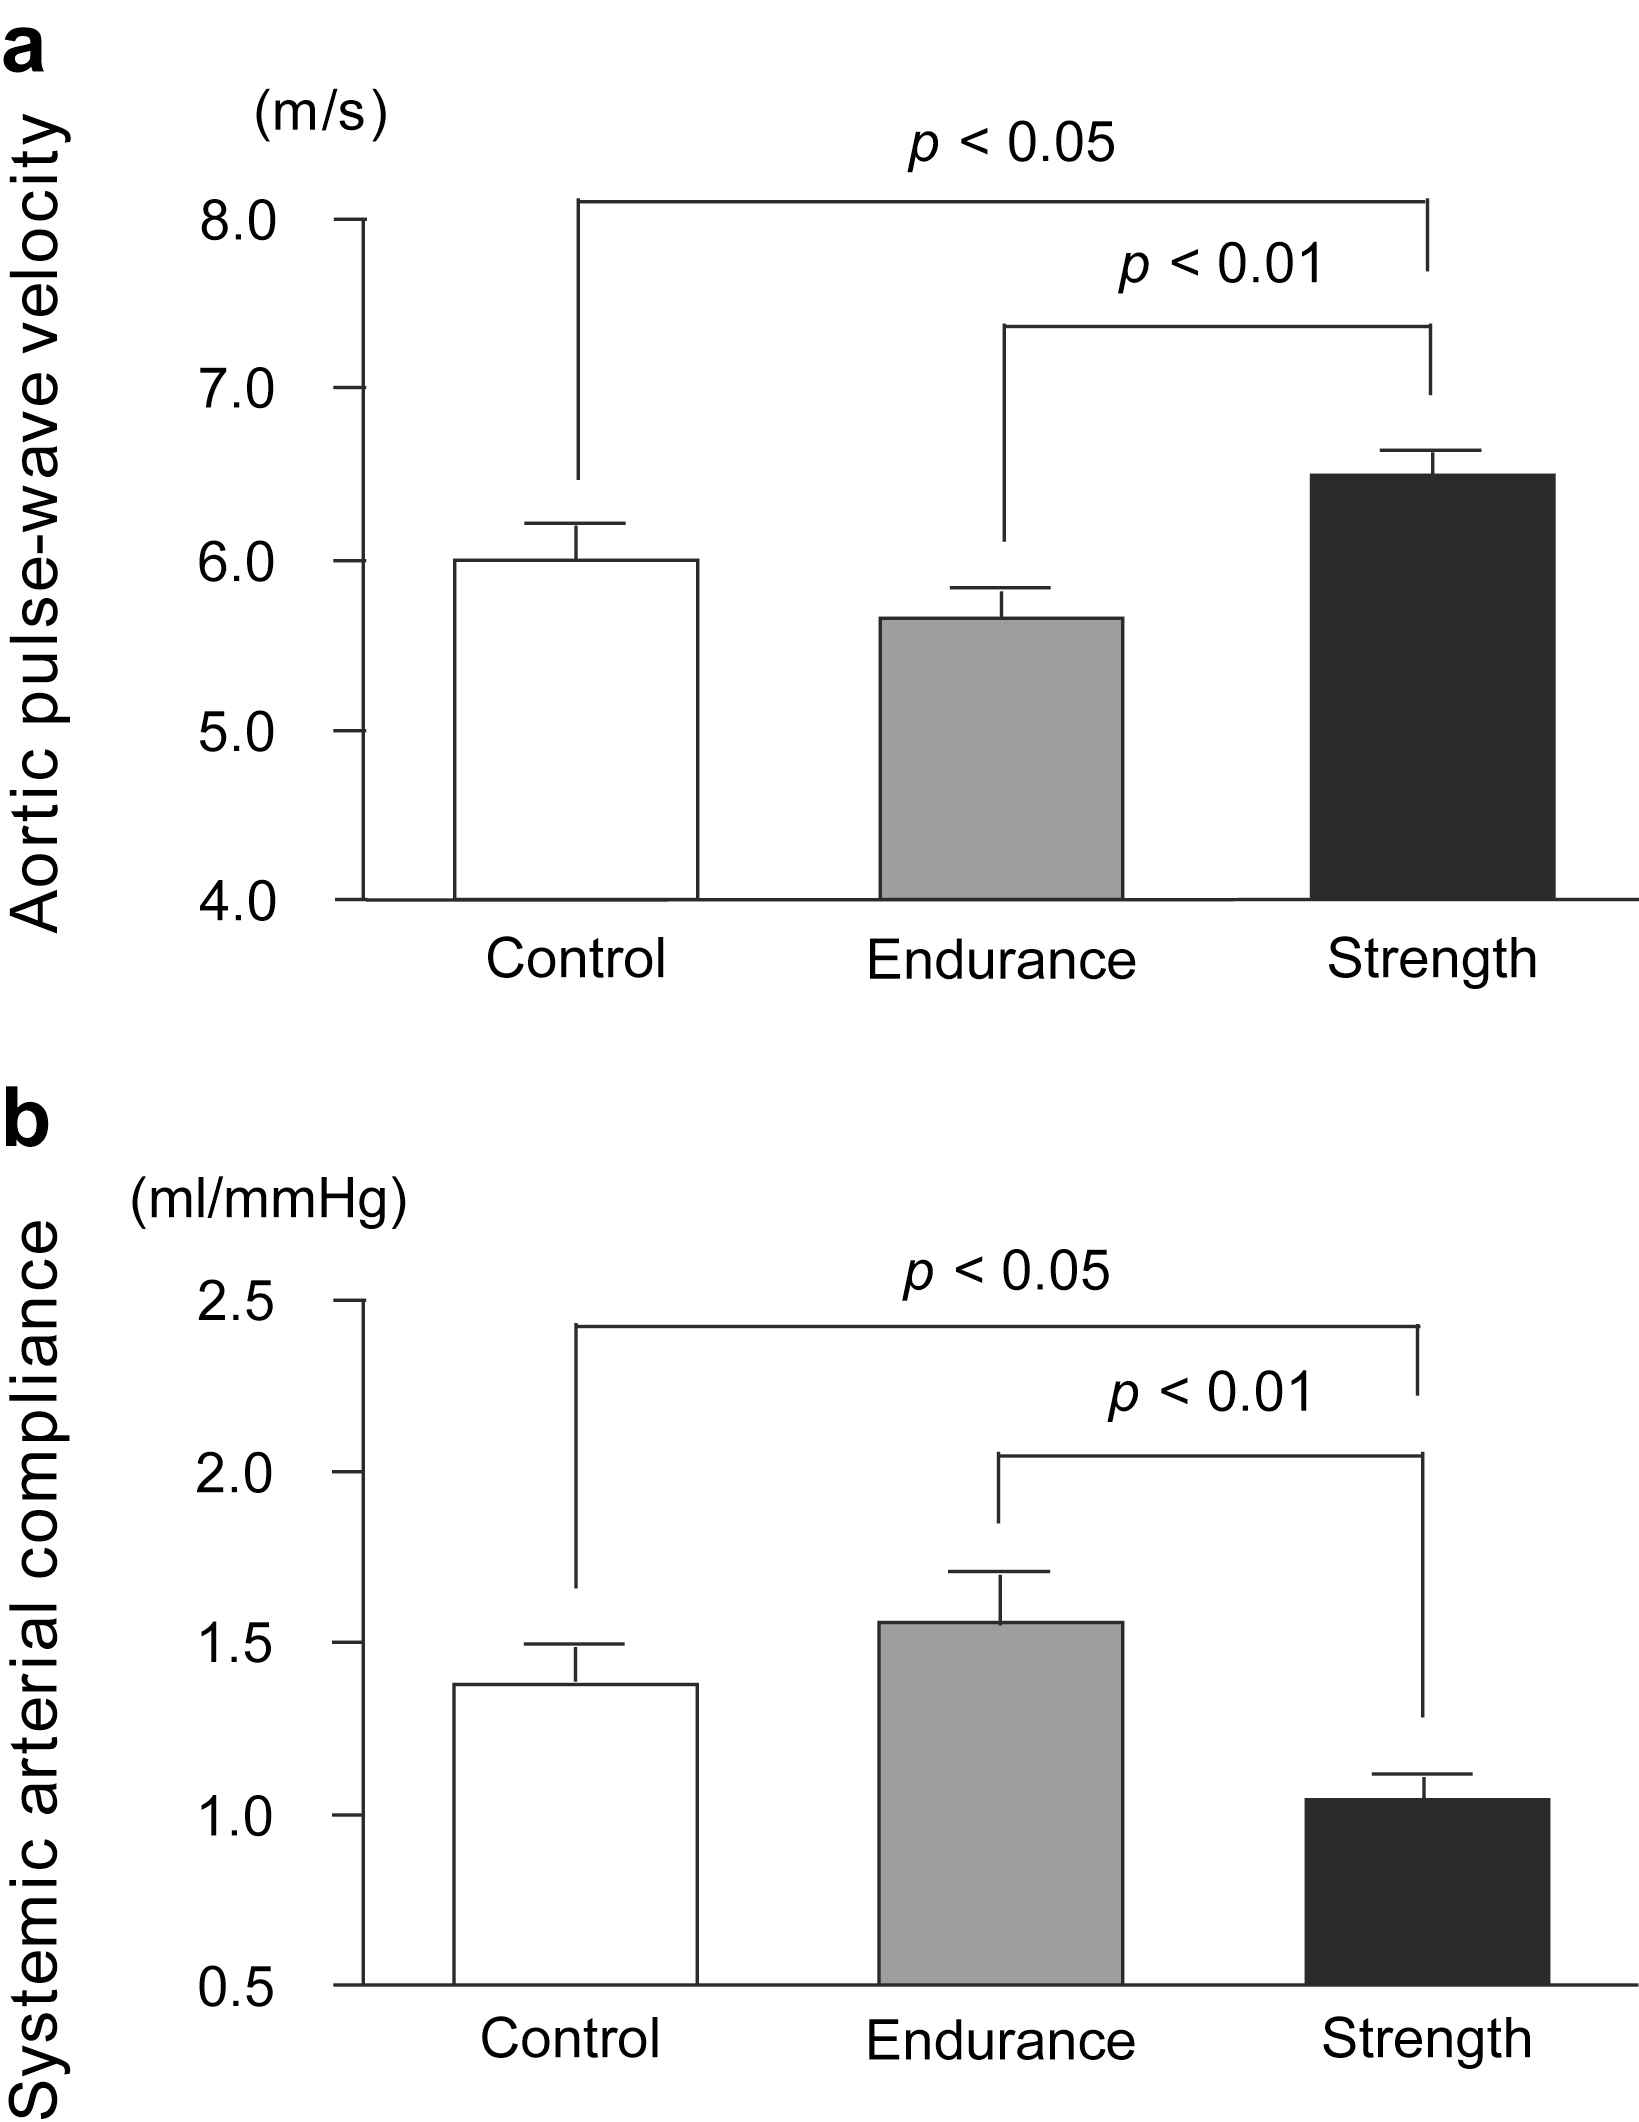
Aortic pulse-wave velocity (a) and systemic arterial compliance (b) in strength-trained athletes, endurance-trained athletes, and sedentary control men. Data are mean ± SE.
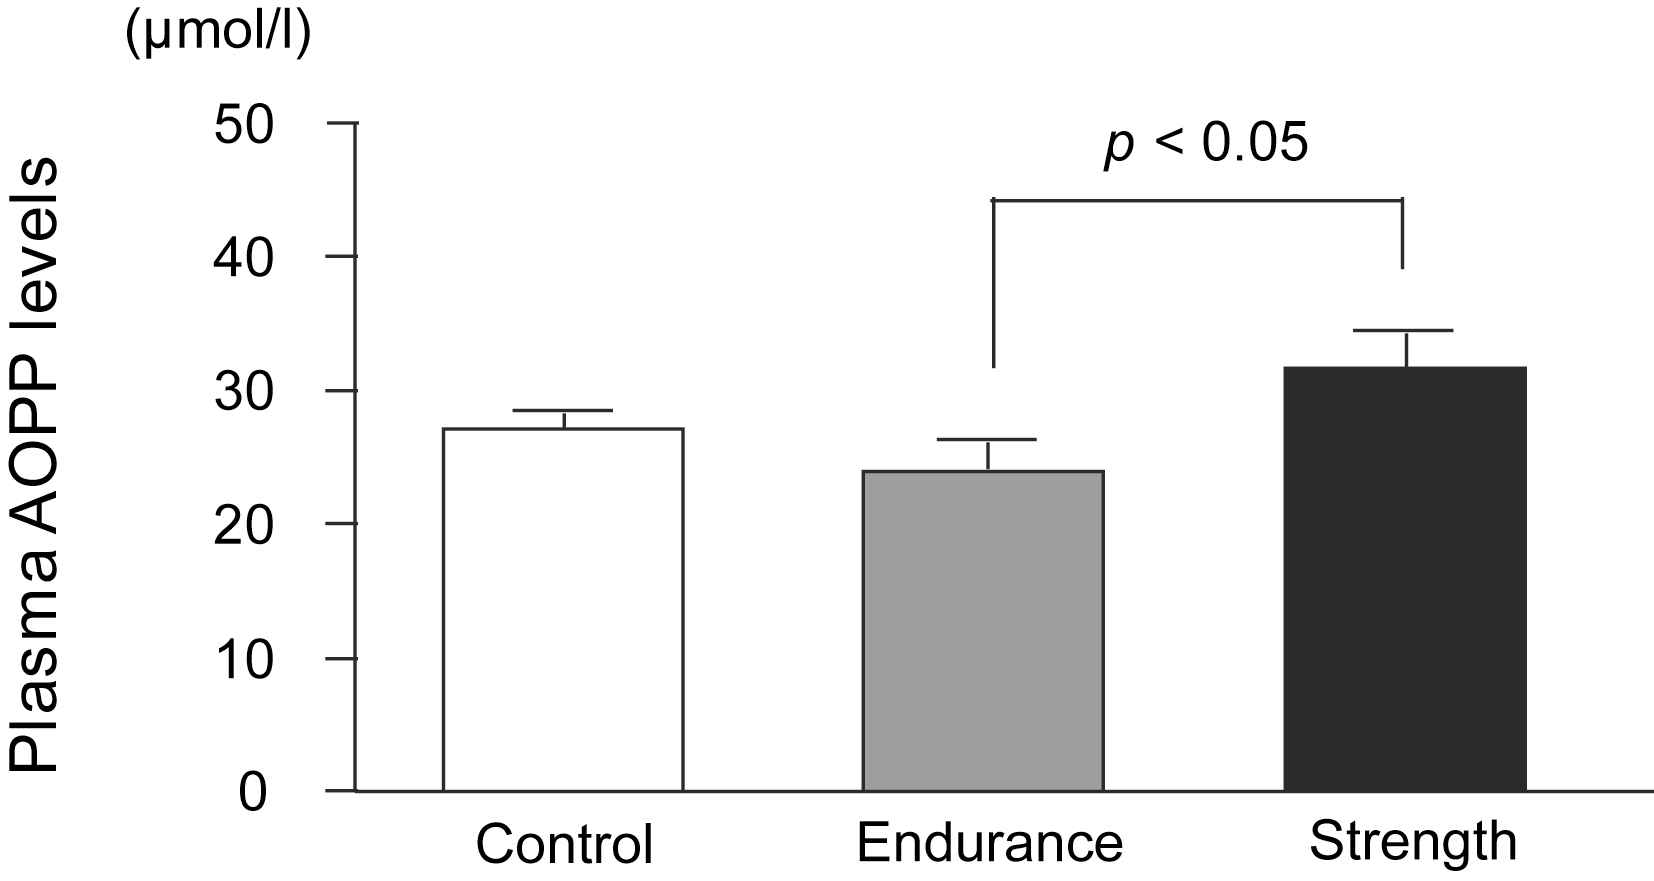
Plasma advanced oxidation protein products levels in strength-trained athletes, endurance-trained athletes, and sedentary control men. Data are mean ± SE.
We found that plasma AOPP concentrations were related to blood total cholesterol (P = 0.018, r = 0.402), LDL (P = 0.034, r = 0.365) and glucose (P = 0.029, r = −0.374) concentrations.
Discussion
In the present study, arterial stiffness (determined on the basis of PWV and SAC) was found to be higher in strength-trained athletes than in endurance-trained athletes or sedentary individuals. Furthermore, we found that oxidative stress (determined on the basis of plasma AOPP concentration) was higher in strength-trained athletes than in endurance-trained athletes. These results suggest that differences in the plasma AOPP concentrations may contribute to the mechanism underlying the adaptation of arterial stiffness to the 2 types of exercise training, i.e., endurance exercise training and strength exercise training.
Oxidative stress affects vascular function.15 Indeed, increased oxidative stress induces vasoconstriction, endothelial dysfunction, and smooth muscle cell proliferation.12–14,35 It is well known that vasoconstriction of arteries and/or proliferation of vascular smooth muscle cells results in an increase in vascular stiffness.36 On the basis of all these results, increase in oxidative stress may be implicated in increased arterial stiffness. Indeed, it has been reported that in young men, oxidative stress may play a role in increasing arterial stiffness.37
High-intensity strength training induces an increase in oxidative stress. Liu et al.29 have reported that the oxidative stress in young weightlifters was higher than that in control individuals. Furthermore, oxidative stress has been reported to increase after high-intensity strength training.30 The present study showed that plasma AOPP, which is one of oxidative stress, concentrations were significantly higher in strength-trained athletes than in endurance-trained athletes. Therefore, high-intensity strength training is considered to increase oxidative stress.
The mechanisms underlying the increase in oxidative stress in strength-trained athletes remain to be elucidated. Many previous studies have reported that high-intensity strength exercise results in an increase in blood oxidative stress.38–41 Endurance exercises lead to an increase in free radical production through the mitochondrial electron transport system.42 On the other hand, strength exercises can also lead to an increase in free radical production through various pathways in addition to mitochondrial electron transport, such as those involved in ischaemia-reperfusion injury and inflammation.43,44 Since the mechanisms of free radical production are different in both these types of exercises, it is possible that strength exercises and endurance exercises exhibit dissimilar effects on the generation of oxidative stress.
Interestingly, in the present study, the level of oxidative stress was decreased in endurance-trained athletes, and was also negatively associated with VO2max (i.e., aerobic capacity) (r = −0.455, P < 0.01). Franzoni et al.45 have reported that VO2max was not only inversely related to oxidative stress, but also related to oxidant scavenging ability. Furthermore, previous studies have suggested that long-term endurance training induces an increase of antioxidant enzyme46 and non-enzymatic antioxidant capacity.23 Taken together, it is conceivable that endurance exercise training could reduce oxidative stress by up-regulation of antioxidant defences.
A recent study has shown that in healthy subjects, the plasma AOPP concentration is related to arterial stiffness.16 Liu et al.35 have reported that AOPP may cause smooth muscle cell proliferation in arterial wall. Furthermore, it has been reported that AOPP is highly correlated to carotid intima-media thickness47 and flow mediated vasodilation (FMD)48 in end-stage renal disease. Thus, AOPP may be considered to be one of the indicators of vascular function. In the present study, we have shown that both arterial stiffness and plasma AOPP concentration were higher in strength-trained athletes than in endurance-trained athletes. We also found that plasma AOPP levels tend to be related to SAC (P = 0.073, r = −0.31). Therefore, we think that the difference in AOPP concentrations may contribute to the difference in adaptation of arterial stiffness between the strength- and endurance-trained athletes.
The present study had several important limitations. First, this study was a cross-sectional study and the number of subjects in each group was small. Second, it is not clear if other potentially confounding factors may have influenced results (e.g., blood pressure, BMI, HDL).
Conclusion
The present study was the first to show that plasma AOPP concentrations were significantly higher in strength-trained athletes than in endurance-trained athletes. This study also revealed that arterial stiffness was higher in strength-trained athletes compared to endurance-trained athletes. These findings suggest that exercise training-induced oxidative stress may play a role in the mechanism underlying adaptation of arterial stiffness and may therefore contribute to the difference in adaptation of arterial stiffness between strength- and endurance-trained athletes.
Conflict of interest
We have no financial, consultant, institutional and other relationships that might lead to bias or a conflict of interest.
Acknowledgments
This work was supported by Grants-in-Aid for Scientific Research (21300234 and 21650179) from Japan Society for the Promotion of Science.
References
Cite this article
TY  - JOUR
AU  - Youngju Choi
AU  - Seiji Maeda
AU  - Takeshi Otsuki
AU  - Asako Miyaki
AU  - Nobutake Shimojo
AU  - Mutsuko Yoshizawa
AU  - Hitoshi Shiraki
AU  - Ryuichi Ajisaka
PY  - 2010
DA  - 2010/05/27
TI  - Oxidative stress and arterial stiffness in strength- and endurance-trained athletes
JO  - Artery Research
SP  - 52
EP  - 58
VL  - 4
IS  - 2
SN  - 1876-4401
UR  - https://doi.org/10.1016/j.artres.2010.04.002
DO  - 10.1016/j.artres.2010.04.002
ID  - Choi2010
ER  -