
Combined imaging, computational and histological analysis of a ruptured carotid plaque: A patient-specific analysis
- DOI
- 10.1016/j.artres.2010.05.001How to use a DOI?
- Keywords
- Carotid stenosis; MRI; Computational biomechanics; Computational haemodynamics; Plaque rupture
- Abstract
Background: Rupture of carotid plaques is an important cause of cerebrovascular events. Several factors, including wall shear stress (WSS), plaque morphology and peak cap stress, have been associated with plaque vulnerability. The aim of this study was to investigate the relationship between these factors in an in vivo human ruptured carotid plaque.
Methods: A 74-year-old male presenting with a transient ischemic attack underwent carotid magnetic resonance imaging (MRI), which indicated a ruptured plaque, followed by carotid endarterectomy, from which plaque histology was assessed. The carotid bifurcation was reconstructed from the MRI data, and three-dimensional flow simulations were performed using computational fluid dynamics to determine WSS and related parameters. Plaque vulnerability was assessed using a biomechanical method based on modified Glagov criteria.
Results: The plaque rupture was just distal to the site of maximum stenosis in a region of low WSS, where MRI and histology both demonstrated fibrous cap thinning, a large lipid pool and calcification in the shoulder region. Plaque vulnerability analysis indicated critically vulnerable plaque at the rupture site by a wide margin.
Conclusions: Both low and high WSS have been associated with plaque vulnerability, and high mechanical stress in the cap has been linked to plaque rupture, but these parameters are not routinely assessed clinically. This study demonstrates a complete analysis by combining imaging, histology and bio-fluid and biomechanical modelling.
- Copyright
- © 2010 Association for Research into Arterial Structure and Physiology. Published by Elsevier B.V. All rights reserved.
- Open Access
- This is an open access article distributed under the CC BY-NC license.
Introduction
Cerebrovascular events are frequently caused by the rupture of vulnerable carotid plaques.1,2 Lesion severity is conventionally assessed by the degree of stenosis, which does not uniquely correlate with plaque vulnerability. Vulnerable plaque is typically eccentric with large necrotic core, thin fibrous cap, high density of inflammatory cells and cholesterol crystals, and low density of smooth muscle cells.2 Owing to its influence in vascular biology, determination of wall shear stress (WSS) is expected to aid vulnerability assessment. Recent biomechanical analysis of vulnerability of coronary plaques,3 using data from post mortem specimens,4 and new in vivo cases, has shown its potential predictive power for plaque rupture. Analysis of WSS in a ruptured carotid plaque based on in vivo data has previously been reported for one patient only, without histological data.5
Plaque formation occurs in regions of recirculating flow and low WSS, whilst high WSS correlates with the absence of plaque.6 Atherosclerotic arteries may remodel expansively, compensating for plaque growth, until plaque begins to encroach on the lumen because of reduced availability of active endothelium.4,6 Plaques that cause arterial stenoses create further flow disturbance;2 flow accelerates to a maximum at the throat before decelerating in the post-stenotic region, where flow may become unstable, separating and recirculating. Consequently, different parts of arterial wall and plaque experience different levels of WSS; elevated in the proximal region and low and oscillatory in the distal region.7 High levels of WSS on the surface of the plaque are associated with fibrous cap degradation,2 but low levels cause inflammation and its sequelae.8 Fibrous cap thinning and plaque rupture typically occur on the proximal surface,9,10 where WSS may stimulate the expression of matrix-degrading enzymes.2
The ultimate determinant of plaque rupture is the tensile stress within the fibrous cap,2 induced by the pulse pressure and dependent on plaque morphology and mechanical properties. Plaque geometrical characteristics, comprising cap thickness, necrotic core thickness and Glagov remodelling index,4 are the most critical parameters in relating pulse pressure to cap stress and have been found successfully to explain coronary plaque rupture in a vulnerability assessment model.3 This model has been adapted to analyse the present case of carotid plaque rupture.
In this project investigation of vulnerability was based on the effects of endothelial shear stress on fibrous cap degradation, and rupture in relation to the maximum cap stress determined by its significant morphological characteristics. Thus, the importance of biomechanical assessment of carotid plaques was demonstrated, providing evidence for its utility in assessing plaque vulnerability and likelihood of rupture.
Methods
Magnetic resonance (MR) imaging of the left carotid artery was performed on a 74-year-old male who presented with left-sided monocular visual loss secondary to a branch retinal artery occlusion, likely related to carotid embolisation. With a 1.5T MR scanner (Siemens Sonata, Erlangen, Germany), transaxial T1-weighted fast spin echo images were acquired giving 42 mm of longitudinal coverage. Where plaque was identified, T2-weighted images were also acquired. Imaging parameters were: slice thickness 2 mm; total T1 slices 21; total T2 slices 5; Phase encoding time-step 189 ms; pixel spacing 0.21 mm. Additional higher resolution T1- and T2-weighted images were acquired at the level of cap fissuring. Time of flight lumen images were acquired for the entire carotid bifurcation. The tissue classification criteria for T1 and T2 images were: calcification: both hypointense; fibrous tissue: both isointense; haemorrhage: both hyperintense; necrotic core: T1 iso- to hyperintense; T2 hypo- to isointense.11
After carotid endarterectomy, macroscopic and histological plaque analyses were performed. The study conformed to the ethical guidelines of the 1975 Declaration of Helsinki and was approved by the local ethics committee at the Royal Brompton & Harefield Trust. The patient gave written, informed consent.
Image processing and 3D reconstruction
The lumen was segmented via the region-growing method, for which the T1-weighted images gave best contrast. Plaque component intensity levels and vessel wall were distinguished manually. The sets of coordinates thus obtained were processed to derive a 3D reconstruction of the vessel features. Vessel centreline smoothing (0.7 in a scale 0–1, where 1 corresponds to no smoothing) was applied to correct for patient motion, whilst contour smoothing (0.85) was performed to eliminate roughness related to pixel spacing. In-house software (MatLab; MathWorks, Natick MA) was employed for image processing and surface reconstruction.7,12
Flow simulation and data analysis
Lumen surfaces were imported into dedicated software (ANSYS ICEM CFD®) to create the 3D meshed volumes for application in the computational fluid dynamics (CFD) code ANSYS CFX. In the computational model, the inlet and outlets were extended to minimize the influence of boundary conditions on flow patterns in the region of interest. Following grid independence tests, tetrahedral elements were adopted in the central flow region, with prismatic elements in the near wall region. These comprised 10 layers, with boundary refinement via an exponential growth factor 1.2, yielding a near wall element height of 1/500 of the inlet diameter.
The time-dependent Navier–Stokes equations were solved numerically with blood as an incompressible, Newtonian fluid, and rigid wall (reasonable approximations in this application). No-slip conditions were applied at the wall. Duplex ultrasound measurements of peak systolic and end diastolic velocities were made in all carotid arteries just before surgery, but no complete velocity waveform was recorded. Hence, the measured common carotid artery (CCA) velocities were matched to a carotid flow waveform from another patient7 and fully-developed pulsatile velocity profiles were derived from the Womersley solution12 and imposed at the inlet (Cycle period = 0.86 s, mean mass flow rate = 10.11 g/s). A constant flow division of 60:40 between the internal carotid artery (ICA) and external carotid artery (ECA) was specified at the outlets. A uniform time-step of 0.01 s, with a minimum of 20 iterations within each time-step, was chosen based on previous studies of carotid flow7 with both uniform and adaptive time steps. Flow simulation results were processed using ANSYS CFX-Post and Ensight 8.2.6 (Computational Engineering International, CEI).
Time-averaged wall shear stress (TAWSS) and oscillatory shear index (OSI) are known to influence endothelial responses and were calculated as follows:
For comparative analysis, TAWSS was divided into 3 ranges: low TAWSS (from 0% to 18% of the maximum value of TAWSS), medium TAWSS (18%–36%), and high TAWSS (36%–100%). The corresponding arterial wall region was identified for each range of TAWSS and average OSI. The average volume of each wall component was also evaluated.
Plaque vulnerability analysis
In the study of Ohayon et al.3 change in eccentric coronary plaque vulnerability was investigated as a function of necrotic core size and plaque morphology. The cap stress value was computed for 5500 idealised coronary vessel models that mimicked the positive arterial remodelling process described by Glagov et al.,4 and the geometry of a further set of 24 non-ruptured plaques newly acquired from patients by IVUS was used to test the associated idealised morphological models, investigating the effects of plaque features on cap stress. It was found that lesions at the early stages of positive remodelling were more prone to rupture, possibly explaining the vulnerability of clinically silent plaques. The Glagov remodelling index, necrotic core thickness, and cap thickness were the critical parameters determining plaque stability.3
The present analysis was adapted from the analysis described above. Critical cap stress was assumed to be 300 kPa and similar geometrical parameters, including plaque thickness and core thickness, were adopted but based on values extracted from the carotid plaque of the patient concerned. The Glagov coronary remodelling index was replaced by the ‘Glagov stenosis’, a related carotid remodelling criterion reflecting the different anatomy, including the partial location of the plaque in the carotid sinus, as below:
where Aplaque and Alumen are cross-sectional areas of plaque and lumen respectively.
Patient-specific systolic/diastolic pressures of 16.7/8.0 kPa (125/60 mm Hg) were used in this analysis.
Results
The carotid MRI scan revealed a 51% ECST (European Carotid Surgery Trial)13 stenosis of the left internal carotid artery (ICA). The large eccentric plaque extended from the distal CCA to the proximal ICA (Fig. 1a). Significant expansive arterial remodelling was present. The fibrous cap had ruptured 5.8 mm proximal to the carotid bifurcation, measured from T2-weighted images. There was a large underlying lipid core, and adherent thrombus (Fig. 1b, c).
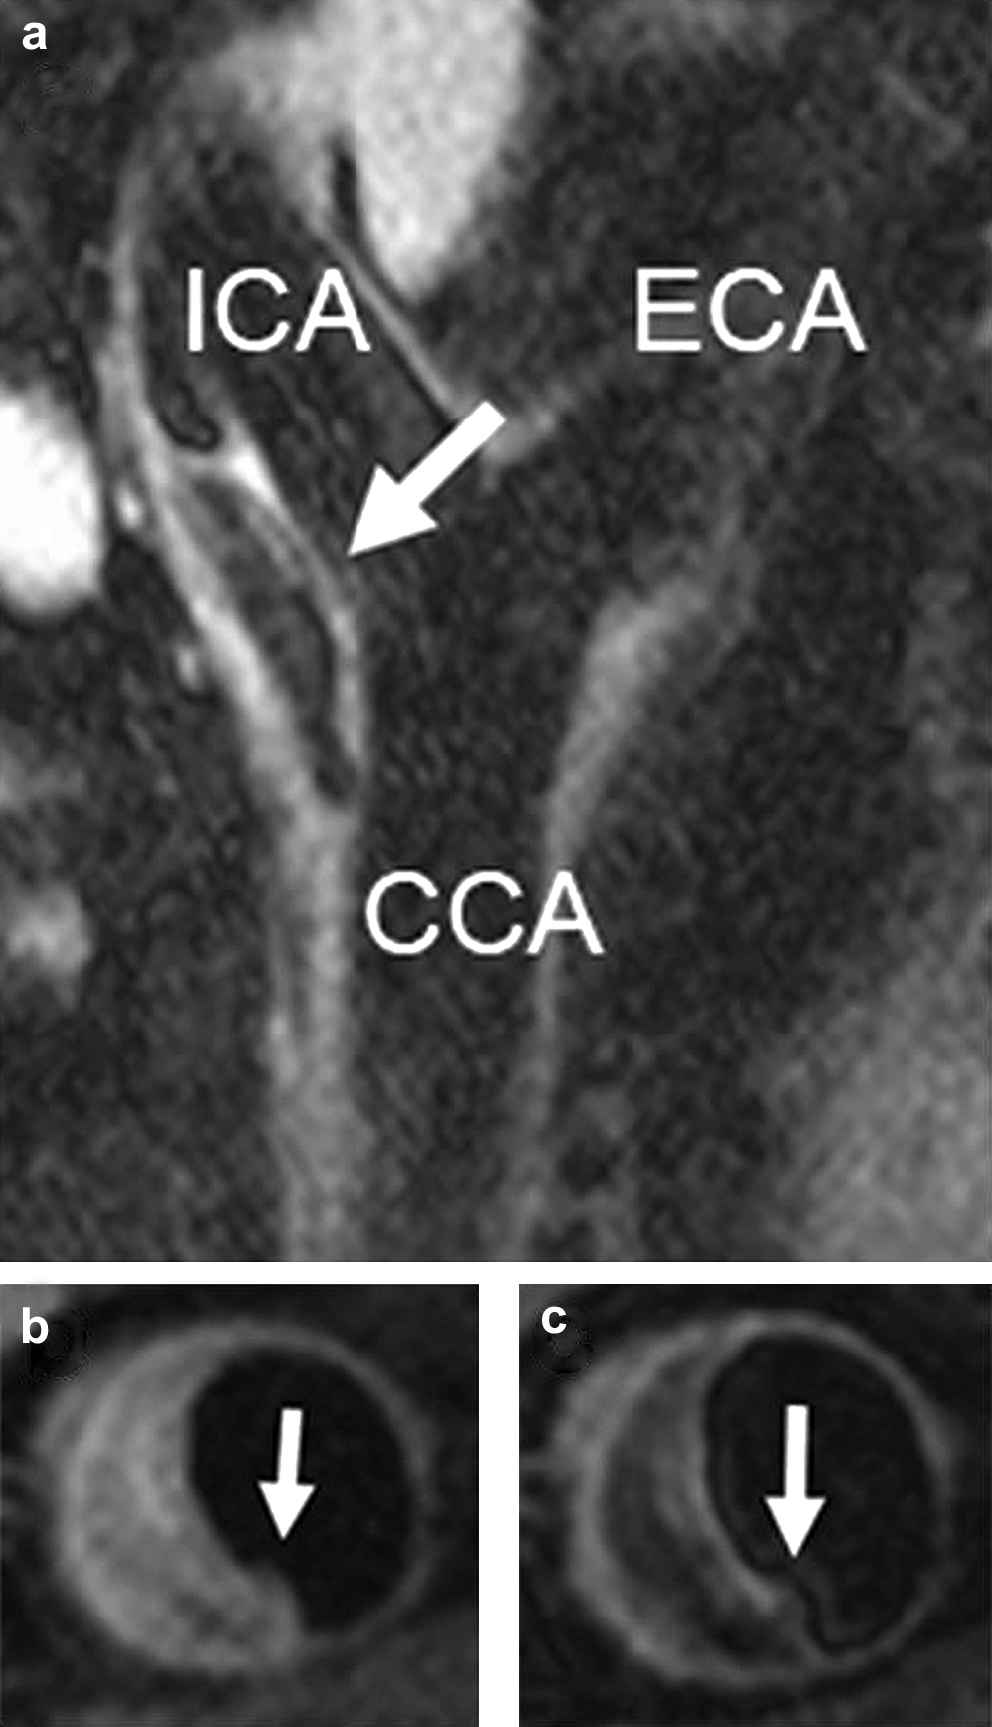
(a) Sagittal MR image (T2-weighted) of the left carotid bifurcation. Arrow points to the plaque; T1-weighted (b) and T2-weighte (c) MR images of the crosssection containing the plaque rupture. The arrows point to the rupture site.
Histological analysis
The endarterectomy specimen measured 27 × 22 mm, and up to 7 mm thick. Histological analysis confirmed the imaging diagnosis of an eccentric lipid rich plaque with fibrous cap rupture. Extensive thrombus was identified within the plaque and in the lumen of the vessel (Fig. 2a, b); the plaque was classified as type VI (AHA classification14).
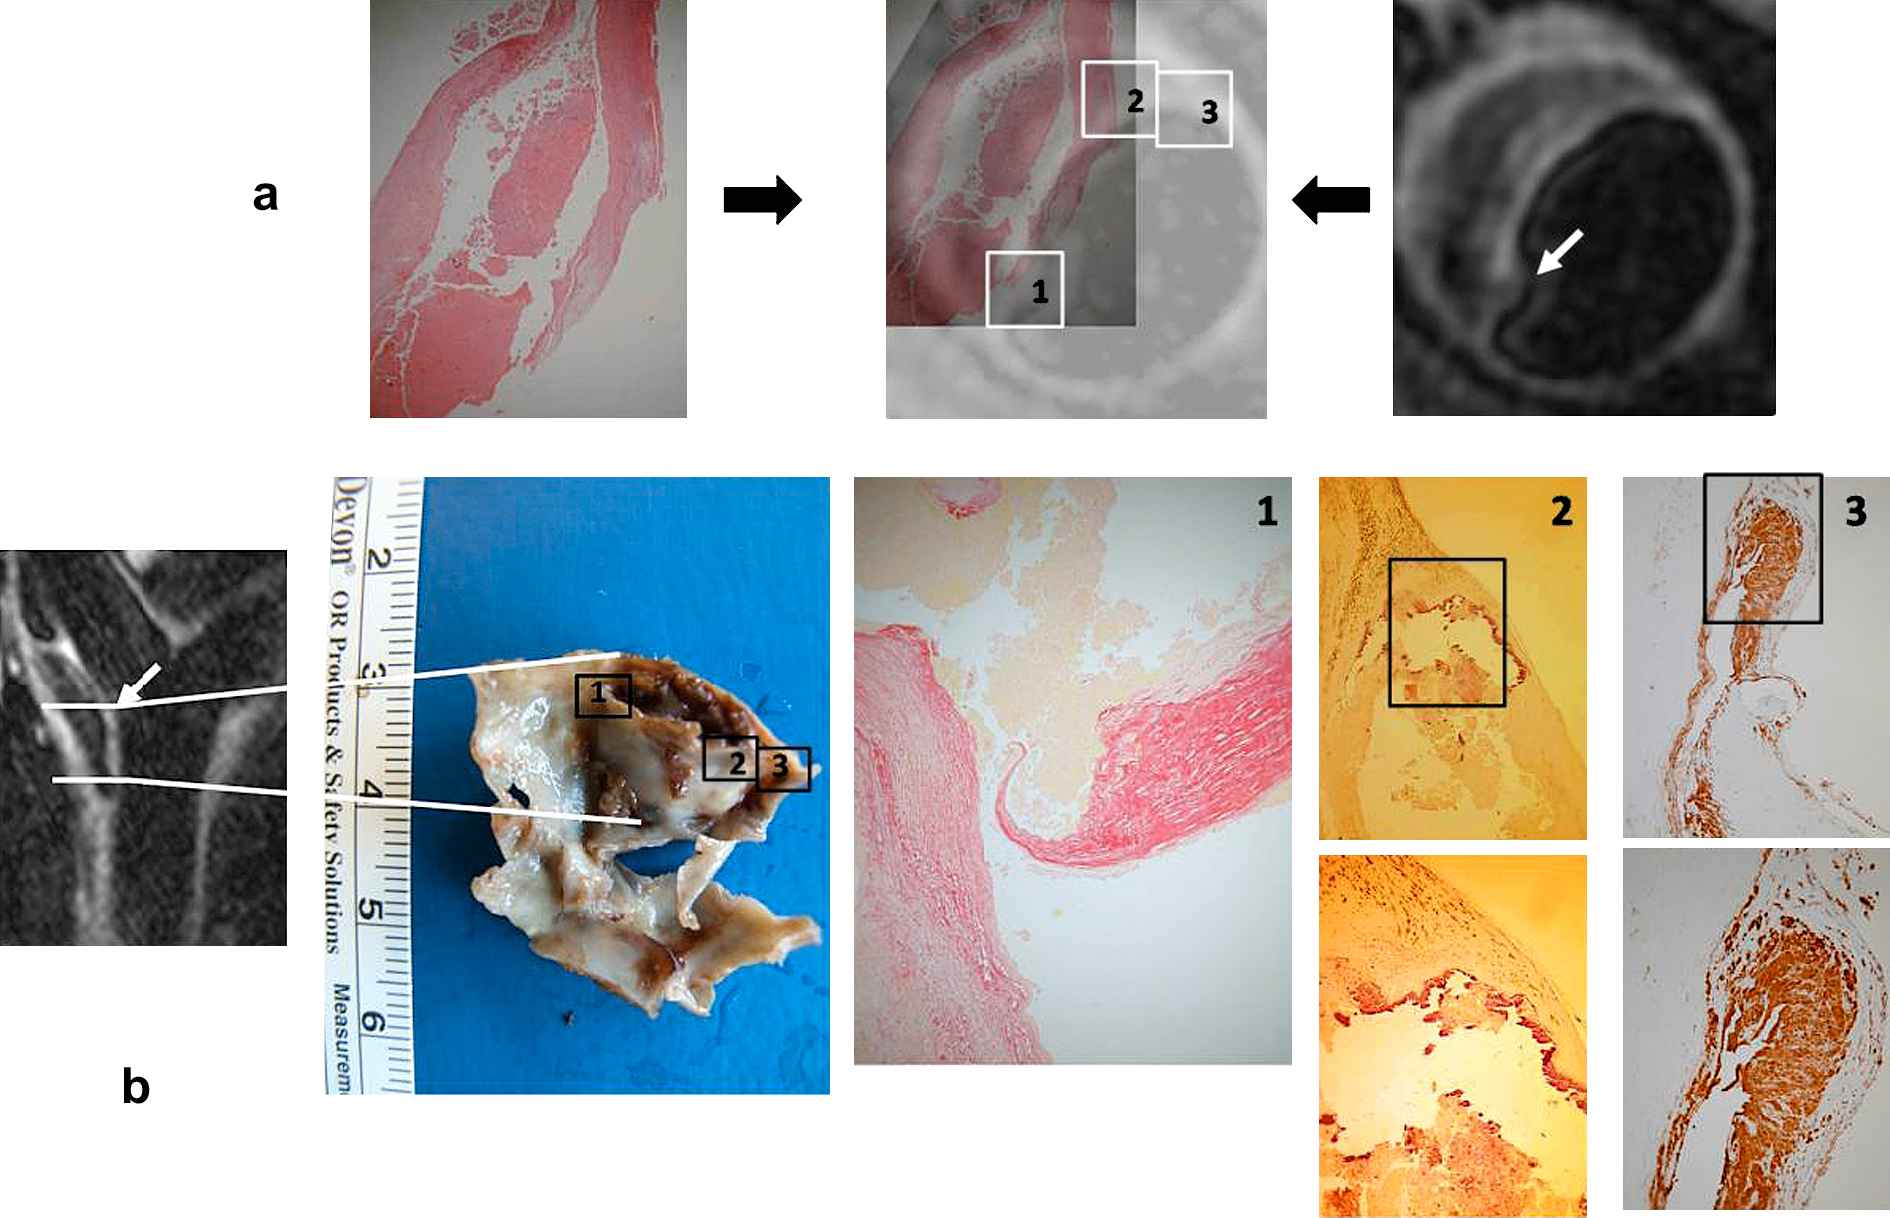
Endarterectomy specimen: (a) Main lipid core haematoxylin and eosin (HE) stained (left) demonstrating that the plaque was an inflamed thin capped lipid rich type VI (AHA classification); the specimen co-registered (middle) onto the T2-weighted MRI slice of the cross-section containing the plaque rupture (right). (b) Endarterectomy specimen together with the sagittal MR of the carotid bifurcation showing its location and orientation. Insets give details of (1) rupture site demonstrating extreme thinning of the fibrous cap and underlying thrombus; (2) nonruptured shoulder of the plaque presenting a large calcified nodule along the cap; (3) specific site along the plaque where the immuno-staining demonstrated presence of macrophages, hence plaque inflammation. White arrows point to rupture site.
The fibrous cap at the rupture site was 44 μm thick, 6.3% of the maximum cap thickness (Fig. 2b inset 1). There was focal calcification at the intact shoulder (Fig. 2b inset 2). Cholesterol clefts were identified at the shoulders of the plaque, with high density of macrophages (CD68+) and T-lymphocytes (CD3+) (Fig. 2b inset 3). The thrombus was lost during preparation.
Computational haemodynamics results
The lumen was modelled with the localised ruptured surface over the plaque sealed off and the single-slice higher resolution T2-weighted image was segmented and co-registered onto the T1-segmented contours to determine the location of fissuring in the computational model. The 5 parallel T2-weighted slices (Fig. 3a) were also co-registered onto the computational model. TAWSS contours and distribution of components within the plaque are presented (Fig. 3b). The fissure was close to slice 2, where a large lipid pool and calcium nodule were adjacent to the fibrous cap.
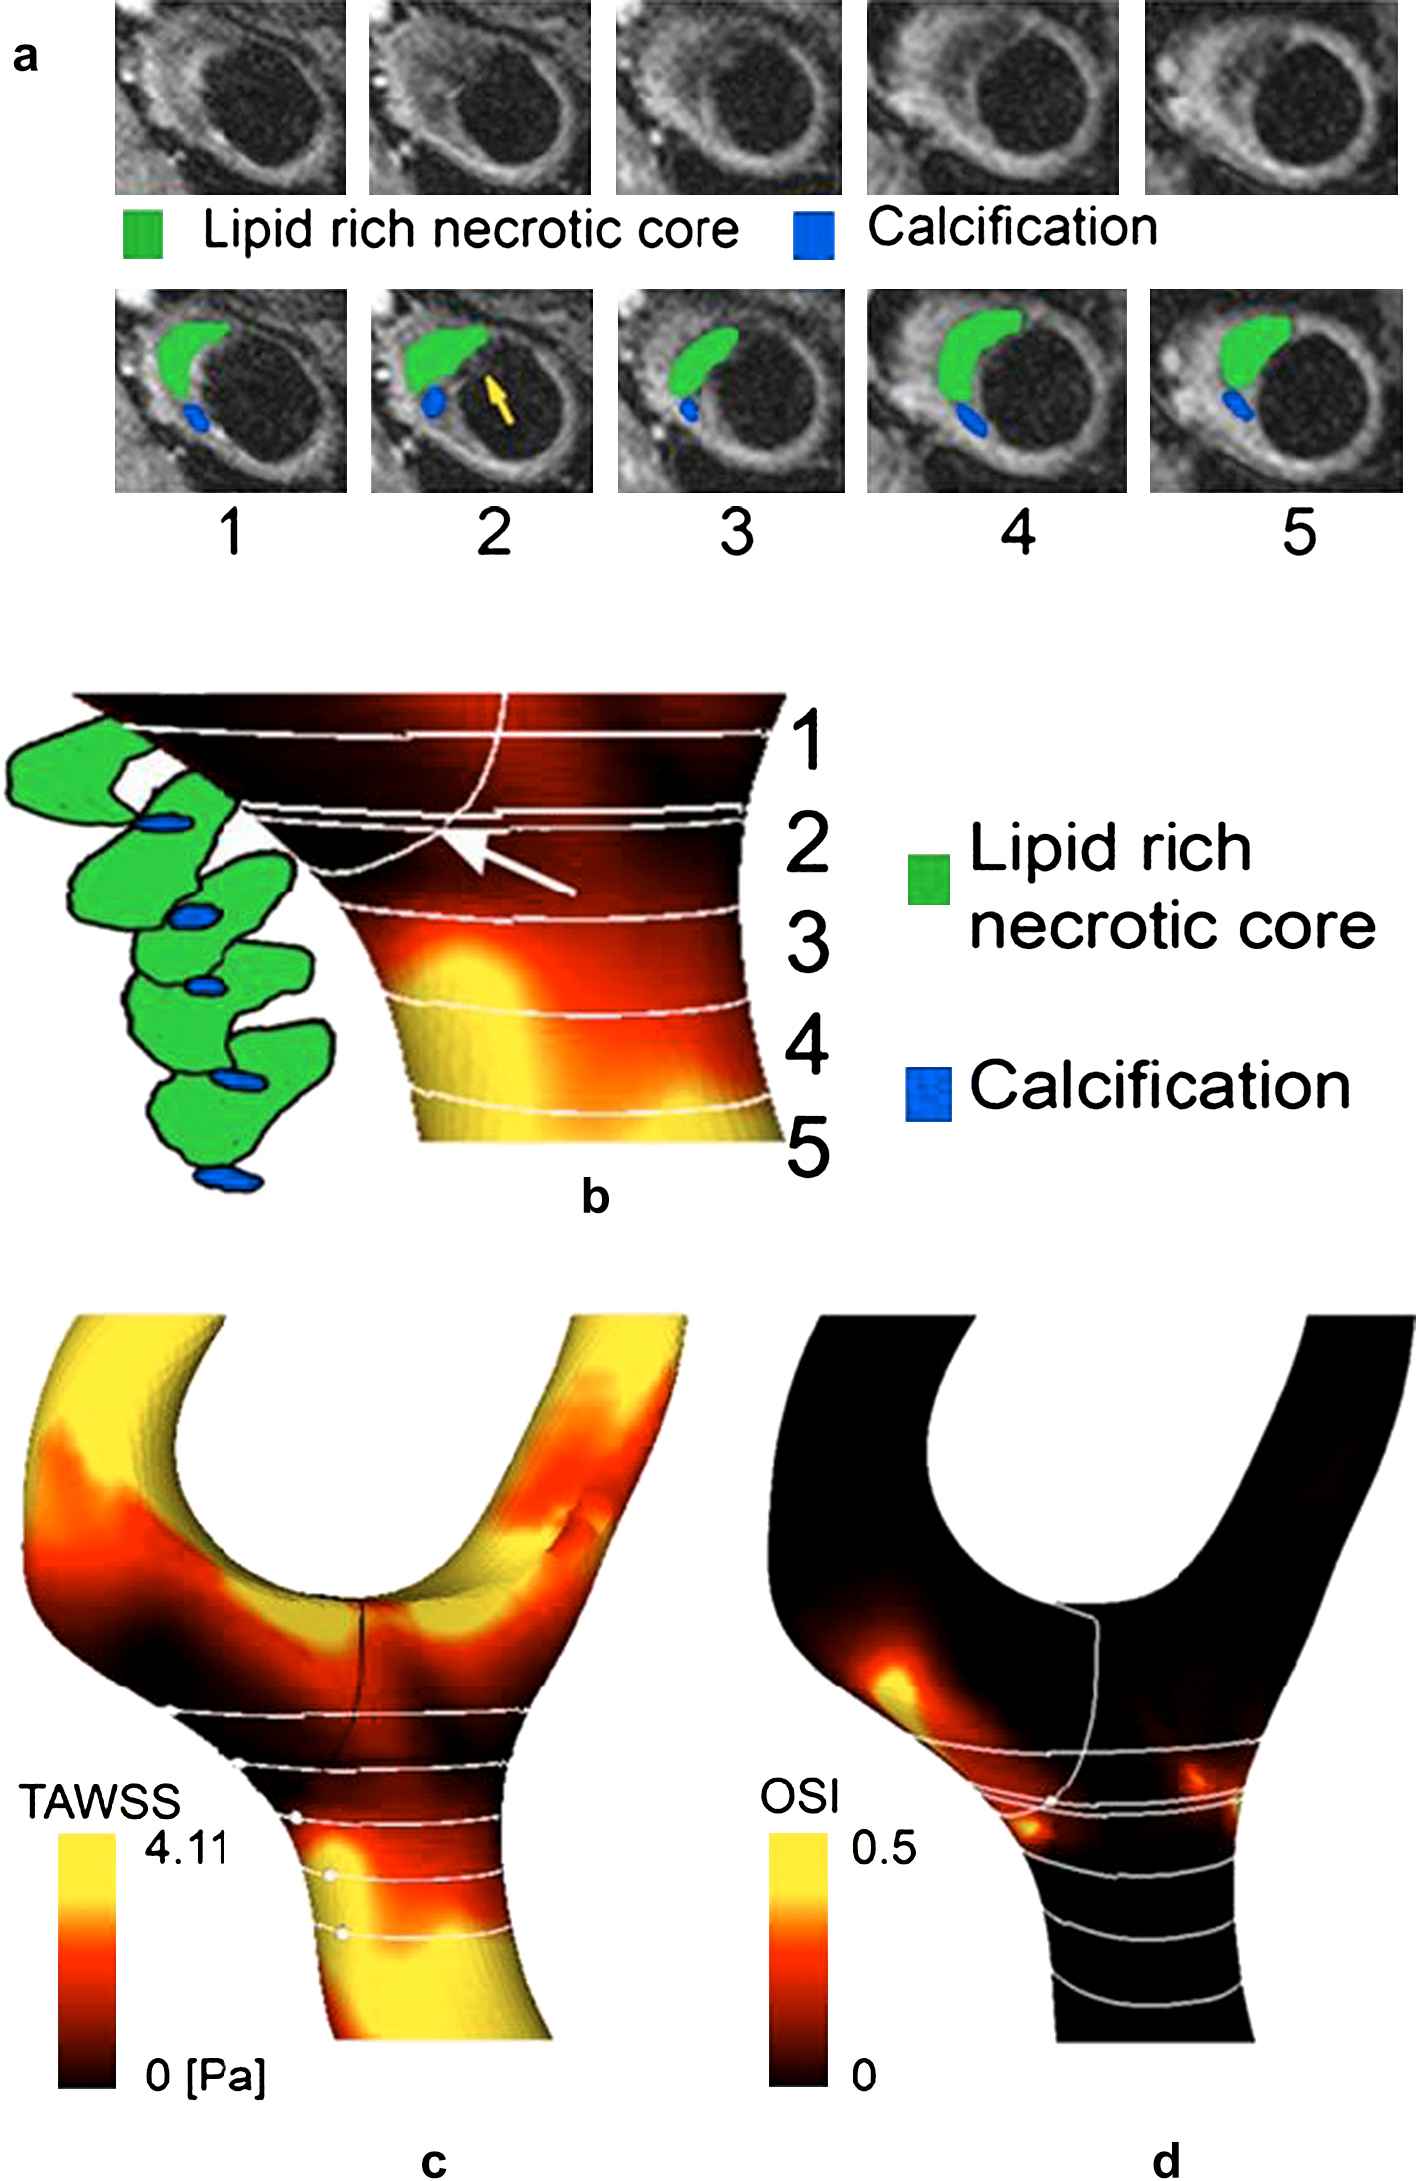
(a) (Top row) T2-weighted MR images, at planes numbered 1 to 5 and located, respectively, at 4, 6, 8, 10,12 mm below the bifurcation; (bottom row) superimposed detected lipid pool (green) and calcification (blue). Red arrow indicates intra-luminal thrombus adherent to the cap; yellow arrow indicates plaque rupture. (b) Segmented lipid pool and calcification with TAWSS contours in segment of interest. Arrow points to rupture site. Parallel white lines represent T2-weighted acquisition planes, the transversal white line the plane where the rupture occurred; additional line between sections 1 and 2 is parallel plane to which the rupture point belongs (5.8 mm below bifurcation). Distribution of (c) TAWSS and (d) OSI.
The mean and maximum TAWSS over the plaque were 1.61 and 4.11 Pa respectively, compared with 3.21 and 9.00 Pa for the whole geometry (Fig. 3c). TAWSS at the plaque rupture site was low at 0.48 Pa. The mean and maximum levels of OSI over the plaque were 0.05 and 0.49 respectively, and OSI at rupture site was 0.05.
As the lesion was not flow limiting, no local flow acceleration was found. However, flow separation was present in the post-stenotic region owing to curvature of the wall, where the low TAWSS levels were accompanied by moderate values of OSI (Fig. 3d).
Total plaque volume was 1.47 cm3, comprising 14.6% lipid pool and 9.7% calcification, the remaining volume comprising mainly fibrous tissue. Low, medium, and high TAWSS covered respectively 65.0%, 15.8% and 19.3% of the plaque surface area (Fig. 4). Fibrous tissue comprised 74.5%, 87.5% and 70.1% of the plaque in the low, medium, and high TAWSS ranges respectively; necrotic core: 16.3%, 8.75%, 13.6%; calcification: 9.19%, 3.76%, 16.3%.
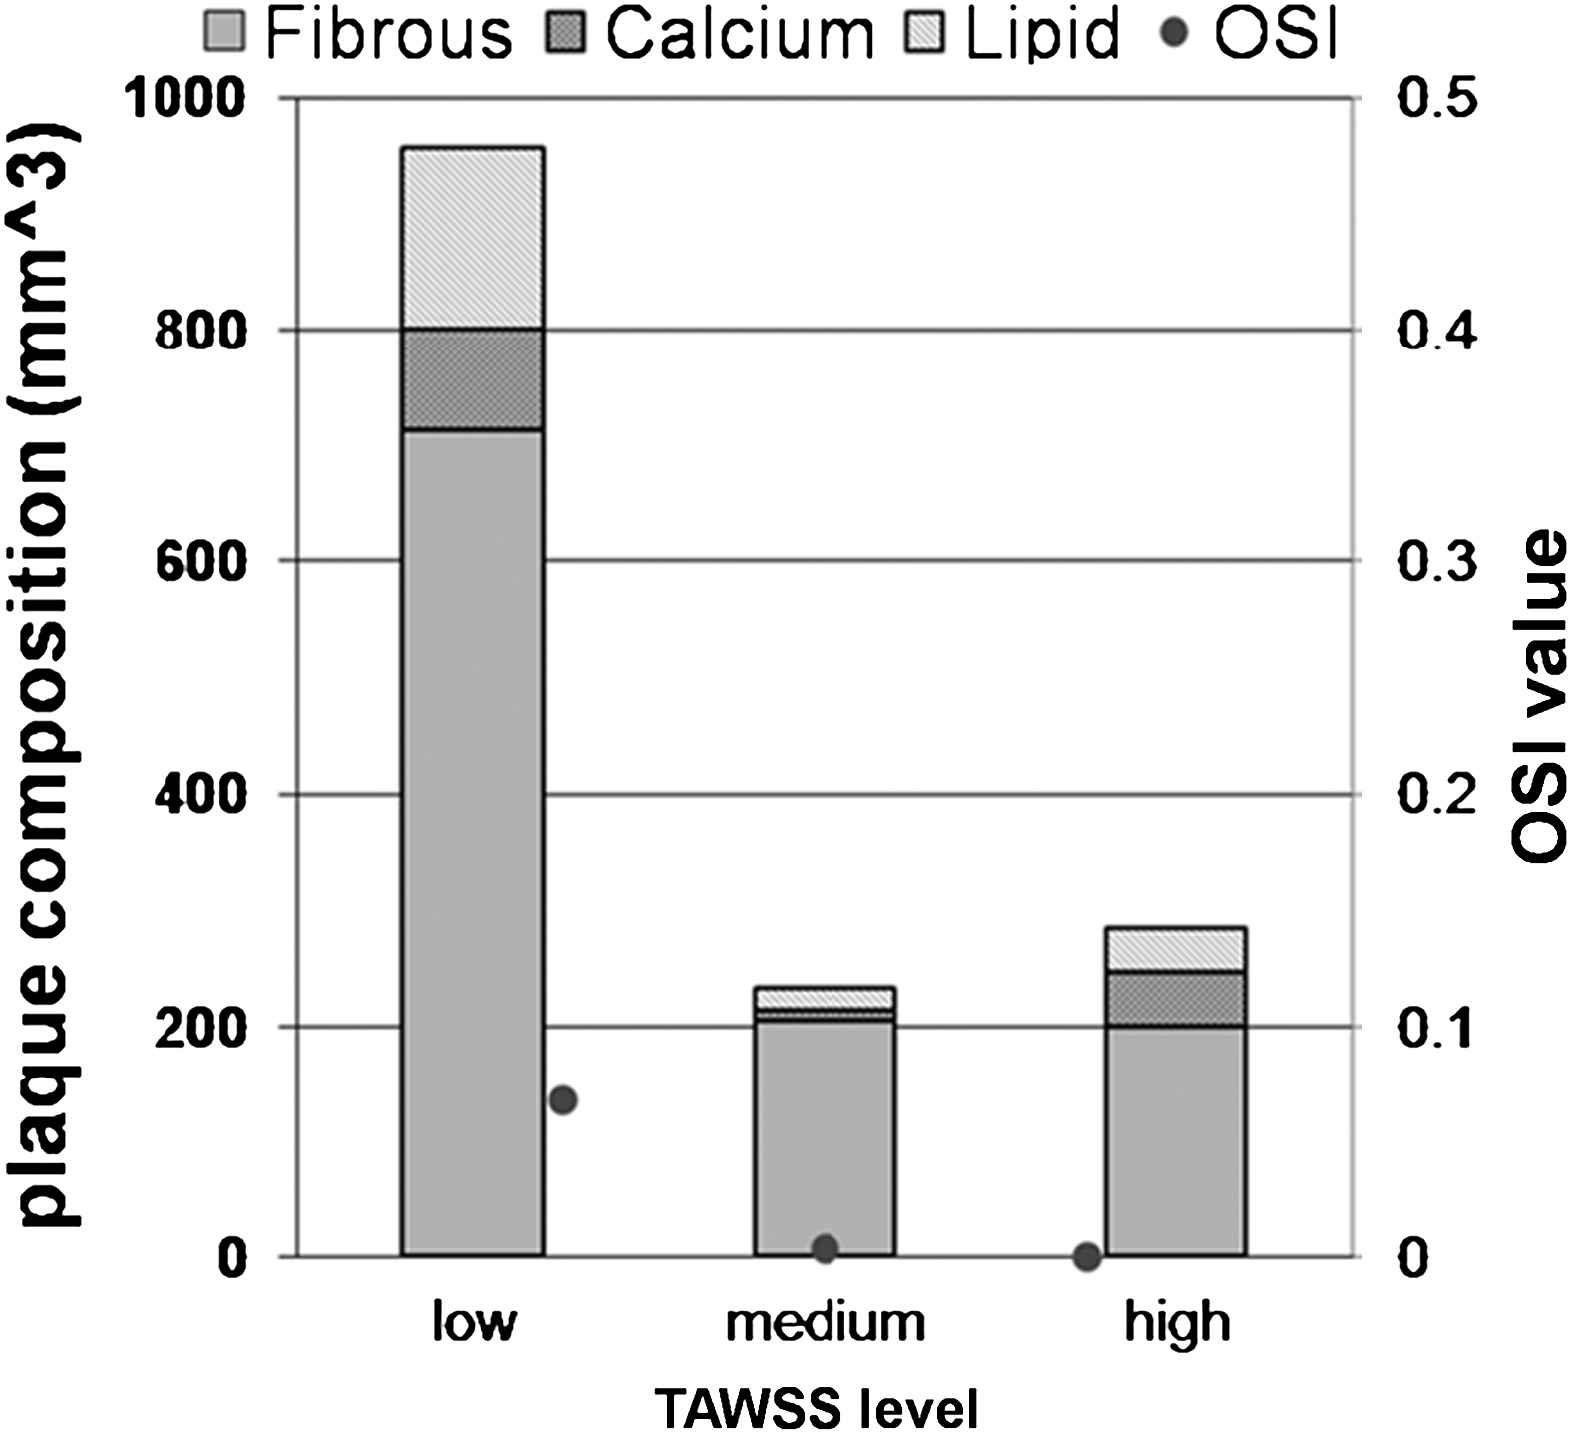
Vessel wall composition and OSI as function of TAWSS (low: 0 to 1.62 Pa; medium: 1.8 to 3.24 Pa; high: 3.24 to 9 Pa).
Plaque vulnerability analysis
Analysis was carried out on the five slices shown in Fig. 3a. Each was evaluated for core thickness, cap thickness, degree of stenosis under the carotid remodelling criterion, and critical cap thickness predicted by the model. The values of parameters used and results of prediction are summarised in Table 1.
| Slice No. | Lumen area [mm2] | Plaque Area [mm2] | Stenosis Glagov [%] | Corethick [mm] | Plaquethick [mm] | Capthick [μm] | Critical Capthick [μm] | Plaque vulnerability |
|---|---|---|---|---|---|---|---|---|
| 1 | 92 | 135 | 59.47 | 2.36 | 6.52 | 700 | 84 | Stable |
| 2 | 65 | 148 | 69.48 | 4.18 | 8.81 | 44 | 98 | Unstable |
| 3 | 47 | 138 | 74.59 | 3.04 | 9.23 | 200 | 85 | Stable |
| 4 | 40 | 114 | 74.03 | 3.02 | 8.30 | 250 | 85 | Stable |
| 5 | 38 | 94 | 71.21 | 3.50 | 8.10 | 260 | 95 | Stable |
Summary of plaque characteristics measured from T2-weighted MR images and histology (slice 2), the predicted critical cap thickness and plaque vulnerability. The Glagov degree of stenosis was calculated as below:
StenosisGlagov = 100 Aplaque/(Aplaque + Alumen)
where Aplaque and Alumen are cross-sectional areas of plaque and lumen respectively.
All slices were found to be sub-critical, except for slice 2, the rupture location, where the cap was unusually thin for a carotid plaque: 44 μm. In this case, the critical thickness was 98 μm, so the cap was clearly vulnerable by a wide margin, more than 100%.
Discussion
In this study different imaging contrast and computational flow modelling techniques were used, together with finite element-based technique3 informed by the geometrical criteria of the Glagov pathology analysis,4 characterising a ruptured plaque in terms of morphology, composition and flow dynamics.
The rupture was just distal to the site of maximal plaque thickness, where WSS was particularly low. As far as we are aware, a patient-specific computational flow analysis of a ruptured carotid plaque has only been performed previously on one patient, where the rupture was proximal, in a high WSS region.5
Histological analysis of plaque composition revealed that the plaque rupture had occurred at a region with a high density of underlying lipid core, and a thin fibrous cap. Lipid content, cap thickness and inflammation are important in plaque vulnerability.2–4
Lesion rupture is typically found in proximal plaque regions, but can occur distally. In an angiographic study on 421 patients with carotid plaque ulceration10 the ulceration was proximal in 72%, at mid-point in 16%, distal in 12%. Proximal ulceration was particularly associated with severely stenosed arteries, whilst distal ulceration was associated with degrees of stenosis between 30 and 69% (ECST criteria). ‘Ulceration’ was used because the angiograms could not give certain identification of rupture [Rothwell PM, private communication, 2009].
Flow pattern and endothelial shear stress induced are dependent on geometry, specifically the location and degree of stenosis, which is modified by plaque progression. At the rupture site, WSS was found to be low, but not oscillatory. Low WSS is considered pro-atherogenic.12,15 Mechanoreceptors in endothelial cells sense local level of WSS, activating a complex network of intracellular pathways, modulating cellular function and morphology.16,17 In low and oscillatory WSS regions, athero-protective genes are downregulated and pro-atherogenic genes upregulated,18,19 including that for LDL receptors in ECs. With higher LDL ingress by the widening of the junction between endothelial cells, through apoptosis increased by low WSS, its accumulation is enhanced.8,17 The inflammatory response involves the binding of leukocytes to adhesion molecules, also promoted by low WSS; they differentiate as macrophages, absorb oxidized LDL and transform to foam cells, which are responsible for the production of cytokines, growth factor and matrix-degrading enzymes, such as matrix metalloproteinase (MMPs).8 It has been suggested that excessive expansive remodelling, because low WSS conditions persist, promotes continuing lipid accumulation, inflammation, oxidative stress, matrix breakdown, hence vulnerability.2,6
A further element in the computational mechanics of atherosclerotic plaque is internal tensile stress, which may be up to five orders of magnitude greater than WSS, and is the appropriate criterion for assessing vulnerability and ultimate failure. Thus, whilst low and/or oscillatory WSS promote the conditions for plaque vulnerability, tensile stress is likely the ultimate agent of plaque rupture,2–4,6 as demonstrated by the biomechanics-based plaque vulnerability analysis shown here.
Although the effects of low WSS on plaques, having some different mechanisms from high WSS, they are consistent with the Glagov criteria as they apply to plaque with high remodelling index, as in this instance. The cap was extremely thin at the rupture site, probably associated with the biological factors discussed above. Based on patient-specific plaque morphological characteristics, but evaluated using a model derived from finite element stress analysis for related idealised geometries, the Glagov criteria provided data on which the vulnerability was reliably assessed in the present study. Larger clinical studies are required on carotid plaque with application of criteria used here.
Limitations
In order to carry out the flow and stress analyses, the plaque was reconstructed by smoothing across the fissure site. As this was a proof of principle study, only one patient was studied; however, this sample size was consistent with previous work in this area.5
Acknowledgements
Miss Giulia Soloperto was supported by
References
Cite this article
TY  - JOUR
AU  - Giulia Soloperto
AU  - Niall G. Keenan
AU  - Mary N. Sheppard
AU  - Jacques Ohayon
AU  - Nigel B. Wood
AU  - Dudley J. Pennell
AU  - Raad H. Mohiaddin
AU  - Xiao Yun Xu
PY  - 2010
DA  - 2010/06/23
TI  - Combined imaging, computational and histological analysis of a ruptured carotid plaque: A patient-specific analysis
JO  - Artery Research
SP  - 59
EP  - 65
VL  - 4
IS  - 2
SN  - 1876-4401
UR  - https://doi.org/10.1016/j.artres.2010.05.001
DO  - 10.1016/j.artres.2010.05.001
ID  - Soloperto2010
ER  -