
Wall shear stress revisited
- DOI
- 10.1016/j.artres.2009.02.005How to use a DOI?
- Keywords
- Wall shear stress; Wall shear rate; Velocity profiles; Non-invasive vascular ultrasound; Glycocalyx; Design arterial system
- Abstract
In vivo measurements of wall shear stress (WSS), a determinant of endothelial cell function and gene expression, have shown that theoretical assumptions regarding WSS in the arterial system and its calculation are invalid. In humans mean WSS varies along the arterial tree and is higher in the carotid artery (1.1–1.3 Pa; 1 Pa = 10 dyn cm−2) than in the brachial (0.4–0.5 Pa) and femoral (0.3–0.5 Pa) arteries. Also in animals mean WSS is not constant along the arterial tree. In arterioles mean WSS varies between 2.0 and 10.0 Pa and is dependent on the site of measurement. In both arteries and arterioles, velocity profiles are flattened rather than fully developed parabolas. Across species mean WSS in a particular artery decreases linearly with increasing body mass, in the infra-renal aorta from 8.8 Pa in mice to 0.5 Pa in humans. The observation that mean WSS is far from constant along the arterial tree indicates that Murray’s cube law on flow-diameter relations cannot be applied to the whole arterial system. The exponent of the power law varies from 2 in large arteries to 3 in arterioles. The in vivo findings imply that in in vitro investigations an average calculated shear stress value cannot be used to study effects on endothelial cells derived from different vascular areas or from the same artery in different species. Sensing and transduction of shear stress are in part mediated by the endothelial glycocalyx. Therefore, modulation of shear stress sensing and transduction by altered glycocalyx properties should be considered.
- Copyright
- © 2009 Association for Research into Arterial Structure and Physiology. Published by Elsevier B.V. All rights reserved.
- Open Access
- This is an open access article distributed under the CC BY-NC license.
Introduction
It has been well established that wall shear stress (WSS), i.e., the drag of the flowing blood exerted on endothelial cells, is an important determinant of arteriolar and arterial diameters by modifying the production of vasoactive mediators by endothelial cells1–5 and of endothelial gene expression.6–12 Endothelial genes can be transiently or more permanently up-regulated by shear stress.7 WSS can be estimated as the product of wall shear rate (WSR) and local blood viscosity, WSR being defined as the radial derivative of blood flow velocity distribution at the wall.
The vast majority of the experiments on shear stress and endothelial gene expression are performed in vitro, exposing the cells to an average calculated shear stress, no matter the area in the vascular system or the species they are derived from. In in vivo studies on shear stress and arterial diameter adaptation and endothelial gene expression, shear stress is calculated by assuming the velocity profile to be a fully developed parabola. In these approaches it is assumed that Poiseuille’s law can be applied, WSS is constant along the arterial tree according to Murray’s law of minimal energy discharge13,14 at a level of about 1.5 Pa (1 Pa = 10 dyn cm−2)15 and WSS in a particular artery is similar across species. In vivo measurements of WSS, however, have shown that these assumptions regarding WSS in the arterial system and its calculation are far from valid.16,17 This does have consequences, among others, for the in vitro experiments on shear stress and endothelial gene expression and our ideas concerning the design of the arterial system.18
In this survey we will address the assessment of wall shear stress in vivo, the data as found in arterioles and arteries, the discrepancies of these findings with theory and the implications thereof, and the differences in WSS across species. Because there are indications that the glycocalyx plays a role in the interaction between WSS and endothelial cell function we will briefly discuss its part in sensing and transferring shear forces.
WSS in vivo
Arterioles
In mesenteric arterioles WSS has been determined directly by means of measured19 or calculated20 pressure up and downstream, and length and diameter measurements, or from WSR, as derived from recorded velocity profiles,21 and plasma viscosity.22 In cremaster muscle arterioles shear stress was calculated from blood flow, radius and viscosity, assuming Poiseuille flow conditions.23
Originally fluorescently labelled blood platelets were used as velocity tracers to assess velocity profiles in arterioles.21 These velocity tracers cannot come closer to the wall than 0.5 μm.24 More recently fluorescently labelled nanometer particles are in use as velocity tracers, which come as close to the wall as 0.2 μm.25,26 Originally, the velocity of the tracers and their position were determined manually, a rather time-consuming procedure, but recently a two-dimensional correlation technique has been developed to measure displacement and position of the velocity tracers,26 automatically providing velocity profiles.27 The velocity tracers approach the vessel walls closely, especially the nanometer particles. Therefore, plasma viscosity can be taken to convert WSR to WSS, especially because the plasma layer is likely to be a few micrometers thick.28 Plasma viscosity can be accurately determined in vitro by means of glass capillary viscometry systems. The velocity profiles in arterioles are flattened parabolas rather than fully developed ones.21
In mesenteric arterioles mean WSS was found to be on the average 1.8 Pa in rabbits, 4.7 Pa in cat and 5.0 Pa in rat in the larger arterioles and >10 Pa in the smaller ones (Table 1). The variation in WSS values can likely be explained by the non-regulatory properties of mesenteric arterioles29; variations in blood flow are not or inadequately compensated for by changes in arteriolar diameter. Variations in shear stress along the vascular tree were also found in cremaster muscle arterioles, varying on the average from 3.0 Pa in the proximal part to 2.1 Pa in the more distal part (Table 1).
Large arteries
In large arteries WSS can be estimated from WSR and whole blood viscosity, WSR being derived from velocity profiles recorded with either Ultrasound or Magnetic Resonance Imaging (MRI). In our studies we have chosen Ultrasound, because of its better spatial and especially temporal resolution compared to MRI. We use a 7.5 MHz 2D imaging device combined with a dedicated system as developed in our institute.30,31 This system captures along the M-line of observation through the centre of the vessel (sample rate 20 MHz) the RF signals induced by artery wall displacement and the moving red blood cells. After eliminating the high amplitude low frequencies generated by the moving wall by means of adaptive filtering, the time-dependent velocity distribution in the artery is determined by means of a modelled cross-correlation technique.32 By calculating the mean velocity for each RF segment a 3D velocity profile is obtained (Fig. 1). The length of the RF-segments is about 300 μm with a spacing of 150 μm (50% overlap). This is the best spatial resolution attainable for a system operating effectively at 6 MHz. The shear rate distribution in the artery is obtained by determining the radial derivative of blood flow velocity at each site and each time instant (Fig. 2). WSR is high near the wall and low in the centre of the vessel, which is consistent with a flattened parabolic velocity profile, a shape found in most large arteries.16 Because blood flow velocities cannot be determined at the wall, the maximum value of the radial derivative of the velocity profile is considered as the estimate of instantaneous WSR. From the shear distribution mean WSR, the time-averaged shear rate over one cardiac cycle, and peak WSR, the value at peak systole, can be determined. In large arteries whole blood viscosity is used to calculate WSS, because the plasma layer of a few micrometers in thickness28 can be ignored relative to the size of the sample volume of the ultrasound system (250–300 μm). It should be realized that no average whole blood viscosity value can be taken to calculate WSS, because mean WSR, an important determinant of whole blood viscosity, varies along the arterial tree, being substantially higher in the common carotid artery than in the femoral and brachial arteries (Table 2). This implies, that, for example, whole blood viscosity is higher in the brachial (5 mPa s) than in the common carotid artery (3 mPa s).16 The consequences of such a difference in whole blood viscosity are, for example, illustrated by the finding that the higher peak WSR in the common carotid (1047 s−1) artery than in the brachial (770 s−1) artery, as determined in the same study population, leads to higher peak WSS in the latter (3.9 Pa) than in the former artery (3.4 Pa).16 The consequences in terms of mean WSS are reflected by the observation that the average difference in mean WSS between the brachial and the common carotid artery is less than the average difference in mean WSR between these arteries (cf Tables 2 and 3).

Velocity distribution in the common carotid artery of a presumed healthy volunteer. Velocities are high in the centre of the vessel, especially in systole, and decrease linearly towards the wall. Note the very small velocity gradient in the centre of the artery, which is compatible with a flattened parabolic velocity profile.
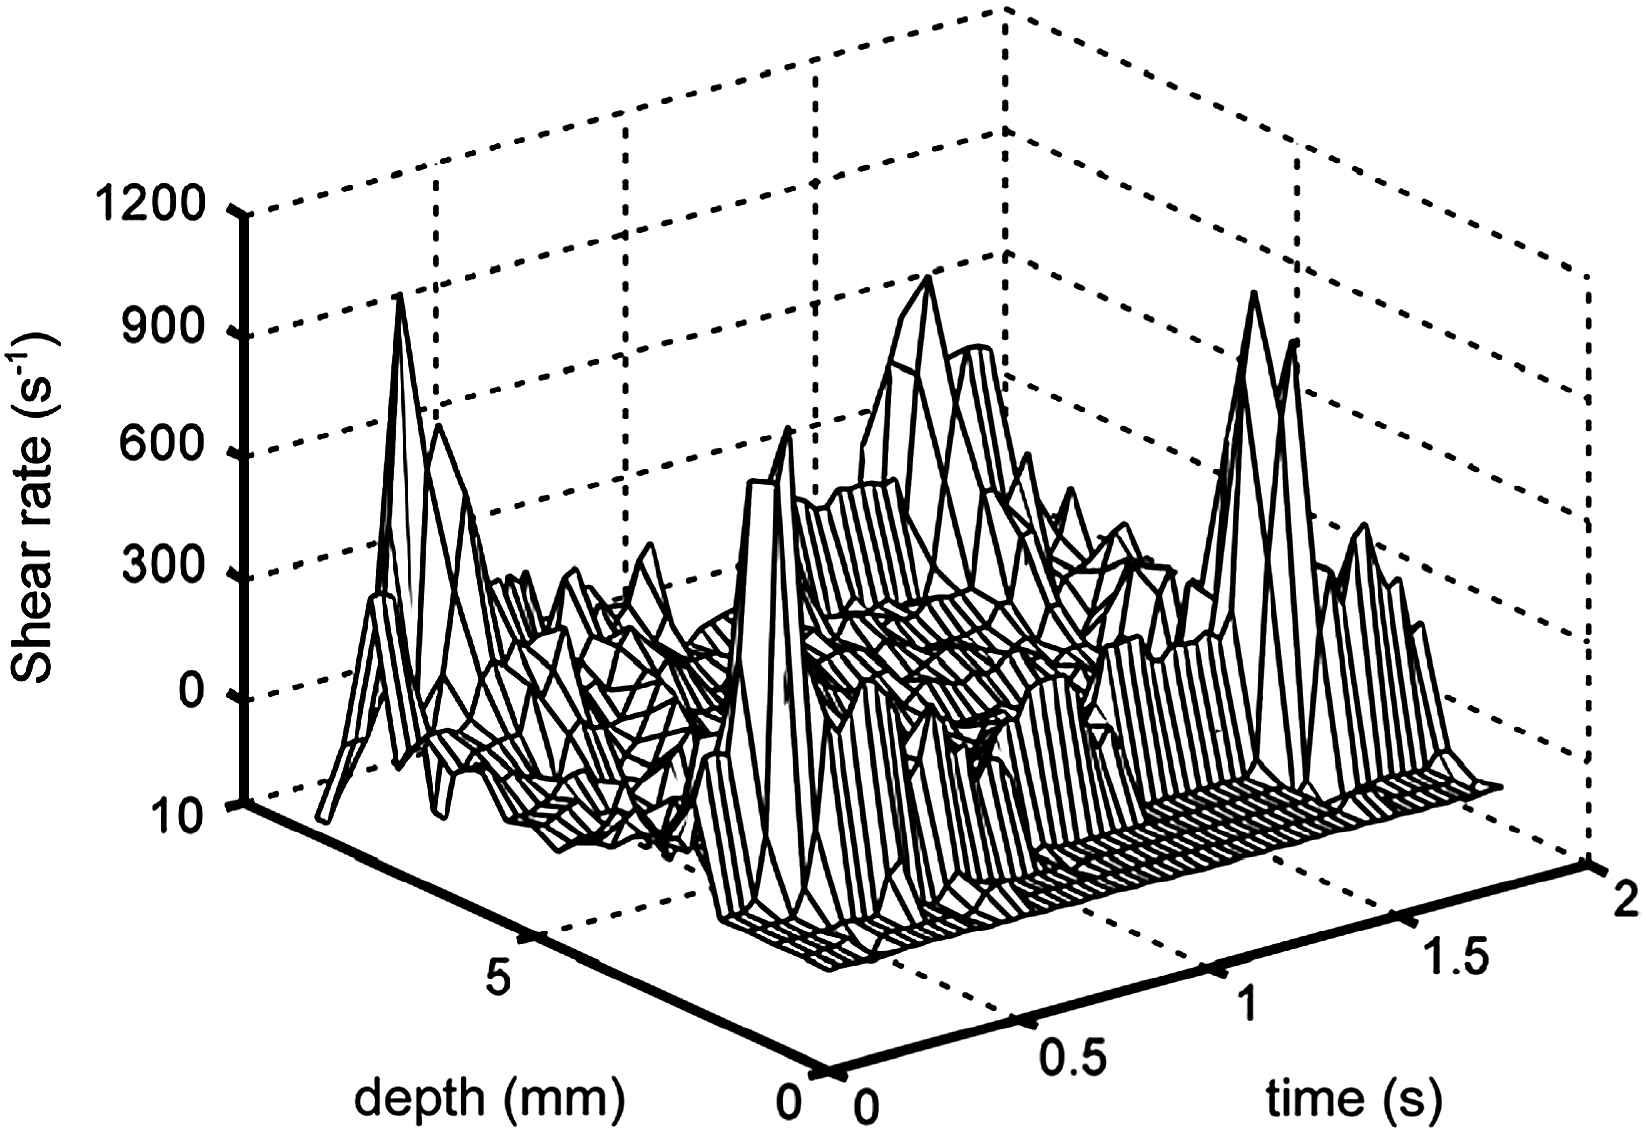
Shear rate distribution in the common carotid artery of a presumed healthy volunteer, as derived from the velocity profile in Fig. 1. Shear rate is substantially higher near the wall than in the centre of the vessel, especially during systole. The peaks near the wall represent the maximum dv/dr as measured 250–300 μm from the wall.
| Common carotid artery | 310–414 |
| Superficial femoral artery | 130 |
| Brachial artery | 95 |
From Reneman et al.16
Average mean wall shear rate (s−1) in large arteries in presumed healthy humans.
| Mean WSS | Peak WSS | |||
|---|---|---|---|---|
| Young | Old | Young | Old | |
| CCA | 1.3 | 1.2 | 3.8 | 2.6 |
| CFA | 0.4 | 0.3 | 4.0 | 3.8 |
| SFA | 0.5 | 0.5 | 3.4 | 4.0 |
| BA | 0.5 | 0.5 | 3.6 | 3.3 |
From Reneman et al.16
Average mean and peak wall shear stress (WSS; Pa) in the common carotid artery (CCA), the common (CFA) and superficial femoral (SFA) arteries and the brachial artery (BA) at rest in presumed healthy volunteers.
In presumed healthy volunteers mean WSS is far from constant along the arterial tree and varies on the average from 1.2–1.3 Pa in the common carotid artery, to 0.3–0.5 in the femoral artery bifurcation and around 0.5 in the brachial artery (Table 3). Only in the common carotid artery the value is close to the theoretically predicted value of 1.5 Pa.15 The lower mean WSS in these conduit arteries at rest can be explained by the high peripheral resistance in these vessels, reducing mean volume flow and inducing reflections. Dilation of the femoral artery vascular bed results in mean WSS values not significantly different from those in the common carotid artery.33 This observation indicates that at rest mean WSS is largely determined locally. The low mean WSS in these conduit arteries allows for an increase in mean WSS during exercise without reaching levels that could be damaging to the endothelial cells. The pronounced increases in flow under these circumstances, after all, are not compensated for by an adequate enlargement of the arterial diameter.
Mean WSS is not significantly different in men and women and does not change significantly with age, either in the common carotid,34 the femoral33 or the brachial artery.35
Although small, the difference in mean WSS between the common and superficial femoral arteries (Table 3) is significant,33 the former artery seeing reflections from both the deep and the superficial femoral artery, while the latter one only sees reflections from its own vascular bed. Also in the carotid artery bifurcation differences in mean WSS have to be appreciated.36 It is of interest to note that in both the femoral artery bifurcation37 and the carotid artery bifurcation36 the differences in mean WSS are associated with differences in intima-media thickness (IMT): the lower mean WSS is, the larger IMT will be.
Peak WSS does not significantly vary along the arterial tree in young volunteers, varying on the average from 3.8 Pa in the common carotid artery to 3.4–4.0 Pa in the femoral artery bifurcation and 3.6 Pa in the brachial artery in the populations studied (Table 3). Unlike in the femoral artery bifurcation33 and in the brachial artery,35 peak WSS in the common carotid artery is higher in males than in females and decreases significantly with age (Table 3).34
Across species
Recent studies have shown that in a particular artery mean WSS differs significantly across species. For example, in the infra-renal aorta mean WSS increases linearly with decreasing body mass on a log/log scale from 0.5 Pa in man to about 7.0 Pa in rats and about 8.8 Pa in mice.38 In their study WSS was estimated similar to the approach described above, except that the velocity profiles were recorded with MRI. In their review Cheng et al.17 collected a similar pattern for the common carotid artery, mean WSS on the average varying from 1.2 Pa in humans to 4.7 Pa in rats and 6.5 Pa in mice. The higher mean WSS values in small animals can be explained by the smaller arterial diameter of arteries carrying blood flow with velocities comparable to those in larger species. The substantially higher WSS values in small animals indicate that their endothelial cells are less sensitive to shear forces or that they function at a different set-point.
Comment to the assessment of WSS in vivo
In arterioles shear rate can be determined close to the wall using nanometer particles as flow velocity tracers. In large arteries, however, WSR is measured at some distance from the wall and, hence, the values obtained in these vessels have to be considered as least estimates, because shear rate increases towards the wall. Despite this underestimation, WSS estimated at a distance from the wall will not be too different from the value at the wall, because viscosity decreases towards the wall. Shear stress can more or less be considered as a continuum from the centre of the vessel towards the wall. The underestimation of WSS, when determined 250–300 μm from the wall, as in the ultrasound system used in our institute, is likely to be 10%.18
Discrepancies with theory and implications thereof
Discrepancies
The in vivo studies have shown that (1) in arteries and arterioles mean WSS may deviate substantially from the theoretically predicted value of about 1.5 Pa, (2) mean WSS is not constant along the arterial tree and even varies within artery bifurcations and along arteriolar segments, (3) in a particular artery mean WSS is significantly different across species and (4) velocity profiles are flattened parabolas rather than fully developed ones in both arterioles and arteries.
Implications
The idea of constant mean WSS is based upon the concept of minimal work according to Murray’s law,13,14 which implies that the cube diameter of a vessel should be proportional to the flow through it, assuming Poiseuille flow conditions. Consequently, the cube of the diameter of a parent vessel is equal to the sum of the cubes of the diameters of the daughter vessels. The in vivo findings indicate that Murray’s cube law cannot hold for the whole arterial tree, because WSS varies substantially in the arterial system and the velocity profile is not fully developed. Zamir et al.39 showed that in the major branches of the aortic arch the relation between flow and diameter is governed by a ‘square law’, which would suggest that flow velocity is constant independent of the diameter.18 A square law for the whole arterial tree, however, is incompatible with the observation that mean blood flow velocity also varies along the arterial tree, in animals40 and in man.41 At the present state of the art one may conclude that the exponent of the power law varies along the arterial tree, from 2 in larger arteries39 to 2.55 in coronary arteries42 and about 3 in arterioles.43
In in vitro studies no average calculated shear stress value can be taken to study gene expression in endothelial cells. The cells have to be studied under the shear stress conditions where they are exposed to in real life.
The flattening of velocity profiles, in both arteries and arterioles, implies that WSR has to be derived from recorded velocity profiles and cannot be estimated from parabolic ones, assuming Poiseuille flow conditions. When assuming a fully developed parabolic velocity profile, mean WSR and mean WSS in the common carotid artery will be underestimated by a factor of 2–331,44 and a factor of 2,44 respectively, and in mesenteric arterioles by a factor of 2.1.24 Such underestimations do not only affect calculated WSS, but also lead to too high calculated or determined values of whole blood viscosity which strongly depends on shear rate.16
The glycocalyx and the transfer of shear forces to endothelial cells
There is increasing evidence that the glycocalyx, a mesh of glycoproteins, sulphated proteoglycans and associated glycosamineglycans of a few hundred nanometer to a few micrometer,45–47 senses fluid dynamical forces.46,48–50 It has been proposed that the core proteins in the glycocalyx are especially suited to act as a transducer of fluid shearing stresses51 and that the glycocalyx transfers the fluid dynamical forces into tensile stress.52 The observations so far indicate that the glycocalyx may act as the first step in the process of mechanotransduction, i.e., the transduction of biomechanical forces into bio-molecular responses in the endothelium. It is as yet unclear whether the glycocalyx amplifies the shear forces that are substantially lower than the pressure forces, another important determinant of endothelial cell function (Pa versus kPa).
Glycocalyx dimensions are smaller at atherosclerotic lesion prone sites in the murine internal carotid artery.53 Recent in vitro studies consistently demonstrate attenuated shear stress induced release of nitric oxide by54 and shape change modulation of55 endothelial cells exposed to such glycocalyx degrading enzymes as heparitinase and hyaluronidase. Apparently, loss of glycocalyx contributes to impaired sensing and transduction of fluid shear stress. Gouverneur et al.46 have demonstrated that shear stress is a stimulus for endothelial glycocalyx production, which may explain the small glycocalyx dimensions at specific sites in arterial bifurcations exposed to low mean WSS. On top of these local, spatial variations in glycocalyx dimensions and shear stress transducing properties, systemic perturbation of glycocalyx properties by exposure to atherogenic risk factors or by genetic predisposition may further modulate sensing and transmission of fluid shear stress.
References
Cite this article
TY  - JOUR
AU  - Robert S. Reneman
AU  - Hans Vink
AU  - Arnold P.G. Hoeks
PY  - 2009
DA  - 2009/03/03
TI  - Wall shear stress revisited
JO  - Artery Research
SP  - 73
EP  - 78
VL  - 3
IS  - 2
SN  - 1876-4401
UR  - https://doi.org/10.1016/j.artres.2009.02.005
DO  - 10.1016/j.artres.2009.02.005
ID  - Reneman2009
ER  -