
Limitations and pitfalls of non-invasive measurement of arterial pressure wave reflections and pulse wave velocity
- DOI
- 10.1016/j.artres.2009.02.006How to use a DOI?
- Keywords
- Arterial stiffness; Hemodynamics; Wave reflection; Aorta; Pulse wave velocity; Augmentation index
- Abstract
In this paper, we briefly revise some of the most widely applied methods to non-invasively assess pressure wave reflection (augmentation index) and arterial stiffness (pulse wave velocity; PWV) in clinical vascular research. It is clear that the pressure waveform alone provides insufficient information to accurately quantify the magnitude of pressure wave reflection or to even fully interpret its nature. A major difficulty arises from the identification of timing of return of the reflected pressure wave, the “fiducial” point, and incorrect assessment of this point has an effect on all of the derived parameters. From our studies, it also follows that the use of an approximated flow waveform has little or no added value to assess magnitude of wave reflection. As for PWV, carotid–femoral pulse wave velocity is currently considered as the gold standard method, although accurate assessment of travel distance remains ambiguous. New methods have also been suggested for the assessment of PWV, relying on the concept that the pressure wave is composed of one single forward wave and one single reflected wave, originating from a single reflection site. This simple conceptual scheme is no more than a paradigm for a complex physical reality of wave transmission and continuous reflections in a complex branching network of elastic vessels and the accuracy of these methods is very limited. As such, the benefit of the ease of use of these methods should be weighted against the desired accuracy and reliability.
- Copyright
- © 2009 Association for Research into Arterial Structure and Physiology. Published by Elsevier B.V. All rights reserved.
- Open Access
- This is an open access article distributed under the CC BY-NC license.
Introduction
Arterial stiffness and pressure wave reflection have gained increased attention of the clinical community and the prognostic value of these novel parameters and their association with cardiovascular disease is and has been the subject of many clinical studies.1–6 The terminology in the field, however, is not very specific and many different devices, techniques and methods co-exist, aiming to capture aspects of the physiology of the large systemic vessels. What most of these methods have in common is that they are approximate, often because of the restrictions imposed by the non-invasiveness of the measurements and the non-availability of crucial data, but sometimes also because of intrinsic limitations of the methodology.
In this manuscript, we provide an overview of some of our recent and ongoing work on methods to assess wave reflections and pulse wave velocity. Pulse wave velocity shows a positive relationship with measures of arterial stiffness, and its meaning as a parameter for arterial stiffness is straightforward. Early wave reflection boosts systolic pressure and poses an extra load on the heart, hence there is clinical interest in quantifying the magnitude of these reflections. It should be stressed that we do not intend to address all existing methods and devices. As such, this document is far from complete. Although the absolute accuracy of the different methods is hard to assess because of a lack of absolute ground truth information, this contribution should give the reader some sense about the approximate nature, assumptions and potential pitfalls underlying some widely applied methods. With respect to pulse wave velocity, for instance, we will make abstraction of the fact that there is no such thing as a single real value of PWV; this would only be the case if the arterial system was an infinitely long straight linearly elastic tube filled with a non-viscid liquid.7
Arterial pressure wave reflections
It has long been shown that the arterial system is a fully defined system when aortic pressure and flow are available, both ideally measured simultaneously at the same location immediately distal to the aortic valve.8–11 When studying wave reflections, it is possible to decompose the measured pressure into a forward and reflected component, hereby fully characterizing the magnitude and nature of wave reflection and also allowing accurate determination of the moment of arrival of the reflected wave.12 This analysis can be done in the time domain using principles of wave intensity analysis,13 or it can be done in the so-called frequency domain applying principles of Fourier analysis and through computation of impedance.12 Both techniques have their pros and cons, but the final result – when looking at decomposed forward or backward pressure component – is virtually identical.14
The augmentation index
As it is often inconvenient – yet not impossible – to measure aortic flow in large studies, techniques have been proposed to estimate wave reflection and timing of the reflected wave from features in the measured pressure waveform alone. These features are thought to be associated with the moment where the forward and backward waves interact, as this should induce a change in the waveform profile, generating a “characteristic” or “fiducial” point on the waveform.8,15 The definition of this point is not unequivocal, as some researchers use the so-called inflection point as fiducial point,8 while others rather use the shoulder point16 (see also Fig. 1). These points can be determined using second (inflection point) and higher order derivatives (shoulder point).16 Once this point has been determined, the augmented pressure (AP) can be derived as the difference between systolic pressure (the maximum of the pressure wave) and the pressure at the fiducial point. The augmentation index (AIx) is commonly defined as the ratio of AP and pulse pressure (PP; the systolic--diastolic pressure difference) expressed as a percentage.15 When the fiducial point precedes peak systole, the reflected wave arrives in early systole and boosts systolic pressure, resulting in a positive AP and AIx. Following Murgo et al., the wave is then said to be of type A, as seen in aged subjects or in patients with hypertension.8 Different factors contribute to the early arrival such as stiffening of the large arteries, increasing the speed of the pressure waves travelling through the arterial tree and hence leading to an earlier arrival of the reflected pressure wave, or reflection points lying closer to the heart like in short people and vasoconstriction. In young subjects, the pulse wave velocity is lower and the reflected wave generally arrives in late systole/diastole so it does not increase systolic pressure (except in short people where the reflected wave may still arrive in early systole despite the lower pulse wave velocity). The fiducial point occurs after systolic pressure is reached, and in this case the “augmented pressure” is actually expressed as a negative value to make clear that the reflected wave does not increase systolic pressure. Consequently, the augmentation index is a negative number as well. Waveforms of that type are called C-type waves.8 We refer to Fig. 1 for an illustration of the fiducial points, the augmented pressure and AIx for A- and C-type waves. Note that there are also waves without clear inflection or shoulder points, and some are of an intermediate waveform type (B-type).8
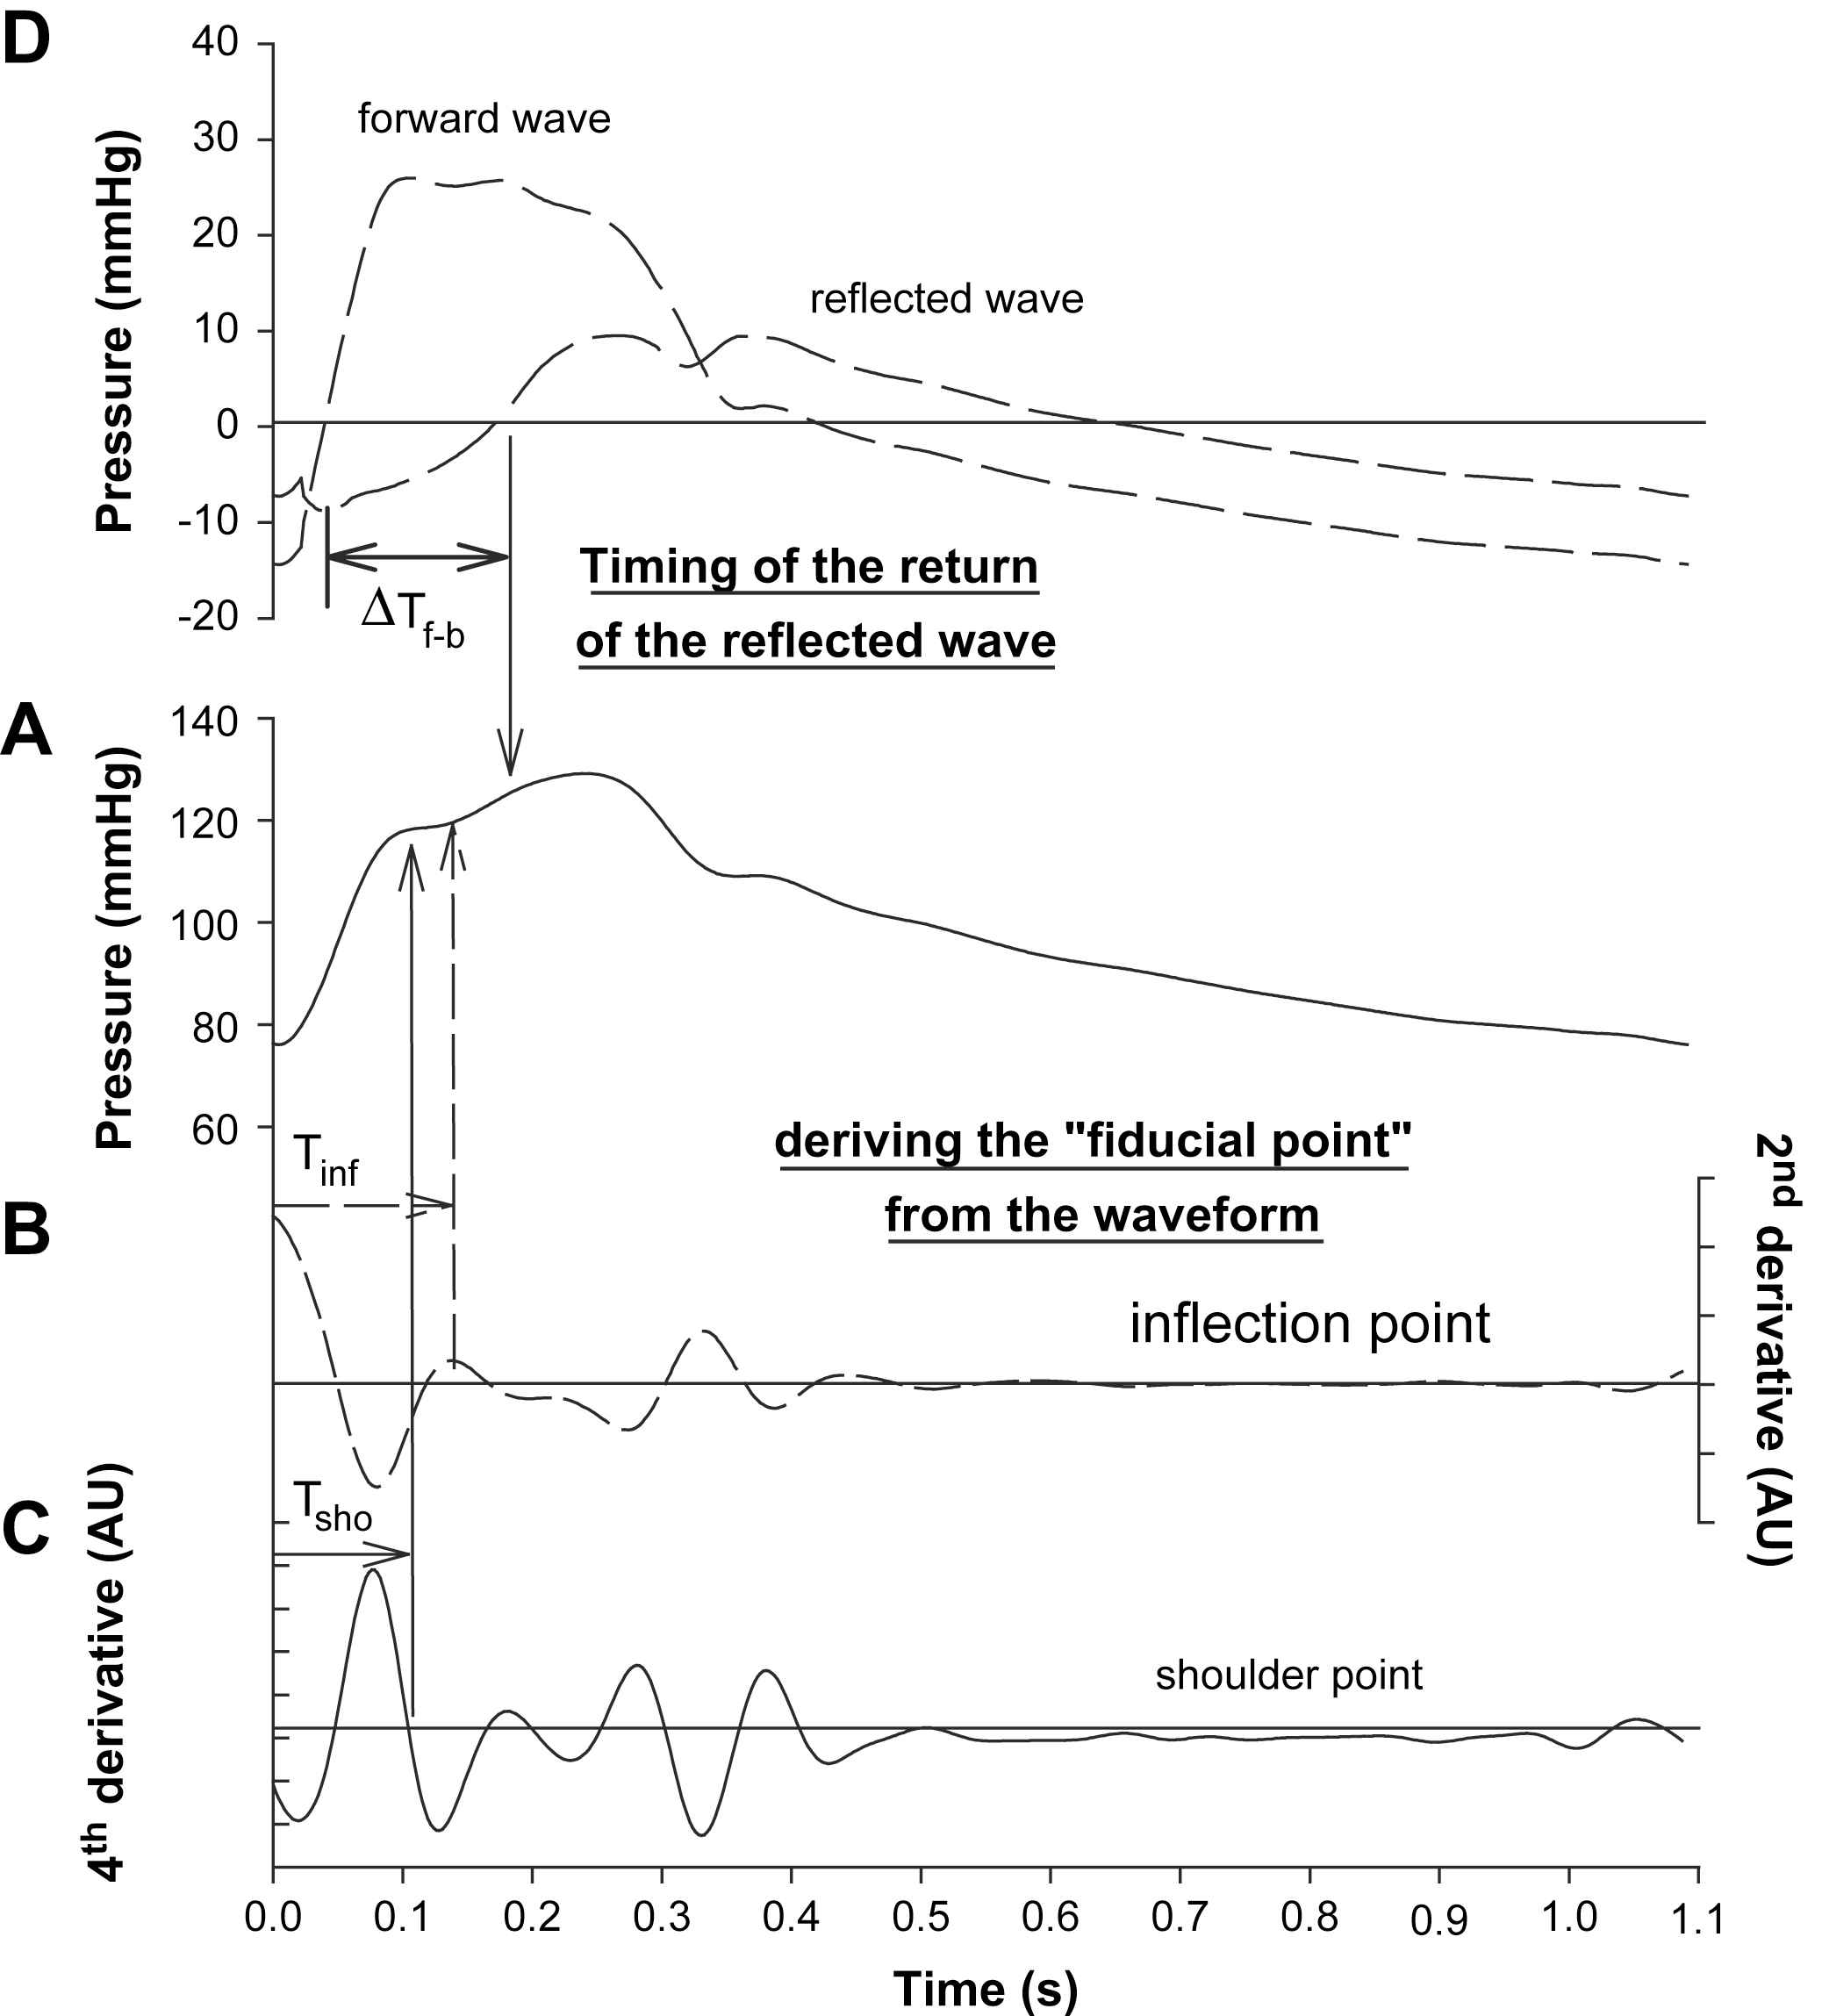
Illustration of methods to assess the time of return of the reflected pressure wave. Panel A shows the measured waveform, while panels B and C illustrate the determination of the inflection and shoulder point using second (panel B) and 4th order derivatives (panel C), respectively. In panel D, the wave was decomposed into its forward and reflected component, and the time of arrival of the reflected wave was taken as the moment where the reflected wave adds positively to the forward wave.
Although widely used as a measure of wave reflection, AIx is determined by many different factors. In addition to the magnitude of wave reflection (which expresses the ratio of the amplitude of the backward pressure wave to the magnitude of the forward one), all factors affecting the relative timing between these waveforms have an effect on AIx: the pulse wave velocity, the distance to the reflection site (and thus the height of the subjects), as well as the heart rate.17,18 A higher heart rate shortens systole, such that the reflected wave will arrive at a relatively later moment in the cardiac cycle, lowering AIx.18 As such, AIx is to be seen as a composite measure, rather than as an index of wave reflection magnitude alone. In fact, the correlation between AIx and the reflection magnitude (the ratio of the magnitudes of the backward and forward pressure) is not higher than 0.6 as we recently reported.19
The “fiducial point”: marker of the return of the reflected wave?
A crucial step in assessing AIx is the identification of the fiducial point. We have previously been able to show that neither the timing of the inflection, nor the timing of the shoulder point is actually very precise in determining when the reflected wave starts to add to the forward wave. In this study, we made use of time-aligned carotid pressure (applanation tonometry; Millar SPT-301 pen-type tonometer) and aortic flow waveforms (Doppler ultrasound measurements in the left ventricular outflow tract) measured within the framework of the Asklepios population study (including >2500 apparently healthy subjects, aged 35–55).20 The moment where the reflected wave adds to the forward wave was determined using the decomposed forward and backward waves. The vast majority of the wave profiles were of type A with an early return of the reflected wave. As one might anticipate, the shoulder point on average occurred before the inflection point, and both yielded a shorter time of arrival than the one obtained from the wave separation analysis21 (see Fig. 2). These timing parameters also show a rather weak correlation with values obtained from wave separation analysis (in the order of 0.35).21
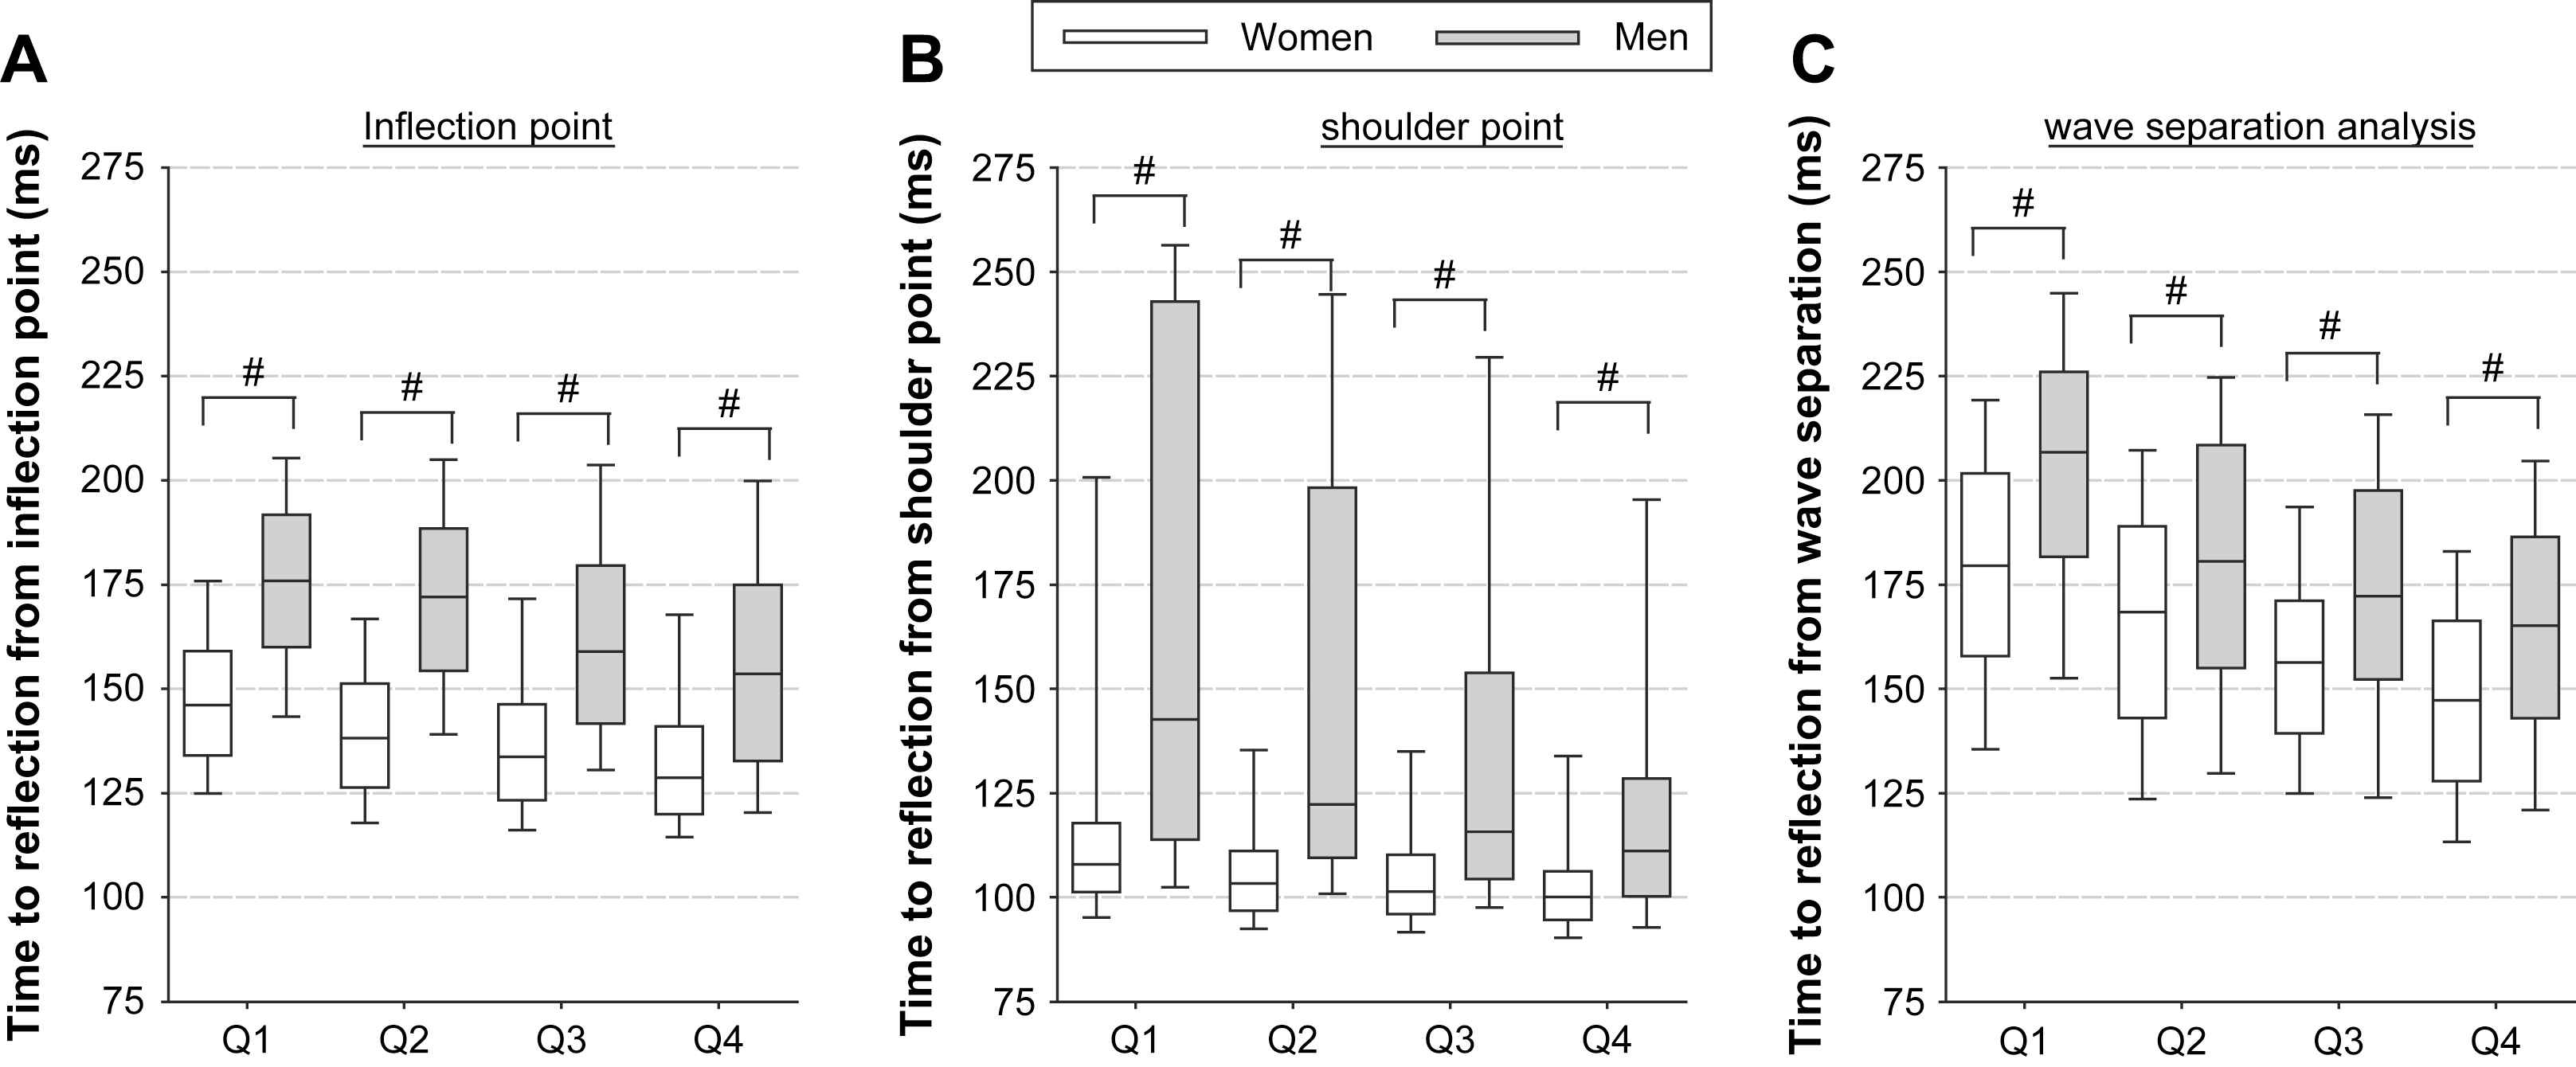
Timing of the arrival of the reflected wave determined using different methods: using the inflection point (panel A), using the shoulder point (panel B) and using the moment where the reflected wave effectively adds to the forward wave (panel C). Q1: age 35–40; Q2: age 41–45; Q3: age 46–50; Q4: age 51–56.
The inaccurate assessment of the moment of the return of the reflected wave has some consequences for the derived parameters.
- (i)
A finding which is, for instance, difficult to explain is why AIx is higher in women than in men, even after adjustment for obvious confounding factors as height and heart rate. It appears that, when the timing of the wave separation analysis is used to assess AIx, this difference in AIx values between men and women virtually disappears.
- (ii)
When the “effective length” (the average distance to the reflection sites) of the arterial tree is calculated using timing from waveform analysis, one obtains results which are not in line with the prevailing view that the reflection sites shift towards the heart with ageing. Mitchell et al. postulated that reflection sites shift away from the heart with age, hypothesizing that stiffening of the central aorta leads to a better matching of central and peripheral impedance, shifting the reflection site away from the heart.22 This is in accordance with the observation that with ageing central elastic arteries stiffen while muscular medium-sized arteries do not but increase diameter especially in women, resulting in an increase in compliance.23 However, Mitchell et al. used the inflection point to obtain the timing of the reflected wave. In our study, we also found a similar shift away from the heart when using timing based on the inflection point (however only in women). However, when using timing information from the wave separation analysis this pattern was reversed, yielding results in line with the prevailing theory.21 At present, it remains unclear whether the reported shift in reflection site away from the heart is an actual physiological observation, or rather an artefactual finding due to the poor definition of the return of the reflected wave.
It is to be acknowledged, however, that the use of carotid pressure as a surrogate for central pressure in the Asklepios population (as the carotid pressure waveform is not identical to central aortic pressure) may contribute to differences in timings derived from wave separation and pressure waveform analysis. As such, some of the findings reported above and also further below should be confirmed using central pressure and flow data.
The wave shape does not always reveal the nature of the reflection
It is important to realize that, besides its above-described potential pitfalls, AIx does not always reveal the true nature of wave reflection. We have recently studied wave reflection in an experimental and computer model of an abdominal aortic aneurysm (AAA).24 The AAA is a rather sudden expansion of the aorta in the abdomen, and might lead to a local decrease in aortic impedance and therefore in a “negative” reflection, giving rise to a reflected expansion wave, rather than the generally anticipated reflected compression waves (positive reflection). If one were to interpret aortic reflection solely based on the measured pressure waveform (Fig. 3, panel A), one would have to conclude that the strong shoulder and inflection point in early systole are the result of the early arrival of a strong positive reflection. Panel B of that same figure, however, shows the decomposed forward and backward pressure waves and reveals that the inflection point is the result of the expansion wave, lowering the pressure in early systole. Although it is anticipated that the occurrence of a reflected expansion wave is a rare phenomenon in arterial physiology, it is a perfect example to pinpoint the limitations of an analysis solely based on a pressure waveform. Accurate quantification and interpretation of wave reflection are only possible when using both the pressure and flow waveforms, ideally assessed simultaneously at the same location.12
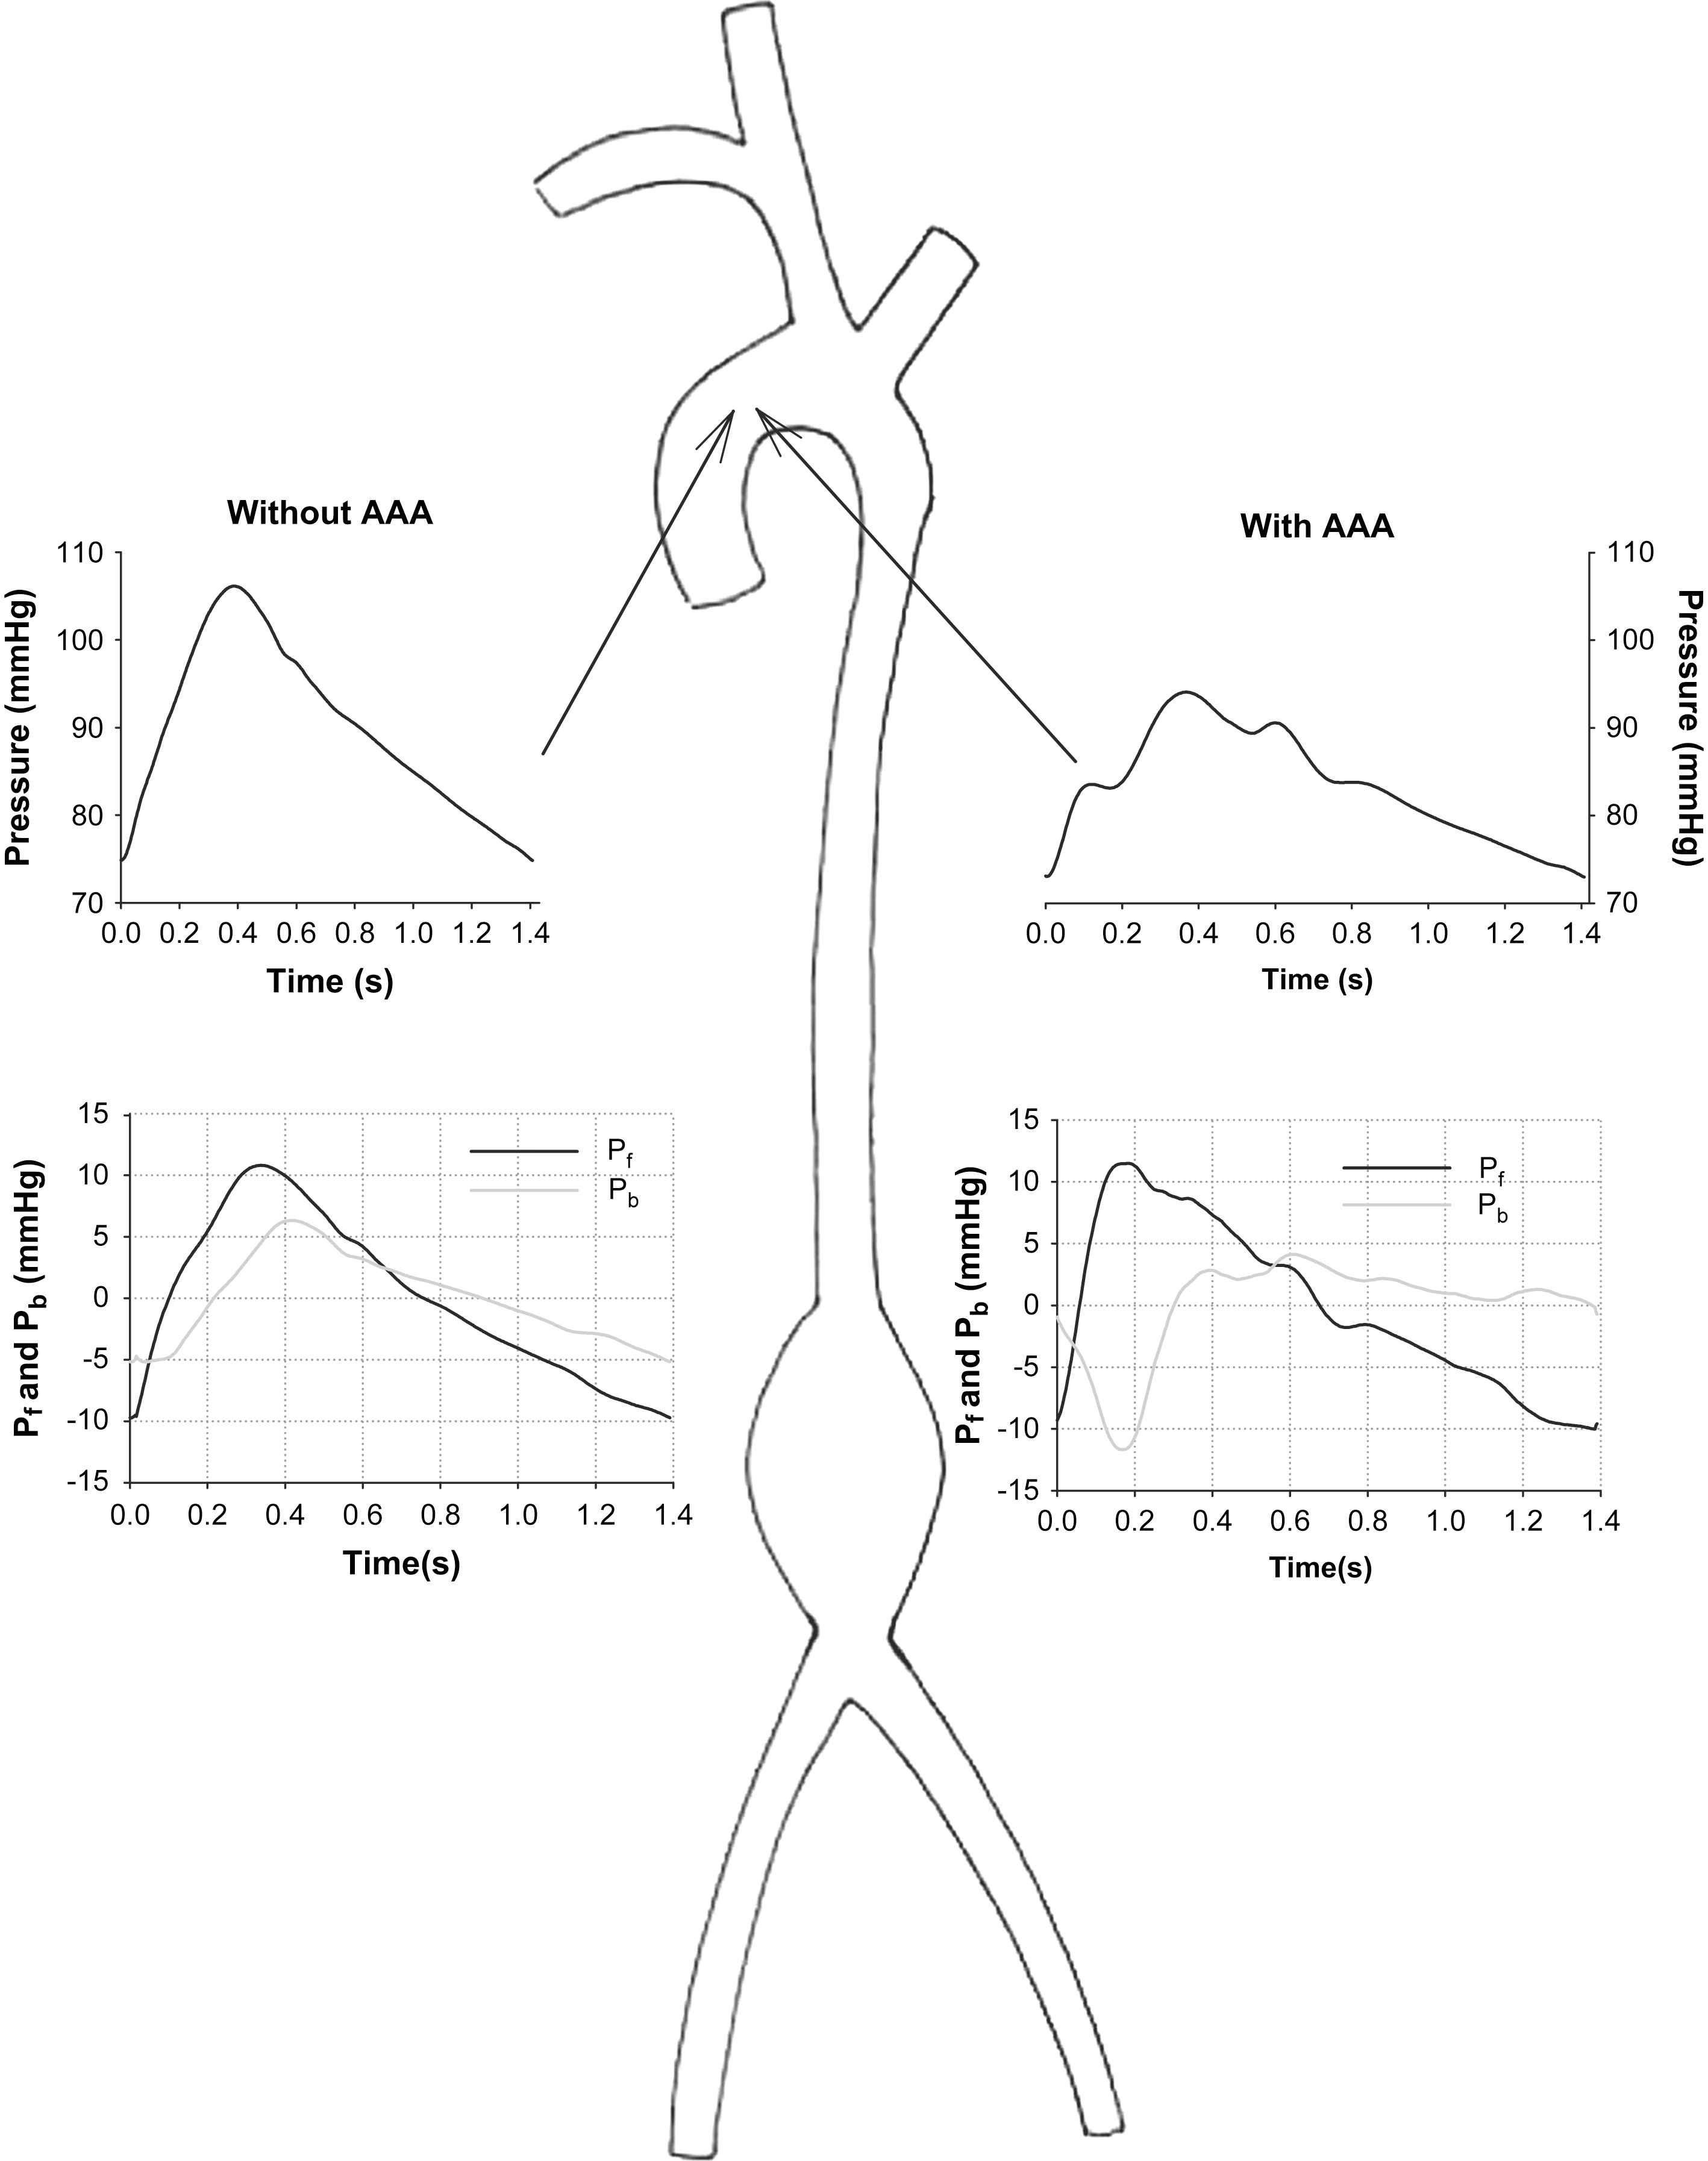
Experimentally measured aortic pressure (top panels) and wave reflection analysis (bottom panels) in a model of a healthy aorta (without AAA, left) and of an aorta with an abdominal aortic aneurysm (with AAA; right). Note that the AAA gives rise to a negative reflection, i.e., a backward expansion wave lowering blood pressure and generating an early inflection point.
Wave reflection using an approximation of the flow waveform
Recently, a method has been described that is based on the use of a simple, approximated triangular waveform for the flow.25 This flow waveform can be combined with a measured pressure waveform for decomposition into a forward and backward component and the computation of the reflection magnitude. There is no need for calibration of the flow waveform, so the method is of potential interest as it only requires measurement of pressure (assuming that the timing of the start, end and peak of the flow can adequately be derived from the pressure waveform). We have tested this method using the data available in the Asklepios database, and found rather disappointing results. The R2 value between the reflection magnitude calculated from measured (carotid) pressure and flow and on the other hand measured pressure and a triangular approximation of aortic flow was – at best – only 0.55, showing a lack of correlation between both methods and therefore suggesting a poor agreement. As in the original work of Westerhof et al.,25 the timing of the approximated flow waveform was obtained from the measured flow waveform. We therefore conclude that wave reflection can only be addressed properly from measured pressure and flow waveforms.
Pulse transit time and pulse wave velocity
With the increased attention for large artery stiffness and the obvious role of arterial stiffening in the patho-physiology of (isolated) systolic hypertension, the 2007 ESC and ESH guidelines for the management of arterial hypertension now formally recognize large artery stiffness as a factor influencing the prognosis of patients, and measurement of arterial stiffness as a useful indicator of vascular damage.26 It has been stated in a recent consensus document1,2 that of all available methods to quantify arterial stiffness or aspects of it, measurement of the carotid–femoral pulse wave velocity (PWV) is, at present, the only non-invasive comprehensive method which is simple and accurate enough to be considered as a diagnostic procedure feasible on a large scale in a clinical setting.
It is known from the Bramwell–Hill equation7 that PWV is inversely related to the square root of the distensibility (DC) of the blood vessels; the higher PWV, the stiffer the blood vessels. Similarly, the Moens–Korteweg equation (giving PWV in a thin-walled linear elastic tube) demonstrates that PWV is proportional to the square root of the Young elasticity modulus (E; the intrinsic stiffness) of the vessel, but that PWV also depends on the geometry (wall thickness, h, and diameter, D) of the vessel. In these equations, ρ is the density of the blood.
Measurement of pulse wave velocity (PWV) via direct measurement of transit time
In essence, measurement of PWV is simple and straightforward. PWV is assessed as Δx/Δt, Δx being the distance between the two measuring locations (for aortic PWV usually the carotid and femoral sites), and Δt the time delay between the “signals” being picked up at these locations, the so-called transit time. These signals are related to a mechanical perturbation/wave travelling through the arterial tree, and it should not matter which signal is being measured. As such, PWV can be assessed from measurement of local pressure (using applanation tonometry or piezo-electric sensors, flow velocity (Doppler ultrasound), diameter distension (ultrasound wall-tracking algorithms), or photoplethysmography, measuring local changes in blood volume). Any combination of measuring techniques is, in theory, valid to measure PWV as long as one uses the foot of the wave as a “fiducial” point to assess the time delay.
Measuring the time delay between waves may cause problems because of the definition of the foot of the wave, which might depend on the type of signal that is measured (e.g., the foot of an aortic flow waveform with a sharp systolic rise from zero-flow is better defined than the foot of the pressure waveform).29 Also, the delineation of the foot of the wave might be complicated by early wave reflections. In fact, the presence of these early reflections should affect the relation between the Bramwell–Hill equation and the foot-to-foot wave velocity, as the former describes the propagation speed of a wave in the absence of reflections. Nevertheless, the foot of the wave is likely to be the most appropriate fiducial point on the waveform, as it is anticipated that this point is least affected by reflected waves (it takes some time for these reflected waves to add to the forward wave). However, when measuring close to reflection sites – as in the carotid artery – the period free from reflections can be very short.30
The most important uncertainty, however, arises from the lack of knowledge of the path the wave travels. In principle, PWV measured between two points should be assessed along an unequivocal, single pathway. This is clearly not the case for carotid–femoral PWV: in a majority of advocated methods the wave is picked up at the carotid artery; at that moment, it is already travelling further down the aorta towards the femoral artery. As such, carotid–femoral PWV can only provide an estimate of the “true” (aortic) PWV. Given the fact that there is no perfect solution to the ambiguous travel path problem, there are basically two views in literature and in the arterial research field. The most pragmatic approach is to simply take the directly measured distance between the carotid and femoral measuring location, and to use this distance to calculate PWV. As the travel distance is overestimated, this approach yields relatively high values for PWV. It is important to know that the threshold value of 12 m/s in the 2007 guidelines is based on data gathered with the Complior® system, where it is advocated to use this directly measured distance,31 explaining this relatively high threshold value. A second approach is to try to correct for the fact that the wave travels simultaneously towards the carotid and femoral arteries, and to use the distance (suprasternal notch – femoral site) minus the distance (suprasternal notch – carotid site). This approach yields much lower values of PWV, more in the physiological range reported in invasive studies but it still suffers from the ambiguous pathway. Note, however, that both methods still reflect body surface measurements, and can only provide rough estimation of the exact travel path of the wave. These measurements may become unreliable in older persons or in patients with cardiovascular disease, where the tortuosity of the vessels increases and creates another source of error.
It is, within this context, worth to emphasize that magnetic resonance imaging (MRI) offers scanning sequences that allow for measurement of pulse wave velocity.17,32,33 The major advantage of this technique is that the path length can be quantified with great accuracy, although the temporal resolution with which signals (e.g. aortic flow) can be registered is still relatively low compared with other techniques.
For reasons of completeness, it can be mentioned that besides carotid–femoral pulse wave velocity, other approaches are encountered in literature such as measurements of pulse wave velocity over the carotid–radial or sternal notch to the abdominal aorta pathway. For the latter, the R-top of the ECG could be used as the reference point in time of the wave at the level of the sternum. This offers the advantage that PWV can be obtained from one single measuring location, but has the disadvantage that the time delay between the R-top and arrival at the abdomen includes the ventricular isovolumic contraction period and may be susceptible to excitation–contraction coupling disorders. These methods are not interchangeable with carotid–femoral PWV, especially when the trajectory includes peripheral vessels. This is particularly the case for radial–tibial or the brachial–ankle pulse wave velocity, where there is a large ambiguity in the “pathway”. It is not clear to what extent these measures should still be labelled as “pulse wave velocity”.
Measurement of pulse wave velocity (PWV) via indirect estimate of transit time
As stated above, the pressure (and flow) wave measured in the arterial tree can be seen as the composite of a forward running wave and a reflected, backward running wave. In theory, if (i) this reflection was to occur at a known distance (the effective length of the arterial tree,34 Leff), and (ii) the moment of return of the reflected wave could be unequivocally determined (with ΔTf–b the time delay between the forward and backward waves), PWV could be estimated as 2Leff/ΔTf–b. This principle forms the basis of two methods which have recently been described in literature, i.e., a method again based on approximating the flow waveform, and one based on pulse wave analysis at the occluded brachial artery.
Method based on approximating the flow waveform
The first method is a further extension of the principle where an approximated waveform is used for the unknown flow. As described above, the decomposition of the pressure waveform into its forward and backward components does not require a calibrated flow as long as one is only interested in relative measures such as the ratio of these components or their time delay. As such, Qasem et al. proposed a technique where the decomposition is first done using a triangular approximation of the flow wave, but where the forward and backward components are further processed and shaped assuming that (i) the forward pressure wave reaches its peak at the moment of peak flow and (ii) the backward pressure wave arrives at the moment of peak flow and plays a role only from that moment on.35 The time delay between the forward and backward waves is then obtained using cross-correlation techniques.
In addition to this approximation of the time delay, the location of the origin of the reflected wave component is also unknown. This can be derived by calibrating or tuning the method via regression models derived from population studies that include reference values of PWV (based on transit time measurement). These studies may then provide equations to estimate the effective length of the arterial tree as a function of, for instance, the age, height, … of the subject.
It is, however, clear that this procedure relies on a series of assumptions and approximations. Using our Asklepios population database once more, we tested to what extent the time delay between the decomposed components actually relates to the carotid–femoral transit time as measured using ultrasound and found rather weak correlations (R2 < 0.28; Fig. 4). This low agreement was only marginally due to the approximation of the flow waveform, as the agreement was in the same order of magnitude when applying the same principle using the measured flow waveform. Based on these findings, our conclusion is that this method is simply not accurate enough to be used as a means of estimating transit times and pulse wave velocity, and its application is to be discouraged. This issue is addressed in more detail by Kips et al.36 These findings are in line with recent work of Westerhof et al. who demonstrated in a theoretical study that methods based on the time delay between the forward and backward pressure waves should not be used to assess pulse wave velocity.37
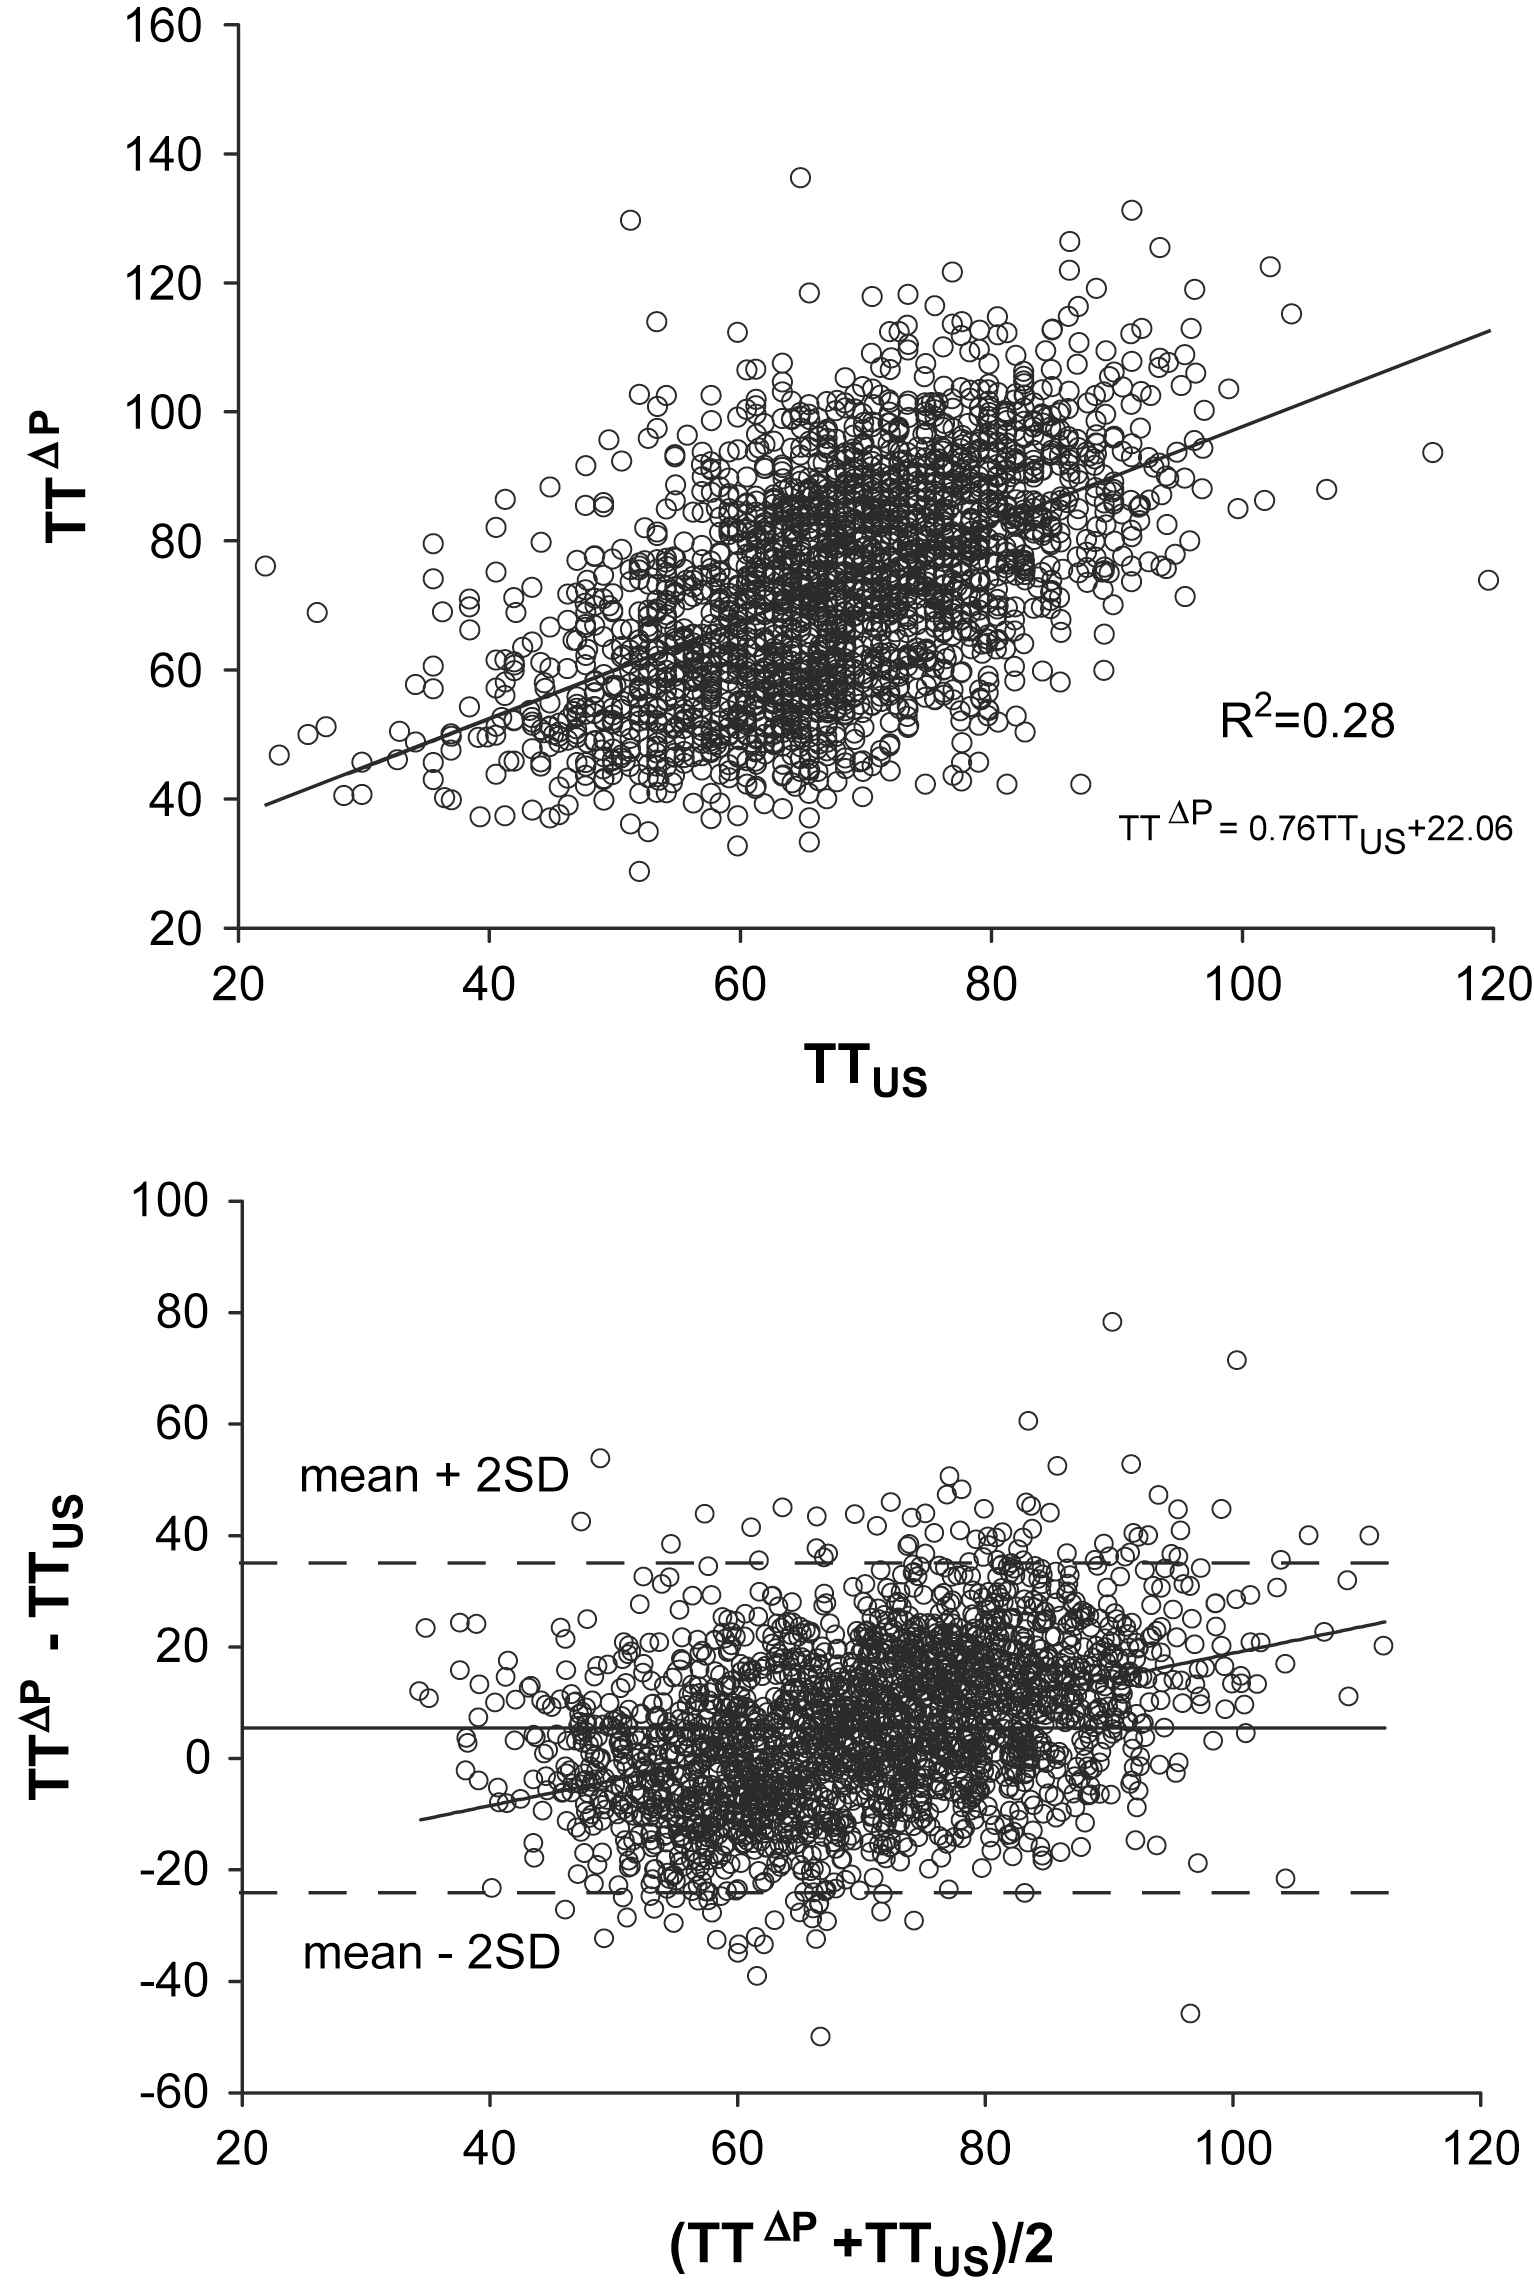
Relation between carotid–femoral transit time measured with ultrasound (TTUS) and using a method based on a triangular approximation of the flow waveform (TTΔP). Top panel: regression analysis; lower panel: Bland–Altman analysis.
Pulse wave analysis at the occluded brachial artery
This method is used in the Arteriograph®. This device is basically a simple upper arm cuff, connected to a piezo-electric sensor that picks up the pressure signals. Upon operation, the cuff is inflated to a pressure 35 mmHg over the systolic blood pressure. As such it occludes the arteries in the upper arm and the pressure in the underlying occluded artery, transmitted through the skin and the cuff to the pressure sensor, is reported to show multiple peaks (see Fig. 5). The first is the systolic peak, corresponding to the ejection of blood from the left ventricle into the aorta, while the second peak is assumed to originate from a reflection of the first pressure wave in the lower body. The time difference between the first incident wave and the reflected wave is used as the return time, i.e., the time needed for the pressure wave to travel from the aortic arch to its reflection point and back, with the iliac bifurcation assumed to be the dominant reflection point. The travelled distance corresponding to this return time is thus twice the distance from aortic arch to iliac bifurcation, which can be approximated by measuring the distance between the sternal jugulum and symphysis externally.38
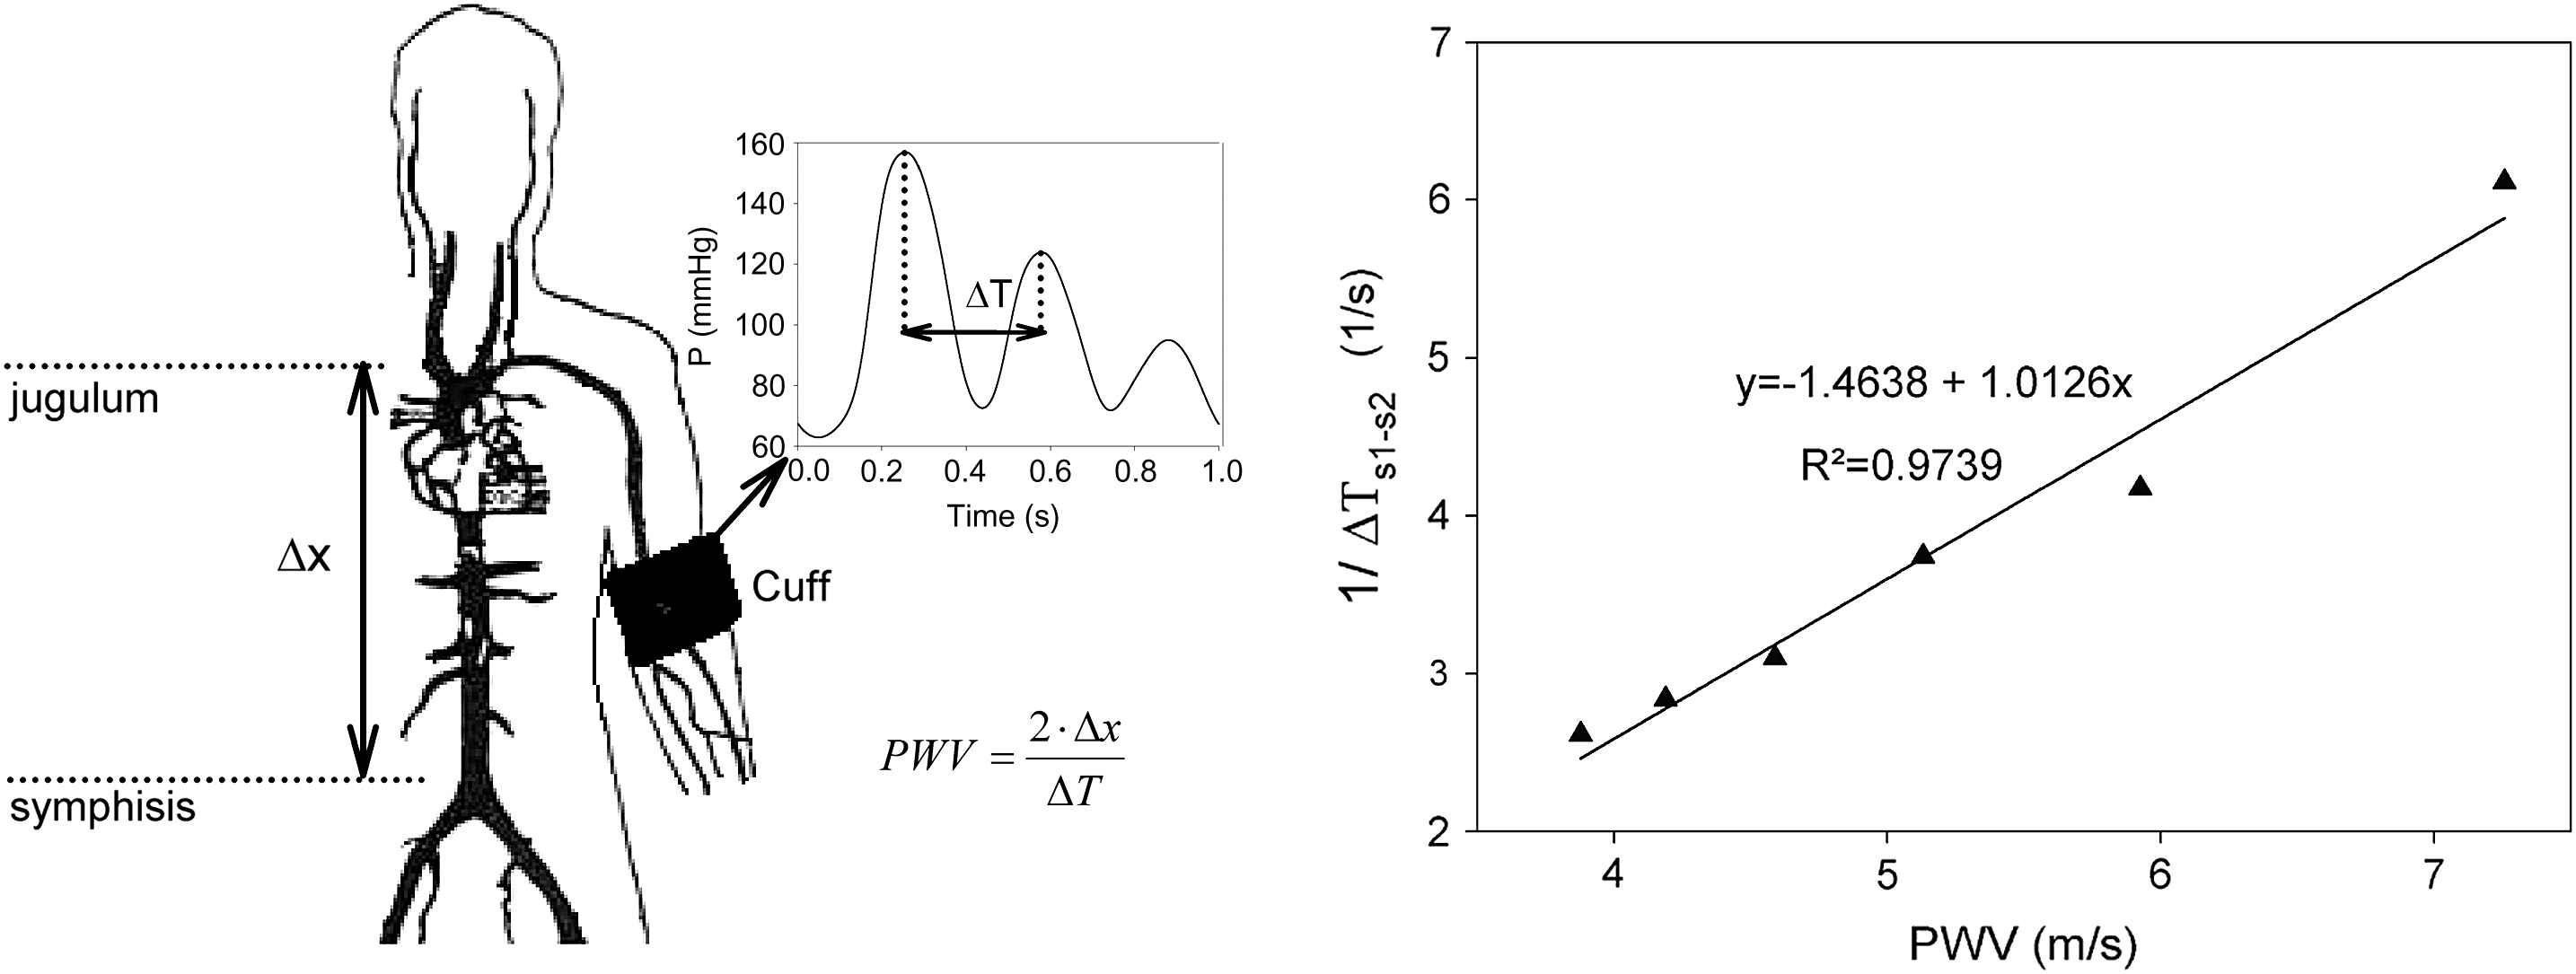
Left panel: illustration of the working principle of the Arteriograph. Right panel: computer model simulations for different values of arterial stiffness showing a linear relationship between pulse wave velocity and the inverse of the time delay between the first and second peaks.
The most appealing aspect of the method is the simplicity in use; the method only requires an upper arm cuff and can be applied in a fully automated way. The method, however, also raises some questions with respect to the origin and meaning of this second peak in the pressure wave, and the assumption of the aorto-iliac bifurcation as the single source of reflection. We recently did some preliminary analyses to test the working principle of the Arteriograph using a numerical model of the arterial tree. We simulated pressure and flow in the normal configuration, and in a configuration with an occluded brachial artery (∼supra-systolic over-inflation). Results indeed showed a pronounced second peak in the pressure signal at the location of the cuff for the occluded configuration. Wave intensity analysis showed that this peak was caused by a forward compression wave, confirming the Arteriograph hypothesis. Simulations with different stiffness values showed a linear correlation between the inverse of the time delay between the first and second peaks and PWV (R2 = 0.97). It was, however, hard to locate the reflection site which, in combination with the transit time, reproduced the correct PWV. At this stage, our data seem to support the basic working principle of the Arteriograph®, but at the same time the accuracy of the PWV measurement using the device remains challenging as it is impossible to pinpoint the exact location of the reflected wave.
Local measurement of PWV
As already mentioned above, there is a relationship between the distensibility of a blood vessel and the pulse wave velocity. As such, one can deduce a local value for PWV from a local distensibility measurement (through assessment of local pulse pressure and diameter distension).28 It has been shown that local pulse wave velocity can also be derived from simultaneous measurement of pressure and flow velocity39 or diameter and flow velocity.40 It can also be mentioned that effort is undertaken to estimate local PWV from ultra-rapid ultrasound applications, allowing the measurement of the progression of the diameter distension wave along very short segments (in the order of 2 cm) covered by the ultrasound probe.30
Conclusions
We have briefly reviewed the augmentation index and pulse wave velocity, two of the most frequently used parameters of pressure wave reflection and arterial stiffness in clinical vascular research. It is clear that the pressure waveform alone provides insufficient information to accurately quantify the magnitude of pressure wave reflection or to even fully interpret its nature. A major difficulty arises from the identification of the timing of return of the reflected pressure wave, the fiducial point, and incorrect assessment of this point has an effect on all of the derived parameters. From our studies, use of an approximated flow waveform has little or no added value. New methods have also been suggested for the assessment of aortic pulse wave velocity, relying on the concept that the pressure wave is composed of one single forward wave and one single reflected wave, originating from a single reflection site. It is to be stressed that this simple conceptual scheme is no more than a paradigm for a complex physical reality of wave transmission and continuous reflections in a complex branching network of elastic vessels. The accuracy of these methods must almost per definition be limited, and the benefit of their ease of use should be weighted against the desired accuracy and reliability. As such, measurement of arterial stiffness and wave reflections remains inexhaustible sources of further fundamental research and scientific debate. Meanwhile, as results from different methods are not simply interchangeable, methods used to assess PWV and AIx should be reported in detail, as has been advised by the consensus document.1,2
Acknowledgements
We are grateful to Pascal Verdonck, Nikos Stergiopulos and all of the Asklepios investigators for realizing the Asklepios study. We thank Ghent University (BOF project grant) and the Fund for Scientific Research – Flanders (FWO-Vlaanderen) to support the research through research grants G042703 (the Asklepios Study) and G005505.
References
Cite this article
TY  - JOUR
AU  - Patrick Segers
AU  - Jan Kips
AU  - Bram Trachet
AU  - Abigail Swillens
AU  - Sebastian Vermeersch
AU  - Dries Mahieu
AU  - Ernst Rietzschel
AU  - Marc De Buyzere
AU  - Luc Van Bortel
PY  - 2009
DA  - 2009/03/19
TI  - Limitations and pitfalls of non-invasive measurement of arterial pressure wave reflections and pulse wave velocity
JO  - Artery Research
SP  - 79
EP  - 88
VL  - 3
IS  - 2
SN  - 1876-4401
UR  - https://doi.org/10.1016/j.artres.2009.02.006
DO  - 10.1016/j.artres.2009.02.006
ID  - Segers2009
ER  -