
Assessment of pulse wave velocity
- DOI
- 10.1016/j.artres.2008.11.002How to use a DOI?
- Keywords
- Arteries; Stiffness; Physiopathology; Pulse; Arteriosclerosis
- Abstract
Measurement of pulse wave velocity is of increasing importance for assessment of arterial stiffness and risk evaluation. Different techniques are available, based either on pressure, distension or Doppler waveforms. Techniques not only differ by the algorithm used to identify specific part of the pulse signal, but also in the preferred way to measure distance between sites. The merits of each technique are described, and a brief overlook of the marketed devices to measure pulse wave velocity is given.
- Copyright
- © 2008 Association for Research into Arterial Structure and Physiology. Published by Elsevier B.V. All rights reserved.
- Open Access
- This is an open access article distributed under the CC BY-NC license.
Measurement of pulse wave velocity is the simplest way to assess arterial stiffness. Arterial stiffness is a key factor in cardiovascular physiology. It represents the ability of the arterial system to cope with the systolic ejection volume. It also implies that the compliant arterial system’s major function is to relay cardiac contraction during diastole. Indeed, cardiac contraction lasts only 1/3rd of the time. Due to the distension of the compliant large arteries during systole, after the end of cardiac contraction, the large arteries return to their initial dimension and help in blood flow.1,2 This phenomenon is of key physiological importance as diastolic flow in arteries may represent more than half of cardiac output. Large artery stiffness represents the dynamic force opposing ejection (also called impedance), if low, it helps in ejection, the higher the stiffness, the less efficient the diastolic facilitation of ejection. Many methods have been proposed to quantify this phenomenon. The simplest is to calculate the ratio between central pulse pressure and systolic ejection volume. This is easily done during cardiac catheterization, and this technique has been validated in term of cardiovascular events3; however, this is not practical in routine. The three techniques that are mostly used are (a) pulse transit time measurement, (b) analysis of the arterial pressure pulse and its wave contour, and (c) direct stiffness estimation using measurements of diameter and distending pressure.4
In this review, we will concentrate on pulse wave velocity, because it directly measures arterial stiffness and has proven its predictive value in many epidemiological studies in various geographical locations and population.5–12 These data have been summarized in the European consensus for arterial measurements,4 abridged version.13 The aim of this review is to present the different methods that are used to measure PWV, together with the clinical application and new technological developments.
Pulse wave velocity definition
PWV is a measure of regional arterial stiffness of the arterial territory between the two measurement sites. This parameter is related not only to the elastic modulus (E) of the arterial wall (which represents the intrinsic stiffness of the wall), but also to the arterial geometry (thickness: h and radius: r) and blood density (ρ). During the end of the 19th century, Moens and Korteweg formulated this relationship as: PWV2 = Eh/2rρ. Later on, Bramwell14 and Hill applied the Moens–Korteweg equation to arterial physiology and described the relationship in terms of relative change in volume (ΔV/V) and pressure (ΔP) during ex vivo experiments: PWV2 = ΔPV/ΔVρ. It is to be noticed that PWV is a direct measurement of arterial stiffness since it is the square value of 1/distensibility. In this aspect, it differentiates itself from indirect methods based on the models of circulation. The assessment of PWV involves measurement of two quantities: transit time of the arterial pulse along the analyzed arterial segment and distance on the skin between both recording sites (Fig. 1).
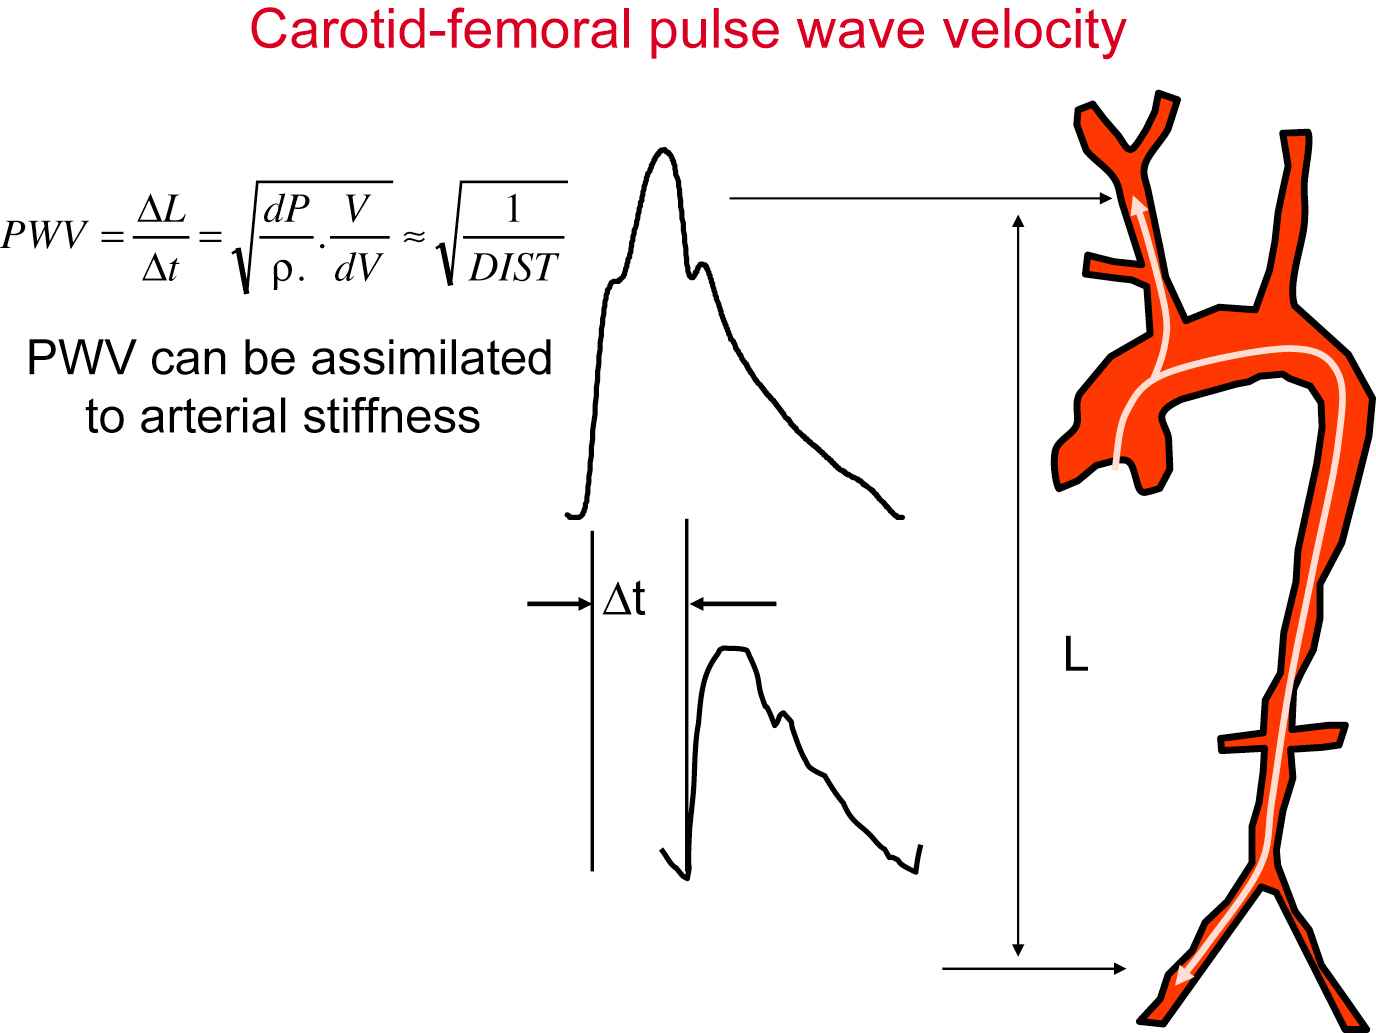
Measurement of carotid to femoral pulse wave velocity.
Measurement of pulse transit time
Many different pulse waves have been used to assess pulse wave velocity, such as pressure waves, distension waves or flow waves. Although these waves are different in nature, they are theoretically in phase at the early phase of cardiac cycle, and therefore could be used alternatively, whatsoever. The most often used signal is pressure wave, although this choice may not be the best as it implies the application of a pressure transducer on the artery of interest, and inadequate application may result in distorted waves. Non-contact techniques such as echotracking or Doppler may yield better results, with either high definition distension waves (at the cost of expensive equipment) or sharp systolic upstrokes for Doppler (at the cost of some imprecision in the exact location of measurement). The transit time is usually measured between two different sites. Multiple methods to measure local PWV have been explored, including wave intensity analysis,13 the flow/area (Q/A) method,15 and the gradient method,16 the latter being the basis for the new development described below. More recently, some authors proposed that the time delay between the incident and reflected waves could be used17,18; however, the promoters of the technique cooled down somewhat about whether this could be done or not.19 The same applies to the techniques derived from pulse wave analysis.
Algorithm for identification of the foot of the wave
A crucial point is the reference part of the curve, for which the time delay is calculated. The fact that arterial stiffness increases non-linearly with blood pressure implies that PWV is not identical at each time of the cardiac cycle. Moreover, because of the pressure wave reflection, the shape of the pressure wave corresponds to the addition of the wave generated by the heart and the wave reflected on the periphery. According to the site of measurement, the amplitude and timing of reflected wave differ and change the shape of the wave. This means that humps and bumps seen at one site do not systematically correspond to the ones seen on other sites.20,21 An implicit consensus is to use the systolic upstroke as the reference point. Although this point seems to be well-defined, enlargements of foot of the wave exhibit a very mild transition from diastole to systole, and the frequency content of the wave shows the existence of large amounts of early wave reflections, especially at the carotid site.22 Therefore, identification of the foot of the wave has to rely on algorithms. The three algorithms that are used are intersecting tangents, maximum upstroke of the first derivative zero crossing the second derivative and 10% of the pulse pressure (Fig. 2). They have been compared by Millasseau,21 who showed that the intersecting tangent method was the most reliable, although the other two methods were also consistent and not influenced by heart rate.
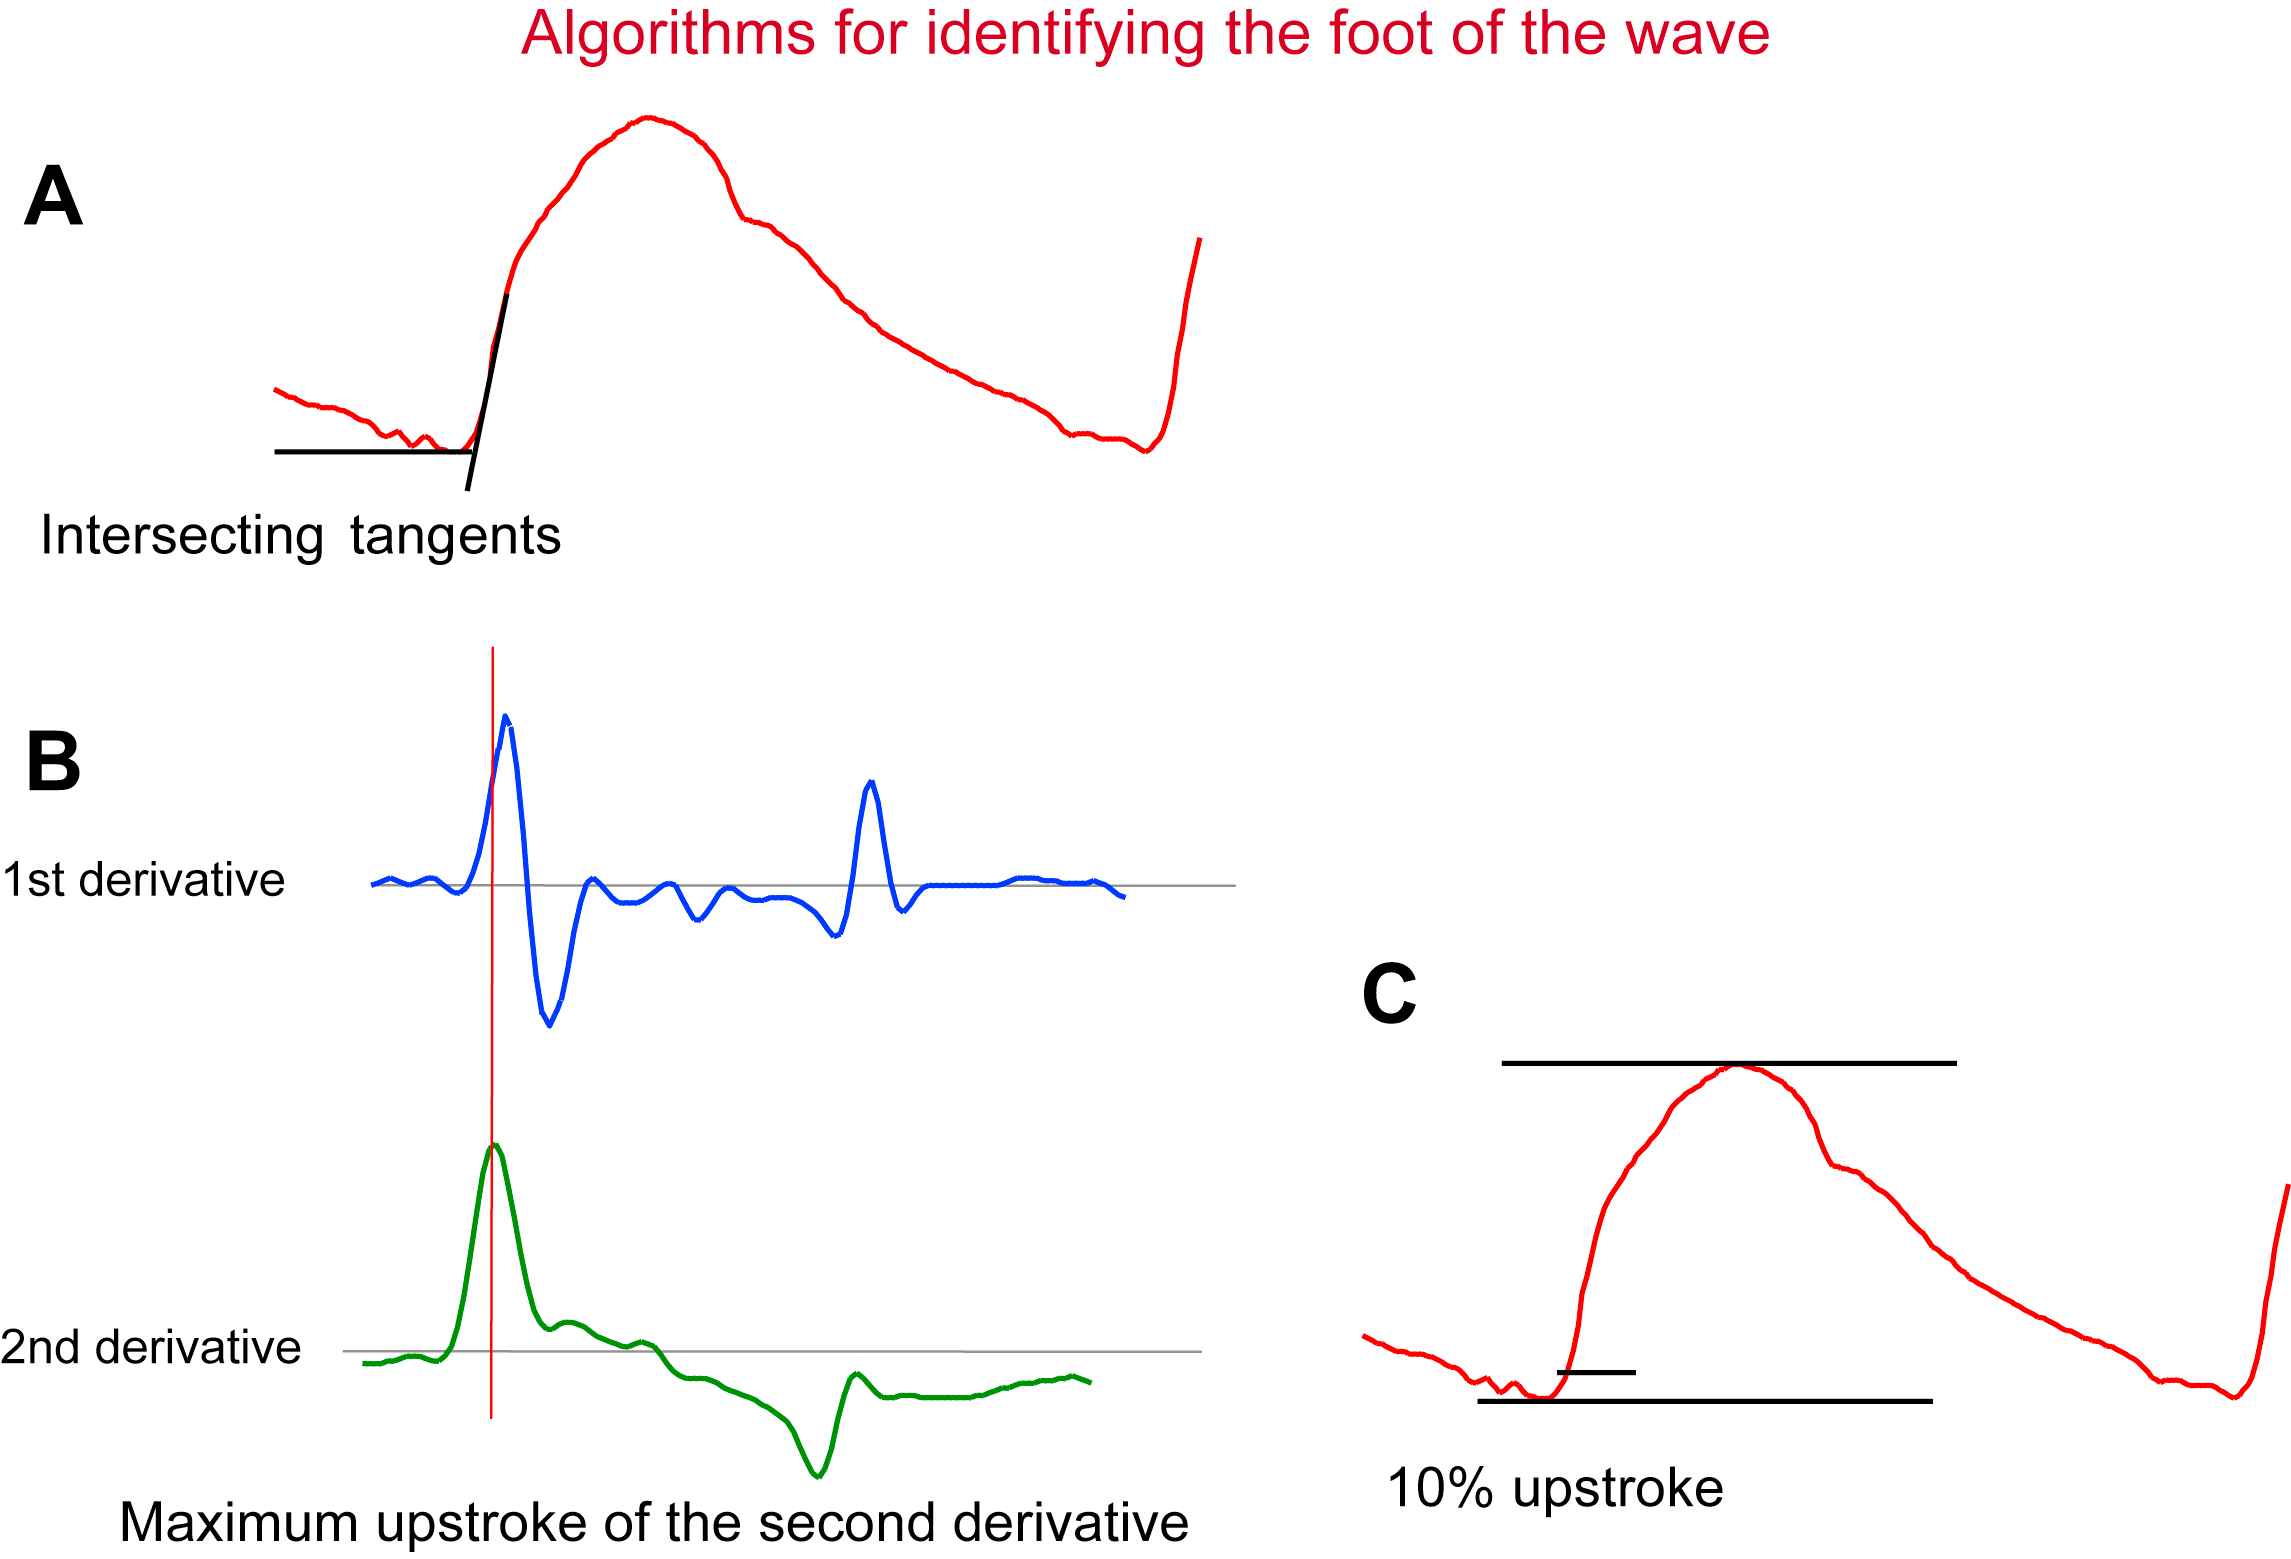
Different algorithms used to identify specific part of the pulse signal (here distension waveform of the carotid artery). Panel A: intersecting tangents; Panel B: maximum upstroke of the second derivative; Panel C: percentage of the full amplitude of the cycle.
Recent attempts at measuring PWV on short arterial segments using distension waveforms from high definition echotracking techniques have been made following the pioneer work of Brands.16 Waveforms were precise enough to measure transit time on a 2-cm segment of the common carotid artery,23,24 but early wave reflection hinders the identification of the foot of the wave,22 and further work is to be performed to identify stable points on distension wave.
Sites and distance measurement
Pulse wave velocity could be measured on any vessel. The theory underlying the relationship between PWV and stiffness implies an homogeneous, isotropic material, with no curvature, which is obviously not the case for arteries. The preferred site for the proximal measurement is the common carotid artery, and the femoral artery for the distal site. The problem arises when arterial pulse moves in opposite ways. This is not a major problem as long as the stiffness of the common carotid artery (and the brachiocephalic trunk) is identical to that of the thoracic aorta, which is close in reality. It is a problem also for pathway measurement. Different ways to measure distance are represented in Fig. 3. The simplest way to measure pathway is to measure transcutaneously using a tape meter or a caliper. If the measurement is made between the two measurement sites, it leads to a systematic overestimation of PWV by an amount close to 30%. It is possible to correct this by subtracting the distance between the carotid site and the sternal notch from the overall distance. This method provides values closer to invasive measurements, but is more complicated, and is a source of errors. Moreover, the direct (carotid to femoral) distance was used in nearly all epidemiological studies.4 A European project conducted by a consortium of expert centers will provide reference values for arterial stiffness, together with conversion factors for converting measures obtained with one method to the other.25 The measurement of aortic pulse wave velocity using Doppler probes positioned at the suprasternal notch and close to the umbilicus bypasses such difficulties,7,26 because it measures a more homogeneous vessel with no bifurcation. This advantage is tempered by more imprecision on the precise site of flow signal acquisition.
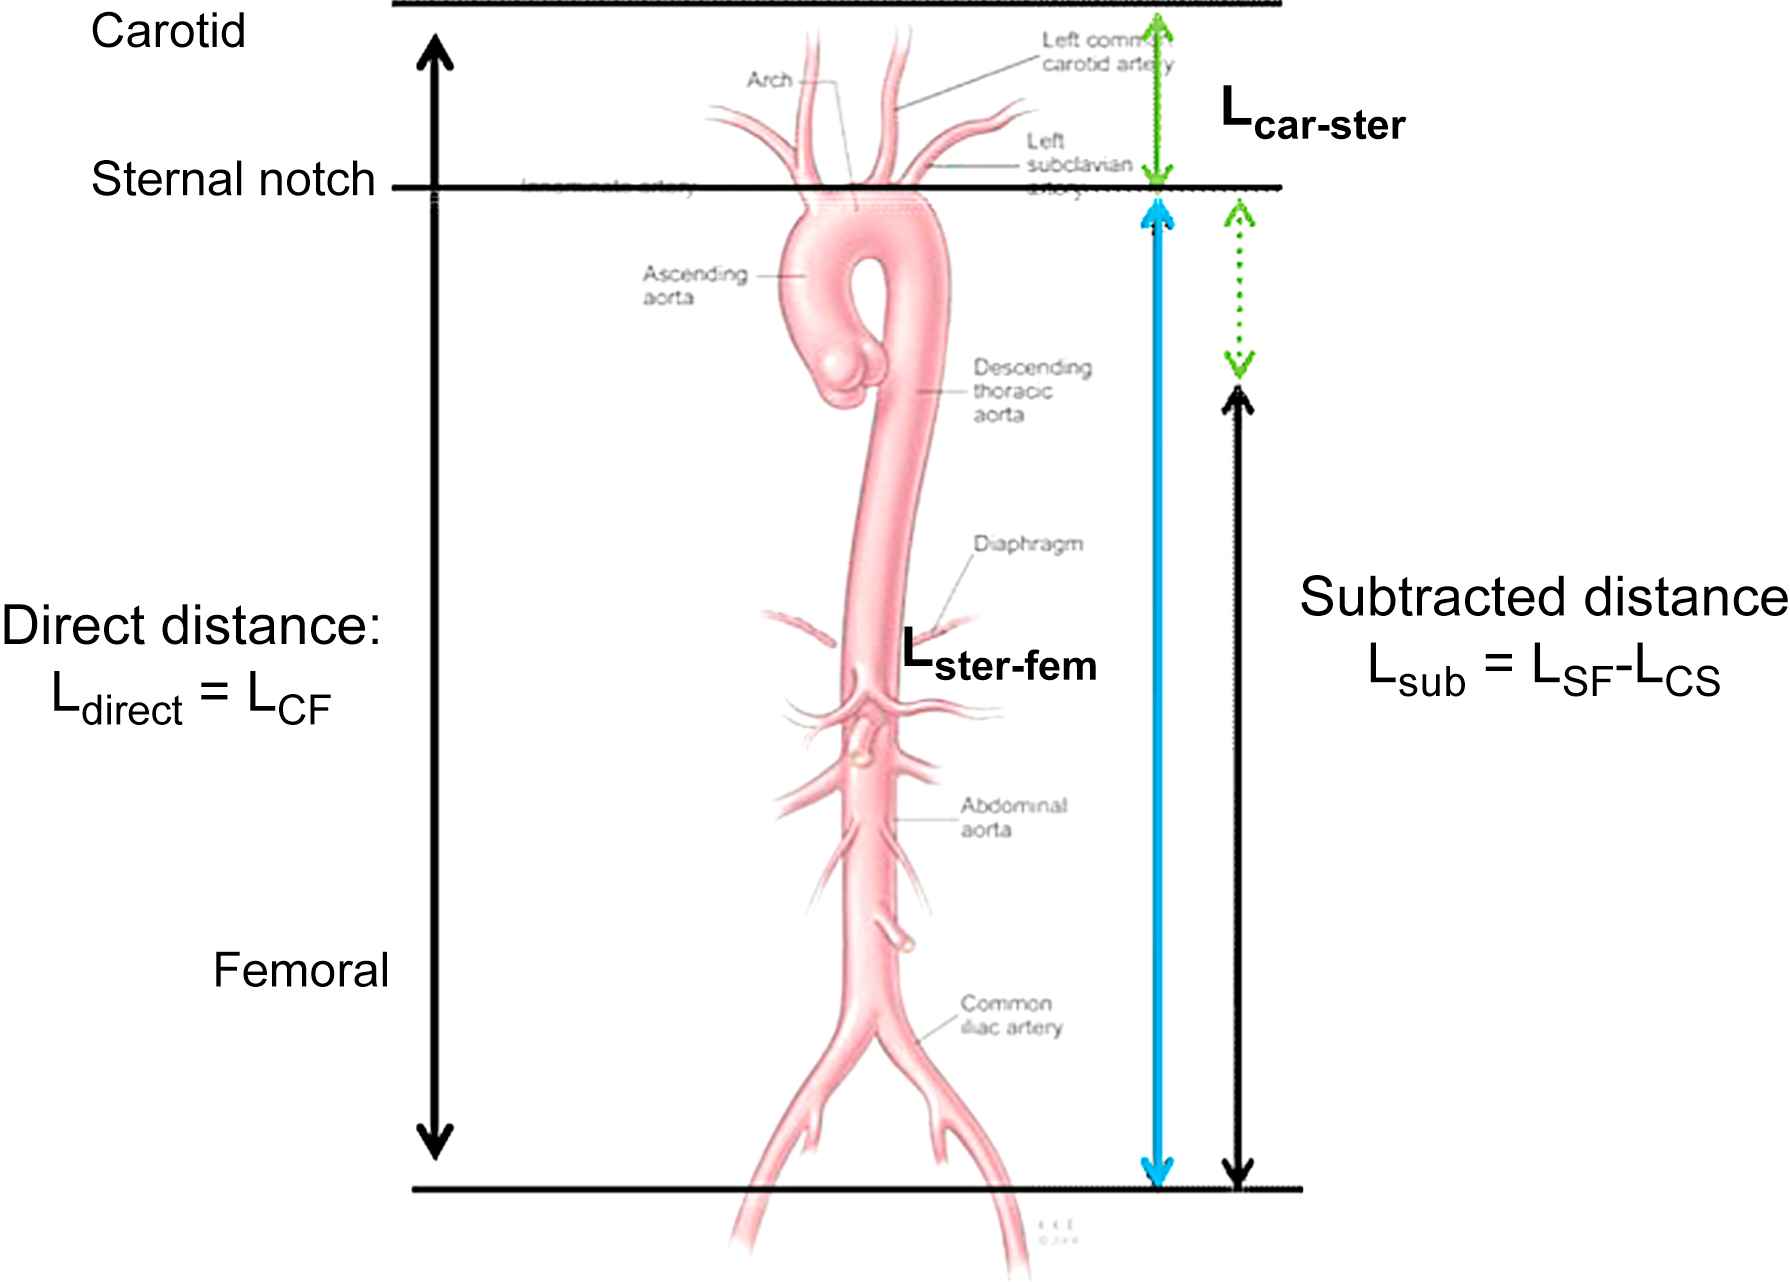
Different ways to measure path length.
Relative value of different pulse wave velocity
Carotid to femoral PWV is the most widely used index of arterial stiffness, and has demonstrated its predictive value, independent and above classical risk factors in more than 11 longitudinal follow-up studies, performed at different geographical locations, and including various types of population.4 Pulse wave velocity also predicts cognitive decline27–29 and further increase in systolic pressure.30 Measurement of PWV is possible on other segments such as carotid–radial, brachial–radial, or femoral–tibial. There is currently no evidence of a predictive value of more peripheral measures of PWV.31 Neither is there any epidemiological evidence for approached techniques such as ankle–brachial pulse wave velocity, or single point PWV measurements.
Conditions to perform pulse wave velocity measurements
The guidelines for measuring pulse wave velocity are the same as for any other physiological measurement. The subject must rest in supine position for at least 5–10 min to reach the physiological baseline conditions, the room must be maintained at a standardized temperature (ideally temperature-controlled), and the blood pressure must be accurately measured within minutes from the PWV recording time in order to better interpret PWV measurements. Indeed the PWV depends on the distending pressure within the arterial tree (the systolic or mean blood pressure) and this level has to be taken into account to check the baseline condition of each subject and each recording. Ideally, when serial longitudinal measurements are performed, the time of measurement must be identical at each period, measures should be done in fasting condition, avoiding coffee or any exciting beverage or tobacco use before.32 In ideal conditions, the reproducibility of PWV measurements appears good (CV in the range of 8–12%).26,33,34
Available devices
It should be noted that the measurement of carotid to femoral pulse wave velocity was possible using dedicated customized systems. At first, measurements could be performed by using pressure or flow tracings, obtained at two sites, and by deriving pulse wave velocity from high-speed paper tracings using the intersecting tangent method,35,36 this method is still being used.12 Customized methods have been used in a number of clinical and population studies (for example, see Refs. 8, 28, 30).
Different devices are commercially available and largely used worldwide. Four devices are leading the market. The first to be marketed is the Complior System® (Artech, Les Lilas, France), which allows to simultaneously record both the arterial wave pulses through mechanotransducer probes. Second in term of ancientness is based on Doppler measurements at the base of the neck and on aortic termination,26 it is mainly used in the United Kingdom. At least one large epidemiological study is available with this measurement.7 The third device is the SphygmoCor® system (ArtCor, Sydney, Australia)34 that has been used in large clinical trials and population survey (ACCT, Café). This device uses a large band piezoelectric probe and allows the arterial pulse recording in succession (carotid then femoral), both signals being synchronized with the same time basis (ECG R wave) which impose to accurately check that the heart rates are quite similar at the moment of each recording to avoid any disturbance due to PWV relationship to heart rate. This system also allows assessment of the central aortic pulse wave analysis through a genuine validated transfer function. The most recent device is the PulsePen® device (Diatecne, Milano, Italy)37–39 which uses the successive recordings of both arterial pulse wave with the ECG as a time basis. This device also allows a carotid artery pulse wave analysis (proxy for aortic pressure), directly measured without the need for a transfer function. The characteristics of the probe are less effective than for the SphygmoCor system, but enough for transit time assessment.
Related devices
Although the measurements provided by the following techniques are correlated with gold standard techniques, they remain proxies for the most direct measures of arterial stiffness.
A Japanese device (Omron, Japan) based on the brachial–ankle pulse wave velocity (baPWV) with numerous physiological assumptions; one of them being that the aortic PWV is the primary independent correlate of baPWV, before the leg PWV.40 It is based on oscillations in cuff placed on the brachial artery and calf, the time delay between both signals is given. This approach is hampered by uncertainties about path length, it includes highly heterogeneous territories such as the aorta, lower limb circulation and upper limb circulation. The major problem being the fact that pulse travels simultaneously and in the same direction in the arm and in the thoraco-abdominal aorta, thus the most informative part of vasculature is wiped out of analysis. Despite its introduction nearly 10 years ago, and numerous studies, we still wait for epidemiological proof of predictive value with this technique.
The QKD concept was developed to assess the ambulatory regional transit time from the heart to the arm using a particular ambulatory blood pressure measurement device (Diasys®, Novacor, Rueil Malmaison, France).41 This technique is interesting since it simultaneously measures blood pressure, ECG and arterial stiffness in ambulatory conditions, however, the QKD value needs to be corrected for heart rate. This technique has demonstrated its predictive value in epidemiological and prognosis studies, its use in pharmacological trials seems at its beginning.42
Recently, a new device (Arteriograph43) was introduced. This is based on the enhancement of the reflected wave signal on oscillometric tracings, during suprasystolic cuff occlusion. Based on assumptions about wave travel path length, it is possible to derive pulse wave velocity from single spot cuff measurements. Reported correlations with gold standard techniques are in an interesting range, but with R2 values showing that this measure is only a surrogate for the “true” pulse wave velocity (R2 = 0.45–0.47).
Many other techniques, making use of different ingeniously developed concepts are currently pending for validation and testing in epidemiological studies. One word of general caution is necessary. Many techniques are said to measure arterial stiffness because they correlate with gold standard, direct measurements. This is not sufficient to assert equivalence. Impartial assessment of the value of devices to truly measure arterial stiffness is indispensable in the future.
Conclusion
Arterial stiffness measurements are permitted by numerous methods and devices but they differ largely according to their physical basis, simplicity to use and nature of the measured parameter. A gold standard method would require (1) to directly measure the parameter, without any intermediate model, (2) to provide a faithful image of the physiological condition of the patient and an independent predictive value for events, (3) to be easily performed in routine, (4) to be accepted by numerous research groups worldwide, and be based on a large range of patients providing reference values.
As noticed by the European Expert Consensus on Arterial Stiffness, the “gold standard” method is carotid to femoral pulse wave velocity arteries or over segmental aorta. In order to implement widely the measurement of carotid to femoral pulse wave velocity in clinical practice, we still wait for reference value and general agreement on how to measure the distance. A lot of work remains to be done for demonstrating that patient care including PWV measurement provides better protection for the patient than standard care, even if there is one positive study.
References
Cite this article
TY  - JOUR
AU  - Pierre Boutouyrie
AU  - Marie Briet
AU  - Cédric Collin
AU  - Sebastian Vermeersch
AU  - Bruno Pannier
PY  - 2008
DA  - 2008/12/06
TI  - Assessment of pulse wave velocity
JO  - Artery Research
SP  - 3
EP  - 8
VL  - 3
IS  - 1
SN  - 1876-4401
UR  - https://doi.org/10.1016/j.artres.2008.11.002
DO  - 10.1016/j.artres.2008.11.002
ID  - Boutouyrie2008
ER  -