
Performance assessment of pulse wave imaging using conventional ultrasound in canine aortas ex vivo and normal human arteries in vivo
- DOI
- 10.1016/j.artres.2015.06.001How to use a DOI?
- Keywords
- Abdominal aorta; Arterial stiffness; Carotid artery; Pulse wave; Pulse wave velocity (PWV); Pulse wave imaging (PWI); Speckle tracking; Ultrasound
- Abstract
The propagation behavior of the arterial pulse wave may provide valuable diagnostic information for cardiovascular pathology. pulse wave imaging (PWI) is a noninvasive, ultrasound imaging-based technique capable of mapping multiple wall motion waveforms along a short arterial segment over a single cardiac cycle, allowing for the regional pulse wave velocity (PWV) and propagation uniformity to be evaluated. The purpose of this study was to improve the clinical utility of PWI using a conventional ultrasound system. The tradeoff between PWI spatial and temporal resolution was evaluated using an ex vivo canine aorta (n = 2) setup to assess the effects of varying image acquisition and signal processing parameters on the measurement of the PWV and the pulse wave propagation uniformity r2. PWI was also performed on the carotid arteries and abdominal aortas of 10 healthy volunteers (24.8 ± 3.3 y.o.) to determine the waveform tracking feature that would yield the most precise PWV measurements and highest r2 values in vivo. The ex vivo results indicated that the highest precision for measuring PWVs ~2.5–3.5 m/s was achieved using 24–48 scan lines within a 38 mm image plane width (i.e. 0.63–1.26 lines/mm). The in vivo results indicated that tracking the 50% upstroke of the waveform would consistently yield the most precise PWV measurements and minimize the error in the propagation uniformity measurement. Such findings may help establish the optimal image acquisition and signal processing parameters that may improve the reliability of PWI as a clinical measurement tool.
- Copyright
- © 2015 Association for Research into Arterial Structure and Physiology. Published by Elsevier B.V. All rights reserved.
- Open Access
- This is an open access article distributed under the CC BY-NC license.
Introduction
The arterial pulse wave refers to the pressure and flow velocity waves generated by each contraction of the left ventricle that propagate throughout the arterial tree and induce displacements in the vascular walls, giving rise to the natural pulsation of the arteries.1,2 One of the most robust and widely used parameters for characterizing arterial mechanical properties is the pulse wave velocity (PWV),3–5 which is directly and quantitatively related to the Young’s modulus of the artery by the well-known Moens–Korteweg equation.6,7 Thus, the PWV may serve as a surrogate index of arterial stiffness, which has been shown to be directly correlated with cardiovascular risk by numerous clinical longitudinal studies.8–11
Pulse ave imaging (PWI) is a noninvasive ultrasound-based technique12–16 to visualize and map the estimated pulse wave-induced arterial wall displacements in 2D+ time, allowing for assessment of the regional PWV (i.e. across the imaged segment). The advantage of PWI over other image-guided methods for regional PWV measurement17–21 is that multiple waveforms (i.e. equal to the number of scan lines used) can be acquired along an imaged segment over the same cardiac cycle at high frame rates (up to ~500 fps in vivo13,15), providing numerous spatial and temporal samples for local PWV measurement.
A block diagram describing the PWI method in a normal human aorta is shown in Fig. 1. The PWV is estimated as the slope of the linear regression line fitted to the spatio-temporal variation of a characteristic waveform feature (e.g. the 50% upstroke), which also allows the pulse wave propagation uniformity to be assessed as the coefficient of determination r2. A high r2 indicates the presence of a dominant PWV equal to the slope of the regression line, suggesting relatively uniform stiffness across the segment. A low r2 implies that the PWV may be changing throughout the imaged segment due to non-uniform arterial mechanical properties and/or wave reflections. Variance and inconsistency of the PWV and r2 measurements obtained by PWI may arise due to several imaging and signal processing parameters. In order for PWI to be considered as a reliable measurement tool, the effects of these parameters must be assessed in order to improve the precision and accuracy of the measurements.
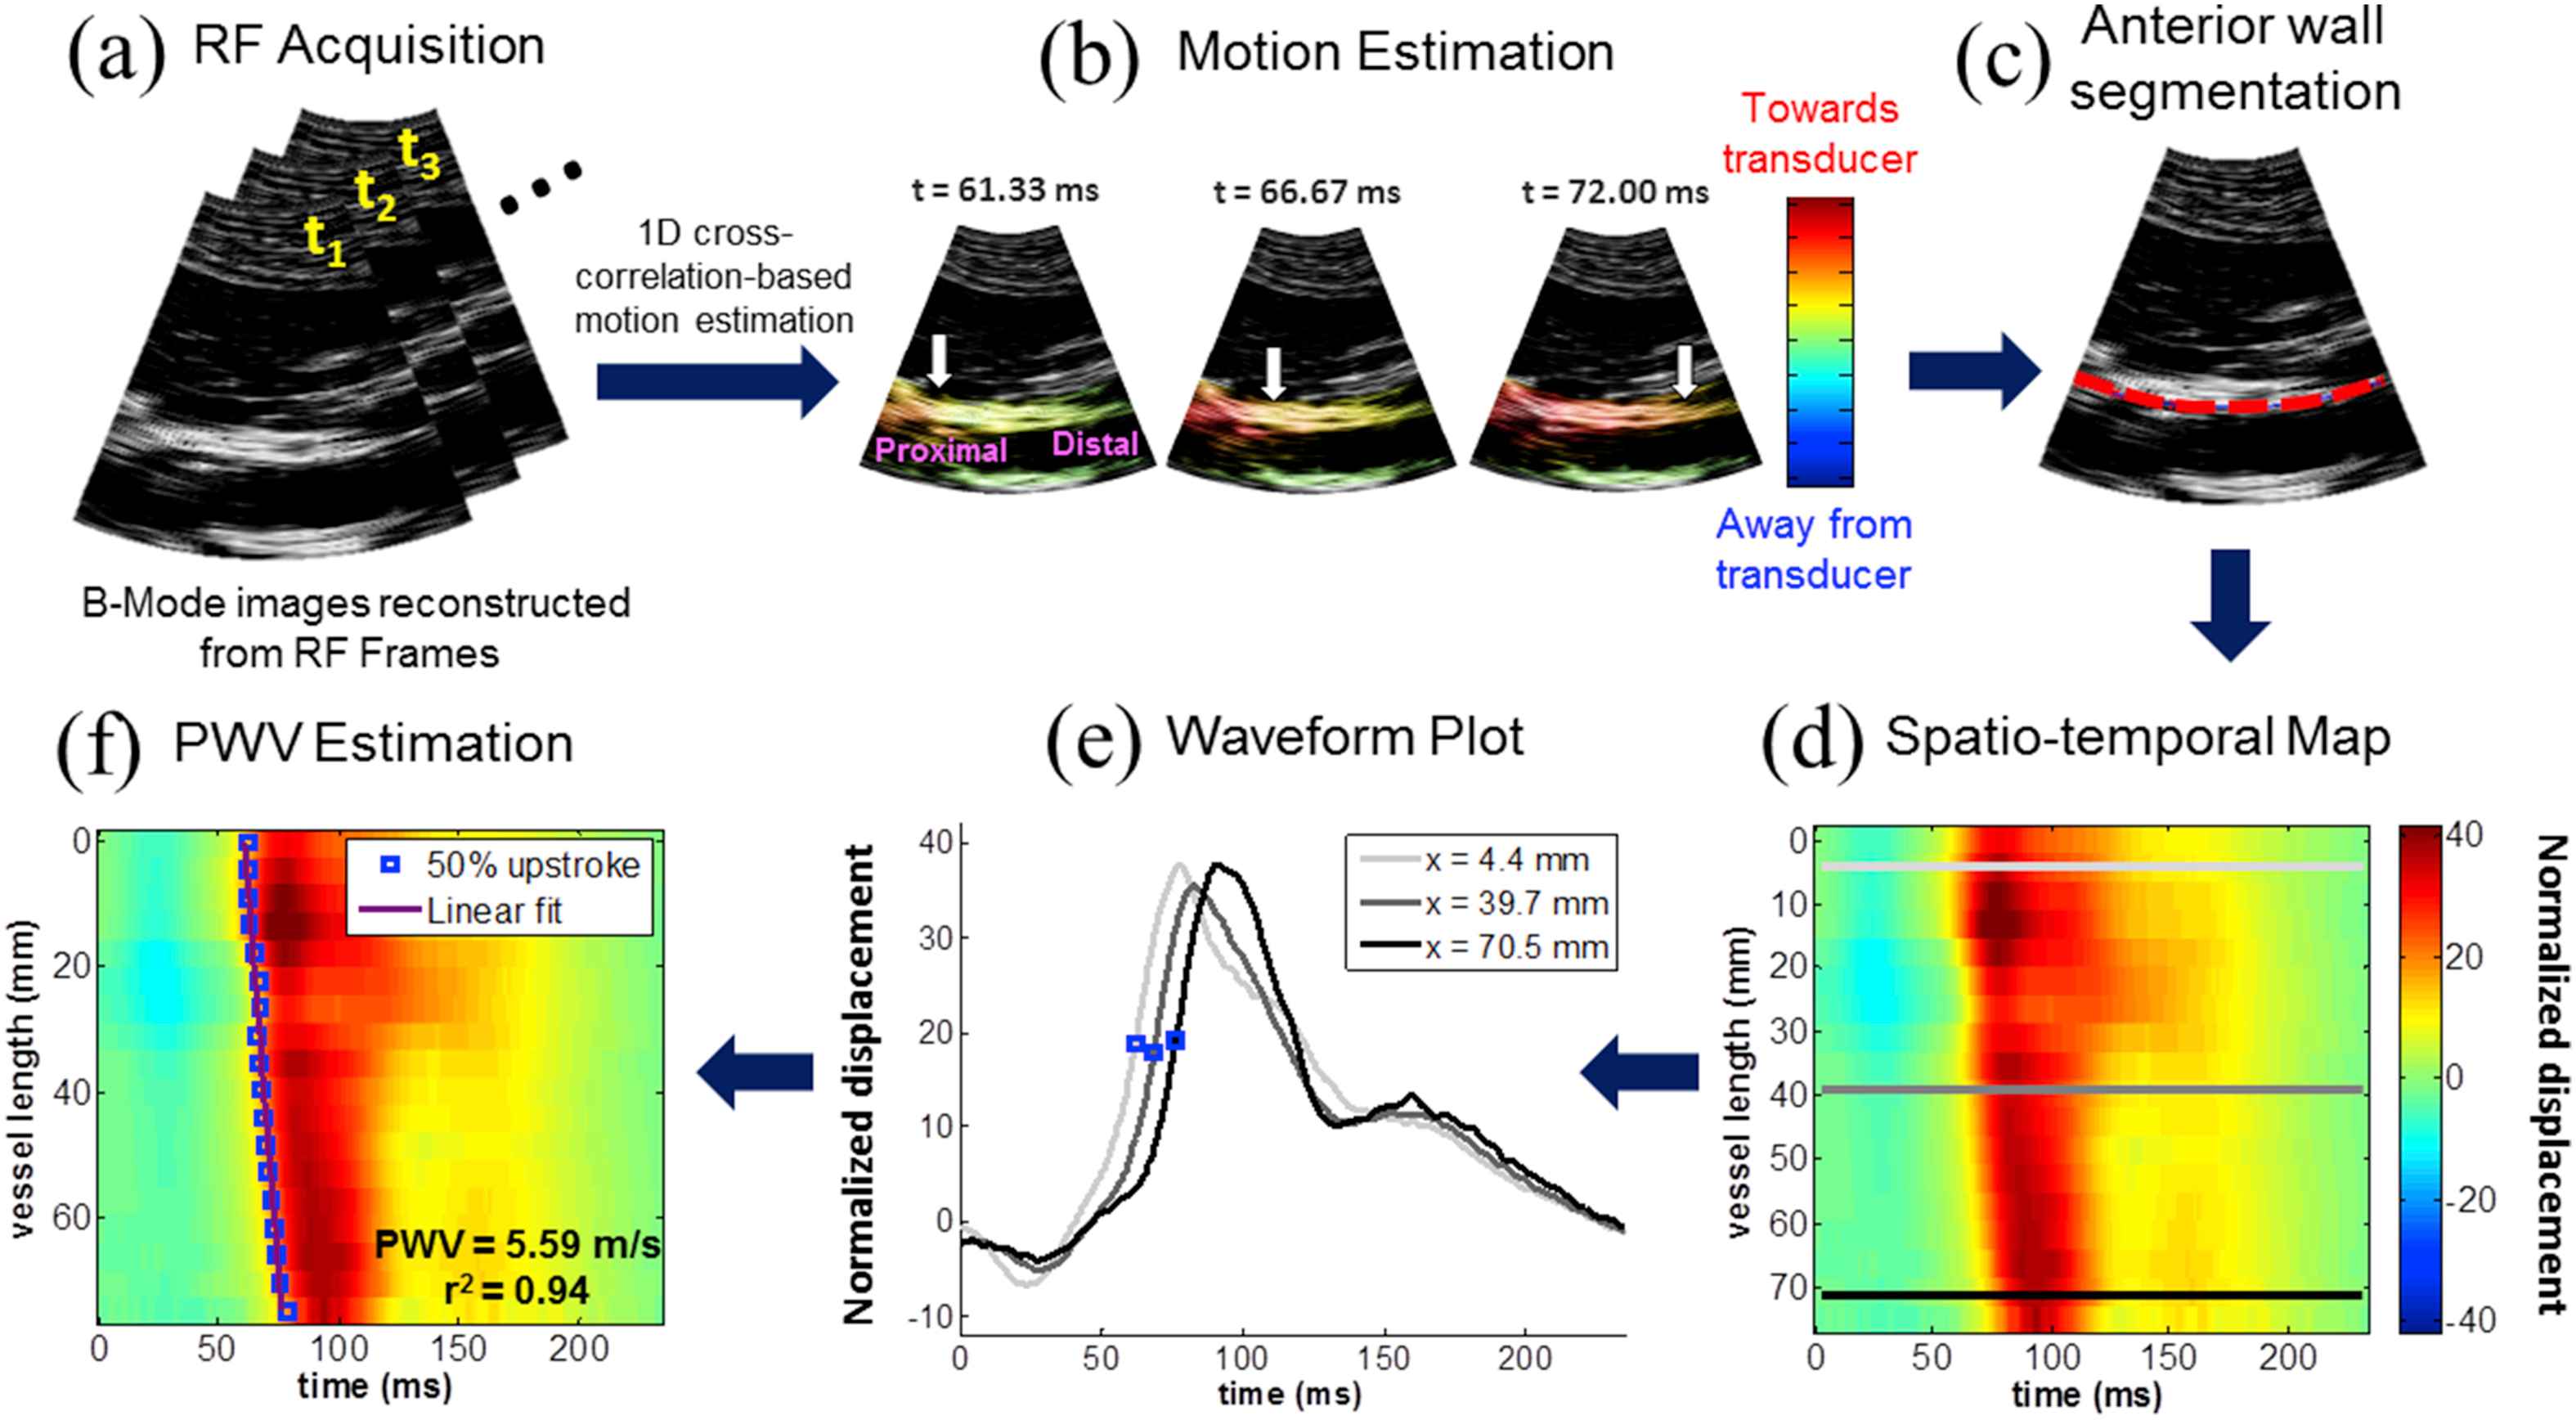
Block diagram of the Pulse Wave Imaging (PWI) method on a normal human aorta in vivo. (a) A sequence of RF frames is acquired at the minimum depth required to visualize both walls of the artery of interest. (b) A 1D normalized cross-correlation-based motion estimation method (Luo and Konofagou 2010) is used on the RF signals to compute the inter-frame axial (i.e. parallel to the ultrasound beams) displacements in the arterial walls. The displacement amplitudes are normalized by multiplying by the frame rate. The arrival of the pulse wave induces positive (i.e. towards the transducer) displacements in the anterior wall and negative (i.e. away from the transducer) displacements in the posterior wall. The white arrows indicate the propagation of the wavefront along the anterior wall. (c) The anterior wall is manually segmented (red dotted line) in the first frame of the acquisition sequence, generating a wall trace that specifies the depth of the wall at each scan line (i.e. one value per scan line). This trace is automatically updated in subsequent frames based on the estimated displacements. (d) The wall motion is spatiotemporally mapped by plotting the displacement at each point along the wall trace over time. (e) The normalized displacement waveform at three scan line positions along the anterior wall, corresponding to the light gray, dark gray, and black lines in (d), are shown. The time point corresponding to a characteristic tracking feature (e.g. the 50% upstroke as indicated by the blue dots) is automatically detected in the waveform at each position. (f) Linear regression is performed on the spatio-temporal variation of the characteristic time points along the imaged segment to obtain the slope as the PWV and the coefficient of determination r2 as an index of propagation uniformity. (For interpretation of the references to colour in this figure legend, the reader is referred to the web version of this article.)
Since PWI is based on sampling the pulse wave and tracking its propagation in both space and time, the PWV and r2 measurements are contingent upon the tradeoff between spatial resolution (i.e. the number of scan lines) and temporal resolution (i.e. the frame rate), which are interdependent, i.e., decreasing the number of scan lines will increase the frame rate, and vice versa. For a given scan line density and PWV, a frame rate below the Nyquist rate may result in aliasing. That is, the pulse wave may appear to arrive at multiple scan line positions simultaneously, resulting in imprecise PWV measurements and low r2. The frame rate also determines the fundamental upper limit on the PWV that can be reliably measured with PWI. Since we do not know the exact speed of the pulse wave prior to imaging, the tradeoff between scan line density and frame rate must be evaluated experimentally.
Signal processing parameters may have additional effects on the PWV and r2 measurements. The waveform at each scan line position may be temporally up-sampled to artificially increase the frame rate, which may result in more precise PWV and r2 measurements. Tracking different characteristic features of the waveform has also been shown to have an impact on the precision of the local PWV measurement.22,23
A conventional ultrasound scanner acquires image frames by sweeping a focused acoustic beam across the image plane and acquiring echoes sequentially. Beam sweeping induces delays in the acquisition of each RF scan line (and hence the motion estimation) as the pulse wave is propagating along the imaged segment, necessitating time delay compensation to obtain the true pulse wave arrival time at each spatial position.16,24 By contrast, plane wave imaging has been proposed to achieve ultrafast frame rates.25–30 The use of plane wave transmissions rather than line-by-line focused beam transmissions eliminates the beam sweep compensation and transducer orientation considerations of conventional ultrasound. However, the clinical applicability of plane wave technology is limited by slower processing speed, lower quality B-mode, and reduced portability. Implementation of PWI in conventional scanners would make the method universal to all scanners, promoting the highly translational nature of the method and allowing for a wide range of large-scale clinical studies using PWI.
The purpose of this study was to establish a theoretical and experimental framework for assessing the performance of PWI under various image acquisition parameters (number of scan lines and frame rate) and signal processing parameters (temporal upsampling factor and waveform tracking feature). The framework was implemented in canine aortas ex vivo and human carotid arteries and aortas in vivo to determine the optimal PWI parameters based on the precision of the PWV measurement and the magnitude of the r2 value.
Methods
The upper limit of the PWV estimation was derived (see Appendix) for the different scan line quantities studied in this paper and listed in Table 1 along with the corresponding frame rates.
| L (mm) | K | FR (fps) | PWVmax (m/s) |
|---|---|---|---|
| 38 | 128 | 160 | 6.03 |
| 38 | 96 | 214 | 8.05 |
| 38 | 64 | 321 | 12.01 |
| 38 | 48 | 428 | 15.93 |
| 38 | 32 | 642 | 23.66 |
| 38 | 24 | 856 | 31.23 |
| 38 | 16 | 1248 | 44.63 |
Upper limit of the PWV measurement with respect to imaging parameters.
Ex vivo experiments
Benchtop ex vivo experiments were performed using the setup shown in Fig. 2 to provide a controlled environment in which the image acquisition parameters could be varied while maintaining the exact same field of view. Freshly excised canine aortas (n = 2) were mounted separately in a water tank of phosphate-buffered saline (PBS) using plastic fittings on either side. The tension applied on the canine aorta specimens served to minimize the rigid motion in the ex vivo setup. A peristaltic pump (Manostat Varistaltic, Barrington, IL) operating at 2 Hz was used to generate pulsatile flow through the specimen. Ultrasound RF signals were acquired using a 10-MHz linear array transducer (SonixTouch, Ultrasonix Medical Corp., Burnaby, Canada) within a constant 25 mm (depth) x 38 mm (width) field of view while varying the number of scan lines (Table 1). Since this paper focused on the tradeoff between spatial and temporal resolution, other parameters such as focal configuration and imaging depth were kept constant.
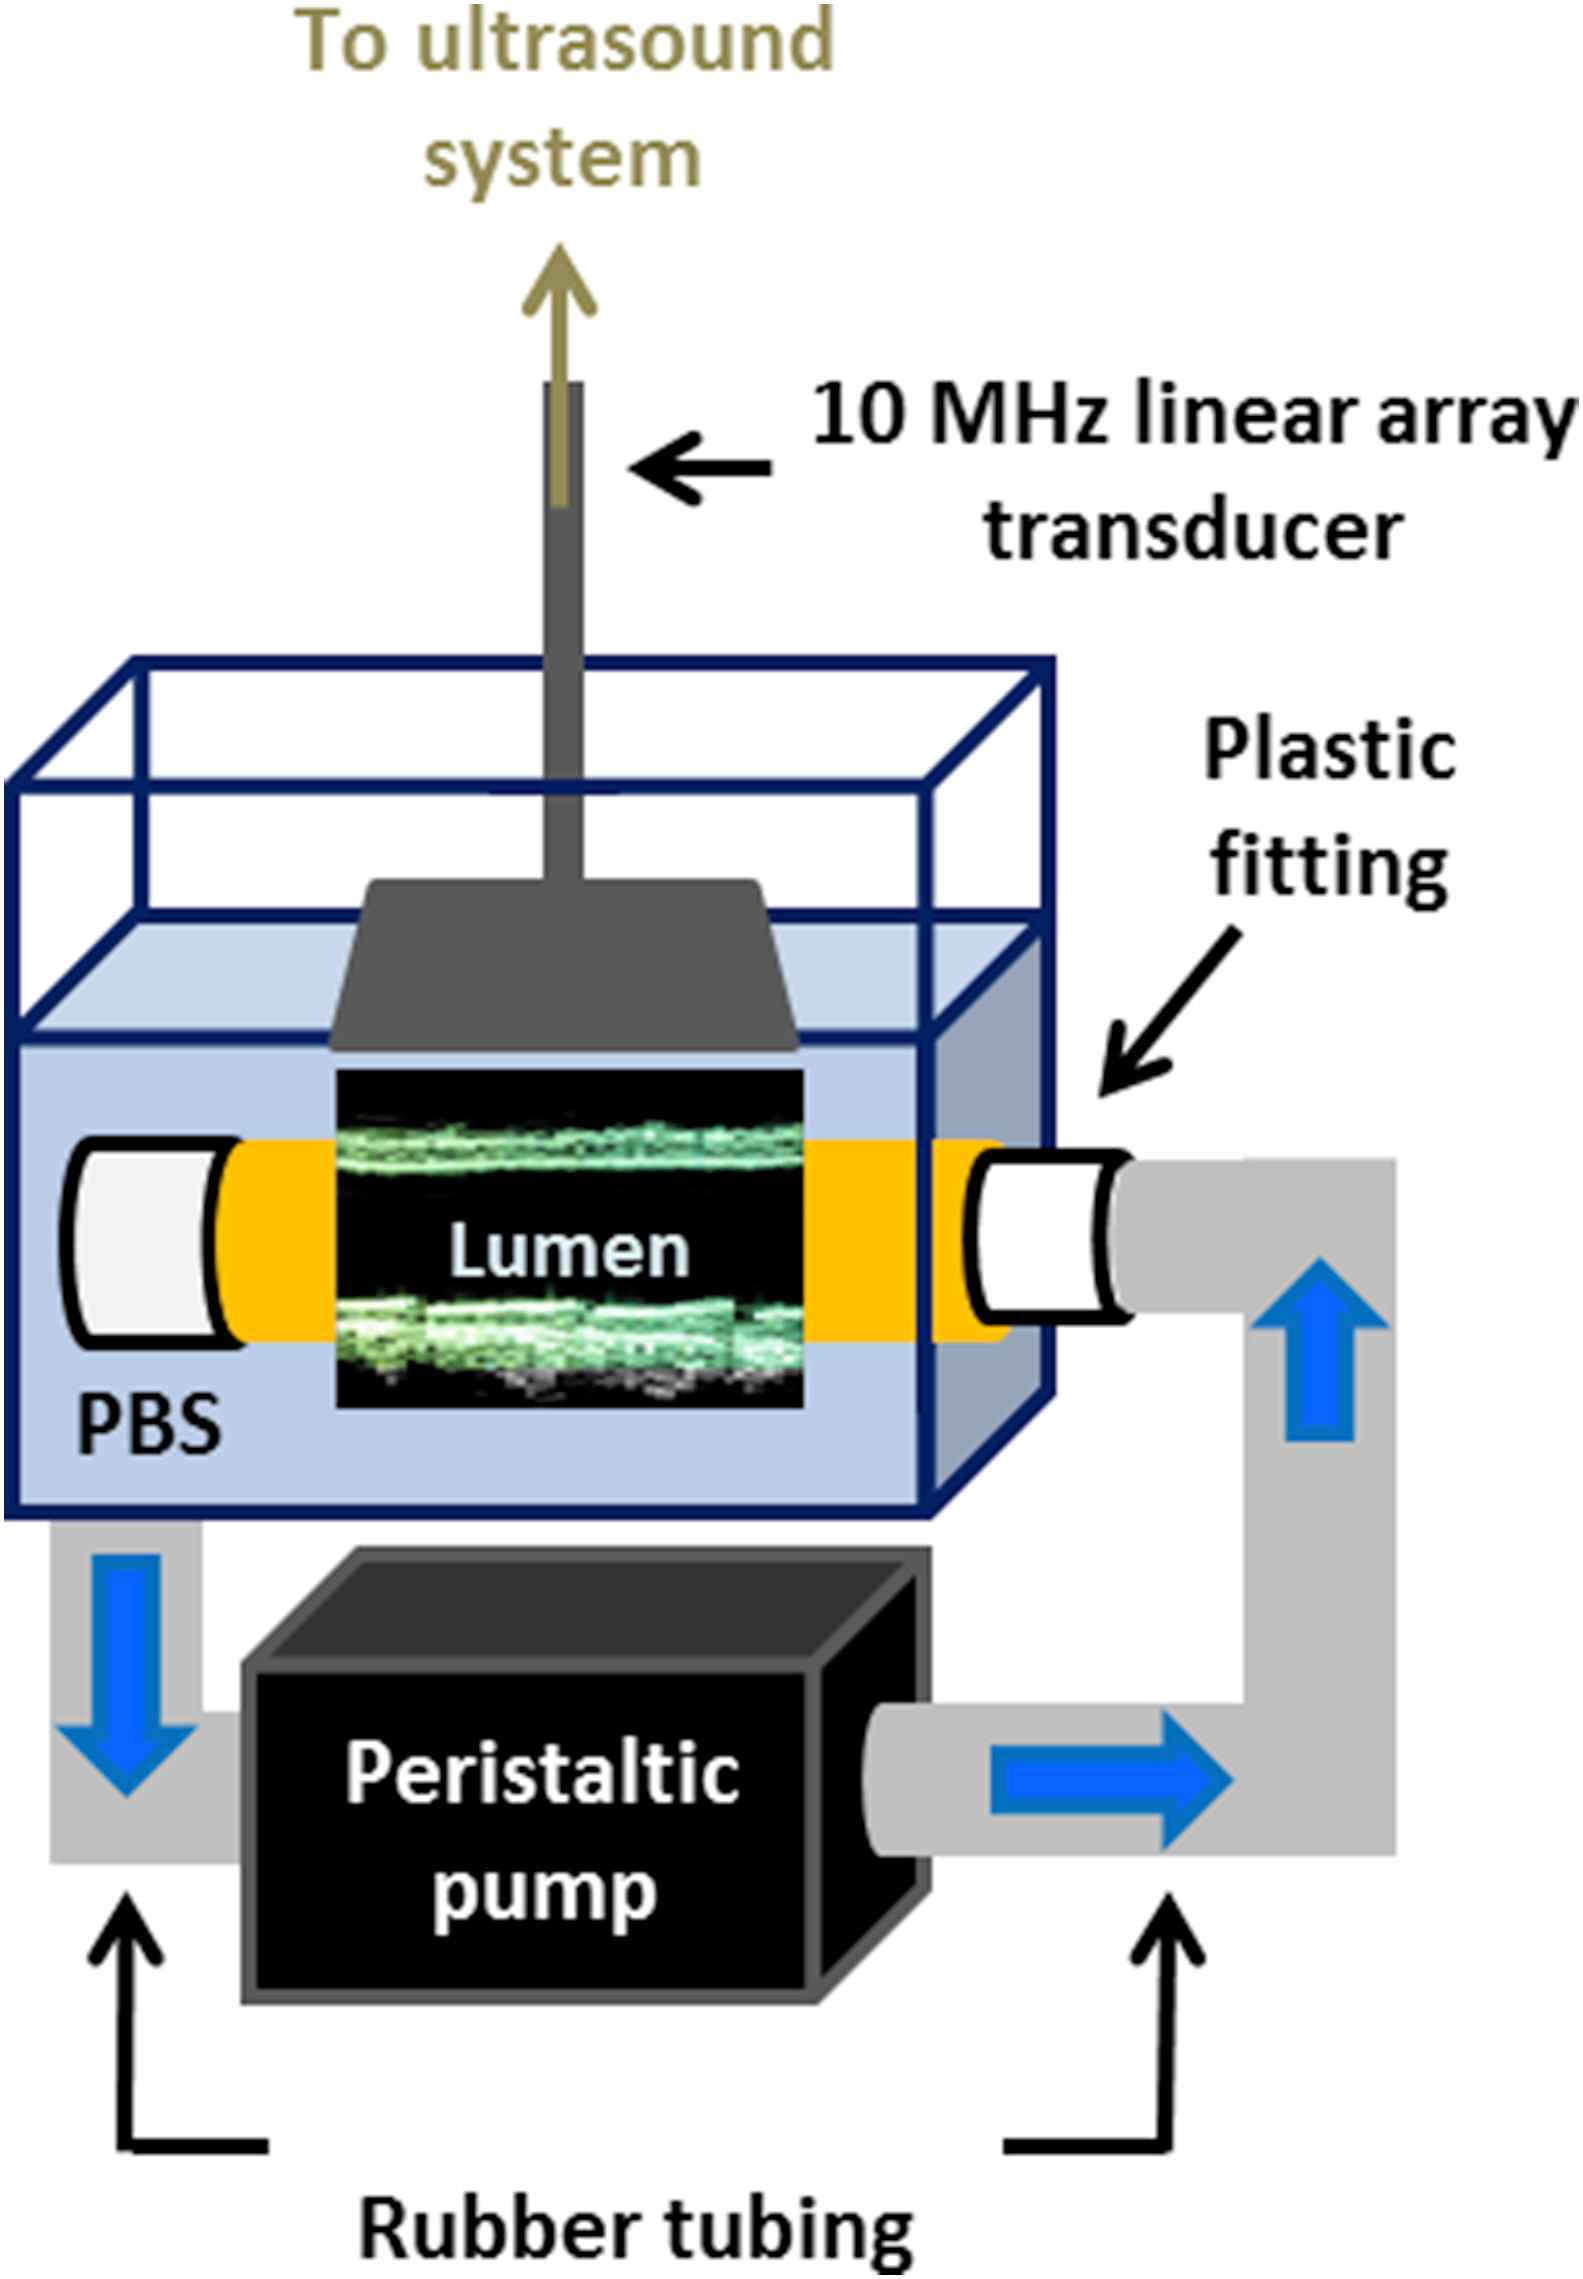
Schematic of the setup used for ex vivo experiments. The canine aorta is held in place in a PBS-filled tank using plastic fittings. The peristaltic pump draws PBS from the tank, delivering pulsatile flow through the specimen and back into the bath. The imaged segment length was equal to the width of the field of view because the transducer was held in place parallel to the specimen as shown in Fig. 2.
Following data acquisition, the inter-frame axial wall displacements were computed offline using a 1D cross correlation-based motion estimation method31 on the RF signals with a 3.5-mm window size and 95% overlap. Manual segmentation of the upper wall (Fig. 1c) in the first frame of the acquisition sequence generated a wall trace that specified the depth of the wall at each scan line (i.e. one value per scan line). The displacements at each point along the trace were used for spatio-temporal mapping of the wall motion. The normalized displacement waveform at each scan line position was temporally upsampled by factors of 1, 2, 4, 8, 16, 32, and 64 using 1D linear interpolation (table lookup) in MATLAB (Mathworks Inc., Natick, MA, USA).
For each combination of scan line quantity and upsampling factor, the PWV and r2 were measured over 10 pump cycles using linear regression on the spatio-temporal variation of the 50% upstroke. The methods for calculating the 50% upstroke and other waveform tracking features will be discussed in section Result. Prior to linear regression, beam sweep compensation as described in the Appendix was applied at each scan line position.
PWV precision and r2 magnitude for PWI optimization
The precision of the PWV measurements was defined as the SNR in dB, i.e. the logarithm of the ratio of the mean and standard deviation (μ/σ) over 10 pulse cycles. The greater the SNR, the more precise the measurement. Thus, performance assessment of PWI entails finding the combination of scan line quantity and temporal upsampling factor that yields the highest SNR.
The r2 value is an approximate measure of the pulse wave propagation uniformity. A low r2 may result from varying PWV within the imaged segment due to inhomogeneous vascular mechanical properties, but may also be caused by a low number of spatial and temporal samples, which would result in a false r2 value. Hence, performance assessment of PWI also entails identifying the combination of scan line quantity and temporal upsampling factor that yields the highest r2 values.
In vivo studies
PWI was performed on the left common carotid arteries and infrarenal abdominal aortas of ten normal human subjects (8 M, 2 F, mean age 24.8 ± 3.3 y.o.) in the supine position using a 10 MHz linear array transducer (SonixTouch, Ultrasonix Medical, Burnaby, BC, Canada) for the carotid and a 3.3 MHz curvilinear array transducer for the aorta. To minimize rigid motion, each subject was requested to perform breath-holding for the entire duration of the 2.5-s RF acquisition. 5–8 acquisitions were performed on each artery in all subjects in order to average the PWV and r2 measurements over multiple cardiac cycles.
PWI in normal subjects typically measures PWVs of 3–6 m/s in the carotid artery16 and 4–8 m/s in the abdominal aorta.13,15 Several other studies using image-guided methods to measure local PWV in normal subjects have reported values within the same range,32–36 while the global PWV measured using carotid-femoral applanation tonometry in young healthy adults typically ranges from 5 to 7 m/s.37–42 For the in vivo portion of this study, the carotid arteries were imaged at depths of 25–30 mm using the same transducer as that in the ex vivo experiments. From Table 1, it was determined that 32 scan lines would be used to achieve a PWV upper limit that is almost four times higher than the typical values found in literature. The aortas were imaged at depths of 70–90 mm and segment lengths of 80–100 mm. Based on these conditions and Eqn. (A6) (Appendix), it was determined that 24 scan lines would be used to achieve frame rates of 309–347 fps and PWV upper limits of 23.19–33.31 m/s, also four times higher than typical values.
For consistency, the temporal upsampling factor was fixed at 10. Over each cardiac cycle, the absolute maximum of the normalized displacement waveform at each scan line position was automatically detected as the peak. From this point, the waveform was traversed backwards in time until the zero-crossing point was reached. The upstrokes were located as the points when the waveform reached 25% and 50% of the peak magnitude. The maximum first and second derivatives were detected by locating the peak of the first and second gradients of the normalized displacement waveform, respectively. A summary of the tracking features studied is shown in Fig. 3 on representative waveforms from one subject’s carotid arteries. The SNR of the PWV measurement and magnitude of the r2 value obtained by tracking different features of the waveform (i.e. zero-crossing, peak, 25% and 50% upstrokes, and maximum first and second derivatives) were assessed.
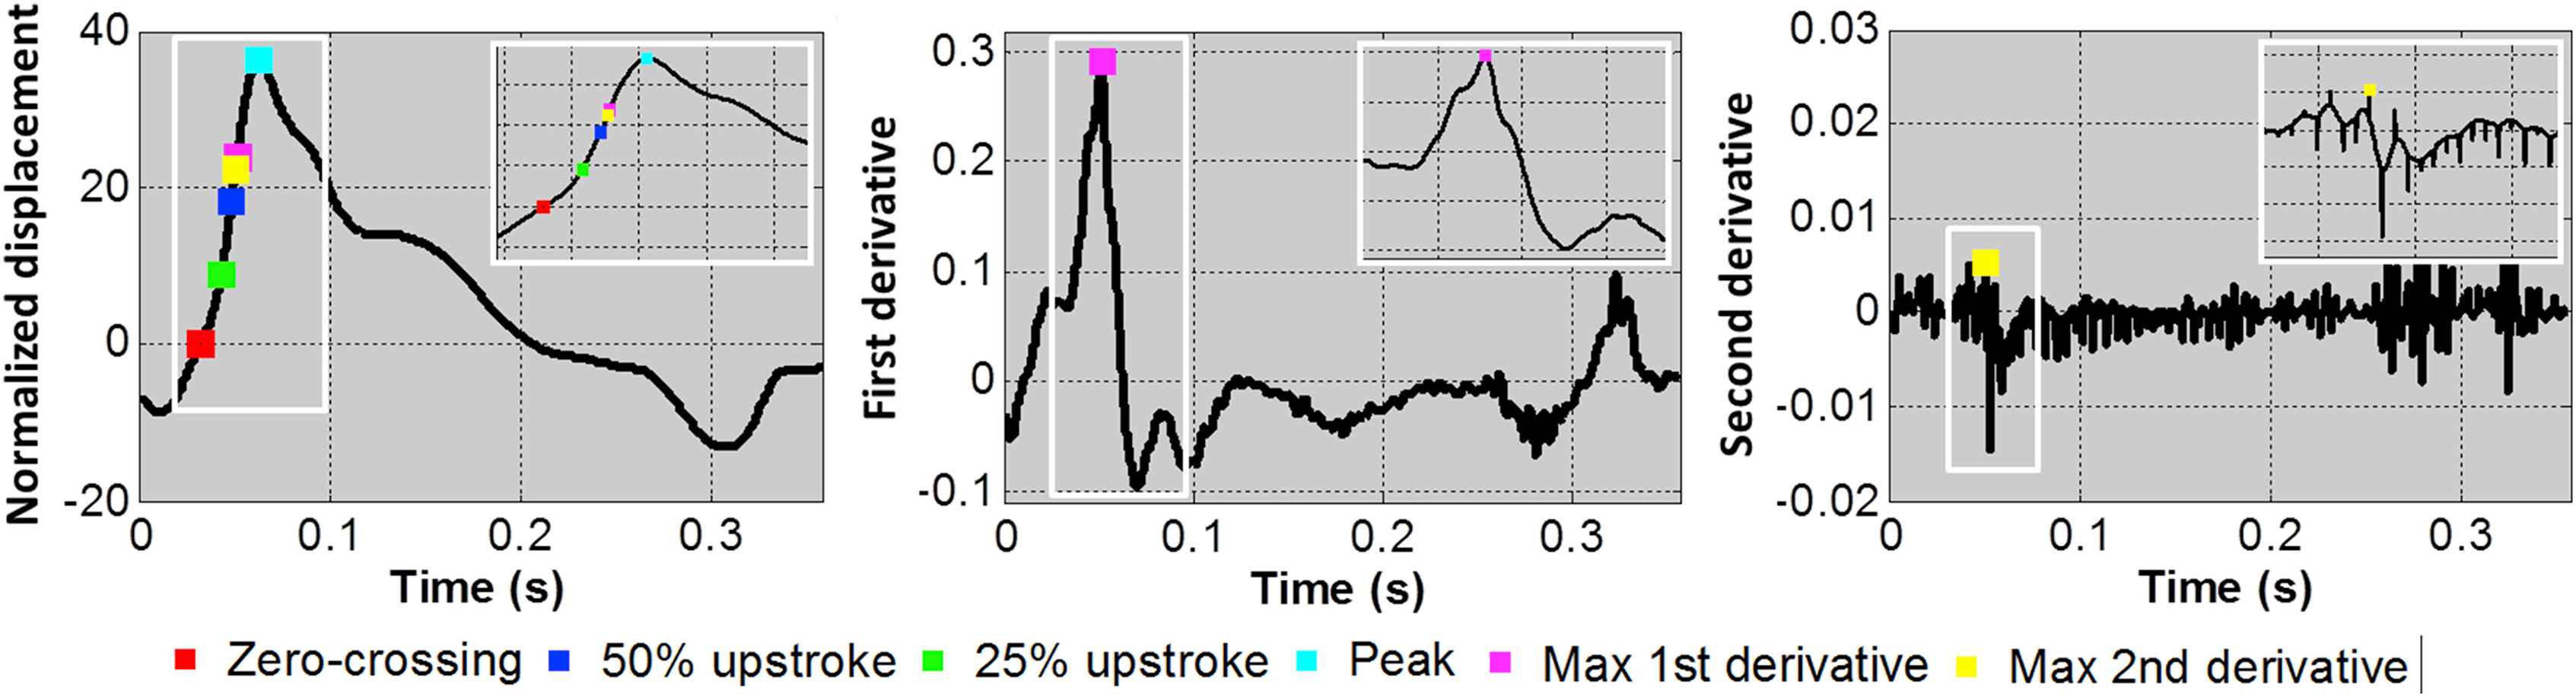
A representative normalized displacement waveform (left) from the carotid artery of a normal (M, 26) subject is shown along with the corresponding first and second derivative curves (middle and right, respectively). The six waveform features investigated in this study (zero-crossing, 25% upstroke, 50% upstroke, peak, maximum first derivative, and maximum second derivative) are indicated on the curves as color-coded markers. (For interpretation of the references to colour in this figure legend, the reader is referred to the web version of this article.)
Results
Ex vivo results
Figure 4 illustrates the effect of temporal upsampling on the spatio-temporal map from data acquired using 128 scan lines (160 FPS). Without upsampling (Fig. 4a), PWV = 3.66 m/s and the r2 was relatively low (0.69). When the waveform at each scan line position was upsampled by a factor of 2 (Fig. 4b), the PWV value remained similar (3.29 m/s) while the r2 increased dramatically (0.93). An upsampling factor of 8 (Fig. 4c) further increased the r2 to 0.99. This demonstrates that a falsely low r2 may result from insufficient frame rate, thus necessitating the need to optimize the spatial and temporal resolution of PWI by saturating the r2 magnitude.
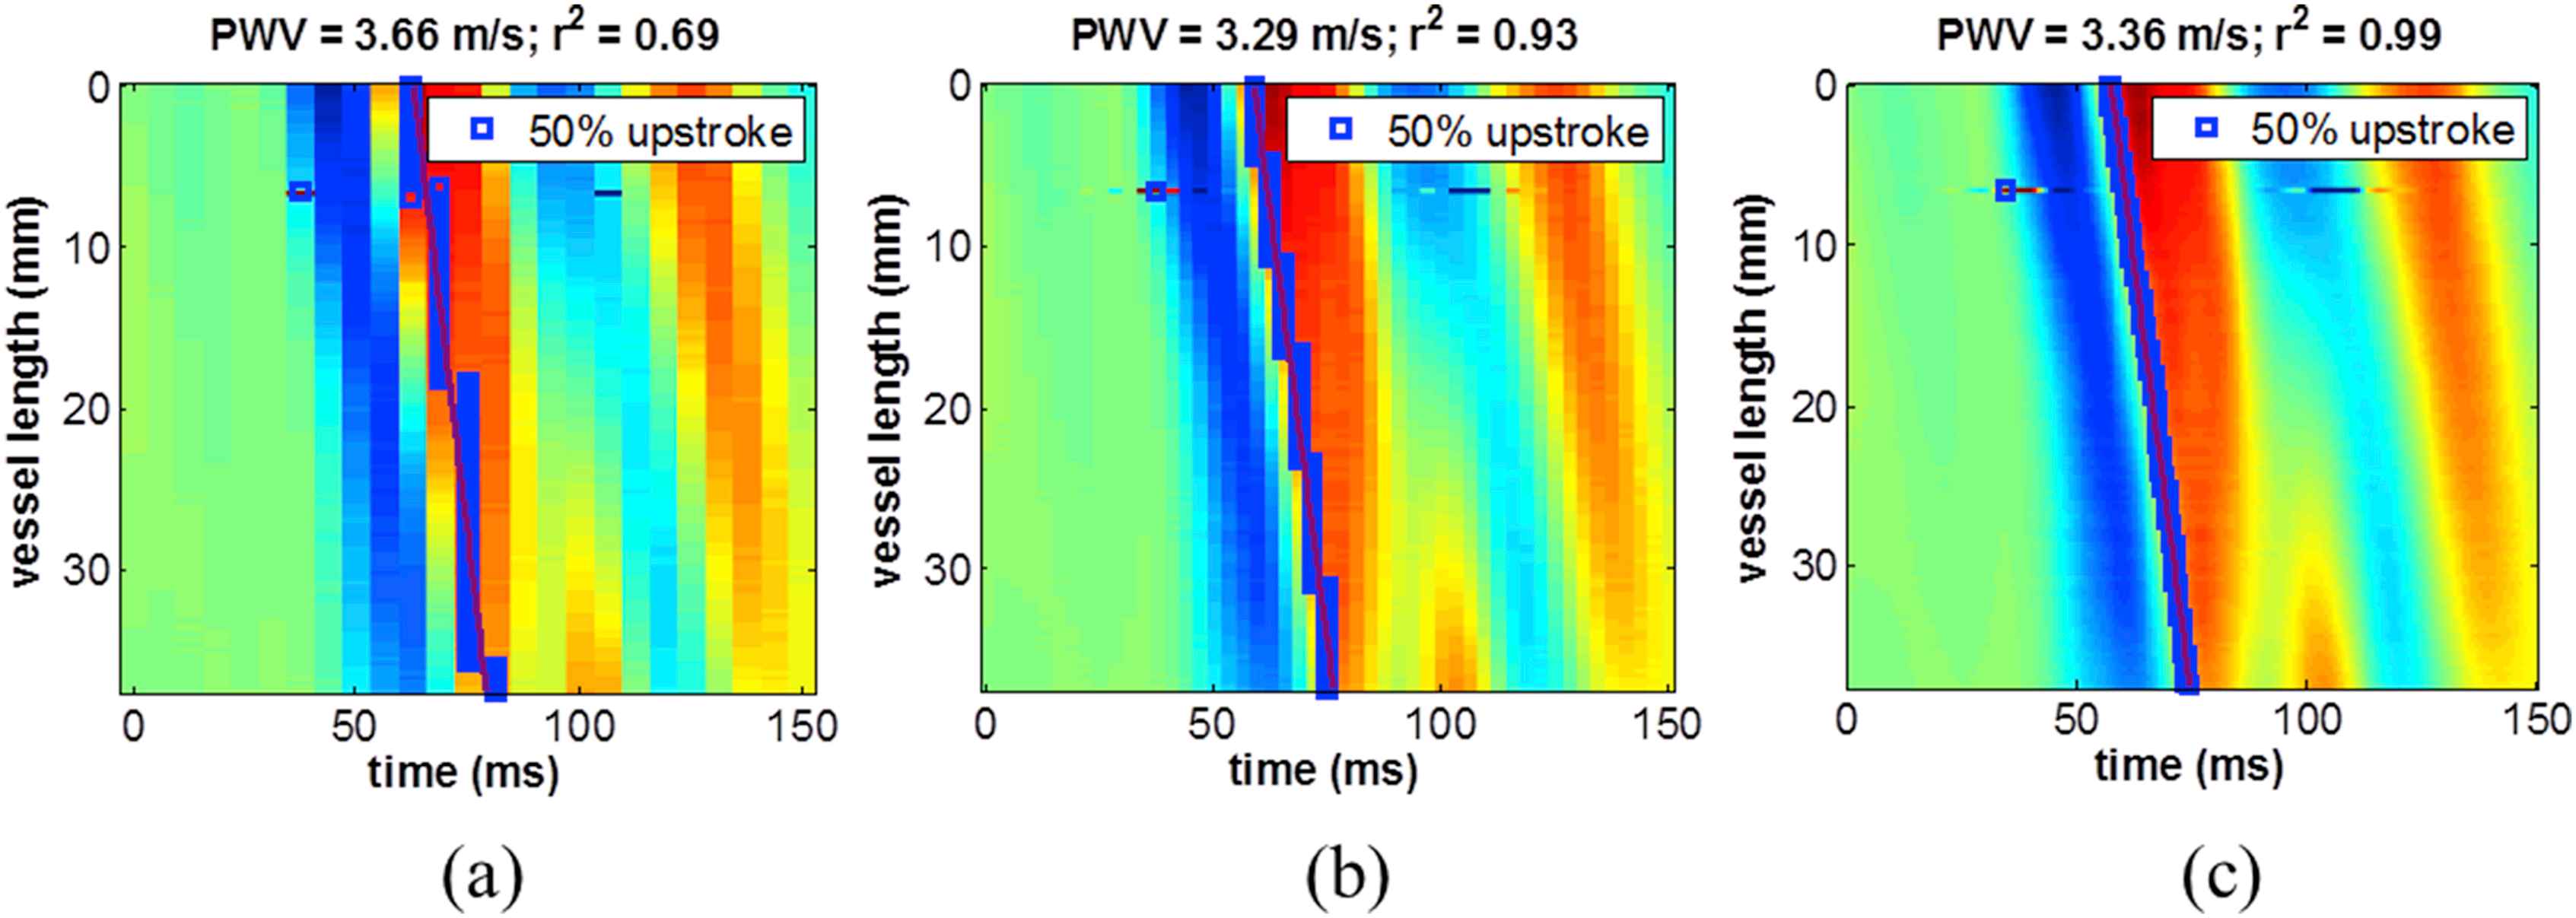
Effect of temporal upsampling on a spatio-temporal map of ex vivo data acquired using 128 scan lines (160 FPS). (a) Without upsampling, the r2 is relatively low due to fewer discrete time samples. (b) With an upsampling factor of 2, the PWV value remains similar, however the r2 increases dramatically. (c) An upsampling factor of 8 further increases the r2. This demonstrates that a falsely low r2 may result from insufficient frame rate, and may be improved by temporal upsampling.
Figure 5 shows the mean PWV value (a), SNR of the PWV measurement (b), and the mean r2 magnitude (c), all acquired in the reverse scan orientation and averaged over 10 pump cycles, for each combination of scan line quantity and temporal upsampling factor in the first of the two ex vivo canine aortas. The PWV averaged over all combinations was 3.33 ± 0.17 m/s, representing a standard error of only 2.4%. Figure 6 shows the same results for the second specimen, which exhibited an overall average PWV of 2.48 ± 0.12 m/s (standard error 1.7%). Both overall values were below the lowest upper limit on the PWV, which was 6.03 m/s for that of 128 scan lines and 160 FPS (Table 1). The variation in the mean PWV obtained with different scan line quantities was deemed insignificant.
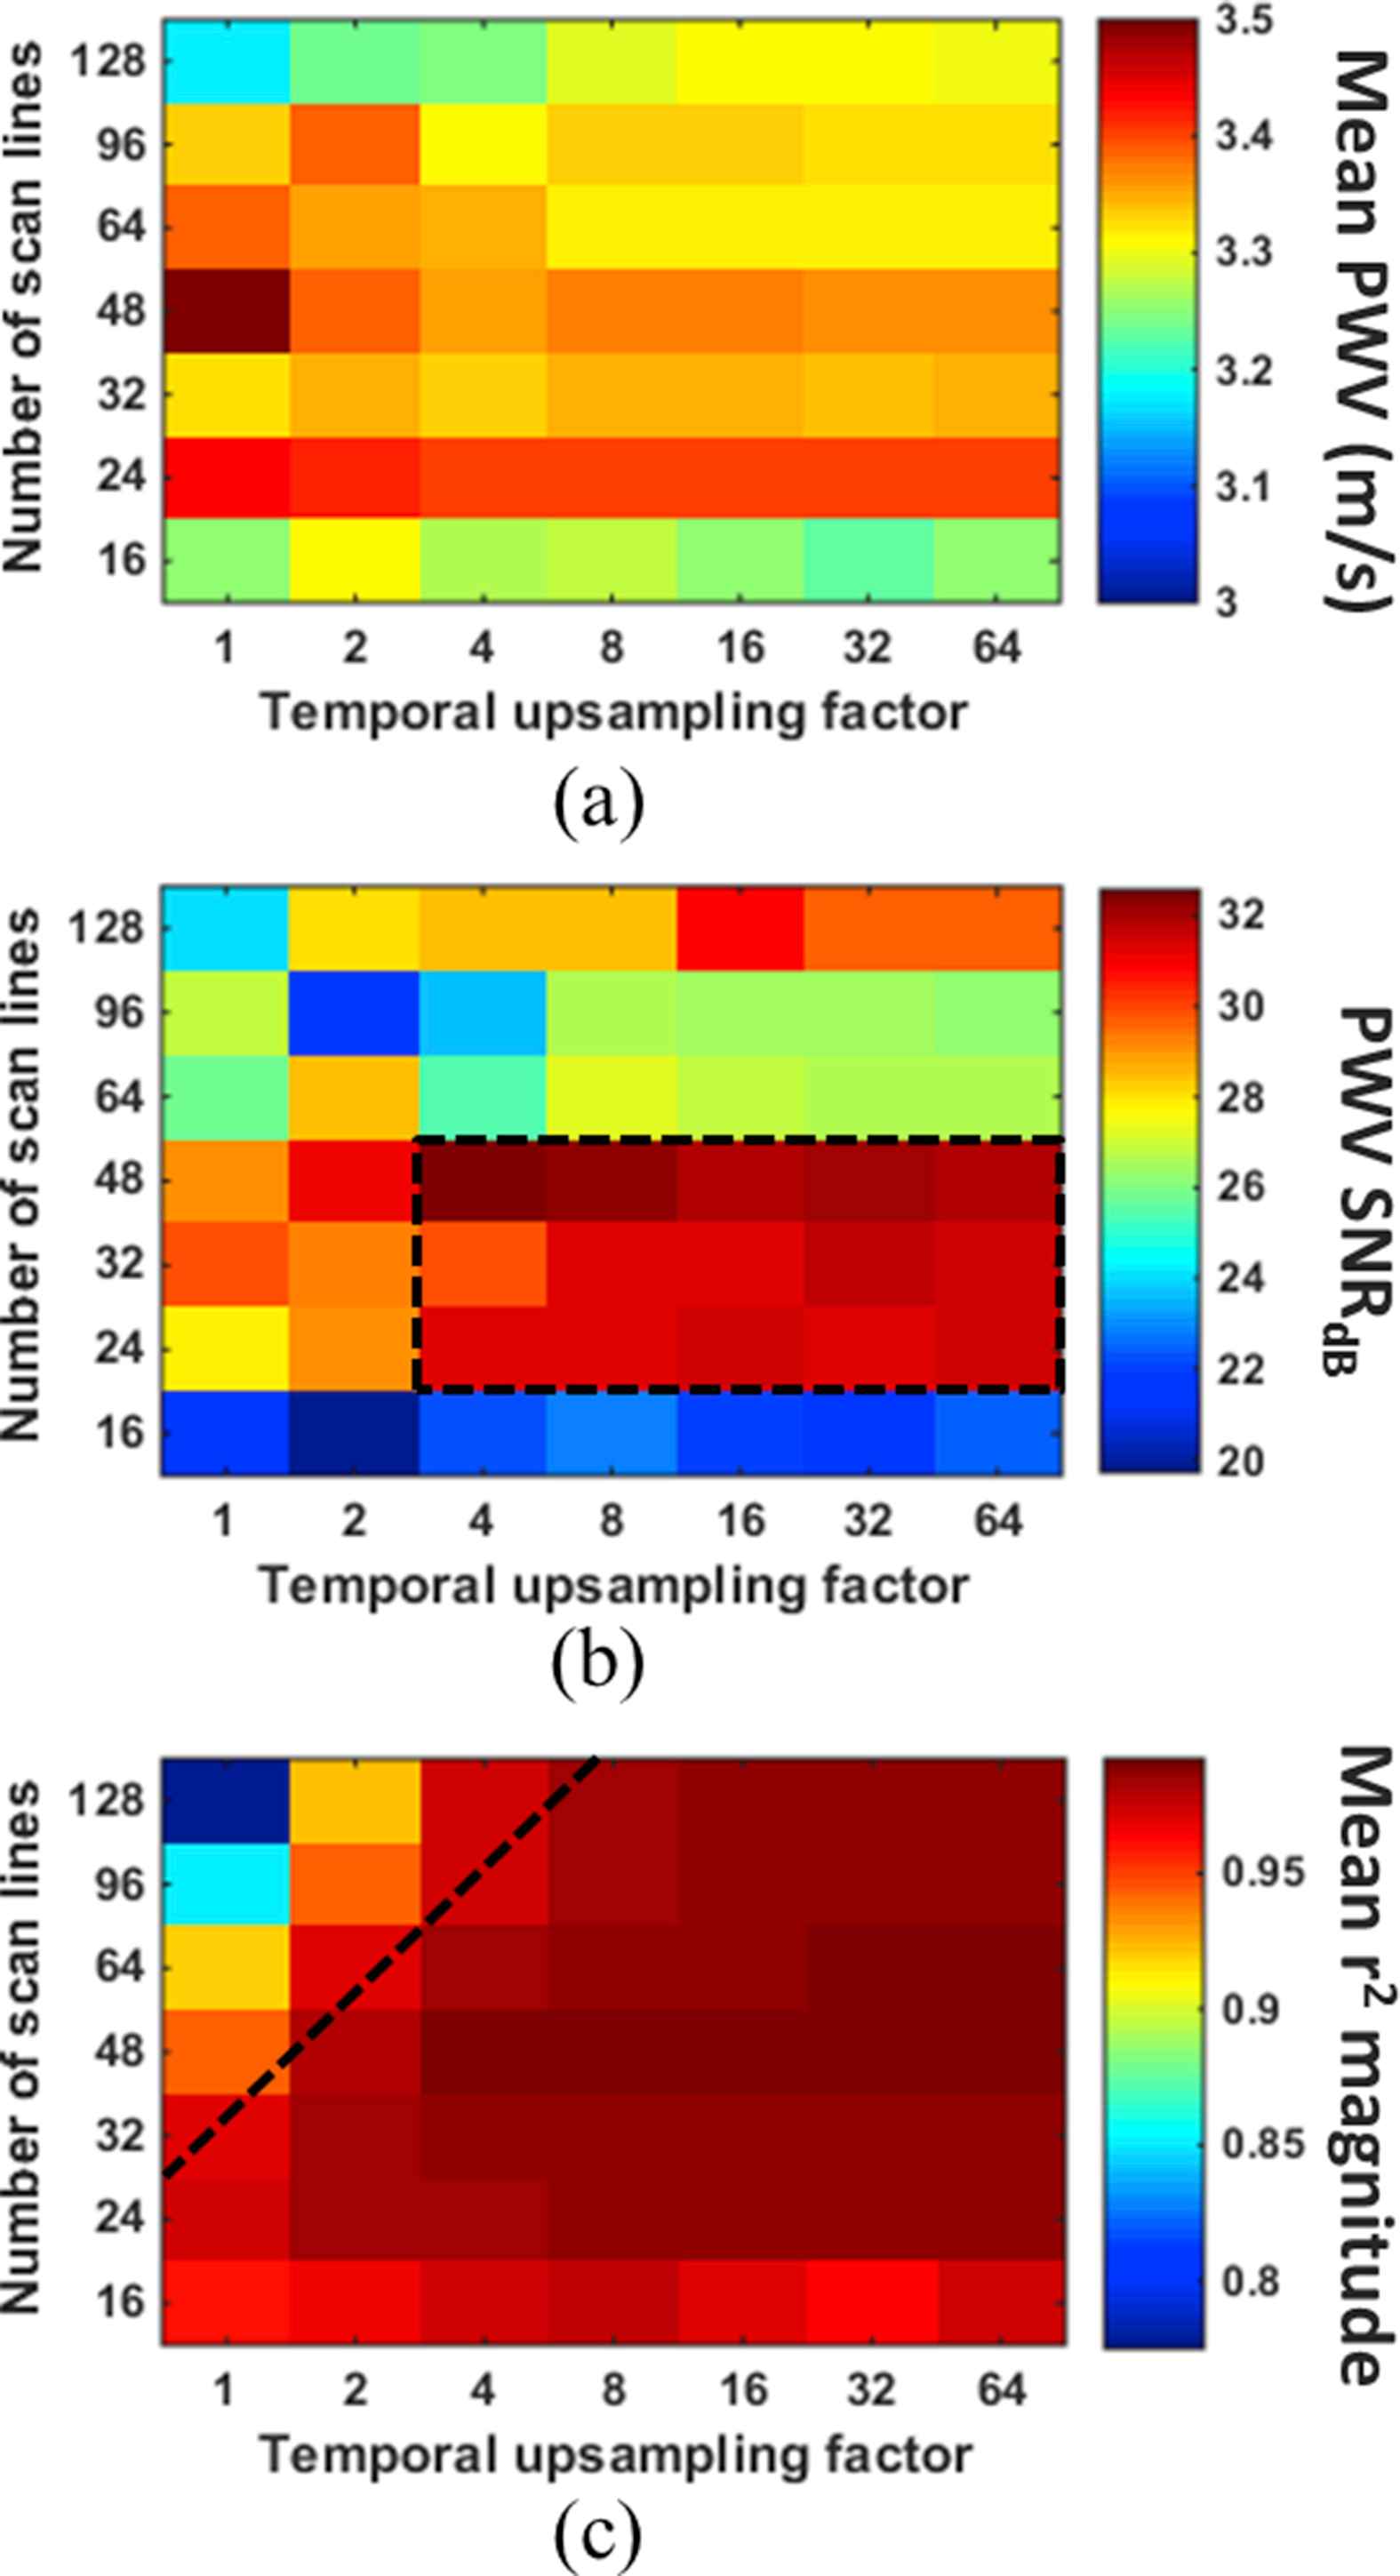
(a) Mean PWV, (b) SNR of the PWV measurement, and (c) magnitude of the r2 value for each combination of scan line quantity and temporal upsampling factor in the first canine aorta. The value in each square of the grids was obtained from PWV and r2 measurements over 10 pulse cycles. The black dashed box in (b) indicates the combinations of scan line quantity and temporal upsampling factor that yielded the highest PWV SNR, while combinations below the black line in (c) resulted in saturation of the r2 magnitudes.
In both specimens, the mean PWV for a particular scan line quantity remained relatively consistent over all upsampling factors. That is, the mean PWV did not seem to be affected by the temporal upsampling factor. The only exception was in the case of 128 scan lines in the first specimen (Fig. 5a), where the PWV appears to increase as the temporal upsampling factor is increased. Also in both specimens, scan line quantities of 24, 32 and 48 consistently yielded the highest PWV SNR for upsampling factors greater than 4, as indicated by the black dashed square in Figs. 5b and 6b. Given the fixed 38 mm imaging plane width, this translated to scan line densities of 0.63–1.26 lines/mm, respectively.
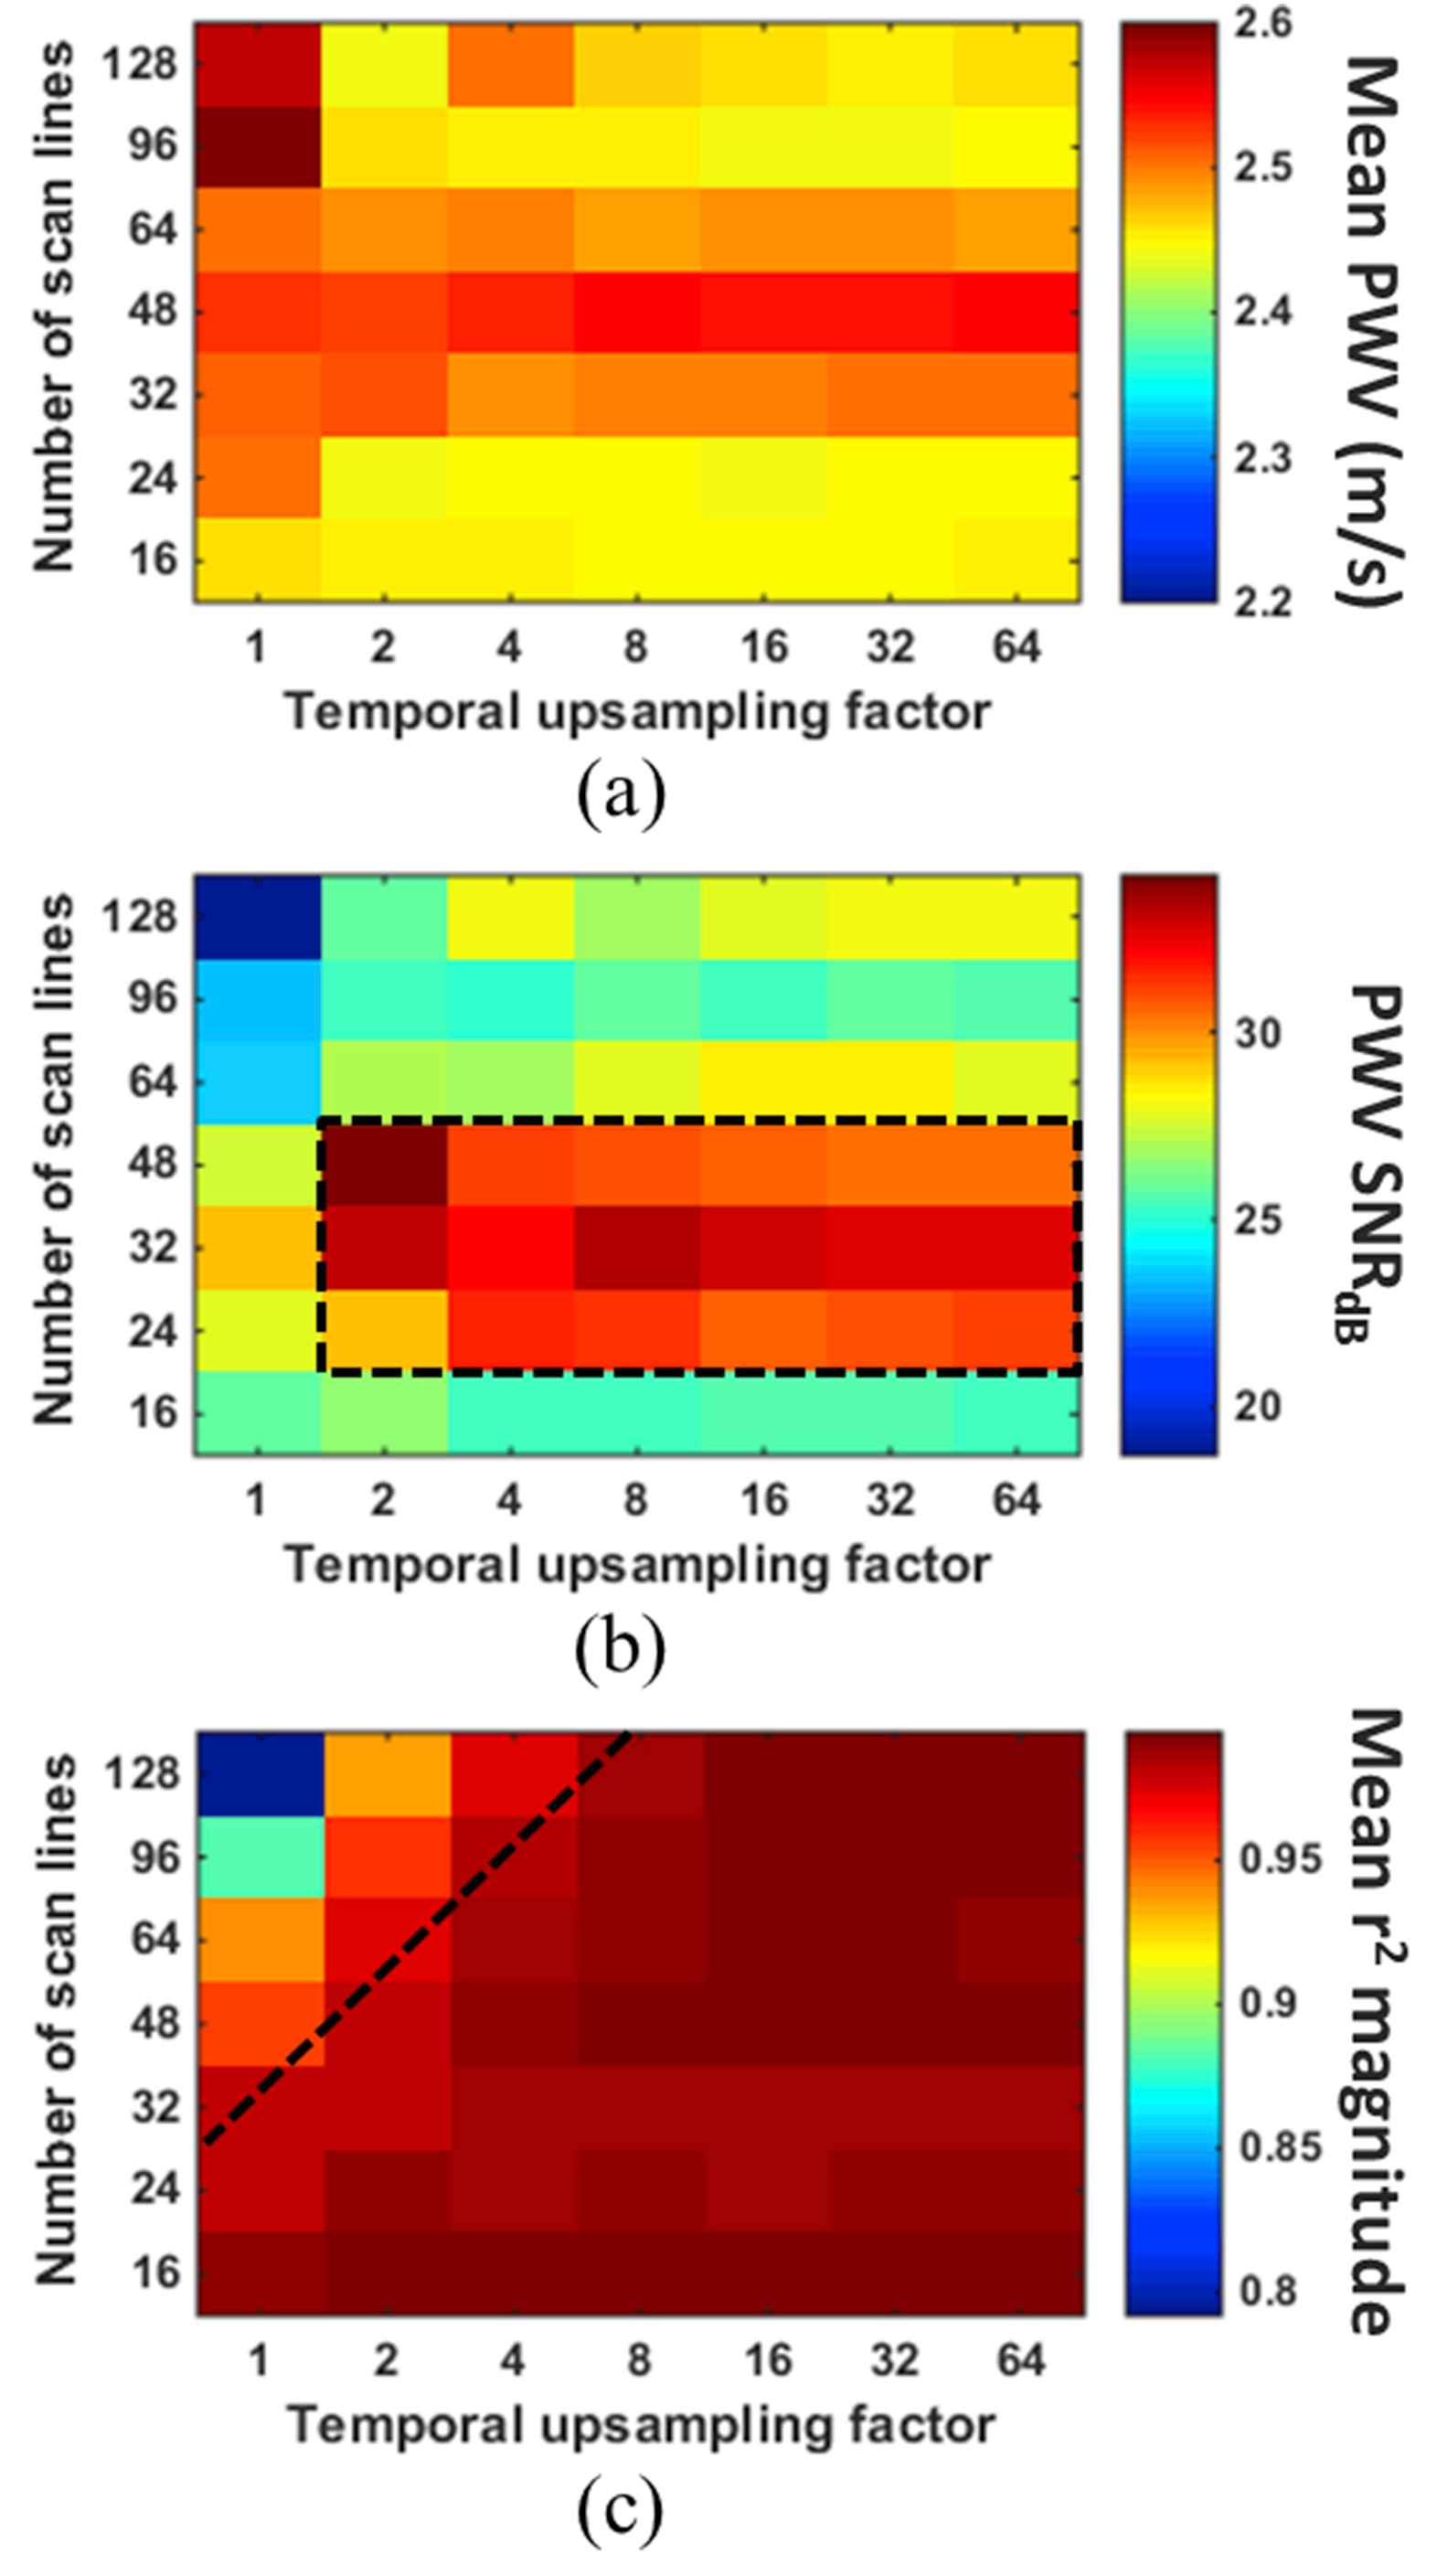
(a) Mean PWV, (b) SNR of the PWV measurement, and (c) magnitude of the r2 value for each combination of scan line quantity and temporal upsampling factor in the second canine aorta. The value in each square of the grids was obtained from PWV and r2 measurements over 10 pulse cycles. The black dashed box in (b) indicates the combinations of scan line quantity and temporal upsampling factor that yielded the highest PWV SNR, while combinations below the black line in (c) resulted in saturation of the r2 magnitudes.
The black dashed line in Figs. 5c and 6c indicates the cutoff at which the r2 values become relatively saturated. In both specimens, r2 saturation occurs below the same cutoff line. This suggests that the greater the number of scan lines used, the greater temporal upsampling factor must be in order to achieve r2 saturation.
In vivo results
Figure 7 shows the PWV SNR (a) and r2 magnitude (b) in the carotid artery and aorta averaged over all 10 normal subjects for each waveform tracking feature. In the carotid arteries, the 50% upstroke and maximum first derivative yielded significantly higher (p < 0.05) PWV SNR compared to the other tracking features, and the 25% and 50% upstrokes yielded significantly higher r2. In the aortas, tracking the 25% and 50% upstrokes yielded significantly higher PWV SNR and r2. While the maximum first derivative also yielded significantly higher r2, its PWV SNR was significantly lower than those obtained by the 25% and 50% upstrokes.
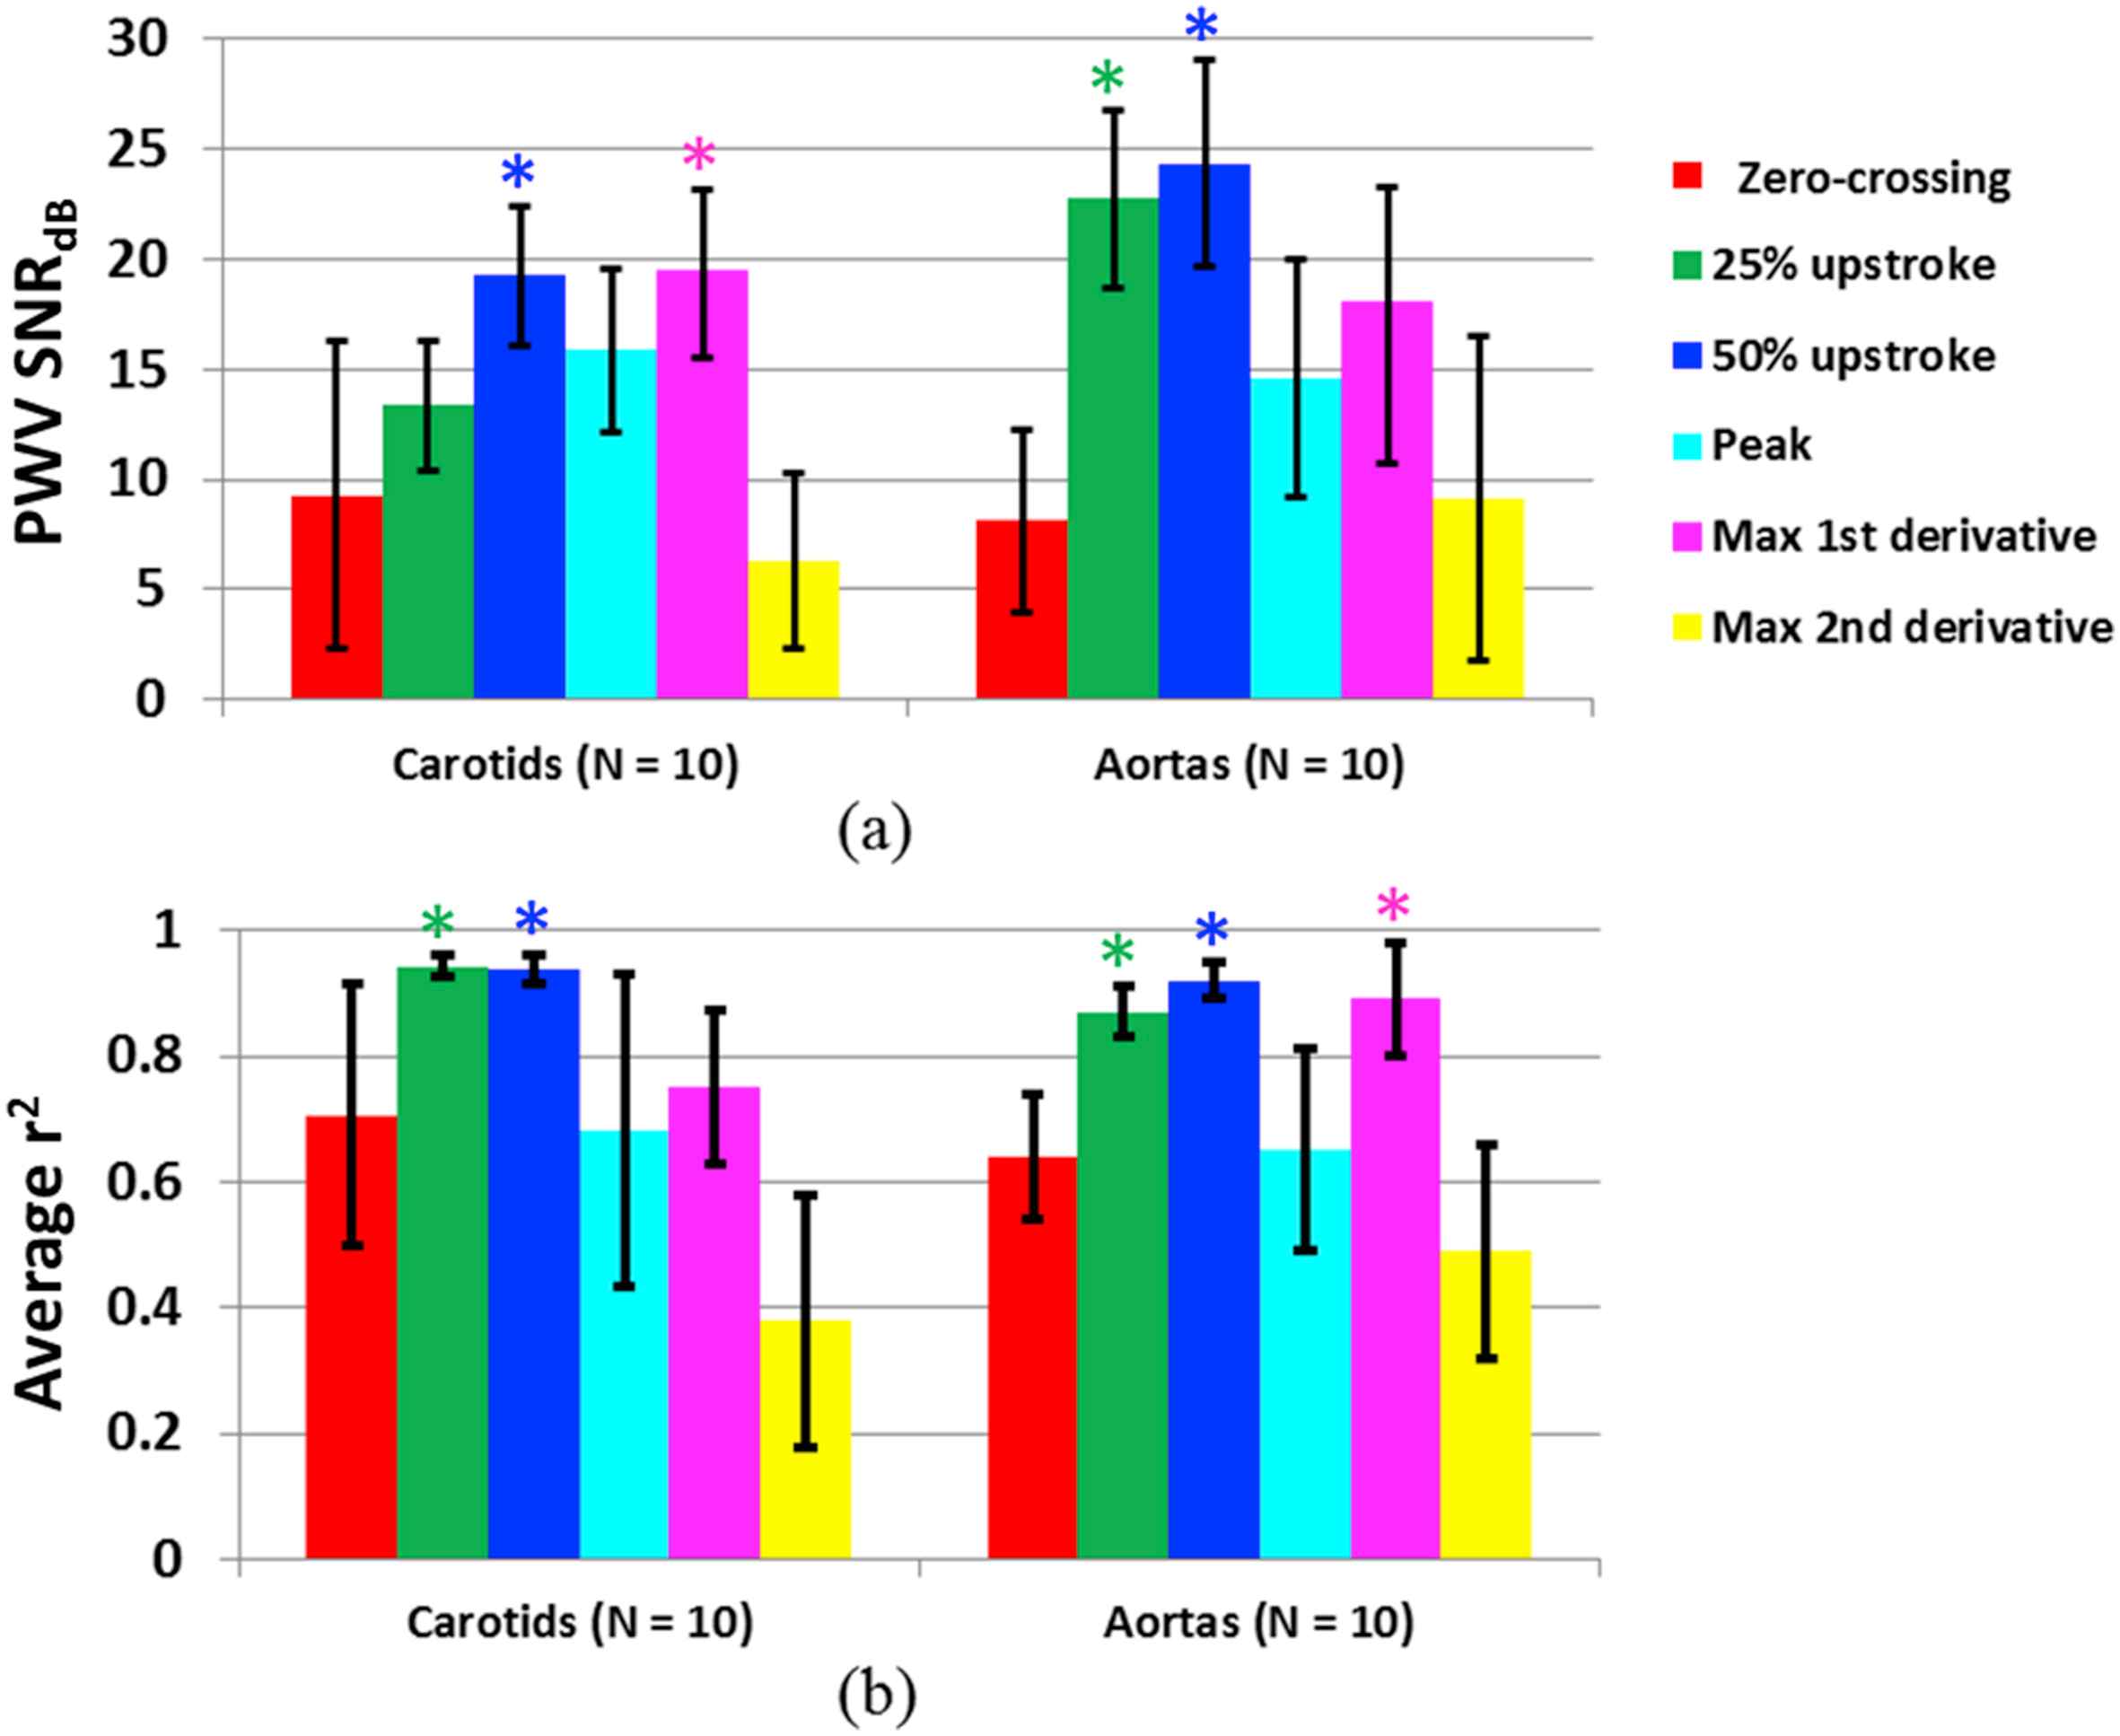
(a) SNR of the PWV measurement and (b) magnitude of the r2 value from tracking each of the six waveform features (i.e. zero-crossing, 25% upstroke, 50% upstroke, peak, maximum first derivative, and maximum second derivative), averaged over n = 10 human carotid arteries and n = 10 human aortas in vivo. The PWV SNR and mean r2 for each tracking feature were obtained from averaging the PWV and r2 measurements over at least 10 cardiac cycles per subject. (*) indicates the tracking features that exhibited significantly higher (p < 0.05) PWV SNR and/or average r2 compared to the other features.
It is important to note that tracking different waveform features resulted in different mean PWVs when averaged over all 10 subjects. In the carotid arteries, the 25% upstroke, 50% upstroke, peak, and maximum first derivative yielded very similar PWVs of 4.61 ± 1.51 m/s, 4.76 ± 1.33 m/s, 4.83 ± 1.25 m/s, 4.25 ± 1.05 m/s, respectively. These four features also exhibited the highest PWV SNR and r2. The mean PWVs obtained from the zero-crossing and maximum second derivative were 5.74 ± 3.20 m/s and 3.05 ± 1.98 m/s, respectively. In the aortas, the mean PWVs averaged across all 10 subjects were 8.03 ± 4.15 m/s for the zero-crossing, 5.77 ± 1.35 m/s for the 25% upstroke, 5.62 ± 1.24 m/s for the 50% upstroke, 7.70 ± 4.65 m/s for the peak, 5.43 ± 1.78 m/s for the maximum first derivative, and 6.72 ± 5.47 m/s for the maximum second derivative. Again, the PWV values that were most similar to each other (25% and 50% upstroke and maximum first derivative) corresponded to the tracking features that exhibited the highest PWV SNR and r2.
Discussion
By mapping the pulse wave at numerous spatial positions and high frame rates over a single cardiac cycle, PWI may provide new avenues for pulse wave analysis and local PWV estimation in any major artery accessible by ultrasound. This parametric study was aimed at establishing a performance assessment framework to improve the clinical reliability of PWI for in vivo measurements. Since accuracy cannot be measured in vivo because the value of the ground truth PWV is unknown in a clinical setting, we must rely on the repeatability (PWV precision) and uniformity (r2 magnitude) to assess the reliability of the measurements.
The precision of the PWV measurement (i.e. PWV SNR) in both ex vivo canine aortas was highest with 24, 32 and 48 scan lines rather than 128 or 16, the maximum and minimum number of lines investigated in this study, respectively. This phenomenon demonstrates the balance between spatial and temporal resolution – sacrificing the frame rate to increase the number of scan lines, or vice versa, may result in decreased PWV SNR. The relatively low PWV SNRs at high scan line densities (64, 96, and 128) may be explained by the lower frame rates. Due to fewer temporal samples, the waveform at each spatial position along the vessel lacks detail and appears less smooth, resulting in greater variation of the 50% upstroke positions detected by the waveform feature tracking algorithm used in this study. Low frame rate data provides a limited number of points along each waveform with which to perform temporal upsampling, which may also result in greater feature tracking variability. In the cases of 24, 32, and 48 scan lines, each waveform contains more temporal information, facilitating more accurate detection of the true 50% upstroke. In the case of 16 scan lines, the relatively low PWV SNR may be attributed to fewer regression points due to decreased spatial resolution.
In addition to PWV SNR, r2 saturation also plays a role in determining the optimal combination of spatial and temporal resolution, as shown in Fig. 4. The frame rate and line density must both be high enough so that the likelihood of low r2 resulting from insufficient spatial and temporal resolution is minimized. Temporal interpolation serves to maximize the r2 magnitude when the frame rate is low. The ex vivo results in Figs. 5 and 6 indicate that for scan line quantities >32, temporal upsampling factors <8 may result in false (i.e. unsaturated) r2 values. Based on the results from both canine aortas, the optimal combination of parameters for PWVs ~2.5–3.5 m/s will likely be a scan line density between 0.63 (24/38) and 1.26 (48/38) lines/mm with a temporal upsampling factor of 4 or more.
The two ex vivo aortas came from two different canines and may also have been subject to different levels of tension, which may explain the difference in their PWV values. Because the specimens were embedded in a water bath for the ex vivo experiment, they were stretched to a certain length in order to minimize rigid motion. The effects of longitudinal stretch on pulse wave propagation are under investigation in ongoing studies.43 However, the goal of this experiment was to merely generate a pulse wave through the specimens and evaluate the reproducibility in each.
Complete validation of the beam sweep compensation scheme requires knowledge of the exact value of the ground truth PWV. This can be done through mechanical testing to find the Young’s modulus of the specimen and using the Moens–Korteweg equation to derive PWV. However, the Moens–Korteweg equation is based upon several major simplifying assumptions such as uniform vessel geometry and zero wave reflections2 which do not apply in our ex vivo experiments nor in vivo. Future work will focus on the utilization of pressure sensors and Doppler ultrasound to find the true reference PWV through flow velocity and pressure wave measurements in ex vivo canine aortas. Ongoing studies are also aimed at the implementation and performance assessment of PWI using plane wave ultrasound systems.
Previous studies have suggested that the foot or point of maximum upslope of the pressure waveform are best suited for the measurement of local PWV22,23 due to less interference from noise and reflections. In this study, normalized wall displacement waveforms were used instead of pressure waveforms. Our in vivo results indicated that for clinical PWI in normal human aortas and carotid arteries, tracking the 50% upstroke consistently yielded the most precise PWV measurements (highest PWV SNR) and most reliable r2 values (highest magnitude). The low PWV SNR from tracking the zero-crossing may be explained by the degree of separation between the waveforms. For example, the normalized displacement waveforms shown in Fig. 1e appear relatively close together near the zero-crossing, while exhibiting more separation in their upstrokes. The closer the waveforms are, the more difficult it is to distinguish them, which may explain the higher variability in the PWV values arising from tracking the zero-crossing. Similarly, the higher PWV SNR and r2 achieved from tracking the 25% and 50% upstrokes may be due to greater separation between the waveforms.
Identification of the max derivatives requires taking the gradients of the normalized displacement waveform. It is well known that the gradient operation results in displacement noise amplification.44 Figure 3 illustrates the noise that arises when performing the first and second gradient operations. The noise in the first derivative curve may cause shifts in the position of its peak, and the more severe noise in the second derivative curve renders peak identification unreliable. This may explain why the maximum first and second derivatives were not as precise as the 25% and 50% upstrokes.
The PWV is believed to vary over the cardiac cycle because different points on the waveform correspond to different levels of pressure exerted on the wall.2 For example, we would expect that tracking the peak would yield a higher mean PWV compared to the other features because we are following the wave during peak systole. This was the case in the aorta, but not the carotid artery. Tracking the zero-crossing (end diastole) yielded lower mean PWVs in the carotid arteries, but not the aorta. In both vessels, the 25% upstroke, 50% upstroke, and maximum first derivative yielded very similar PWVs because they all lie on the waveform upstroke (Fig. 3).
The waveform at any given site in the arterial tree is a combination of the incident wave and any reflected waves originating from further down the vasculature.2 This means that the morphology of the waveform varies along the arterial tree, and tracking the same waveform feature at different imaging sites may yield different results. In addition to imaging location, the PWV and morphology may vary depending on the disease state. For the in vivo part of this study, efforts to standardize the imaging location across all subjects were made by scanning immediately upstream from the carotid and femoral bifurcations, which both serve as reflection-generating sites.1 Thus, it is possible that the in vivo results presented in this paper are specific to the standardized imaging location and the normal subject population. However, the scope of this paper was to form and test a theoretical and experimental basis on which to optimize the consistency and reliability of the PWI measurements. The framework that was introduced and implemented in this paper may be used in future studies to examine different imaging locations and disease states.
Conclusions
The conclusions from this paper serve to improve the clinical utility of PWI for more accurate diagnosis and characterization of cardiovascular disease based on pulse wave analysis. In cases of disease such as aneurysm and atherosclerosis, the altered geometry and mechanical properties of the vessel results in non-uniform pulse wave propagation patterns, and hence the PWV may vary within the imaged segment. By eliminating the imaging and signal processing factors that may contribute to imprecise PWV and low r2 measurements, we may be able to more reliably detect variations in disease cases.
Conflict of interest statement
The authors certify that they have no affiliations with or involvement in any organization or entity with any financial interest, or non-financial interest in the subject matter or materials discussed in this manuscript.
Acknowledgments
This work was supported in part by NIH R01HL098830. The authors would like to express their sincere thanks to Jianwen Luo, Ph.D. and Jonathan Vappou, Ph.D., both previously at Columbia University and currently at CNRS-Strasbourg University, France, and Tsinghua University, China, respectively, for helpful discussions.
Appendix Theoretical framework for the tradeoff between spatial and temporal resolution
Previous PWI studies13,16 have recognized that orienting the transducer such that the pulse wave propagates opposite the direction of beam sweeping (i.e. reverse scan) is advantageous because it allows for a wider range of PWVs to be measured. Fig. S1 depicts the B-mode image from an ex vivo canine aorta. The entire field of view is covered by sweeping the ultrasound beam from left to right in the imaging plane (red arrow) so that K scan lines are acquired. In the reverse scan orientation, the pulse wave (pink) arrives at the lateral position insonicated by the Kth (i.e. right-most) beam and propagates towards the lateral position insonicated by the first (i.e. left-most) beam. If the pulse wave is captured at the Kth scan line position at time tK and arrives at the first scan line position after N frames, then the pulse transit time is equal to N/FR where is the frame rate. The time at which the first beam captures the pulse wave can be expressed as
However, this is the arrival time as “seen” by the imaging system, not the true arrival time. Since the ultrasound beam is being swept across the field of view as the pulse wave is propagating in the opposite direction, the travel time of the beam must be accounted for. In conventional ultrasound, the beam sweeping-induced time delay τ between each scan line is equal to the time to acquire one beam:
The pulse wave arrival time captured by the Kth beam is delayed by the time it takes to sweep the ultrasound beam across in the imaging plane, which is equal to (K-1)τ seconds. This means that to obtain the true arrival time detected at the first lateral position, the (K-1)τ term must subtracted:
The true pulse transit time is then expressed as:
Assuming a constant PWV throughout the imaged segment length L, the expected true PWV is expressed as
Eqn. (A5) can be used to evaluate the tradeoff between spatial and temporal resolution given a high r2. Assuming a fixed PWV, increasing the number of scan lines may provide more spatial samples to improve the sensitivity of the PWV measurement at the expense of lower frame rate and fewer temporal samples (i.e. N, the number of frames over which the pulse wave propagates). K, FR, and the transducer orientation are set prior to imaging and L is measured within the field of view, leaving N as the only parameter that varies depending on the PWV. Therefore, to establish the upper limit on the PWV measurement, the minimum number of temporal samples must be considered. For velocity measurement, the frame rate must be sufficiently high such that the pulse wave can be captured in at least two frames before it travels the length of the imaged segment (i.e. Nyquist rate). Substituting the condition N ≥ 2 into Eqn. (A5), we obtain the upper limit on the PWV measurement:
Any PWV measurement that exceeds the upper limits established by Eqn. (A6) may likely have arisen from aliasing due to insufficient frame rate and may be deemed invalid.
Appendix A
Supplementary data
Supplementary data related to this article can be found at
References
Cite this article
TY  - JOUR
AU  - Ronny X. Li
AU  - William Qaqish
AU  - Elisa E. Konofagou
PY  - 2015
DA  - 2015/07/22
TI  - Performance assessment of pulse wave imaging using conventional ultrasound in canine aortas ex vivo and normal human arteries in vivo
JO  - Artery Research
SP  - 19
EP  - 28
VL  - 11
IS  - C
SN  - 1876-4401
UR  - https://doi.org/10.1016/j.artres.2015.06.001
DO  - 10.1016/j.artres.2015.06.001
ID  - Li2015
ER  -