
Analysis of Vascular Aging in Arterial Hypertension – Population-based Study: Preliminary Results
Both authors contributed equally to this work.
- DOI
- 10.2991/artres.k.191201.001How to use a DOI?
- Keywords
- Aging; arterial hypertension; population study
- Abstract
Background: Arterial Hypertension (AH) is an uncertain and complex physiopathological disease with the Arterial Stiffness (AS) as one of the main cardiovascular alterations. Pulse Wave Velocity (PWV) is the gold standard marker for assessment of the vascular aging and an important predictor of cardiovascular risk.
Methods: Cross-sectional population-based studies, in the restricted area of Vale do Ogunjá, Salvador-Bahia. Sociodemographic data, through questionnaire and clinical data were obtained. A PWV was evaluated by applanation tonometry using the device SphygmoCor® (AtCor Medical Pty Ltd, New South Wales, Australia). Frequency and descriptive measurements of central and dispersion were obtained, and the Chi-square test to statistical analysis.
Results: PWV presented a higher mean in hypertensive patients (10.0 ± 2.2 m/s). There was a higher prevalence of AS in male individuals with advanced age and presence of risk factors. The prevalence ratio of AS was 3.7 times higher in hypertensive patients (p = 0.002; 95% CI: 1.6–8.5) and 7.5 times higher in patients aged above 40–74 years (p = 0.015; 95% CI: 2.4–23.1).
Conclusion: There was an important relation between AS and increased of PWV in the presence of hypertension. The relevance of this study is associated with the use of non-invasive clinical evaluation of PWV, contributing to improve morbidity and mortality in hypertensive patients.
HIGHLIGHTS
- •
Important association between arterial stiffness and arterial hypertension.
- •
Prevalence of arterial stiffness in the male gender, advanced age.
- •
Prevalence of arterial stiffness with high BMI, dyslipidemia and dysglycemia DM.
- •
Arterial stiffness associated to age, schooling level, BMI and arterial hypertension.
- •
- Copyright
- © 2019 Association for Research into Arterial Structure and Physiology. Publishing services by Atlantis Press International B.V.
- Open Access
- This is an open access article distributed under the CC BY-NC 4.0 license (http://creativecommons.org/licenses/by-nc/4.0/).
1. INTRODUCTION
Arterial Hypertension (AH) is an alteration to the cardiovascular system that presents a multifactorial genesis and an uncertain and complex physiopathology, characterized by a sustained Blood Pressure (BP) increase [1,2]. The diseases is presently established as one of the main causes of morbidity and mortality, including cerebrovascular accident, coronary artery disease, systemic atherosclerosis in other organs, arteriosclerosis, heart failure and chronic renal disease [3]. Hypertension is also an important modifiable risk factor for Cardiovascular Diseases (CVD) [4], responsible for 17 million deaths worldwide [5], a high frequency of hospitalizations, early retirement and absenteeism, evidencing an important socioeconomic cost [6,7].
In 2000, 26.4% (972 million) of the adult population worldwide presented a diagnosis of AH, and for 2025 it is expected to reach 29.2% [8]. In Brazil, it is estimated that the disease is present in around 32.5% (36 million) of the adult population, with a prevalence of 68% in the elderly population [2,6]. In a population study in Salvador analyzing 1439 individuals, AH prevalence was of 29.9% [9].
One of the main vascular disorders of AH is Arterial Stiffness (AS) which has, for the last two decades, become a new and important cardiovascular risk definer, associated mainly to age and the incidence of CVD [10,11]. AS is caused by the chronological vascular aging, a physiological process that begins in the uterine phase, gaining prominence as of 30 years of age [12].
The loss of elastin from the medium layer and subsequent collagen deposition, increased glycosaminoglycans, stiffness of the cells of the vascular smooth muscle cells and the loss of proteolytic enzymes acting on vascular remodeling [13–15] decrease the complacency of the arteries, increasing the propagation of the energy pulse wave, its velocity in the vascular bed and its range [18,19].
When facing peripheral resistances or bifurcations, this wave is reflected reaching the heart during diastole. However, with the increased AS, the wave reaches the heart during the systole, raising the central and peripheral pressures, transmitting pulse energy to the target organs, reducing coronary perfusion and perpetuating stiffness [18,19]. This pressure wave may be assessed through its velocity, known as Pulse Wave Velocity (PWV) [20], a vascular damage biomarker [19] and gold-standard for assessing arterial stiffness, using preferably the applanation tonometer [17,20].
Pulse wave velocity proves to be a cardiovascular risk predictor and assists in the risk classification of the individuals [20]. Studies demonstrated that for every increase of 1 m/s in PWV, there is a 14% increase of CVD or any other cause increases in 15% [21]. There is a strong correlation between PWV with age and BP [15,22], however various other risk factors can accelerate AS and vascular aging such as the BP increase, dyslipidemias, diabetes, smoking, inflammatory processes, oxidative stress and endothelium dysfunction [12,23,24].
The cause-effect relation between AS and AH is still subject to much debate, with the hypothesis that increased blood pressure leads to increased arterial stiffness and consequently to increased blood pressure. However, some studies demonstrate that AS acts as a predictor for the future development of AH [12].
Pulse wave velocity measurement brings benefits to the clinical assessment of individuals, mainly those with hypertension, and the impacts of risk factors on vascular aging. For this reason this study is important in order for the information to be used as a reliable non-invasive clinical assessment of vascular aging. PWV has its use restricted to a specific group of individuals, low accessibility and not financed by public health system. Population studies can help to popularize its use as a widespread, accessible, precise and replicable tool.
The aim of this study is to analyze the relationship between arterial hypertension and arterial stiffness, compare the PWV between the hypertensive and non-hypertensive patients, analyze the relationship between arterial stiffness with gender and age, and demonstrate the influence of glycaemia, dyslipidemia and the smoking on arterial aging.
2. MATERIALS AND METHODS
This study is part of a project “Association between visceral obesity syndrome or metabolic syndrome, low intensity chronic inflammation and arterial stiffness”.
2.1. Study Design
A cross-sectional exploratory, population-based study carried out during the period of (12/05/2016) to (05/31/2019).
2.2. Population
Referred to the area assigned to the Vale do Ogunjá, within the Acupe de Brotas neighborhood, located in the metropolitan region of Salvador-Bahia. It is divided into 12 census sectors by Brazilian Institute of Geography and Statistics (IBGE) which, in accordance to the 2010 Census [25] encompasses 7450 individuals of ages equal to or over 18 years. Of these, 4181 women (56%) and 3269 men (44%). All of the borders of the area were excluded due to the confirmation of buildings that are different from the core of the area, often commercial buildings. A random sample was performed with the 12 census sectors used as guides in the draw made in a proportional manner to the number of residences of each sector. Initially the side of the street of choice is drawn in order to establish a proportion to fulfill the total sample of the road and then the residents of the homes are chosen. When necessary a draw is made of the floor within a building and within the homes contained on the floor. Our sample comprised a total of 151 individuals of ages 18 or over, regardless of gender, all of whom signed the free and informed consent form. Pregnant women, bedridden individuals and those with locomotion difficulty were excluded, as well as those who did not live in the homes and those who refused to participate.
2.3. Data Production Instruments
Forms containing individual and sociodemographic information (gender; age groups in individuals of ages under 40, between 40 and 75 years and those over 74 years of age; self-referred skin color; civil status; schooling level considered as complete and incomplete higher education as high, complete and incomplete secondary education as average and complete and incomplete elementary education as low) were filled-out.
Blood pressure level measurements were taken at the Centro Integrado de Ensino e Saúde (FTC clinic at Vale do Ogunjá) using the Omron 110 HBP automatic device, validated internationally [26,27] and measured with “standard adult” and “large adult” cuffs. Three measurements were taken on the left arm, with individuals in dorsal decubitus with at least 5 min of rest, without having consumed caffeine, smoked and the individual having been guided to empty the bladder.
There were 2-min intervals between the first and second measurement and of 1 min between the second and third measurement. The first measurement is disregarded, and the average of the other two measurements registered. Hypertensive individuals were considered as those with the diagnosis of AH and/or the use of anti-hypertensive medications, as well as individuals with blood pressures equal or over 180/110 mmHg in one sole measurement [6].
Anthropometric measurements (weight and height) were performed using standard calibrated anthropometric scales certified by the National Institute of Metrology, Quality and Technology (INMETRO) for the Body Mass Index (BMI), categorized using the standard established by the WHO [28]. Weight shall be determined in kilograms and height in meters, using the Welmy® calibrated electronic scale with stadiometer.
The material for complementary blood exams shall be collected at the same unit, with a 12-h or more fasting period. The biochemical analyses of fasting glycaemia and lipid profile (total cholesterol, fractions and triglycerides), were performed using the automatized method, with immunochemical and immunoassay techniques (A25 system, BIOSYSTEMS SA, Barcelona, Spain). Dysglycemia was considered for individuals with glycaemia of over 100 mg/dl and diabetes for individuals with prior diagnosis of Diabetes Mellitus (DM) and/or glycaemia equal to or over 126 mg/dl.
The values of reference for dyslipidemia were considered as: Low Density Lipoprotein-cholesterol greater or equal to 160 mg/dl and/or Triglycerides (TG) over or equal to 150 mg/dl and/or high density lipoprotein under or equal to 40 mg/dl for men and under or equal to 50 mg/dl for women [29].
2.4. Pulse Wave Velocity
Pulse Wave Velocity was measured using SphygmoCor® (AtCor Medical Pty Ltd, New South Wales, Australia) applanation tonometry, calibrated with the software that accompanies the equipment. It uses a tangent intersection algorithm and is considered as gold-standard for AS assessment [30]. ECG with three leads is connected to the individual. With the use of an inelastic tape measurer a direct measurement was made from the point of greatest incursion of the carotid artery, preferably on the right side of the neck up to the point of greatest incursion of the femoral pulse. Initially the measurement of the PWV is taken at the carotid artery assessing amplitude and satisfactory form, and then the PWV measurement of the femoral artery, with the same requirements. This technique defines the direct carotid-femoral measurement (cf-PWV). After reading the results of the analysis, these are computed using the software. The pulse wave velocities of the carotid and femoral arteries shall be measured soon after the QRS complex of the ECG and the time taken from the carotid artery to the femoral artery in consecutive waves is calculated automatically using the SphygmoCor, assessing the different specific aspects of the arterial wave form on the central proximal (carotid) and central distal (femoral) levels. The value is multiplied by 0.8 (correction factor), accepting as borderline after the correction of a cf-PWV value under 10 m/s and standard deviation of under 10% in order for the measurement to be validated, in accordance with the 2012 consensus [30].
2.5. Data Processing and Analysis
The data was input on a Microsoft Excel© 2016 Microsoft Corporation spreadsheet, subsequently exported to the Stata v.12© Copyright 2011 StataCorp LLC. Descriptive measures were used of central values and of dispersion (mean, standard deviation, median and interquartile range) and distribution of univariate and bivariate frequencies. To verify proportional differences among the groups, the Pearson Chi-square and Fisher’s Exact tests were used (for frequencies below 5) for the nominal categorical variables and the ordinal categorical variables. Prevalence was used as a measure of occurrence and the prevalence ratio (PR) and respective confidence intervals as measure of association, estimated in accordance with the odds ratio (OR) using binary logistic regression. The statistical significance level used was of 5%.
2.6. Ethical Aspects
The project complies with the Helsinki Declaration (Helsinki VII) having been submitted and approved by the Research Ethics Committee of UniFTC, registration number 1827621 in accordance with the ethical principles of Resolution 466/2012 of the National Health Council. All concerns with safety and confidentiality of the information were assured. Before the interviews the whole research process was explained, and the free and informed consent form was signed by all the individuals who accepted to take part in the study. The results of the exams are delivered together with a brief report.
3. RESULTS
The sample comprised 151 individuals with predominance for the female gender (70.2%), of ages between 40 and 74 years (55.6%) and average schooling level (46.4%). The civil status, self-referred skin color and smoking variables were assessed on 150 individuals, predominantly single (44.7%), self-declared black/brown (79.3%) and non-smokers (90.7%). Biochemical exams were performed on 148 individuals, with predominance for individuals without dyslipidemia (83.8%), dysglycemia or diabetes (66.2%). Anthropometric measurements were performed on 147 individuals with predominance for eutrophic individuals (38.5%), as observed on Table 1.
| Variables | Hypertension | Total, n (%) | p-value | |
|---|---|---|---|---|
| Non-hypertensive individuals, n (%) | Hypertensive individuals, n (%) | |||
| Gender (n = 151) | ||||
| Female | 71 (67.6) | 35 (76.0) | 106 (70.2) | 0.295a |
| Male | 34 (32.4) | 11 (23.9) | 45 (29.8) | |
| Age group (n = 151) | ||||
| <40 years | 47 (44.8) | 10 (21.7) | 57 (37.8) | 0.005c |
| 40–74 years | 53 (50.5) | 31 (67.4) | 84 (55.6) | |
| ≥75 years | 5 (4.8) | 5 (10.9) | 10 (6.6) | |
| Self-referred skin color (n = 150) | ||||
| White | 18 (17.1) | 7 (15.6) | 25 (16.7) | 1b |
| Black/Brown | 83 (79.0) | 36 (80.0) | 119 (79.3) | |
| Other | 4 (3.8) | 2 (4.4) | 6 (4.0) | |
| Civil status (n = 150) | ||||
| Married/Common-law marriage | 45 (43.3) | 17 (37.0) | 62 (41.3) | 0.191a |
| Single | 48 (46.2) | 19 (41.3) | 67 (44.7) | |
| Divorced/Widow(er) | 11 (10.6) | 10 (21.7) | 21 (14.0) | |
| Schooling level* (n = 151) | ||||
| Low | 25 (23.8) | 14 (30.4) | 39 (25.8) | 0.073a |
| Average | 45 (42.9) | 25 (54.4) | 70 (46.4) | |
| High | 35 (33.3) | 7 (15.2) | 42 (27.8) | |
| Dyslipidemia (n = 148) | ||||
| No | 83 (81.4) | 41 (89.1) | 124 (83.8) | 0.236a |
| Yes | 19 (18.6) | 5 (10.9) | 24 (16.2) | |
| Smoking (n = 150) | ||||
| No | 93 (89.4) | 43 (93.5) | 136 (90.7) | 0.552b |
| Yes | 11 (10.6) | 3 (6.5) | 14 (9.3) | |
| Dysglycemia/DM (n = 148) | ||||
| No | 74 (72.6) | 24 (52.2) | 98 (66.2) | 0.024b |
| Yes | 28 (27.5) | 22 (47.8) | 50 (33.8) | |
| BMI (n = 147) | ||||
| Eutrophic/Normal | 40 (38.5) | 10 (25.8) | 50 (33.8) | 0.028b |
| Overweight | 38 (37.3) | 16 (34.8) | 54 (36.5) | |
| Obesity | 24 (31.2) | 20 (12.9) | 44 (29.7) | |
| PWV (n = 131) | ||||
| Normal | 78 (82.1) | 20 (55.6) | 98 (74.8) | 0.002a |
| High | 17 (17.9) | 16 (44.4) | 33 (25.2) | |
Pearson Chi-square test.
Fisher’s exact test.
Chi-square trend test.
Complete and incomplete schooling levels were aggregated to a same category.
PWV, adjusted pulse wave velocity; DM, diabetes mellitus; BMI, body mass index.
Proportional distribution of Arterial Hypertension in accordance with the sociodemographic and clinical characteristics of individuals treated at the Centro Integrado de Ensino e Saúde (FTC Clinic at Ogunjá), Salvador-Bahia, 2019
When stratifying the sample into two separate groups (hypertensive and non-hypertensive), the only variable with a proportional distribution difference between the hypertensive individuals in relation to the total sample, was the BMC with predominance of the overweight group (37.3%), in the non-hypertensive group there were no alterations to any of the variables. The PWV was assessed in all of the individuals; nevertheless 20 of them presented exams of unsatisfactory quality, resulting in a sample of 131 individuals. The losses referred to 30% among the individuals of the age group ≥75 years, among the age group 40–74 years the loss was reduced to 15%, and of only 7% for individuals of the age group <40 years. There was predominance of PWV in normal values (<10 m/s) for all of the studied groups (Table 1).
Proportional differences were statistically significant among the hypertensive and non-hypertensive groups for the variables of age group (p = 0.005), glycaemia (p = 0.024), BMI (p = 0.028) and PWV (p = 0.002). However, the variables gender, self-referred skin color, civil status, schooling levels, dyslipidemia and smoking use were proportionally homogeneous (p > 0.05) (Table 1). With reference to the group of individuals with arterial stiffness (PWV ≥ 10 m/s), there is predominance of the female gender (60.6%), age group ≥75 years (51.5%), self-declared black/brown (78.8%), civil status married/common-law marriage (46.9%), average schooling level (51.5%), BMI with overweight (61.3%), glycaemia without abnormality (70.5%) and absence of hypertension (51.5%). The statistically significant variables were age group (p = 0.001), BMI (p = 0.010) and AH (p = 0.002).
The average age group of the total sample was of 47.0 (± 16.0) years. In relation to the group of hypertensive individuals, there was an average age group of 53.5 (± 14.3) years, while the average age of the non-hypertensive group was of 44.6 (± 16.0) years. PWV presented a higher average for hypertensive individuals (10.0 ± 2.2 m/s), around 119% higher than the average for non-hypertensive individuals (8.4 ± 2.2 m/s). Fasting glycaemia presented an average of 102.6 (± 31.6) mg/dl for the total sample. Hypertensive individuals had an average of 107.1 (± 29.2), greater than non-hypertensive individuals (100.8 ± 32.4 years) (Table 2).
| Variables | Non-hypertensive individuals | Hypertensive individuals | Total |
|---|---|---|---|
| Agea | 95 (44.6 ± 16.0) | 36 (53.5 ± 14.3) | 131 (47.0 ± 16.0) |
| PWVb | 95 (8.4 ± 2.2) | 36 (10.0 ± 2.2) | 131 (8.8 ± 2.3) |
| Fasting glycaemiac | 92 (100.8 ± 32.4) | 36 (107.1 ± 29.2) | 128 (102.6 ± 31.6) |
Measures described in n (mean ± standard deviation).
Average age in years.
PWV, adjusted pulse wave velocity, measured in m/s.
Measured in mg/dl.
Relation of descriptive measures for the variables of age, PWV and Fasting Glycaemia through diagnosis of Arterial Hypertension of individuals treated at the Centro Integrado de Ensino e Saúde (FTC Clinic at Ogunjá), Salvador-Bahia, 2019
A higher prevalence of arterial stiffness can be observed in individuals of the male gender (31%), age group between 40 and 74 years (38%), white skin color (27%), civil status divorces/widower (33%) and low level of schooling (34%). For individuals presenting dyslipidemia there was a higher prevalence of arterial stiffness (33%), differently to what occurred in smokers, which showed a higher prevalence of AS in non-smoking individuals (26%). There was a 33% prevalence of stiffness among the individuals with alterations to glycaemia, while the BMI indicating overweight demonstrated 39% prevalence, the highest in the category. Hypertensive individuals presented arterial stiffness prevalence of 44%, while the non-hypertensive individuals of only 18% (Table 3).
| Variables | Arterial stiffness | Arterial hypertension | ||
|---|---|---|---|---|
| Prev (%) | PRagross (95% CI) | Prev (%) | PRagross (95% CI) | |
| Gender | ||||
| Female* | 22 | 1.0 | 33 | 1.0 |
| Male | 31 | 1.5 (0.7–3.5) | 24 | 0.7 (0.3–1.4) |
| Age group | ||||
| <40 years* | 8 | 1.0 | 18 | 1.0 |
| 40–74 years (p-value: 0.015; 0.000) | 38 | 7.5 (2.4–23.1) | 37 | 2.7 (1.2–6.2) |
| ≥75 years (p-value: 0.032) | 29 | 4.9 (0.7–3.7) | 50 | 4.7 (1.1–19.3) |
| Self-referred skin color | ||||
| White* | 27 | 1.0 | 28 | 1.0 |
| Black/Brown | 25 | 0.9 (0.3–2.6) | 30 | 1.1 (0.4–2.9) |
| Other | 17 | 0.5 (0.1–5.5) | 33 | 1.2 (0.2–8.6) |
| Civil status | ||||
| Married/Common-law marriage* | 26 | 1.0 | 27 | 1.0 |
| Single | 21 | 0.7 (0.3–1.7) | 28 | 1.0 (0.5–2.3) |
| Divorced/Widow(er) | 33 | 1.4 (0.4–4.8) | 48 | 2.4 (0.9–6.7) |
| Schooling level | ||||
| Low (p-value: 0.036) | 34 | 3.5 (1.1–11.7) | 36 | 2.8 (1.0–7.9) |
| Average | 28 | 2.6 (0.9–8.0) | 36 | 2.7 (1.0–7.2) |
| High* | 13 | 1.0 | 17 | 1.0 |
| Dyslipidemia | ||||
| No* | 24 | 1.0 | 33 | 1.0 |
| Yes | 33 | 1.6 (0.6–4.3) | 21 | 0.5 (0.2–1.5) |
| Tobacco use | ||||
| No* | 26 | 1.0 | 32 | 1.0 |
| Yes | 23 | 0.87 (0.2–3.3) | 21 | 0.6 (0.2–2.2) |
| Dysglycemia/DM | ||||
| Normal* | 22 | 1.0 | 24 | 1.0 |
| Diabetic (p-value: 0.017) | 33 | 1.8 (0.8–4.0) | 44 | 2.4 (1.2–4.99) |
| IMC | ||||
| Eutrophic/Normal* | 18 | 1.0 | 25 | 1.0 |
| Overweight (p-value: 0.002) | 39 | 0.6 (0.2–2.3) | 42 | 3.3 (1.3–8.3) |
| Obesity (p-value: 0.028) | 12 | 2.9 (1.1–7.6) | 83 | 1.7 (0.7–4.2) |
| AH | ||||
| No* | 18 | 1.0 | – | – |
| Yes (p-value: 0.002) | 44 | 3.7 (1.6–8.5) | – | – |
| PWV | ||||
| Normal | – | – | 20 | 1.0 |
| Elevated (p-value: 0.002) | – | – | 48 | 3.7 (1.6–8.5) |
Category of reference.
Prevalence ratio: estimated in accordance with the Odds Ratio using the binary logistic regression.
PWV, adjusted pulse wave velocity; DM, diabetes mellitus; AH, arterial hypertension; Prev., prevalence; PR, prevalence ratio.
Association between arterial stiffness and the diagnosis of arterial hypertension with the sociodemographic and clinical characteristics of the individuals treated at the Centro Integrado de Ensino e Saúde (FTC Clinic at Ogunjá), Salvador-Bahia, 2019
The AS prevalence ratio in individuals of ages between 40 and 74 years is 7.5 times superior to individuals of under 40 years of age (p = 0.015; 95% CI: 2.4–23.1). Individuals with low schooling levels presented 3.5 greater chances of AS than those with high schooling levels (p = 0.036; 95% CI: 1.1–11.7). Among the obese individuals, the chance of presenting AS is 2.9 times greater than for eutrophic individuals (p = 0.028; 95% CI: 1.1–7.6). For hypertensive individuals, the risk of presenting AS was 3.7 times greater than for the non-hypertensive individuals (p = 0.002; 95% CI: 1.6–8.5), as observed in Table 3.
In relation to AH there was a higher prevalence among individuals of the female gender (33%), over 74 years of age (50%), self-referred skin color as other (33%), civil status divorced/widow (48%) and low to average schooling levels (36%). Among the individuals with dyslipidemia, hypertension diagnosis had 33% of prevalence; non-smoking individuals presented a higher prevalence of AH (32%). Both in the case of dyslipidemia as well as in overweight the prevalence of AH was high (44% and 83%, respectively) and in relation to arterial stiffness, hypertension was 48% prevalent among individuals with high PWV, equivalent to approximately 485 cases for every 1000 hypertensive individuals (Table 3).
Individuals of ages between 40 and 74 years presented 2.7 times greater chances of the occurrence of AH than individuals <40 years (p = 0.015; 95% CI: 1.2–6.2). For individuals of age group ≥75 years the chances were 4.7 times higher (p = 0.032; 95% CI: 1.1–19.3). For individuals presenting dysglycemia or DM, the chances of presenting hypertension are 2.4 times greater than for non-diabetic individuals (p = 0.017; 95% CI: 1.2–4.99). Overweight individuals demonstrated 3.3 higher chances of the occurrence of AH than eutrophic individuals (Table 3).
When comparing PWV and age stratified by the diagnosis of hypertension, it is possible to infer that the PWC median is higher than for all the age groups for hypertensive individuals in relation to non-hypertensive individuals (8.6 ± 1.5; 10.2 ± 3.0; 10.5 ± 6.5 vs. 7.2 ± 1.8; 8.9 ± 3.1; 8.8 ± 1.9, respectively). Emphasis is given mainly to the age groups ≥40 years for hypertensive individuals, where the median was above the amount considered as normal for PWV, a result that is different to the one of the group of non-hypertensive individuals, where all of the age groups presented 50% of the values below 10 m/s (Figure 1).
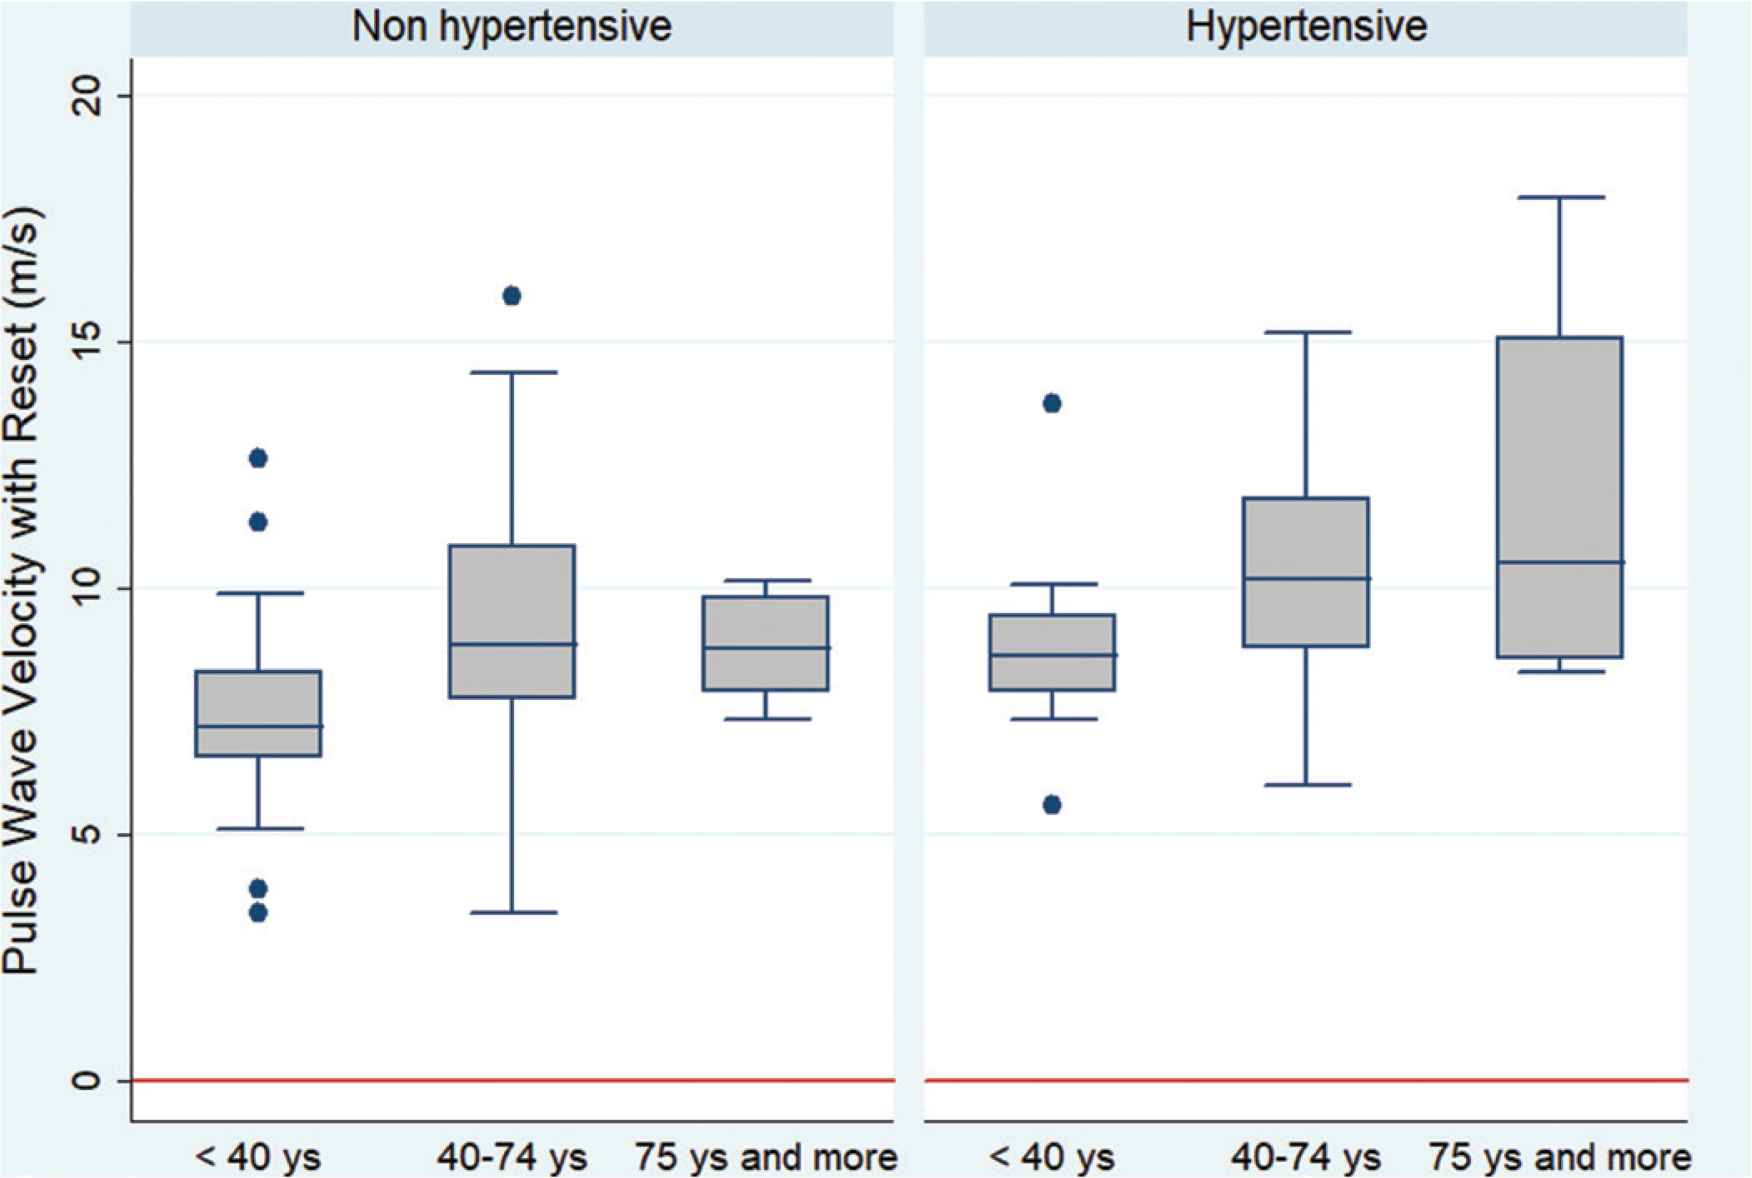
Interquartile distribution and comparison of the pulse wave velocity among the age groups stratified by the hypertension diagnosis of individuals treated at the Centro Integrado de Ensino e Saúde (FTC Clinic at Ogunjá), Salvador-Bahia, 2019.
4. DISCUSSION
Our study was able to evidence a greater prevalence of arterial stiffness among hypertensive individuals, demonstrating a statistically significant association among them. Consonant to the literature in which AH and high blood pressure rates are associated to vascular aging, thus it is possible to infer that PWV is an important predictive factor of AH morbidity and mortality [23,24,31–34]. One of the possible biological explanation for the association between AH and PWV would be the BP causing an increase in AS and consequent increase in PWV, causing an increase to the blood pressure [10,12,16].
The present study demonstrated a higher prevalence of arterial stiffness for the male gender, which is compatible to the results presented in literature [35–38]. Smulyan et al. [37] demonstrated an important difference for PWV among the genders only during mid-life, with this difference disappearing over the years, which is also in accordance with Cunha et al. [38] which evidenced the reach of the PWV levels in individuals of the female gender to those of the male gender after 10 years. This fact can be explained by the greater care of the female gender regarding health, as well as a higher frequency of medical appointments [39]. This relation is also mentioned by Merz and Cheng [40] informing that individuals of the male gender have more pronounced AS than of the female gender up until the sixth decade, at which time women begin to have stiffer arteries due to hormone alterations brought about by menopause.
It is a consensus in literature that the progression of age is the main factor for the establishment of AS and AH is a potential increment [17,41]. In our study the age group with a higher prevalence of AS was of between 40 and 74 years, which is as expected once there is a progressive increase of PWV with age [36,37,42]. However, our results do not demonstrate an important prevalence of arterial stiffness in individuals of ages 75 years and more. These mismatching results may be justified by the technical difficulty of performing the PWV measurement on elderly individuals [30,43] and once this sample is reduced, small losses generate great interferences.
Self-declared white skin individuals had a higher prevalence of AS, which diverges from literature in accordance with the study by Wildman et al. [44] which demonstrated higher values of PWV in black skin individuals in a representative sample. There was also prevalence of AS in the civil status divorced/widow(er) and in low schooling levels; nevertheless literature lacks other studies involving these variables.
There was also a higher prevalence of arterial stiffness for individuals with dyslipidemia, which is concordant with the cohort study performed by Blacher et al. [31] with 710 individuals, demonstrating that the PWV values were higher in the presence of atherosclerosis, with cardiovascular risk increasing in the measure in which there is an increase in the PWV. Kubozono et al. [45] also demonstrated an association between early atherosclerosis and altered PWV, contrary to our study, which did not demonstrate such association. Arterial stiffness can be compromised by atherosclerosis involving not only biological senility, but various external factors capable of decreasing the complacency of the arteries, among which are dyslipidemia and consequent atherosclerosis [46]. According to McEniery et al. [47], based on the prospective study that accompanied 825 men for 20 years, there is an association between PWV and a high load of smoking, different to our results in which non-smoking individuals presented a higher prevalence of AS.
According to Safar et al. [48], there is an association between the risk factors and increased PWV in all of the age groups analyzed; furthermore, it was also demonstrated that the greater the number of risk factors of the individual, there will be a higher PWV. For individuals with DM, PWV is even higher. This study was in accordance with the systematic review carried out in 77 articles, constructed by Cecelja and Chowienczyk [49] which demonstrated a weak correlation between DM and PWV in 52% of the studies assessed. A study performed by Smulyan et al. [50] evaluated PWV in two separate groups: hypertensive and diabetic individuals and another group with only hypertensive individuals. For the same blood pressure level, a more pronounced increase in PWV was demonstrated for diabetic and hypertensive individuals. In the present study no association was demonstrated between DM and AS, only between DM and AH with increased prevalence of AH in the presence of DM or dysglycemia, and an average of the fasting glycaemia values for hypertensive individuals was greater than for non-hypertensive individuals. However, out study did not use glycated hemoglobin, considered as god-standard for the assessment of diabetes.
Kim et al. [51] stratified their sample among gender, diagnosis of hypertension, diabetes and smoking, demonstrating that the average PWV are greater among men, hypertensive individuals, diabetic individuals and smokers. In the present study, for hypertensive individuals there was a higher average of PWV in relation to non-hypertensive individuals. The present study also demonstrated an average of the total sample of PWV superior to the study by Cunha et al. [38] which can be explained by local sociodemographic and ethnical differences such as miscegenation and low socioeconomic conditions [52,53].
Apart from the factors assessed above, the research demonstrated the prevalence of PWV in the BMI, indicating overweight, which is explained by a study performed by Wildman et al. [44] who demonstrated that increase in weight has a direct relationship with the increase of PWV; and possibly due to the low number of obese individuals in our sample, it was not possible to observe this relationship with obese individuals.
The limitations of this study were common to cross-sectional studies, not being possible to relate to the cause and effect. Furthermore, we presented a preliminary “n” considering a study representing a community, and within this sample some variables had losses. The advantages presented by this study were the assessment of arterial stiffness by means of a non-invasive method measured using a gold-standard device, all of the individuals came from their own homes and there is the possibility for a future cohort study.
5. CONCLUSION
The present study concluded that there was an important relation between AS and AH, with an increase in PWV in the presence of hypertension. A higher prevalence of arterial stiffness was also demonstrated in individuals of the male gender, of advanced age and in the presence of risk factors. Vascular aging was mainly associated to age group, schooling level and BMI, apart from AH. The relevance of this paper is associated to the use of non-invasive clinical assessment of PWV permitting the investigation of alterations to the macro circulation, primarily subclinical, in hypertensive individuals and also permitting early changes in conduct. In this context, the use of this method permits the popularization of this took, making it accessible and reproducible.
CONFLICTS OF INTEREST
The author declare they have no conflicts of interest.
AUTHOR’S CONTRIBUTION
LBNCM contributed in study design, Conceptualization, DOS, CFSA and DB contributed in study design, Data curation, DOS contributed in study design, Formal analysis, LBNCM contributed in study design, Funding acquisition, JJOAC, RCAC and LBNCM, AAOAF, RLSL, DOS, CFSA, DB, LRB, ARS, BAS, CAV and MBR contributed in study design, Investigation, JJOAC, RCAC and LBNCM, AAOAF, RLSL contributed in study design, Methodology, LBNCM contributed in study design, Project administration, Resources: UniFTC, University Center of Science and Technology, DOS contributed in study design, Software, LBNCM and RLSL contributed in study design, Supervised the project, DOS contributed in study design, Validation, JJOAC, RCAC contributed in study design, Visualization, JJOAC, RCAC and LBNCM contributed in study design, Writing the manuscript (Original draft), JJOAC, RCAC, LBNCM, DOS and AAOAF contributed in study design, Writing (Review and editing), AAOAF, LRB, RLSL, ARS, BAS, CAV, MBR contributed in study design, Population study field work, RLSL, AAOAF and JJOAC contributed in study design, Laboratory of Pulse Wave Velocity.
FUNDING
This research did not receive any specific grant from funding agencies in the public, commercial, or not-for-profit sectors.
Footnotes
REFERENCES
Cite this article
TY  - JOUR
AU  - Juan Jailson Oliveira Almeida Costa
AU  - Roberta de Castro Araújo Cunha
AU  - Antonio de Assis Oliveira Alves Filho
AU  - Larissa Ribeiro Bessa
AU  - Rodrigo Lins Sant’Ana de Lima
AU  - Alana dos Reis Silva
AU  - Brenno Araújo e Souza
AU  - Catarina de Almeida Viterbo
AU  - Mariana Barreto Requião
AU  - Daniele Brustolim
AU  - Diorlene Oliveira da Silva
AU  - Lucélia Batista Neves Cunha Magalhães
AU  - Cecília Freitas da Silva Araújo
PY  - 2019
DA  - 2019/12/13
TI  - Analysis of Vascular Aging in Arterial Hypertension – Population-based Study: Preliminary Results
JO  - Artery Research
SP  - 131
EP  - 138
VL  - 25
IS  - 3-4
SN  - 1876-4401
UR  - https://doi.org/10.2991/artres.k.191201.001
DO  - 10.2991/artres.k.191201.001
ID  - Costa2019
ER  -