
The cardio-ankle vascular index predicts chronic kidney disease in Japanese subjects
- DOI
- 10.1016/j.artres.2012.11.004How to use a DOI?
- Keywords
- Cardio-ankle vascular index; Chronic kidney disease; Predictor; Atherosclerosis
- Abstract
Objective: Chronic kidney disease (CKD) is known to be associated with the incidence and mortality of cardiovascular disease. Therefore, the prevention of CKD may improve the mortality of cardiovascular disease. The risk factors of CKD are variable and multifactorial, similar to atherosclerosis. We hypothesized that the index of atherosclerosis predicts future CKD, and investigated the association between the cardio-ankle vascular index (CAVI), the index of arterial stiffness in part of atherosclerosis, and CKD occurrence in non-CKD patients.
Methods: Of the 1000 patients undergoing CAVI in our hospital from 2006 to 2007 without CKD, we followed renal function for 1 or more years in 369 patients. CKD was defined as an estimated glomerular filtration rate of <60 ml/min/1.73 m2.
Results: We divided our study patients into 4 groups according to their CAVI: <8.0 (n = 85), 8.0–9.0 (n = 75), 9.0–10.0 (n = 112), and ≥10.0 (n = 97), respectively. The differences in serum creatinine between baseline and follow-up were 0.09 ± 0.04, 0.11 ± 0.05, 0.17 ± 0.04 and 0.23 ± 0.04, respectively (the P value for the lowest group versus the highest group was 0.04). The age- and sex-adjusted odds ratios (95% confidential interval, P value versus the lowest group) for the occurrence of CKD were 1.13 (0.58–2.20, P = 0.09), 1.58 (0.85–2.94, P = 0.09), and 2.38 (1.23–4.61, P = 0.02). Even after multivariate adjustment, the relationship remained.
Conclusion: CAVI was found to be associated with future renal dysfunction, thus suggesting that a CAVI ≥10 may therefore be a risk factor for CKD in Japanese patients.
- Copyright
- © 2012 Association for Research into Arterial Structure and Physiology. Published by Elsevier B.V. All rights reserved.
- Open Access
- This is an open access article distributed under the CC BY-NC license.
Introduction
Chronic Kidney Disease (CKD) is a risk factor for cardiovascular disease.1–3 In Japan, Ninomiya et al. reported that CKD was an independent risk factor for the occurrence of cardiovascular disease in the general population.4 CKD progression results from a numbers of causes, including hypertension, diabetes, insulin resistance, metabolic syndrome, dyslipidemia, obesity, smoking habits, etc., as reported previously.5–11 On the other hand, these factors are also known as risk factors of atherosclerosis, and it has been suggested that there is an association between atherosclerosis and CKD. For this reason, it has been regarded that the index of atherosclerosis could predict the incidence of CKD. However, there have been few reports that mentioned the use of the index of atherosclerosis to predict CKD incidence.12,13 In this study, we addressed the association between the index of atherosclerosis and CKD incidence and by using the cardio-ankle vascular index (CAVI) as an index of arterial stiffness, in part of atherosclerosis. The CAVI was a new index of arterial stiffness.14 Previously, the pulse wave velocity (PWV) was established as an index of atherosclerosis, however, the PWV is affected by blood pressure.15 The CAVI is a stiffness parameter which is independent one of blood pressure calculated from heart-ankle PWV and blood pressure.16
We investigated our outpatients by measuring the CAVI in our hospital and herein discuss whether CAVI can predict the future risk of CKD.
Methods
Subjects
From January 2006 to January 2007, 1000 patients with hypertension, diabetes, dyslipidemia, or a history of cardiovascular disease were measured for their CAVI to determine the status of atherosclerosis in our hospital. After obtaining informed consent, we excluded 458 patients who already had been diagnosed with CKD (glomerular filtration rate <60 ml/min/1.73 m2 and dipstick positive proteinuria), 37 patients who were likely to have peripheral arterial disease (ankle-brachial index <0.9). Five hundred and five patients were enrolled in this study.
The subjects who gave their assent to participate in the present study, which examined the association between the CAVI and the prognosis of kidney function, were included in the current series. This study was performed with the ethics committee’s approval. The purpose of the study was explained to all patients who participated. In addition, the patients had the right to refuse to participate in this study.
Follow-up
The subjects were followed-up at intervals of 1 or 2 months in our outpatient department from January 2006 to December 2008. The patient health status was checked during each follow-up, and was recorded using electronic clinical records. Additionally, blood and urine samples were collected at each follow-up examination, so that we could check the kidney function of our participants. In this period, 42 patients had cardiovascular event (30 strokes and 12 coronary artery disease), and we excluded 94 patients because of insufficient follow-up. Finally we analyzed the data from 369 patients.
Definition of chronic kidney disease
We defined occurrence of CKD as cases with newly onset of dipstick positive proteinuria and declining of GFR below 60 ml/min/1.73 m2 according with the Japanese Society for Nephrology. And to analyze the effect of renal function itself on the relative risk of progression of CKD, we defined CKD stage I as a GFR >90 ml/min/1.73 m2 and CKD stage II as 60 <a GFR <90 based on the initial GFR.
Proteinuria was measured via dipstick urinalysis in a central laboratory, and results were categorized as being positive (1+ or more) or negative for proteinuria. We estimated the glomerular filtration rate (GFR) using the simplified prediction equation for Japanese, as recently proposed by the Japanese Society for Nephrology17: eGFR = 194 × Cr−1.094 × Age−0.287 × 0.739 (if female).
Measurement of the CAVI
The CAVI was recorded using a VS-1000 instrument (Fukuda Denshi, Tokyo, Japan) with the patients in the supine position after five minutes of rest. ECG electrodes were placed on both wrists, a microphone for detecting heart sounds was placed on the sternum, and cuffs were wrapped around both the arms and ankles.
The blood pressure and the pulse wave were measured by pressurizing the four points at the same time. Moreover, the phonocardiogram was measured at the same time on 2nd left sternal borders, and the time from the starting 2nd sound to dichrotic notch of the brachial pulse wave, which is theoretically equal to the traveling time of pulse wave from aortic valve to brachial, to the attainment of the pulse wave was measured. The averages of the right and left CAVI values were used for the analyses.
The cut-off levels of the CAVI for estimating atherosclerosis have not been defined because the CAVI is a relatively new method. We divided our subjects into 4 groups according to their CAVI: <8.0, 8.0–9.0, 9.0–10.0, and ≥10.0.
Relevant factors
The pulse rate and blood pressure were measured at rest, simultaneously with the measurement of CAVI. Hypertension was defined as a blood pressure of ≥140/90 mmHg greater, or the current use of antihypertensive agents. Patient height and weight were measured at the time of CAVI measurement, and the body mass index (BMI: kg/m2) was calculated as an index of obesity. We defined obesity as a BMI ≥25.0. Blood samples were collected from veins within a month of the time of CAVI measurement. Dyslipidemia was defined as low-density lipoprotein-cholesterol (LDL-C) ≥3.62 mmol/L, triglyceride ≥1.69 mmol/L, high-density lipoprotein-cholesterol (HDL-C) <1.03 mmol/L or the current use of lipid-lowering drugs. Diabetes mellitus was defined by fasting blood sugar (FBS) ≥7.0 mmol/L, hemoglobin A1c (HbA1c) ≥6.5% or the use of hypoglycemic agents. Current smokers were defined as habitual or not at the time of measurement of the CAVI.
Statistical analysis
For the statistical analyses, the SPSS software program ver. 13.0 was used. Differences among groups in the evaluated items were analyzed by the Cochran Mantel–Haenszel test. The mean values of the changes in serum creatinine and eGFR in the four CAVI groups were estimated using a generalized linear model. The relative risk in each group was calculated by logistic regression analysis, and P values <0.05 were considered to be statistically significant.
Results
The mean follow-up period was 22 ± 9 months. During the follow-up period, 160 patients developed CKD. Table 1 shows the baseline characteristics of the study subjects according to their CAVI levels. In the group with the higher CAVI, we found a trend for the patients to be older, have higher blood pressure and lower kidney function, BMI and prevalence of current smokers.
| CAVI | ||||
|---|---|---|---|---|
| <8.0 (n = 85) | 8.0–8.9 (n = 75) | 9.0–9.9 (n = 112) | 10.0 ≤ (n = 97) | |
| Age (years)a | 60 ± 11 | 64 ± 8 | 70 ± 8 | 73 ± 7 |
| Male (%) | 65 | 67 | 69 | 68 |
| eGFR (ml/min/1.73 m2)a | 82 ± 16 | 78 ± 13 | 76 ± 13 | 75 ± 13 |
| Follow-up (months) | 20 ± 8 | 22 ± 9 | 23 ± 8 | 23 ± 9 |
| BMI (kg/m2)a | 24 ± 4 | 24 ± 4 | 24 ± 3 | 22 ± 3 |
| Hypertension (%)a | 24 | 33 | 36 | 55 |
| SBP (mmHg)a | 125 ± 16 | 129 ± 19 | 134 ± 19 | 138 ± 17 |
| Diabetes (%)a | 27 | 36 | 33 | 51 |
| Dyslipidemia (%) | 57 | 49 | 60 | 59 |
| Current smoker (%)a | 28 | 19 | 11 | 19 |
Values are the means ± SD or frequencies.
CAVI: cardio-ankle vascular index; eGFR: estimated Glomerular filtration rate; BMI: body mass index.
P for trend <0.05.
Baseline characteristics of the study participants.
Figure 1 shows the changes in the serum creatinine levels (ΔsCr, mg/dl) between baseline and the latest follow-up point according to CAVI levels. The ΔsCr rose progres-sively with increasing CAVI levels: 0.09 ± 0.04, 0.11 ± 0.05, 0.17 ± 0.04 and 0.23 ± 0.04, respectively (P for trend = 0.01), and the ΔsCr in the subgroup with CAVI levels of ≥10 was significantly higher than in subjects with CAVI levels <8.0. A similar trend was shown in the change of the eGFR levels (ΔeGFR, ml/min/1.73 m2) between baseline and the latest follow-up point according to CAVI levels (Fig. 2): −9.9 ± 1.5, −10.2 ± 1.6, −11.7 ± 1.3 and −13.7 ± 1.4, respectively (P for trend = 0.04).
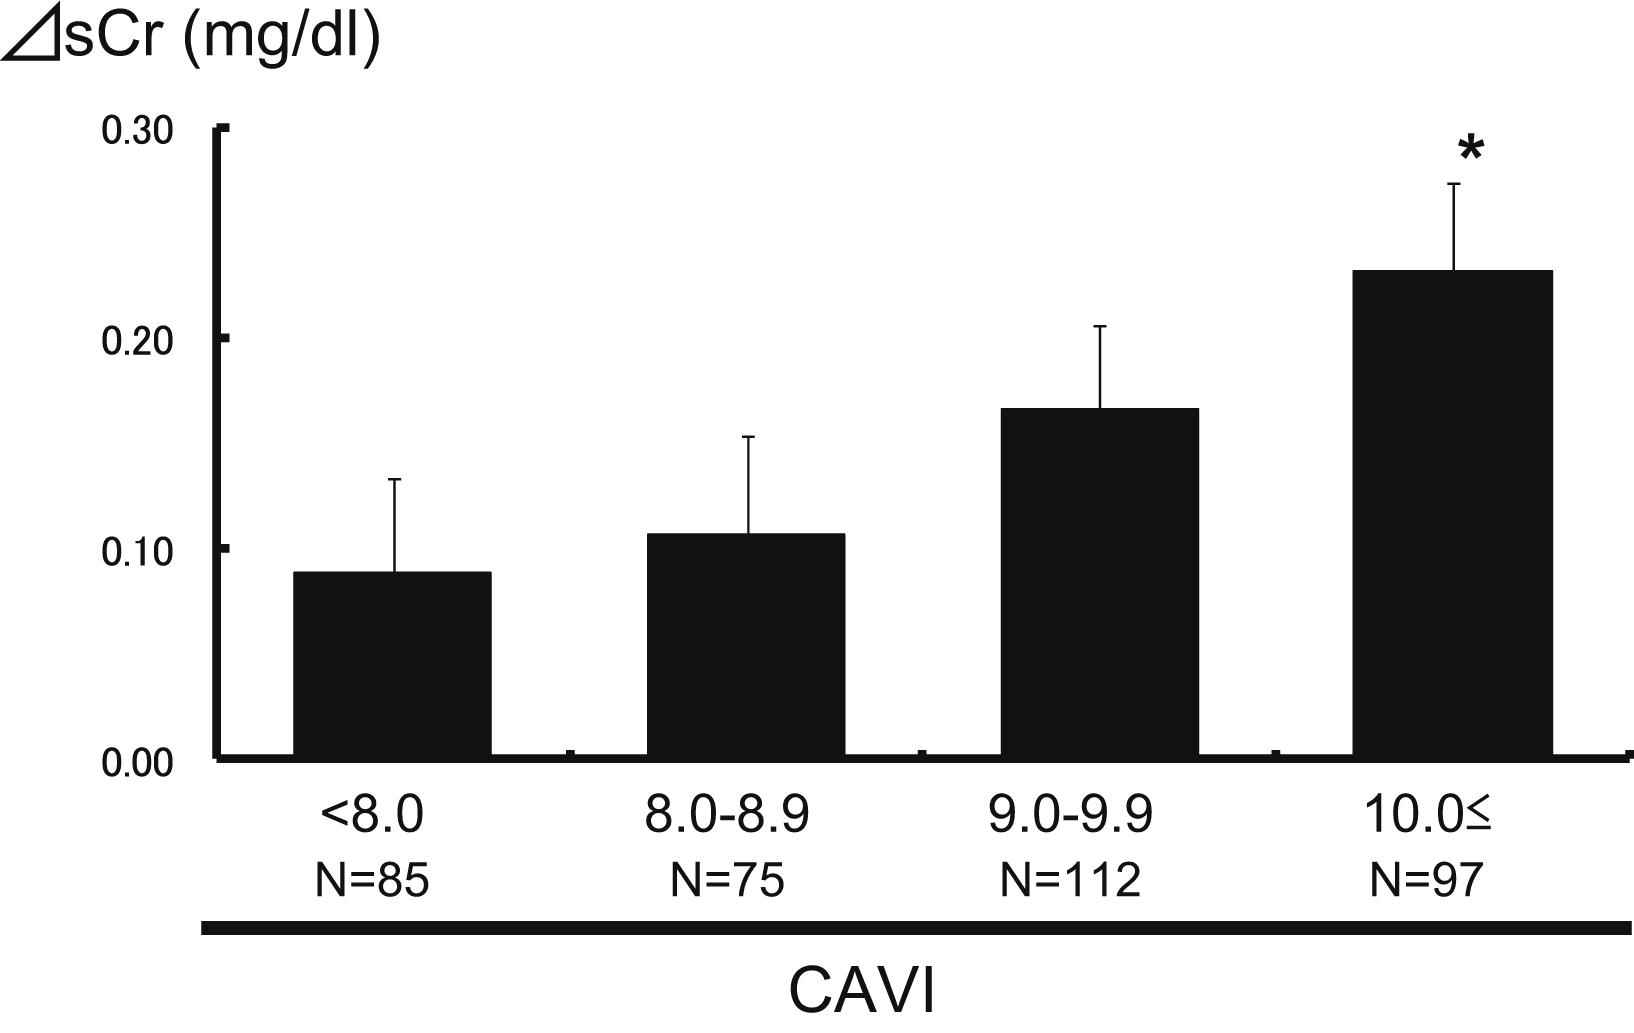
The association between CAVI levels and the changes in creatinine levels. The mean values ± standard error of the changes in serum creatinine between before follow-up and after follow-up were 0.09 ± 0.04, 0.11 ± 0.05, 0.17 ± 0.04 and 0.23 ± 0.04, respectively for the four groups. *P < 0.05 versus CAVI <8.0. P = 0.01 for the trend.
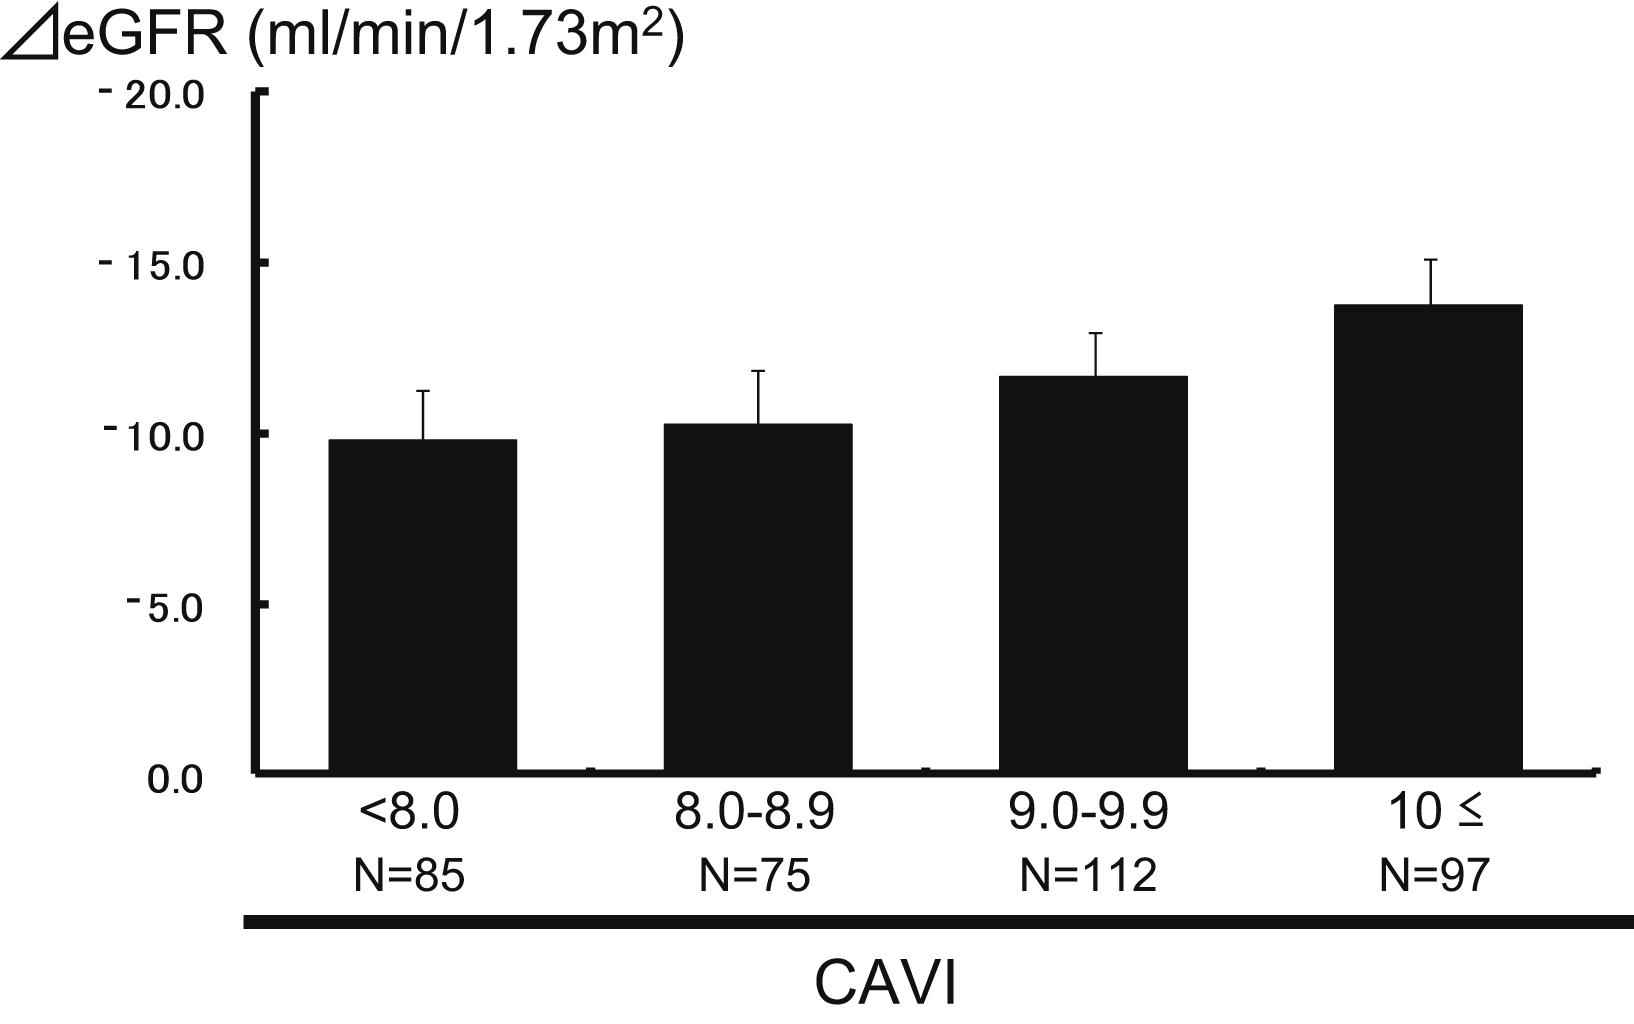
The association between the CAVI levels and the change of the estimated GFR. The mean values ± standard error of the changes in the estimated GFR (ml/min/1.73 m2) between before follow-up and after follow-up were −9.9 ± 1.5, −10.2 ± 1.6, −11.7 ± 1.3 and −13.7 ± 1.4, respectively. P = 0.04 for the trend.
Table 2 shows the odds ratios of CKD incidence during the follow-up period according to CAVI levels. The univariate odds ratios of CKD incidence were greater with increasing CAVI levels (1.0, 1.2, 1.9 and 3.1, respectively, P for trend <0.001), and the odds ratios of the 8.0 ≤CAVI <9.0 group and 10.0 ≤CAVI group were significantly higher than the CAVI <8.0 group. After adjusting for age and sex, the odds ratios of CKD incidence showed a similarly trend (P for trend = 0.006). However, the odds ratio of CKD incidence in the second highest CAVI group was not significantly higher than the lowest CAVI group. Likewise, after controlling for age, sex, baseline CKD stage, BMI, hypertension, diabetes, dyslipidemia and current smoking, the odds ratios rose with increasing CAVI levels (1.0, 1.1, 1.5 and 2.3, respectively, P for trend = 0.02), and the odds ratio in the highest CAVI group was significantly greater than the lowest CAVI group. This association was similar even after adding systolic blood pressure of measuring CAVI to adjusting factors (P for trend = 0.014).
| CAVI | P trend | ||||
|---|---|---|---|---|---|
| <8.0 (n = 85) | 8.0–9.0 (n = 75) | 9.0–10.0 (n = 112) | 10.0≤ (n = 97) | ||
| Univariate | 1.0 (reference) | 1.20 (0.62–2.34) | 1.90 (1.05–3.43) | 3.10 (1.68–5.72) | <0.001 |
| Age- and sex-adjusted | 1.0 (reference) | 1.13 (0.58–2.20) | 1.58 (0.85–2.94) | 2.38 (1.23–4.61) | 0.006 |
| Multivariate adjusteda | 1.0 (reference) | 1.09 (0.52–2.28) | 1.54 (0.78–3.03) | 2.29 (1.08–4.83) | 0.02 |
Adjusted for age, sex, obesity, hypertension, diabetes, dyslipidemia, smoking habits, and baseline CKD stage.
The odds ratios for the incidence of CKD according to the CAVI levels.
The odds ratios of CKD incidence for other risk factors are shown in Table 3. Age (in 20-year increments), obesity, smoking habits and CKD stage II (vs CKD stage I) were significant risk factors for CKD incidence (odds ratio: 1.71, 1.93, 2.10 and 5.40, respectively) in addition to the CAVI. The interactions of the CKD incidence between the CAVI and other risk factors were not significant.
| Risk factor | Relative risk | 95% CI | P value |
|---|---|---|---|
| Agea | 1.71 | 1.04–2.80 | 0.03 |
| Male gender | 0.95 | 0.57–1.59 | n.s. |
| Obesity | 1.93 | 1.17–3.20 | 0.01 |
| Hypertension | 1.10 | 0.67–1.79 | n.s. |
| Diabetes | 1.35 | 0.77–2.36 | n.s. |
| Dyslipidemia | 1.09 | 0.64–1.87 | n.s. |
| Current smoking | 2.10 | 1.13–3.91 | 0.02 |
| CKD stageb | 5.40 | 2.36–12.4 | <0.001 |
| CAVIc | 1.33 | 1.05–1.69 | 0.02 |
Odds ratio in 20-year increments.
Odds ratio for CKD stage II to CKD I before follow-up.
Odds ratio for 1 level elevation of the CAVI group.
The relative risk for CKD.
Discussion
To our knowledge, this is the first study to address the use of the CAVI to predict the incidence of CKD in the non-CKD patients. In the present study, the risk of CKD incidence rose with increasing CAVI levels, and a CAVI ≥10 was a significant risk factor for CKD compared to a CAVI <8.0. The CAVI significantly predicted the incidence of CKD, independently of other risk factors.
There were several previous reports that assessed potential biomarkers that could be used to predict the CKD incidence. In an MMKD study, a high value of Mid-Regional pro-A-type natriuretic peptide (MR-pro ANP) and pro-adrenomedullin (MR-pro ADM) indicated a 2.90 and 2.62-fold increased risk of CKD incidence in 177 patients,18 and brain natriuretic peptide (BNP) and NT-pro BNP were associated with a 1.38 and 2.28-fold increase in the risk of CKD in a study of 227 subjects.19 On the other hand, only two studies examined the use of atherosclerosis markers to predict CKD incidence. Taal et al. reported that a high PWV and augmentation index (AI) imparted a 1.30 and 1.01 fold increase in the risk of CKD in 35 patients in the UK.13 Takenaka et al. demonstrated that a higher basal AI resulted in a greater annual decrease in creatinine clearance (−0.43 ± 0.14 ml/min/year/%) in 27 Japanese patients.12 Our results were similar to these studies, however, these two studies had only small number of patients. In our study, we used a new atherosclerotic marker, CAVI, to predict CKD incidence in a larger number of patients than were examined previous studies.
The CAVI is a relatively new device used to estimate the degree of arterial stiffness in the whole body. The CAVI has a high level of reproducibility, and is not affected by the blood pressure during measurement.14 The CAVI is calculated from the PWV and blood pressure according to the Bramwell–Hill equation by the following formula: CAVI = ln (Ps/Pd) × 2ρ/ΔP × PWV2 (Ps: systolic blood pressure, Pd: diastolic blood pressure, ΔP: pulse pressure, ρ: blood density). The CAVI therefore reveals the stiffness parameter β, the change in vascular diameter corresponding to arterial pressure alternation that independent of blood pressure.20 Previously, hypertension, diabetes and dyslipidemia were identified as risk factors for CKD incidence,5,6,9,21 however, these factors did not significantly increase the risk of CKD in this study. This may have been because our subjects were limited to our outpatients, and many of these subjects had these underlying conditions before the study. Furthermore, a lot of the subjects were on medication and had good control. On the other hand, obesity and smoking habits were risk factors for CKD in our study. These two factors were also reported to be risk factors for CKD incidence in previous studies.10,11 In our present study, we demonstrated that the baseline CKD stage or eGFR and age were important factors for the incidence of CKD (Table 3). In the previous study, the rate of decline in GFR in the Japanese general population was 0.36 ml/min/1.73 m2/year, and was not affected by the age and initial eGFR if the eGFR was more than 60 ml/min/1.73 m2.25 As the rate of decline in GFR in the present study was much higher than the Japanese general population, not only the age and initial GFR but also the traditional risk factors might affect the incidence of CKD in the present study.
In Table 2, we showed that the stage II was the significant risk factor for CKD compared with stage I. It was quite natural because the kidney function was progressively declined with aging, and initial GFR of stage II was lower than that of stage I. The relative risk of CKD in subjects with stage II was times as high as that stage I in the present study. We also demonstrated that the declining rate of GFR was significantly faster according to the higher CAVI levels. Meanwhile, CAVI has not been a little influenced by blood pressure because of measuring method. We had analyzed the relationship after adding systolic pressure of measuring CAVI to control factor, however, we had similarly trend. This result may suggest that the relationship between CAVI and future CKD was independent of blood pressure.
The CAVI reflects the complexity of these risk factors, so we suggest that the CAVI is a better predictor of CKD incidence than any of these single risk factors.
The CAVI reflects the stiffness of systemic arteries. To our knowledge, the association between systemic arterial stiffness and kidney function has never been clearly established. Previous studies showed that increased arterial stiffness may increase renal arterial pressure, and subsequently, endothelial dysfunction.22,23 However, CKD is suggested to promote arterial stiffness due to chronic fluid overload, activation of the rennin–angiotensin–aldosteron systems, sympathetic nervous system, local inflammation, dyslipidemia, vascular calcification and endothelial dysfunction.24 In addition, one or several common mechanisms may act on both the arteries and kidneys. These factors may be associated with our results.
There were several limitations in our study. First, the subjects were limited and follow-up period was short. This study was performed at a single institution and only a relatively small number of subjects were included. The subjects were only Japanese participants who were outpatients at our institution. Additionally, the subjects had sectional baseline characteristics. Moreover, this result might be caused by external causes (any drugs or alimentary habits, etc.) because of short term follow-up. Therefore, larger-scale and long term studies need to be performed in the future to examine a larger number of patients and other populations. Second, we did not measure amount of urinary protein excretion by 24 h pooled urine. Proteinuria is an important clinical manifestation of CKD and has been reported as an independent risk factor for CKD and cardiovascular mortality.26 Because the subjects in this study were outpatient and limited time to examine the subjects, we did not notice a renal disease not associated with atherosclerosis. Third, our findings are based on a one-time CAVI measurement, which may not accurately reflect the status of the study participants. However, the CAVI shows high-level reproducibility, as we have described.14 In addition, this source of variability could not account for the relationship observed in the present study, because a random misclassification would tend to underestimate the risk. Therefore, the true association may even be stronger than that observed in our study.
In conclusion, the CAVI was found to be associated with future renal dysfunction. A high value of CAVI may be a more useful to predict CKD incidence, defined eGFR <60 ml/min/1.73 m2 or proteinuria, than hypertension, diabetes and dyslipidemia. We suggest that the CAVI can be used as a new marker to predict CKD, and that a CAVI ≥10 may be a risk factor for CKD in Japanese patients without CKD.
Conflict of interest
The authors declare no conflict of interest.
Disclosure
None of the authors have relationships to disclosure.
References
Cite this article
TY  - JOUR
AU  - Daisuke Maebuchi
AU  - Munehisa Sakamoto
AU  - Jun Fuse
AU  - Hiroaki Tanaka
AU  - Yasuyuki Shiraishi
AU  - Makoto Takei
AU  - Yumiko Inui
AU  - Yuumi Sutoh
AU  - Yukinori Ikegami
AU  - Yukihiko Momiyama
PY  - 2013
DA  - 2013/01/20
TI  - The cardio-ankle vascular index predicts chronic kidney disease in Japanese subjects
JO  - Artery Research
SP  - 48
EP  - 53
VL  - 7
IS  - 1
SN  - 1876-4401
UR  - https://doi.org/10.1016/j.artres.2012.11.004
DO  - 10.1016/j.artres.2012.11.004
ID  - Maebuchi2013
ER  -