
Aortic stiffness in obese children and adolescents: Comparison of two distance measures of carotid–femoral pulse wave velocity
- DOI
- 10.1016/j.artres.2013.09.004How to use a DOI?
- Keywords
- Adolescence; Aortic stiffness; Augmentation index; Blood pressure; Children; Obesity; Pulse wave velocity
- Abstract
Background: The methodology of the gold standard for measuring aortic stiffness, carotid–femoral pulse wave velocity (cfPWV), has been revised in respect to the choice of distance measure. In order to clarify whether increased aortic stiffness is present in obese children and adolescents we investigated cfPWV with the previous (cfPWV-subtracted) and a newly revised methodology (cfPWV-direct).
Methods: In a cross-sectional design, 104 obese patients with age 10–18 years newly referred to the Children’s Obesity Clinic were compared to 50 healthy control individuals. CfPWV was measured non-invasively using the SphygmoCor device, while all distance measures were made with a calliper.
Results: Opposite to the direct distance, the subtracted distance differed across study groups in relation to height (P < 0.006). CfPWV-subtracted was significantly higher for the obese (4.5 m/s CI: 4.4–4.6 vs. 4.3 m/s CI: 4.2–4.5, P = 0.03), whereas cfPWV-direct was significantly lower (4.8 m/s CI: 4.7–4.9 vs. 5.1 m/s CI: 4.9–5.3, P = 0.008). In multiple regression, being obese did not significantly influence cfPWV-subtracted (β = 0.126, CI: −0.04–0.29, NS) whereas it significantly reduced cfPWV-direct (β = −0.34, CI: −0.53–0.15, P < 0.001), when adjusting for age, gender, mean arterial blood pressure and heart rate. Both groups had normal values of cfPWV-subtracted in respect to a European reference material.
Conclusion: The distance measure of cfPWV-direct was associated similarly to height across study groups. Adjusted for main confounders, cfPWV-subtracted was equal whereas cfPWV-direct was reduced in obese compared to normal weighted children and adolescents.
- Copyright
- © 2013 Association for Research into Arterial Structure and Physiology. Published by Elsevier B.V. All rights reserved.
- Open Access
- This is an open access article distributed under the CC BY-NC license.
Introduction
Methodologies evaluating risk markers of cardiovascular disease from adult studies are typically adopted in paediatrics.1 Carotid–femoral pulse wave velocity (cfPWV) is known as the gold standard for evaluating aortic stiffness, whereas reflected waves measured by augmentation index (AIx) is regarded as an indirect measure of central arterial stiffness.2,3 CfPWV is a simple velocity measure of the aortic length being the pulse wave travel distance divided by the pulse wave transit time (m/s). A spuriously too long distance measurement per time unit will give a higher velocity – interpreted as a higher aortic stiffness. Avoiding overestimation of cfPWV in obese individuals requires a straight distance measurement between anatomical reference points.4,5 Also, the location of the anatomical reference sites equally affect the interpretation of cfPWV when comparing actual values of cfPWV from different studies.6,7
Recently, in adults, body fat was associated with reduced arterial stiffness until middle age.8 However, divergent associations between obesity and cfPWV exists in children and adolescents.9–12 Based on an adult MRI study on cfPWV,6 the recommended way to determine the aortic length precisely have changed.3 Previously the length from the suprasternal notch to the femoral artery minus the length from the suprasternal notch to the carotid artery (subtracted distance) was used.2 Currently, it is recommended to use 80% of the direct distance from the carotid artery to the femoral artery (direct distance).3 The impact of this change in methodology is unknown in obese children.
Per se, the body composition of obese individuals is different from normal-weighted. Opposite, the length of the arterial tree for a given body height is considered to be close to identical across individuals independent of body composition. We hypothesise that the measured level of cfPWV for obese children is influenced by the distance measure which favours the longest measured travel distance in relation to body height in comparison with a normal-weight control group.
The objective of the present study is to investigate whether increased aortic stiffness is present in obese children and adolescents when previous as well as current recommendations of cfPWV are employed.
Methods
Design and subjects
This study is a cross-sectional survey. Obese patients aged 10–18 years newly referred to the Children’s Obesity’s Clinic, Department of Paediatrics, Holbaek University Hospital13 were asked to participate in the present study. The tertiary obesity clinic receives paediatric patients with a body mass index (BMI) percentile above the 90th for gender and age according to the Danish BMI charts.14 Difficulties in communication were the only exclusion criteria in the present study. Seventy-one percent of invited patients participated in the study. The recruitment period was from January 2011 to January 2012 and continued until 100 obese Caucasian patients were enrolled. At the same time, 50 age and gender matched Caucasian control individuals with an assumed representative normal weight range were recruited from the local area either from hospitals’ personals’ offspring or school children and adolescents in the region surrounding the Hospital. Clinical and paraclinical measurements of the present study were performed on two consecutive days no later than two months after the patients’ first outpatient visit.
The study was declared to ClinicalTrials.org (NCT01310088), The Danish Data Agency and approved by The Scientific Ethical Committee of Region Zealand. Written informed consent was obtained from all participants according to the Helsinki Declaration.
Anthropometry and measures of obesity
With an integrated calibrated weight and stadiometer (ADE, Modell MZ10023, Germany) individuals’ height were measured to the nearest 0.1 cm and weight to the nearest 0.1 kg wearing light indoor clothes without shoes. BMI was calculated as weight divided by squared height (kg/m2). BMI z scores were calculated by the L (skewness), M (median) and S (coefficient of variation) method comparing the calculated BMI with the distribution of BMI in a Danish standard population with the same age and gender.14
Waist circumference (WC) was measured with subjects standing to the nearest 0.1 cm with a stretch-resistant tape at the level of the midpoint between the lower margin of the last palpable rib and the top of the iliac crest.15 Waist-height ratio was calculated.
Peripheral and central hemodynamic measures
Brachial BP was measured with the oscillometric device Omron 705IT validated in children and adolescents16 after a rest of minimum 10 min in supine position. Three BP measurements were made and mean of the last two was reported and used in the classification of individuals as normotensive, pre-hypertensive or hypertensive in respect to an American standard population17 based on individuals’ gender, age and height.
CfPWV and AIx were measured non-invasively by applanation tonometry with the SphygmoCor 9.0 device (AtCor Medical, Sydney, Australia) according to recommendations.2,3 Briefly, cfPWV was computed as the pulse wave travel distance divided by transit time. The transit time was determined from the carotid and femoral artery waveforms recorded consecutively with an ECG gated signal simultaneously recorded using the foot-to-foot of QRS signal by the intersecting tangents algorithm. The quality of the carotid and femoral artery waveforms were evaluated with pulse transit time standard deviation (PTT SD), and regarded as acceptable when less than 10%. No significant difference was found between the two groups (PTT SD: obese 8.13 (6.9–9.6) vs. control 7.4 (6.0–9.0), P = 0.076). Distances were measured as straight lines between pen’s marked anatomical sites with a calliper (infantometer) and determined in two ways; the commonly used ‘subtracted distance’ and the newly recommended ‘direct distance’. From the same transit time cfPWV-subtracted and cfPWV-direct were calculated and reported as mean of at least two measurements. CfPWV-subtracted z scores were calculated by gender and age (cfPWV-subtracted z scoreage), and gender and height (cfPWV-subtracted z scoreheight) in respect to a European standard population using the same subtracted distance.18
A central BP waveform was collected from the radial artery. AIx is the augmentation pressure expressed as a percentage of the pulse pressure, where augmentation pressure is the difference between the second and first systolic peaks. AIx was corrected for a standard heart rate of 75 bpm (AIx@HR75) by the AtCor software. The central waveform obtained from the radial measurement was calibrated to the brachial systolic and diastolic BP using a generalized transfer function validated in an invasive study on adults.19 The quality of the BP waveforms was evaluated with the composite quality control parameter – operator index – and regarded as acceptable when above 80. Again, no difference was found between the two groups (operator index: obese 90.0 (83.0–93.5) vs. control 89.25 (84.5–93.0), P = 0.66). AIx@HR75 was reported as mean of at least two measurements. Due to difficulties in obtaining the measurements one individual had no whereas three individuals had only one radial AIx@HR75 measurement.
The corresponding author performed all anthropometric and hemodynamic measurements after a training period.
Statistics
Statistical analyses were performed using SAS software (version 9.2, SAS Institute, Cary, NC). Statistical significance was defined as an α-level of below 0.05 on 2-sided tests. Results were reported as mean ± standard deviation or median (interquartile range) dependent on whether data were normally distributed. Differences between the obese and the control group (Tables 1 and 2) were calculated with unpaired (two sample) t tests for normally distributed continuous variables, otherwise Wilcoxon rank sum tests. The potential gender difference was calculated with a Chi-squared test, while the possible difference in brachial BP classification was calculated using Cochran–Armitage Trend Test.
| Variable | Obese group N = 104 | Control group N = 50 | P value |
|---|---|---|---|
| Mean ± SD or median (IQR) | Mean ± SD or median (IQR) | ||
| Male/female (N/N) | 50/54 | 23/27 | 0.81 |
| Age (years) | 12.6 (11.4–15.0) | 13.2 (11.7–14.9) | 0.44 |
| Height (cm) | 159.9 ± 11.9 | 163.2 ± 12.1 | 0.11 |
| Weight (kg) | 66.9 (57.7–90.9) | 50.7 (41.3–58.4) | <0.0001 |
| BMI (kg/m2) | 27.63 (24.1–32.4) | 18.76 (16.7–20.1) | <0.0001 |
| BMI z score | 2.76 ± 0.68 | 0.08 ± 0.84 | <0.0001 |
| Waist (cm) | 94.8 (85.3–107.5) | 66.4 (62.7–69.6) | <0.0001 |
| Waist/height ratio | 0.60 (0.56–0.64) | 0.40 (0.38–0.42) | <0.0001 |
| Brachial systolic BP (mmHg) | 110.9 ± 8.51 | 107.7 ± 8.0 | 0.026 |
| Brachial diastolic BP (mmHg) | 61.8 ± 5.7 | 59.1 ± 5.3 | 0.004 |
| Brachial pulse pressure (mmHg) | 49.0 ± 7.5 | 48.6 ± 8.4 | 0.75 |
| Central systolic BP (mmHg) | 93.3 ± 7.3 | 90.4 ± 6.8 | 0.023 |
| Central diastolic BP (mmHg) | 62.8 ± 5.9 | 60.1 ± 5.4 | 0.009 |
| Central pulse pressure (mmHg) | 30.5 ± 5.3 | 30.4 ± 6.1 | 0.86 |
| Heart rate (bpm) | 66.6 ± 9.5 | 63.4 ± 10.0 | 0.055 |
| CfPWV-subtracted (m/s) | 4.52 ± 0.52 | 4.32 ± 0.53 | 0.031 |
| CfPWV-direct (m/s) | 4.83 ± 0.57 | 5.10 ± 0.65 | 0.008 |
| AIx@HR75 (%) | −0.11 ± 10.2 | −1.30 ± 10.9 | 0.51 |
Basic and hemodynamic characteristics.
| Variable | Obese group N = 104 | Control group N = 50 | P value |
|---|---|---|---|
| Mean ± SD | Mean ± SD | ||
| Distance C-SNN (mm) | 74.5 ± 13.0 | 93.1 ± 15.7 | <0.0001 |
| Distance SNN-F (mm) | 493.1 ± 51.1 | 470.0 ± 40.5 | 0.006 |
| Subtracted distance (mm) | 418.6 ± 49.3 | 376.8 ± 30.5 | <0.0001 |
| Distance C–F (mm) | 558.6 ± 55.7 | 557.3 ± 54.4 | 0.89 |
| Direct distance (mm) | 446.9 ± 44.5 | 445.8 ± 43.5 | 0.89 |
| Transit time (ms) | 88.5 ± 12.3 | 82.6 ± 12.1 | 0.006 |
Distance C-SNN: distance between the common carotid and the suprasternal notch. Distance SNN-F: distance between the suprasternal notch and femoral artery. Subtracted distance: Distance SNN-F minus Distance C-SNN. Distance C–F: The direct distance between the common carotid and the femoral artery. Direct distance: 80% of distance C–F.
The components of cfPWV-subtracted and cfPWV-direct.
Simple linear regressions were performed for plotted regression lines. Multiple regressions (Table 3) were performed using a general linier model with cfPWV as outcome adjusting for relevant confounding covariates between the two groups. In order to allow data from the two groups to be pooled we tested for possible interaction on cfPWV between the group variable and the three numerical covariates; age, mean arterial BP (MAP) and heart rate (HR). This were performed in three separate multiple regression analyses with cfPWV as dependent variable and group, age and group*age as explanatory variables in one model. Equivalent analyses were performed for MAP and HR. To exclude a possible effect of smoking or use of medication on measures of arterial stiffness we repeated the statistical analyses without individuals with a smoking or medication status.
| Variable | β | 95% CI limits | P value | R2 |
|---|---|---|---|---|
| Model 1: cfPWV-subtracted | <0.0001 | 0.274 | ||
| Group, obese vs. control | 0.126 | −0.037−0.288 | 0.13 | |
| Age (years) | 0.090 | 0.054–0.127 | <0.0001 | |
| Gender, male vs. female | −0.053 | −0.208−0.101 | 0.49 | |
| Central MAP (mmHg) | 0.019 | 0.005–0.032 | 0.006 | |
| Heart rate (bpm) | 0.012 | 0.003–0.021 | 0.007 | |
| Model 2: cfPWV-direct | <0.0001 | 0.257 | ||
| Group, obese vs. control | −0.342 | −0.529 to −0.154 | 0.0004 | |
| Age (years) | 0.111 | 0.069–0.153 | <0.0001 | |
| Gender, male vs. female | 0.009 | −0.169−0.186 | 0.92 | |
| Central MAP (mmHg) | 0.015 | −0.000−0.030 | 0.052 | |
| Heart rate (bpm) | 0.013 | 0.003–0.024 | 0.01 |
Multiple regression analyses for cfPWV-subtracted and cfPWV-direct adjusting for well-known confounders, e.g. age, gender, MAP and HR.
Multiple regression analyses describing cfPWV-subtracted and cfPWV-direct.
The reproducibility/agreement between corresponding measurements of subtracted and direct distance and cfPWV measures were examined with paired (one sample) t tests for possible systematic differences, Bland–Altman diagrams for possible differences in the magnitude of the measurements (plots not shown), and intraclass correlation coefficients (ICC) as indexes of reliability.
Results
Table 1 lists the basic and hemodynamic characteristics between the obese and control group. There was no difference in the gender, age or height between the two groups. As expected, we observed significant differences in weight, BMI, BMI z score, waist and waist-height ratio due to the design of the inclusion. Both systolic and diastolic brachial and central BP were higher in the obese compared to the control group. Likewise, MAP was higher in the obese group (obese 76.8 ± 6.3 mmHg vs. control 74.4 ± 5.5 mmHg, P = 0.019). No group differences were found for brachial and central pulse pressures, HR or AIx@HR75. Also, no overall difference was found in respect to the brachial BP classification (P = 0.46); normotensives (obese N = 47 (45.2%) vs. control N = 26 (52.0%)), pre-hypertensives (obese 19 (18.3) vs. control 8 (16.0)) and hypertensives (obese 38 (36.5) vs. control 16 (32.0)).
CfPWV-subtracted was significantly higher in the obese compared to the control group, whereas cfPWV-direct was significantly lower in the obese compared to the control group (Table 1).
When cfPWV-subtracted was compared in respect to a European standard population in respect to gender and age, and gender and height, both groups had cfPWV-subtracted z scores in the normal range. Likewise the actual values of cfPWV-subtracted, the standardized cfPWV-subtracted z scores were significantly higher in the obese group compared to the control group (cfPWV-subtracted z scoreage: obese −0.60 ± 0.80 vs. control −0.96 ± 0.89, P = 0.013, cfPWV-subtracted z scoreheight: obese −0.76 ± 0.79 vs. control −1.22 ± 0.87, P = 0.0014).
Arterial stiffness measures did not differ between genders in the two groups; AIx@HR75 (obese: male −0.83 ± 9.77 vs. female 0.53 ± 10.58, P = 0.50/control: male −2.80 ± 11.99 vs. female −0.02 ± 9.96, P = 0.37), cfPWV-subtracted (obese: male 4.42 ± 0.49 m/s vs. female 4.61 ± 0.55 m/s, P = 0.066/control: male 4.25 ± 0.53 m/s vs. female 4.38 ± 0.54 m/s, P = 0.41) and cfPWV-direct (obese: male 4.76 ± 0.54 m/s vs. female 4.88 ± 0.59 m/s, P = 0.29/control: male 5.06 ± 0.63 m/s vs. female 5.13 ± 0.68 m/s, P = 0.69).
The components of the cfPWV measures are listed in Table 2. Despite a higher pulse wave transit time, the higher cfPWV-subtracted velocity in the obese group was related to a higher subtracted distance due to a shorter carotid to suprasternal notch distance and a longer suprasternal notch to femoral distance in obese subjects. The lower cfPWV-direct velocity in the obese group was related to an equal direct distance and a higher pulse wave transit time in the obese subjects.
Figures 1 and 2 show the distance measures plotted against height. Figure. 1 shows different slopes for the subtracted distance across groups (height*group interaction estimate P = 0.006). Whereas Fig. 2 shows almost overlaying with close to identical slopes for the direct measure (height*group interaction estimate P = 0.74). The common carotid to suprasternal notch distance was also different across groups (height*group interaction estimate P = 0.001). Whereas suprasternal notch to femoral artery distance was merely different (height*group interaction estimate P = 0.057).
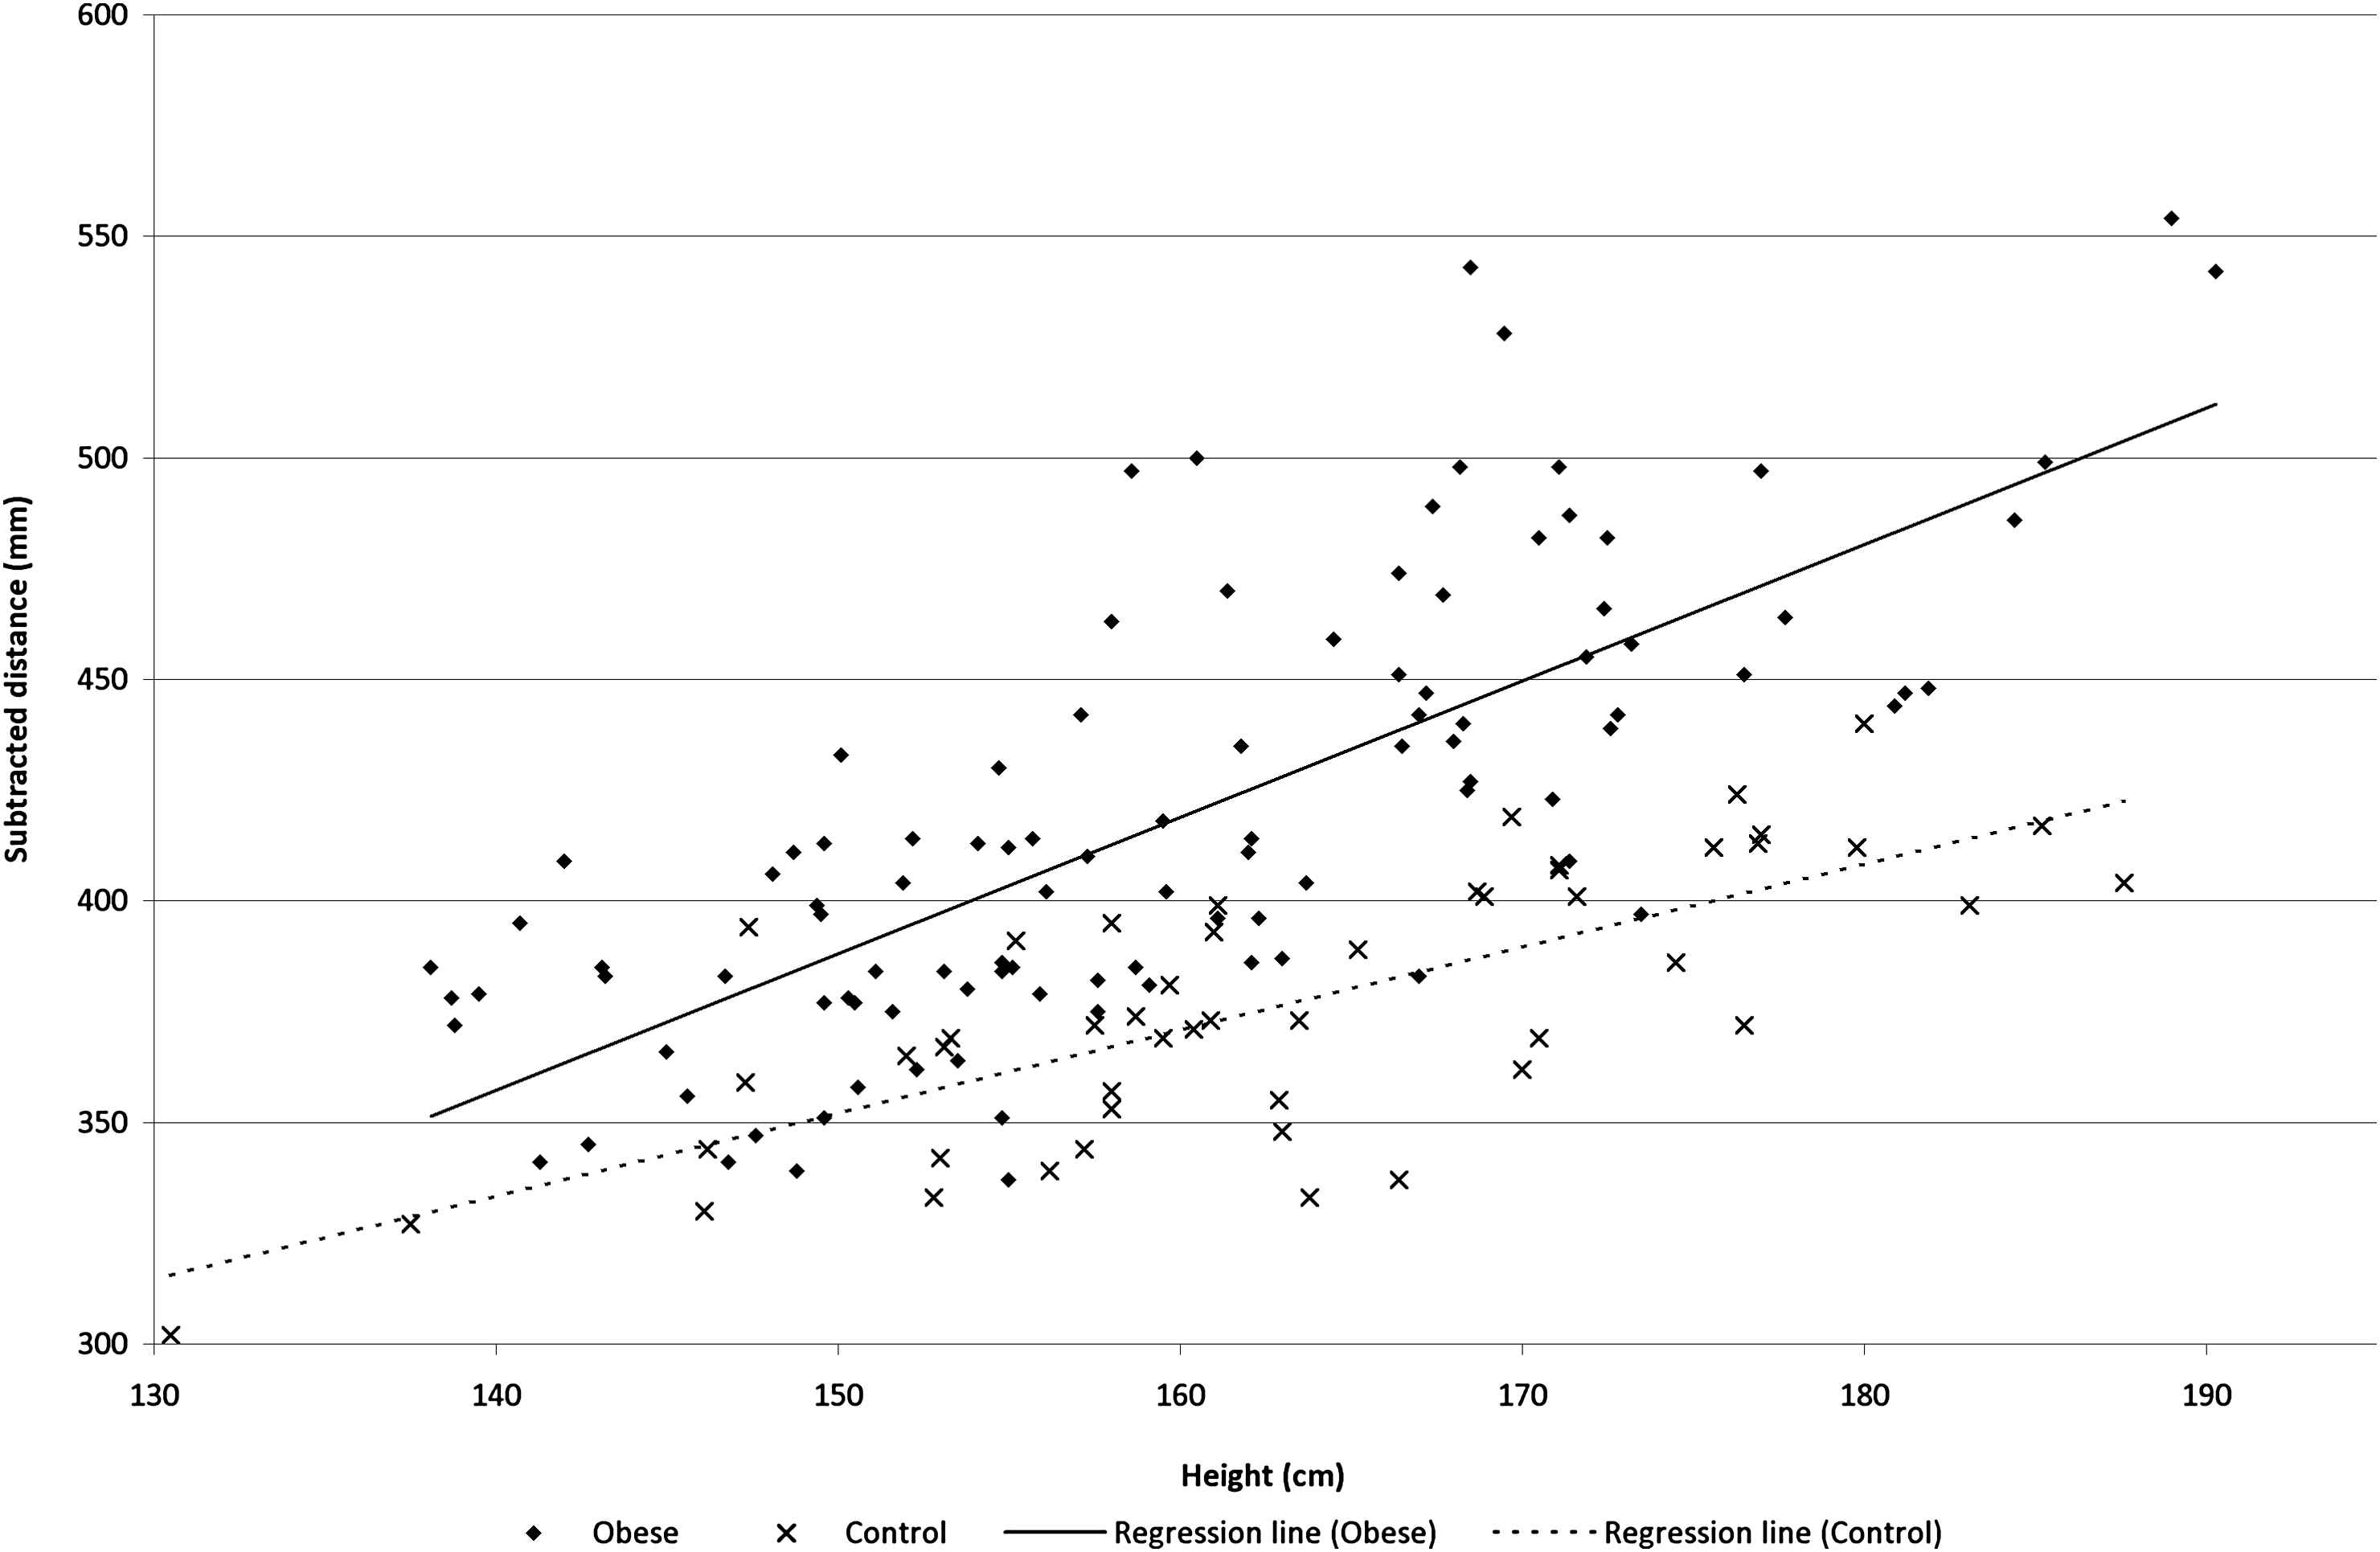
The subtracted distance (mm) as a function of height (cm) in the two groups.
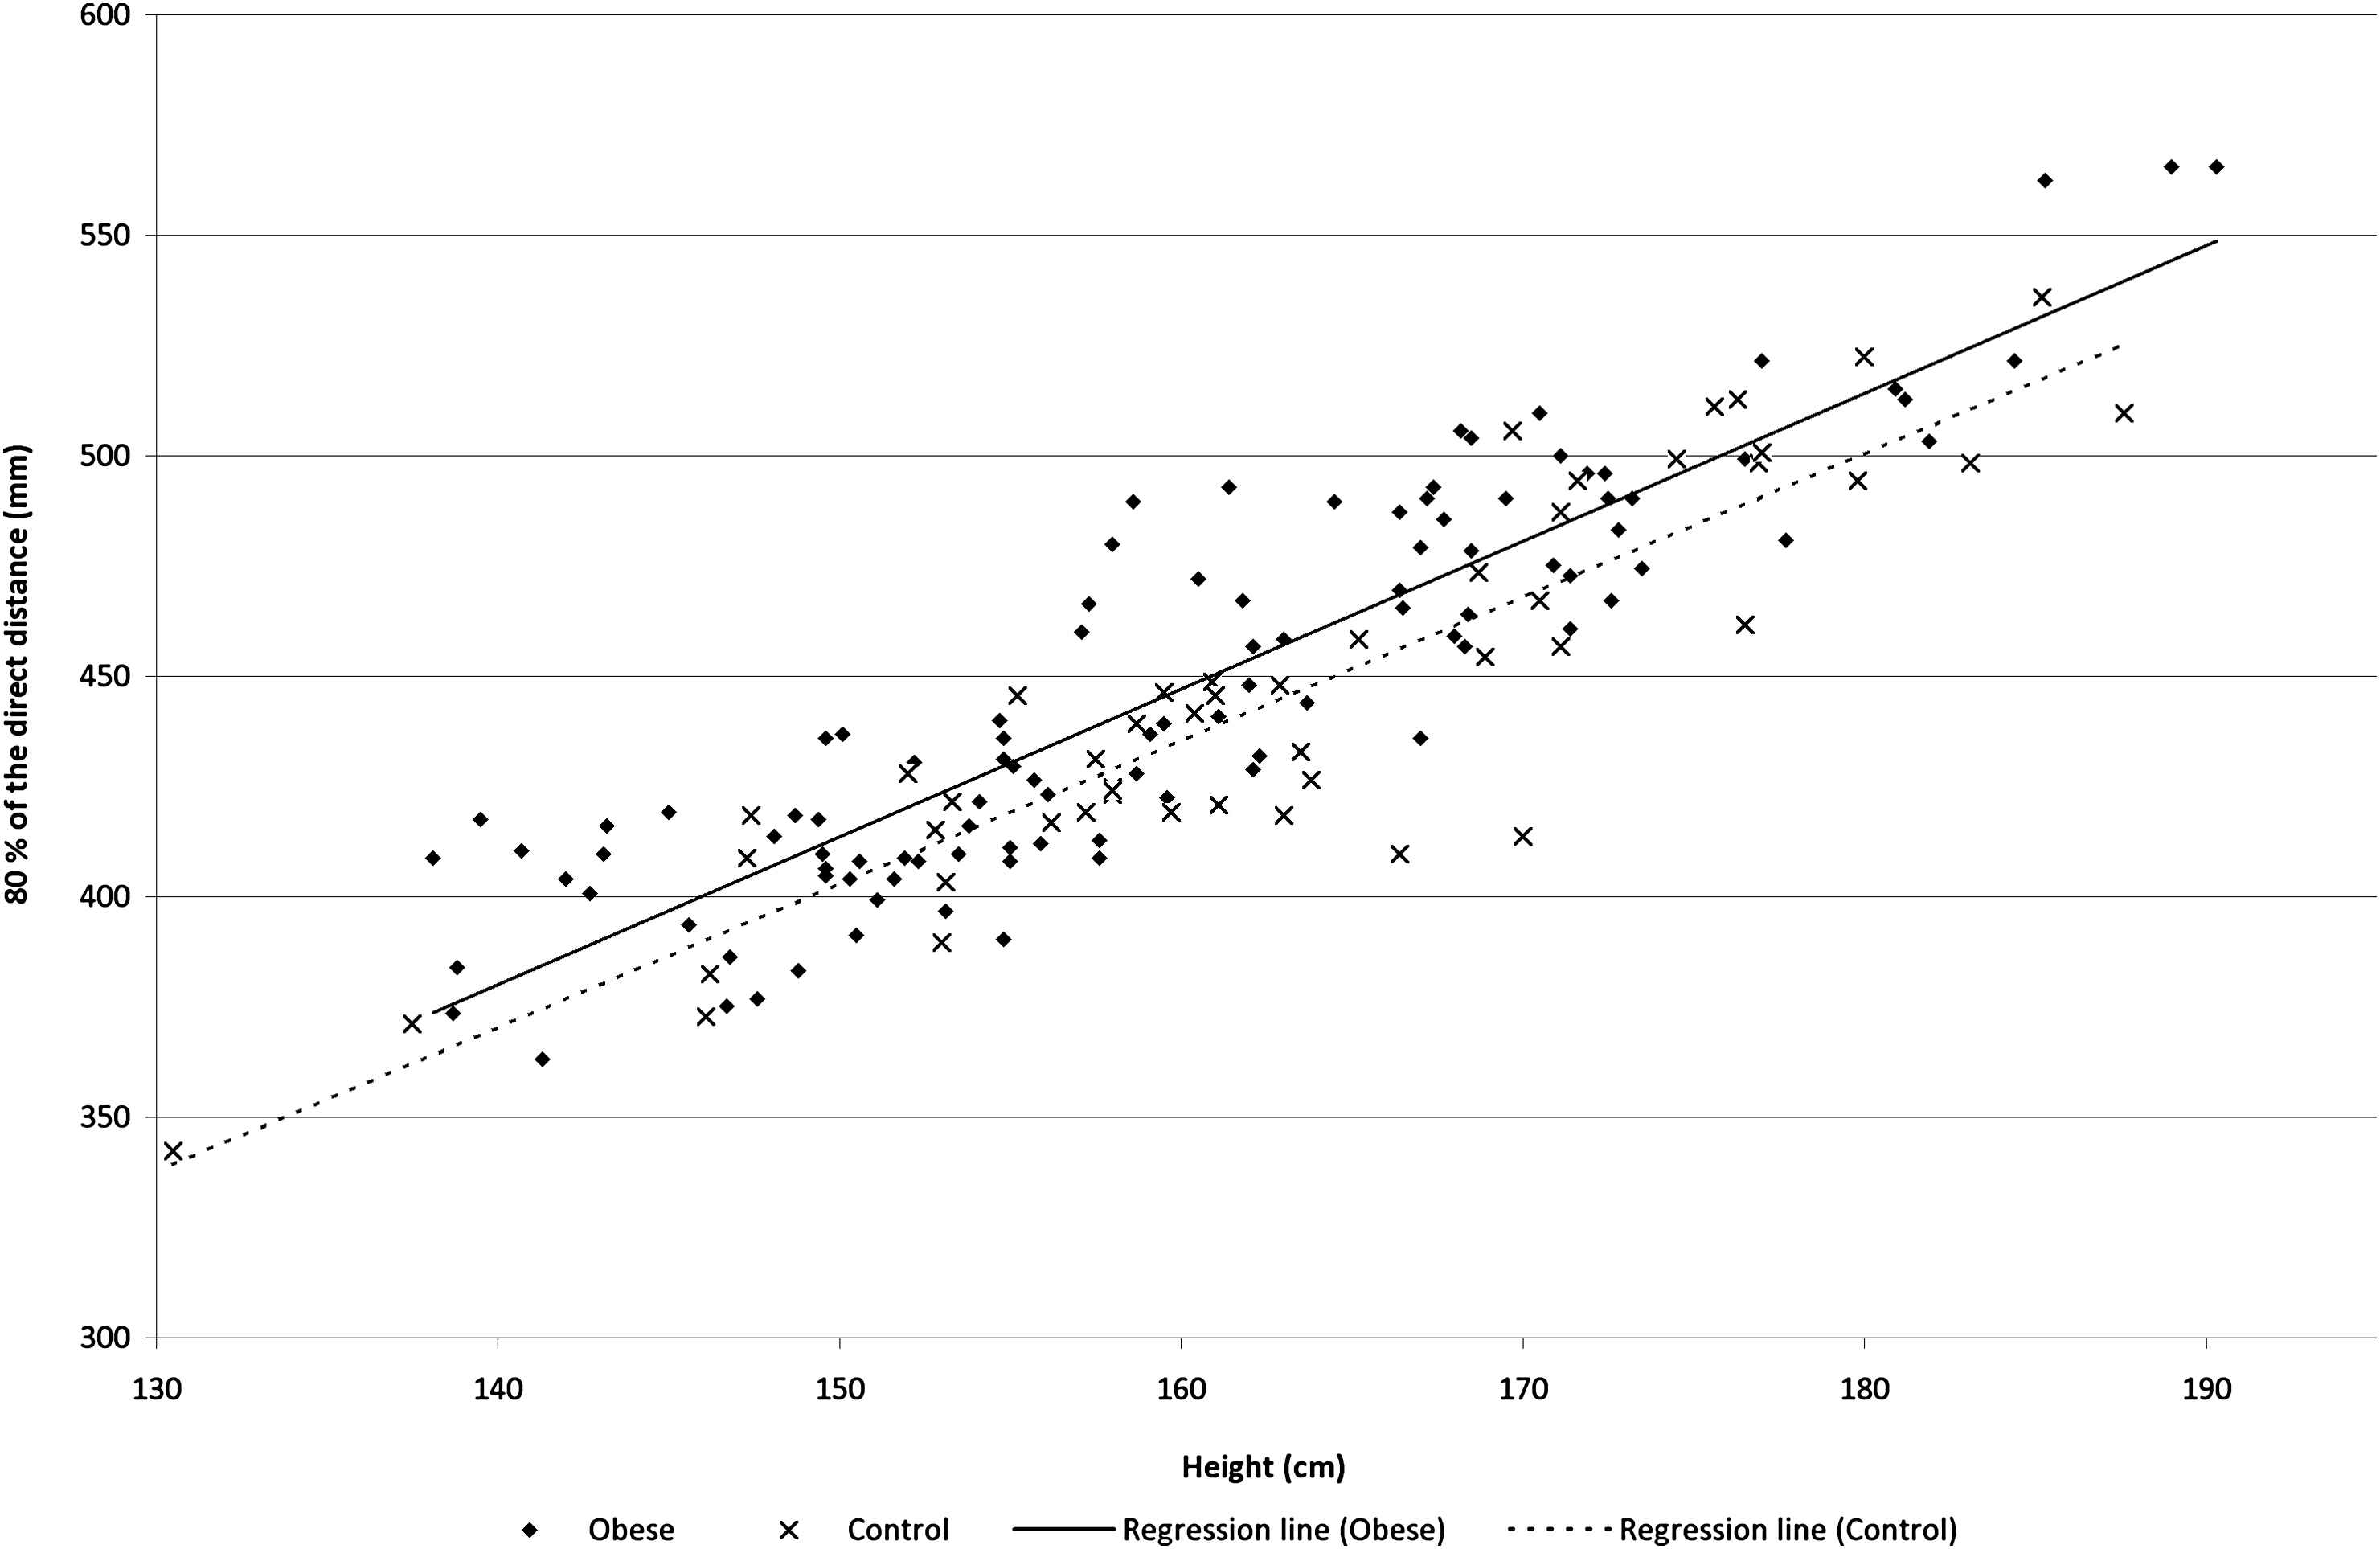
The direct distance (mm) as a function of height (cm) in the two groups.
In both groups, tests of agreement of the two corresponding distance and velocity measures showed significant systematic differences (all four paired t tests P < 0.0001), although no differences in the magnitude of the measurements were found. In this respect, Bland–Altman plots (not shown) showed a shifted level above zero with a random scatter. Taking into account these systematic differences the ICC of the distance measures were 0.75 for the obese and 0.30 for the control group, whereas the ICC of the cfPWV’s were 0.77 for the obese and 0.49 for the control group.
The systematic difference in the velocity measures was investigated in relation to age using linear regression; no association was found in the obese group (P = 0.86), while a modest significant association was found in the control group (β = 0.08, 95% CI: 0.04–0.11, P < 0.0001).
In the obese group using linear regression, a significant positive association was found between cfPWV-subtracted and BMI z score (β = 0.202, 95% CI: 0.054 to 0.349, P = 0.008), whereas no association was apparent between cfPWV-direct and BMI z score (β = 0.039, 95% CI: −0.125 to 0.203, P = 0.64). At the same time in the control group, no association was found between cfPWV-subtracted and BMI z score (β = 0.147, 95% CI: −0.033 to 0.327, P = 0.108) or cfPWV-direct and BMI z score (β = 0.188, 95% CI: −0.030 to 0.407, P = 0.090). Almost identical findings were made between the two different cfPWV measures and waist-height ratio when using linear regression (data not shown).
Data were eligible to be pooled for multiple regression analyses since prior tests showed no interaction on the two measures of cfPWV of the group variable with age, HR or MAP. In the multiple regression analyses (Table 3), we found a positive, but insignificant association between obese status and cfPWV-subtracted in model 1, whereas it was negative for cfPWV-direct in model 2.
No differences were found in prevalence of smoking (obese N = 5 (5.4%) vs. control N = 0 (0%), P = 0.12) or use of medication (obese N = 17 (16.3%) vs. control N = 9 (18.0%), P = 0.61). Use of medication (yes vs. no) was based upon six obese and four control individuals using medication for asthma or allergy, three obese with gastro-intestinal symptoms, three obese and one control using hormonal supplementation, four obese on p-pills, one obese taking Ritalin, and three obese and five control on other not specified medication. Statistical analyses of measures of arterial stiffness were reproducible when individuals using medication or smoking were excluded, but the unadjusted group comparison of PWV-subtracted became insignificant (P = 0.109), as well as the linear relationship between cfPWV-subtracted and BMI z score in the obese group (P = 0.106).
Discussion
The present study investigates non-invasive measures of aortic stiffness. The key finding was that cfPWV was dependent on the method used to measure the length of the aorta. This finding is critical for the interpretation of whether obese individuals have increased aortic stiffness or not. CfPWV-subtracted using the previously used subtracted distance method was not consistent in its relation to height in the two groups and was increased in the obese group – although not statistically significant in a model adjusted for relevant confounders. CfPWV-direct using the newly recommended direct distance method was consistent in its relation to height in the two groups and was reduced in the obese group after adjustment for known confounders.
Several scientific groups have in cross-sectional designs investigated cfPWV in obese children and adolescents.9–11,20 Primarily the pulse wave travel distance of choice has been the subtracted distance, whereas cfPWV-direct has not been investigated until now.
Sakuragi et al.20 used a unique type of the subtracted distance for the cfPWV measurement. Umbilicus was interpolated in the distal distance between the suprasternal notch and the femoral artery. They found that cfPWV increased across tertiles of body fat percentage and in multiple regression analyses that BMI, WC, and body fat percentage were significant explanatory variables of cfPWV. However, their regression model might have been over-adjusted when including both systolic BP and MAP. Furthermore, the associations might be ascribed to an even bigger systematic bias when adding an extra distance as our results suggest when comparing the subtracted with the direct distance.
In agreement with the present study, Arnberg et al.11 found no association between cfPWV-subtracted and BMI, WC or total body fat percentage when adjusting for potential confounders in a cross-sectional study of overweight children. However, they did find a positive association between cfPWV-subtracted and abdominal obesity, measured by android fat to gynoid fat ratio from subanalysis of the DXA scans.
Opposed to the trend of cfPWV-subtracted but in agreement with cfPWV-direct in the present study Lurbe et al.9 found no positive association of obesity and cfPWV-subtracted in their obese/overweight population. Findings were consistent in multiple regressions.
In order to evaluate the outcome and interpretation of our study we compared our data to a European reference material.18 As no longitudinal study exists for a young population linking elevated cfPWV with a cardiovascular outcome, we could not predict an upper risk limit. However, in paediatrics often the 95th percentile (equals z score 1.645) is used as this level by convention. CfPWV-subtracted z score values would be expected to be very close to zero in our control group if identical methods were used. In contrary, we observed negative cfPWV-subtracted z scores for both the obese and the control group, although the latter was significantly lower than the obese. Opposed to our study, the reference material used surface tape for travel distance measures. In practice surface tape follows the body’s curvature and we would expect a higher distance value when compared with a straight calliper measurement as also mentioned by other scientific groups working with obese populations.5,20–22 Ultimately, this unintentional systematic effect will result in a spuriously higher cfPWV – this could be an explanation of the lower level of cfPWV-subtracted, with straight calliper distance measurement, in our control group compared to the expected standardised values of the reference material by Reusz et al.18
The anatomical reference sites of the distance measure have great impact on the resulting cfPWV compromising comparisons of exact values from methodological different studies.7 The exact reference sites for a precise distance are unknown in the young since no MRI validation study of the aorta length has been made for children. However, an empirical assumption must be that the length of the vascular tree is related to height independently of weight status. In this respect, it has been suggested in adults that travel distance can be estimated based on body height alone,23 an approach that have been shown to predict cardiovascular outcomes.24 If estimating PWV from height in the present study, PWV would be lower in the obese group, due to the borderline shorter height and significantly lower transit time when compared to the control group – a finding in agreement with the observed cfPWV-direct. However, the formula may not exactly fit to children and adolescents. Furthermore, the shorter neck and longer torso length of the obese individuals seem merely due to the nature of their fat distribution, not reflecting increased aorta length, explaining the higher subtracted distance despite similar height. These issues challenges the use of the subtracted distance measure while the newly recommended, direct distance measure, seems more suitable. In the absence of a gold standard measurement, however, we cannot conclude with certainty which of the distance measures is the “true” one. Furthermore, the use of calliper instead of tape measurement should be emphasized.
Herein, the consequence for the interpretation of the present study is that young obese individuals have a lower central arterial stiffness when compared to our control group. It indicates that the central vasculature has not “yet” been damaged in the obese group. The mechanism behind the lower cfPWV-direct in the obese group is unclear, but might be explained by an extrapolation into the paediatric age of the results found by Corden et al.,8 where body fat was associated with reduced arterial stiffness until middle age. We speculate that our findings may be a compensatory mechanism to a hyperkinetic circulation in obese children and adolescents with a supposed higher stroke volume, cardiac output and a higher circulating blood volume.25,26
A limitation to the AIx is the use of a general transfer function not validated in children. Opposed to the present study Urbina et al.10 found a higher AIx in the obese group. In agreement with our findings Arnberg et al.11 showed no relation between obesity measures and AIx. Nor did Lurbe et al.9 find any difference in AIx across a normal-, overweight and obese group of children. In a field with methodological concerns the present study supports the view that obesity in children does not relate to aortic stiffness.
The present study has some limitations. First, due to the cross-sectional design we cannot infer on pathophysiological mechanisms. Secondly, we did not collect puberty measures and it is unknown whether differences exist between the two groups potentially affecting the outcome. However, we found no difference in age, gender or height between the two groups. Thirdly, it was difficult to recruit control individuals from the same social class as the obese group, since overweight in the western world is predominant in lower socioeconomic groups.
As the relationship between the subtracted distance and height was different in obese vs. non-obese, we conclude, that the previously used cfPWV-subtracted seems to overestimate cfPWV in obese children, whereas the new method of cfPWV-direct does not. Our results suggest that obesity in children is not yet associated with structural changes in aorta.
In perspective, it is reassuring that the higher BP of young obese subjects is not yet associated with increased central arterial stiffness suggesting that early intervention against childhood obesity can prevent later structural vascular changes even before they arise.
Abbrevations
- AIx,
augmentation index
- BMI,
body mass index
- BP,
blood pressure
- cfPWV,
carotid–femoral pulse wave velocity
- ICC,
intraclass correlation coefficient
- WC,
waist circumference
Financial disclosure
The corresponding author received
Conflict of interest
All authors declare that there is no conflict of interests in respect to executing, analysing or reporting this research project.
Support sources (all authors)
The Health Sciences Research Foundation of Region Zealand, The Danish Heart Foundation, Kathrine og Vigo Skovgaards Fond, Det Medicinske Selskab i København and Edith og Henrik Henriksens Mindelegat and LEO Pharma’s Travel Grant.
Acknowledgements
We would like to thank all the individuals who participated in the study and the clinical and scientific staff at The Children’s Obesity Clinic, in particularly laboratory technicians Oda Troest and Birgitte Holloese, Secretary Dorte Jensen and database manager Arne Lykke Nielsen for their invaluable help in all practical matters when conducting this research project. For financial support we would like to thank
References
Cite this article
TY  - JOUR
AU  - Kristian Nebelin Hvidt
AU  - Michael Hecht Olsen
AU  - Jens-Christian Holm
AU  - Hans Ibsen
PY  - 2013
DA  - 2013/09/27
TI  - Aortic stiffness in obese children and adolescents: Comparison of two distance measures of carotid–femoral pulse wave velocity
JO  - Artery Research
SP  - 186
EP  - 193
VL  - 7
IS  - 3-4
SN  - 1876-4401
UR  - https://doi.org/10.1016/j.artres.2013.09.004
DO  - 10.1016/j.artres.2013.09.004
ID  - NebelinHvidt2013
ER  -