
Longitudinal follow-up of ascending versus abdominal aortic aneurysm formation in angiotensin II-infused ApoE−/− mice
- DOI
- 10.1016/j.artres.2014.01.001How to use a DOI?
- Keywords
- Small animal imaging; In vivo micro-CT; High-frequency ultrasound; PET; Angiotensin II; Ascending aortic aneurysm; Abdominal aortic aneurysm; Mice
- Abstract
Purpose: To explore new imaging techniques to elucidate some of the differences between both abdominal and ascending aortic aneurysms in the angiotensin II mouse model.
Procedures: Angiotensin II-infusing pumps were implanted in male ApoE−/− mice (n = 10). In vivo micro-CT, ultrasound and Positron emission tomography (PET) were used to follow up on aneurysm formation.
Results: We observed that the ascending aortic aneurysm gradually increased in size over the course of 49 days, while the abdominal aneurysm appeared much more suddenly in between scan times, or in some cases was not detectable at all on micro-CT. Diastolic backflow was detected from day 7 on in the ascending aorta, but not in the abdominal aorta of animals developing an aneurysm at the respective location. Finally PET 18F-FDG uptake was increased in both the ascending and the abdominal aneurysmatic aorta at day 14, but not at day 7.
Conclusions: Novel imaging techniques should be explored in-depth to come to a better understanding of the difference in morphology and hemodynamics between ascending and abdominal aneurysms in angiotensin II-infused ApoE−/− mice.
- Copyright
- © 2014 Association for Research into Arterial Structure and Physiology. Published by Elsevier B.V. All rights reserved.
- Open Access
- This is an open access article distributed under the CC BY-NC license.
Introduction
Aortic aneurysm, a focal dilatation of the aortic diameter larger than 1.5 times the original size,1 is a complex cardiovascular disease. Aneurysm rupture causes 1–2% of all deaths in the industrial world.2 Current therapy is often limited to surgery or endovascular treatment due to the sparsity of effective medicinal approaches, which in turn is caused by a lack of knowledge on its initial pathophysiology.3–5 Although aortic aneurysm can occur throughout the entire aorta there is a predisposition for vascular sites such as the ascending and the abdominal aorta.6 However, etiology, natural history, and treatment are different for both kinds of aortic aneurysms.7 In order to provide mechanistic insight into the initiating and propagating factors, several mouse models have been developed. For example, abdominal aortic aneurysms (AAAs) have been induced by calcium chloride,8 elastase9 or angiotensin II10 and ascending aortic aneurysms have been observed in genetically modified mice that are hypomorphic for fibrillin-1,11,12 a mouse model of Marfan syndrome.13
One of the most commonly used mouse models of AAA, in which ApoE−/− mice are infused with angiotensin II,10 is characterized by medial degradation and thrombus formation, and consistent with the activation of inflammatory response that stimulates a proteolytic cascade that is also observed in human AAAs. Another important characteristic that is in agreement with clinical (human) observations is the enhanced propensity for AAAs in male mice: the incidence is approximately twice that of females. Recent work revealed however that these mice do not only develop AAAs, but suffer from aneurysm of the ascending aorta as well.14 As the ascending aortic aneurysm formation went unnoticed for a long time, histological15 as well as observational ultrasonographic,16–18 biomechanical19–22 and hemodynamic23–25 studies all have investigated the initial disease stages in this mouse model focusing on the abdominal aorta. The exact working mechanisms of neither abdominal nor ascending aortic aneurysm formation in this mouse model are fully understood.
In this work we used several new imaging techniques to further elucidate the difference between both types of aneurysm in this mouse model. In ten angiotensin II – infused ApoE−/− mice aneurysm geometry was followed up over time in both the abdominal and the ascending aorta. At several time points we assessed the aortic flow waveforms at both aortic locations using high-frequency ultrasound. Furthermore Positron Emission Tomography (PET) was performed at days 7 and 14 after aneurysm induction to assess the metabolic activity within the aortic wall. These functional images were then compared to the intermediate and end-stage aneurysm morphology and progression. The latter was characterized by ultrasound imaging, in vivo micro-CT and post mortem histological tissue inspection. Due to the relatively low number of imaged animals the present work should be considered as a proof of concept, in which different techniques to characterize aneurysm formation in mice are explored.
Methods
Mice
Ten in-house bred male ApoE−/− mice on a C57Bl/6 background were used in this study. All mice were implanted an osmotic pump (model Alzet 2004; Durect Corp, Cupertino, CA), filled with angiotensin II (Bachem, Bubendorf, Switzerland). Pumps were implanted subcutaneously on the right flank via an incision in the scapular region. To avoid interference with the micro-CT images, the metal flow divider inside the pump was replaced by a PEEK alternative (Durect Corp, Cupertino, CA) as previously described in.26 Each pump released its content over a period of 28 days, at an infusion rate of 1000 ng kg−1 min−1. Mice were housed in separate cages to prevent fighting, water and regular mouse diet were available ad libitum and they were observed daily after the implantation of pumps. All experiments were in accordance with EC guidelines for animal research and were approved by the animal ethics committee of the Ghent University.
In vivo imaging
The animals were imaged before pump implantation (day 0, n = 10) and at days 2 (n = 4), 7 (n = 4), 14 (n = 6) and 49 (n = 5). Three animals (AA3 and AA5 at day 2, AA1 at day 14, all from the same litter) did not wake up from anesthesia in the initial week of the experiment, and no further datasets were obtained in these animals. One animal (AA4) died in its cage at day 17. Detailed procedures for micro-CT and ultrasound imaging and post-processing were the same as26 and.23 Briefly, the mice were anesthetized with 1.5% isoflurane and, once anesthetized, injected intravenously in the lateral tail vein with 150 μL/25 g body weight of Aurovist (Nanoprobes, Yaphank, NY). The animals were subsequently scanned in supine position in a GE FLEX Triumph CT scanner (Gamma Medica-Ideas, Northridge, CA, USA). Several animals were not scanned at intermediate timepoints for ethical reasons, as their lateral tail vein did not tolerate the high number of contrast agent injections. Ultrasound data were obtained in all (surviving) animals at all timepoints with a high-frequency ultrasound apparatus (Vevo 2100, VisualSonics, Toronto, Canada) and Pulsed Doppler was used to assess flow velocities at ascending and distal abdominal aorta, in 7 additional locations throughout the descending and abdominal aorta. All ultrasound measurements were performed by a single operator (BT). An overview of the available data at the different time points is given in Table 1.
| AA1 | AA2 | AA3 | AA4 | AA5 | AA6 | AA7 | AA8 | AA9 | AA10 | |
|---|---|---|---|---|---|---|---|---|---|---|
| Micro-CT scan at baseline | + | + | + | + | + | + | + | + | + | + |
| Micro-CT scan at day 2 | + | + | x | + | x | + | – | + | + | – |
| Micro-CT scan at day 7 | – | + | + | – | + | – | + | + | ||
| PET scan at day 7 | – | + | + | – | + | – | + | + | ||
| Micro-CT scan at day 14 | x | + | – | – | + | – | + | + | ||
| PET scan at day 14 | + | – | – | + | – | + | + | |||
| Micro-CT scan at day 49 | + | x | + | + | + | + | + | |||
| Ascending aneurysm at day 49 | ⊕ | ⊝ | ⊕ | ⊕ | ⊕ | ⊝ | ||||
| Abdominal aneurysm at day 49 | ⊝ | ⊝ | ⊕ | ⊝ | ⊕ | ⊝ |
x: animal had died before or during the scan, +: scan obtained at this time point.
⊕: aneurysm observed at day 49 at this location, -: no scan obtained at this time point.
⊝: no aneurysm observed at day 49 at this location.
Obtained scans and observed end stage aneurysm location for all animals.
Molecular imaging
At days 7 and 14, those animals that tolerated the increased load on the lateral tail vein (AA2, AA7, AA9 and AA10) were injected with a cocktail of 150 μL/25 g body weight of Aurovist (micro-CT contrast agent) and 0.5 mCi 18F-FDG (PET tracer). A PET scan was taken 40 min after injection on the same GE FLEX Triumph scanner (Gamma Medica-Ideas, Northridge, CA, USA) that was used for the micro-CT images. The aorta was subdivided into 4 different zones (see data analysis). For each zone a volume of interest (VOI) was defined and the average number of PET counts in that VOI was normalized by the average number of counts in the liver and the amount of injected activity.
Histology
At the end of the study, aortas were isolated, fixated in 4% formaldehyde (pH 7.4) for 24 h, dehydrated overnight and embedded in paraffin. Serial cross sections (5 μm) were prepared for histological analysis. Morphologic appearance of the aorta was evaluated on orcein stained slides collected serially from the proximal to the distal aorta (every 2.5 mm).
Aortic regurgitation
Both the negative part of the flow velocity waveform (due to backflow during diastole) and the positive part of the flow velocity waveform (due to ejected blood during systole) were quantified via numerical integration in Matlab (Mathworks, Natick, MA). The ratio of negative over positive flow rate (expressed as a percentage) was used as a metric to quantify the amount of backflow at different time points.
Data analysis
The location of the aneurysm was quantified as described in our previous work26 using the Vascular Modeling ToolKit (VMTK) to project the intermediate and end stage geometries onto the baseline geometry and to compute a distance map between both. Such a distance map quantifies the local amount of dilatation, as it allows us to visualize the distance to the end-stage geometry in every single node of the baseline geometry. High distance values can then be used to identify the (at that stage yet to be developed) aneurysm location on the baseline geometry. For the global data analysis the aorta of each animal was divided into 4 zones: ascending aorta, thoracic aorta, proximal abdominal aorta and distal abdominal aorta. The transition point between different zones was determined in an automated way, using the bifurcations of side branches (brachiocephalic trunk, celiac artery and mesenteric artery respectively) as landmarks. Box plots were used to compare the distribution of PET and distance metrics over each zone.
Results
Natural history
An overview of the scanned time points and the observed aneurysms for all animals is given in Table 1. Of the 6 animals surviving the complete procedure, 2 animals did not develop any aneurysm (AA6 and AA10), 1 animal developed an ascending aortic aneurysm (AA2), and 3 animals developed both ascending and abdominal aortic aneurysms (AA7, AA8 and AA9). Since not all scans succeeded in AA8, AA7 and AA9 were chosen as representative examples to visualize the results. Aneurysm presence was defined based on a 140% increase in the outer wall diameter on the ultrasound images (compared to the baseline value), and confirmed by post-mortem observation of dilatation on the excised tissue.
Ascending versus abdominal aneurysm
As can be observed in Figs. 1 and 2, the ascending aortic aneurysm gradually increased in size, while the abdominal aneurysm either appeared in between scan times at day 14 (e.g. AA7) or sometimes was not associated with an increased lumen diameter at all (e.g. AA9). This difference between both aneurysm types is visualized in the histological stainings in Fig. 3. A clear difference in the morphological appearance of the vessel wall can be observed between aneurysmatic and non-aneurysmatic animals, and between the ascending and abdominal aneurysmatic wall. In the non-aneurysmatic animal, the aortic lumen was not enlarged and the outer wall was clearly delineated in both the ascending and the abdominal aorta. In both ascending aneurysms, histological stainings reveal a good qualitative agreement with reconstructed micro-CT (lumen) geometries: an enlarged (lumen) vessel diameter could be observed in both. In the abdominal aneurysms, the difference between the reconstructed micro-CT (lumen) geometry and histological stainings was more prominent. In AA7 a false lumen appeared, which was also detected on reconstructed micro-CT geometries, and the aneurysm was associated with extensive aortic wall remodeling. In AA9 wall remodeling also occurred, but the aortic lumen diameter was not affected as much by the aneurysm.
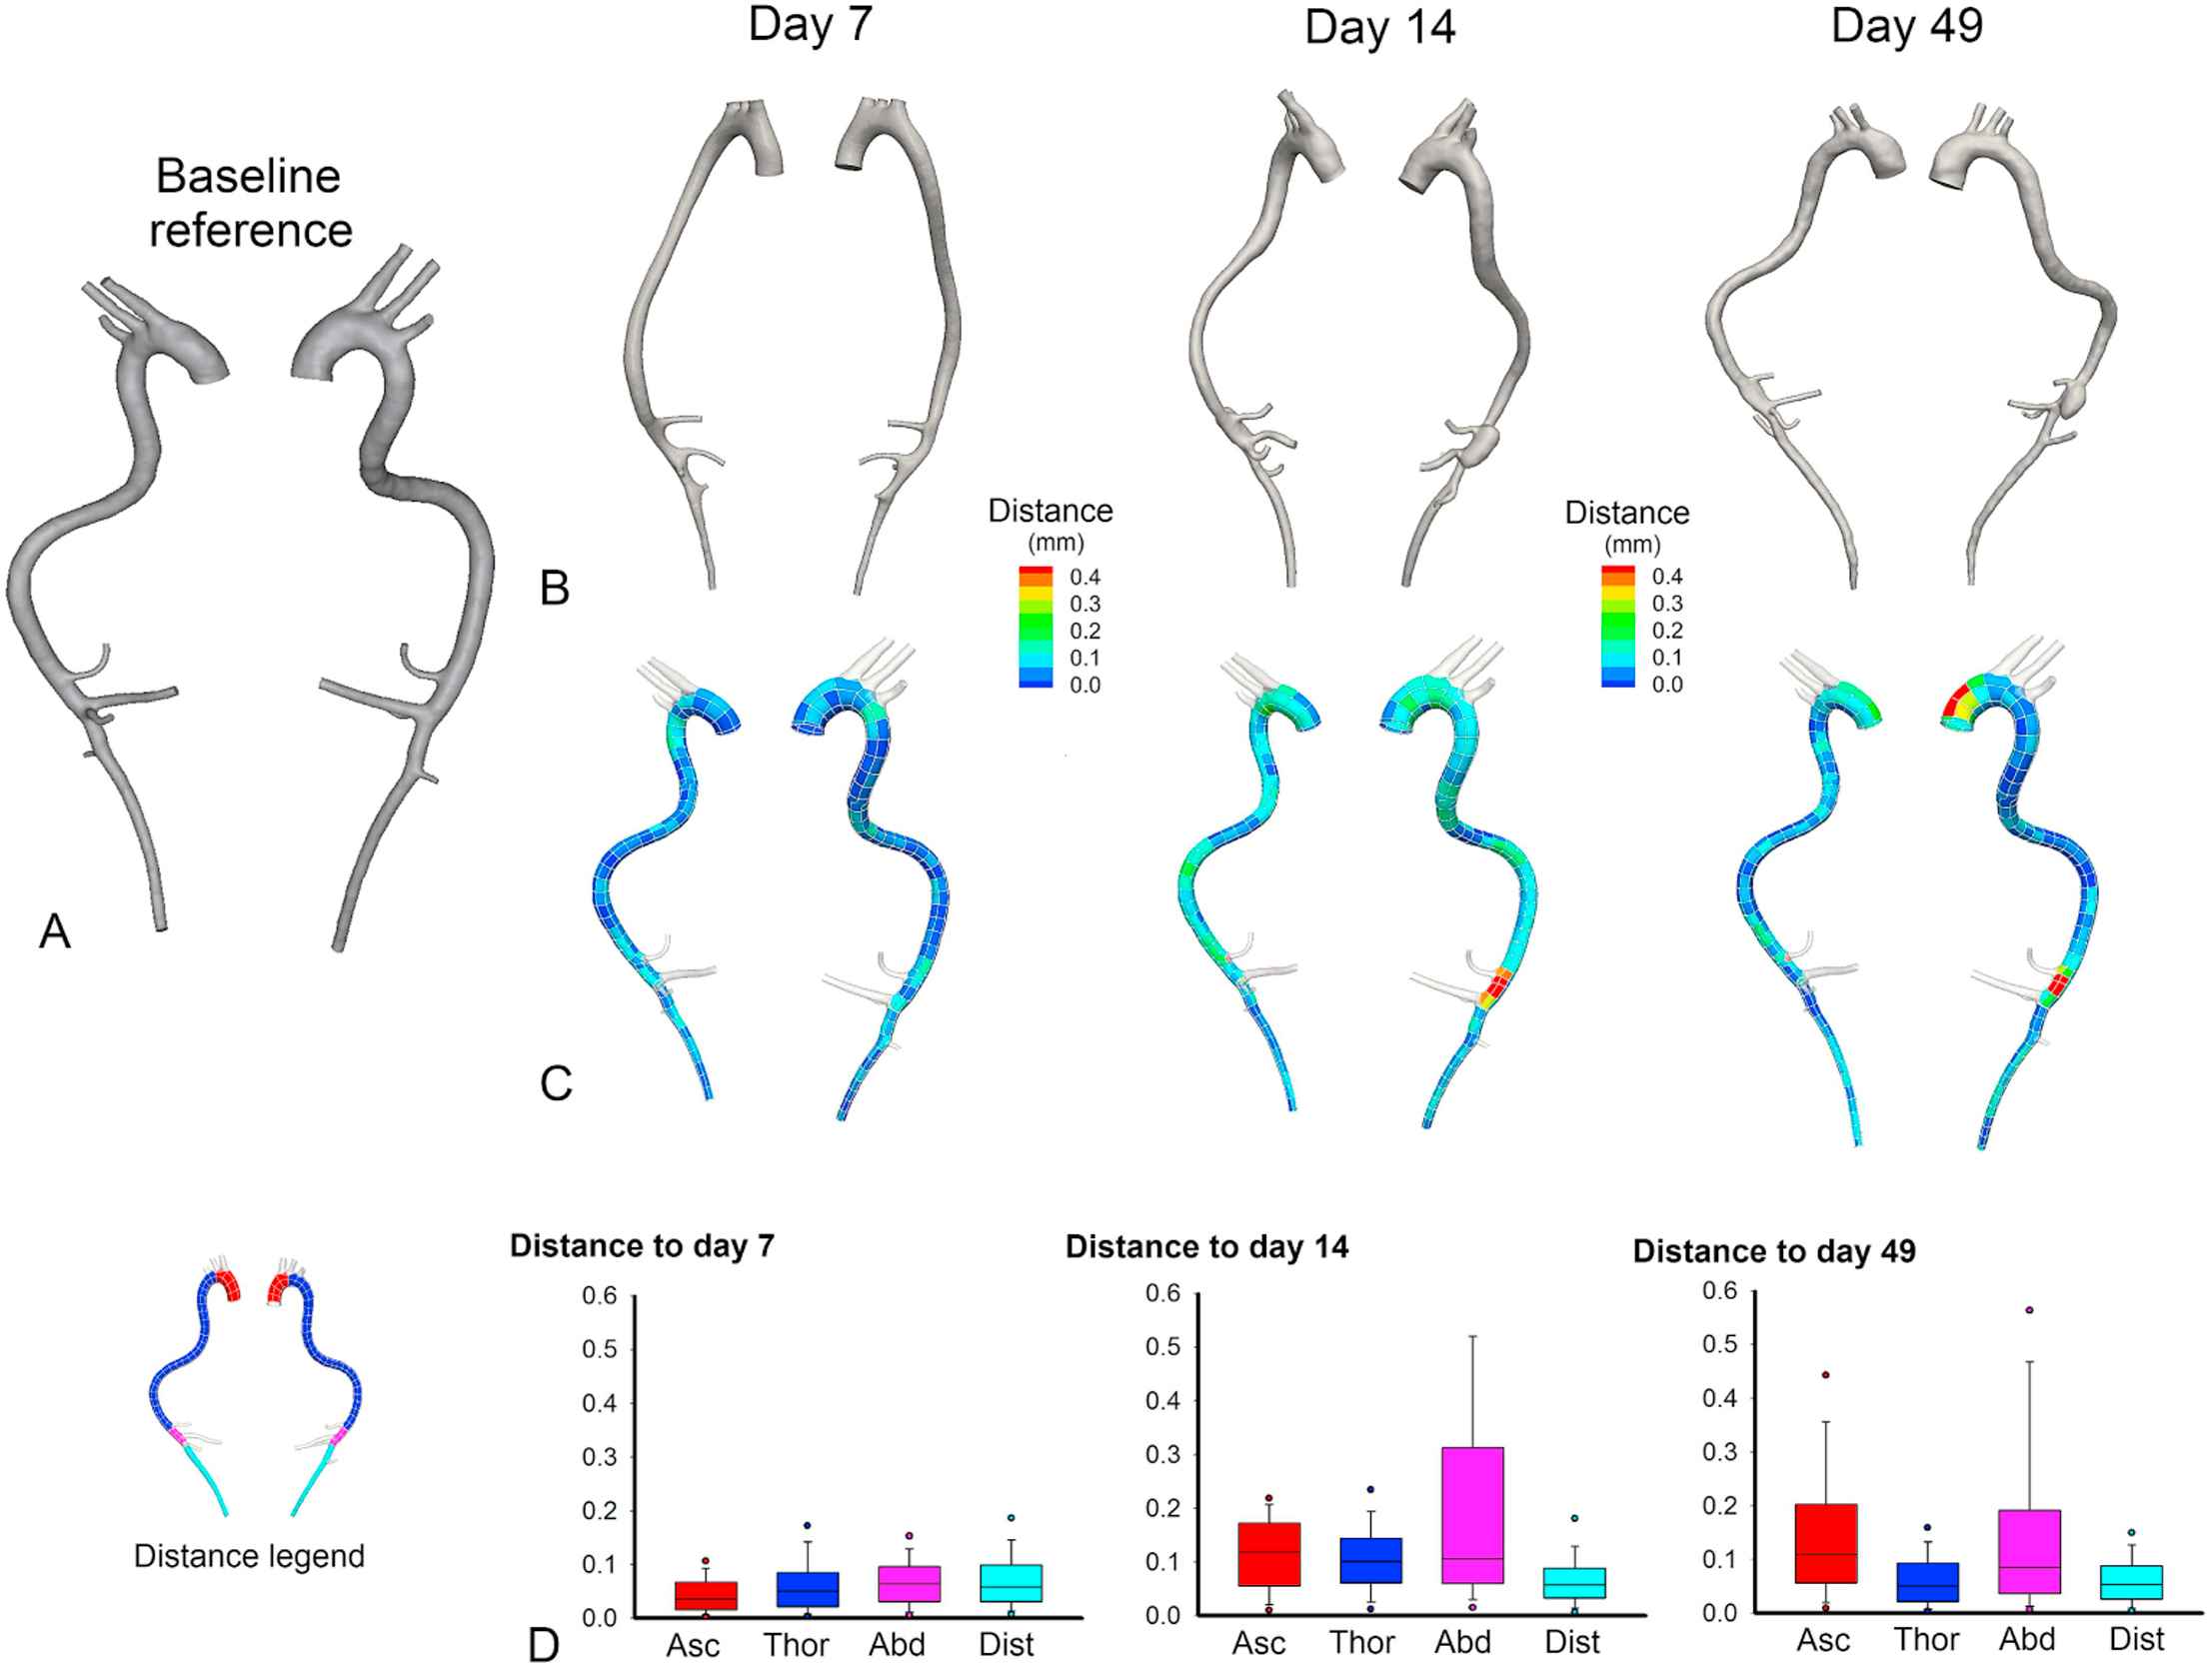
Geometry evolution over time based on in vivo micro-CT images in AA7. A. Baseline reference geometry. B. Evolution over time of the aortic geometry based on in vivo micro-CT scans. C. A distance map quantifies the local amount of dilatation in the intermediate and end stage geometries. The distance from the baseline geometry to the end-stage geometry is calculated in every single node of the baseline geometry. High distance values thus allow us to identify aneurysm location (at a later time point) on the baseline geometry. D. Box plots showing the distribution along the aorta of distance to the baseline geometry. All box plots are colored according to their aortic zone, as indicated in the legend on the left: red = ascending aorta, dark blue = thoracic aorta, pink = proximal abdominal aorta, light blue = distal abdominal aorta. The ascending aortic aneurysm can be observed to increase slowly over time, while the abdominal aneurysm arises abruptly in between scan times. (For interpretation of the references to color in this figure legend, the reader is referred to the web version of this article.)
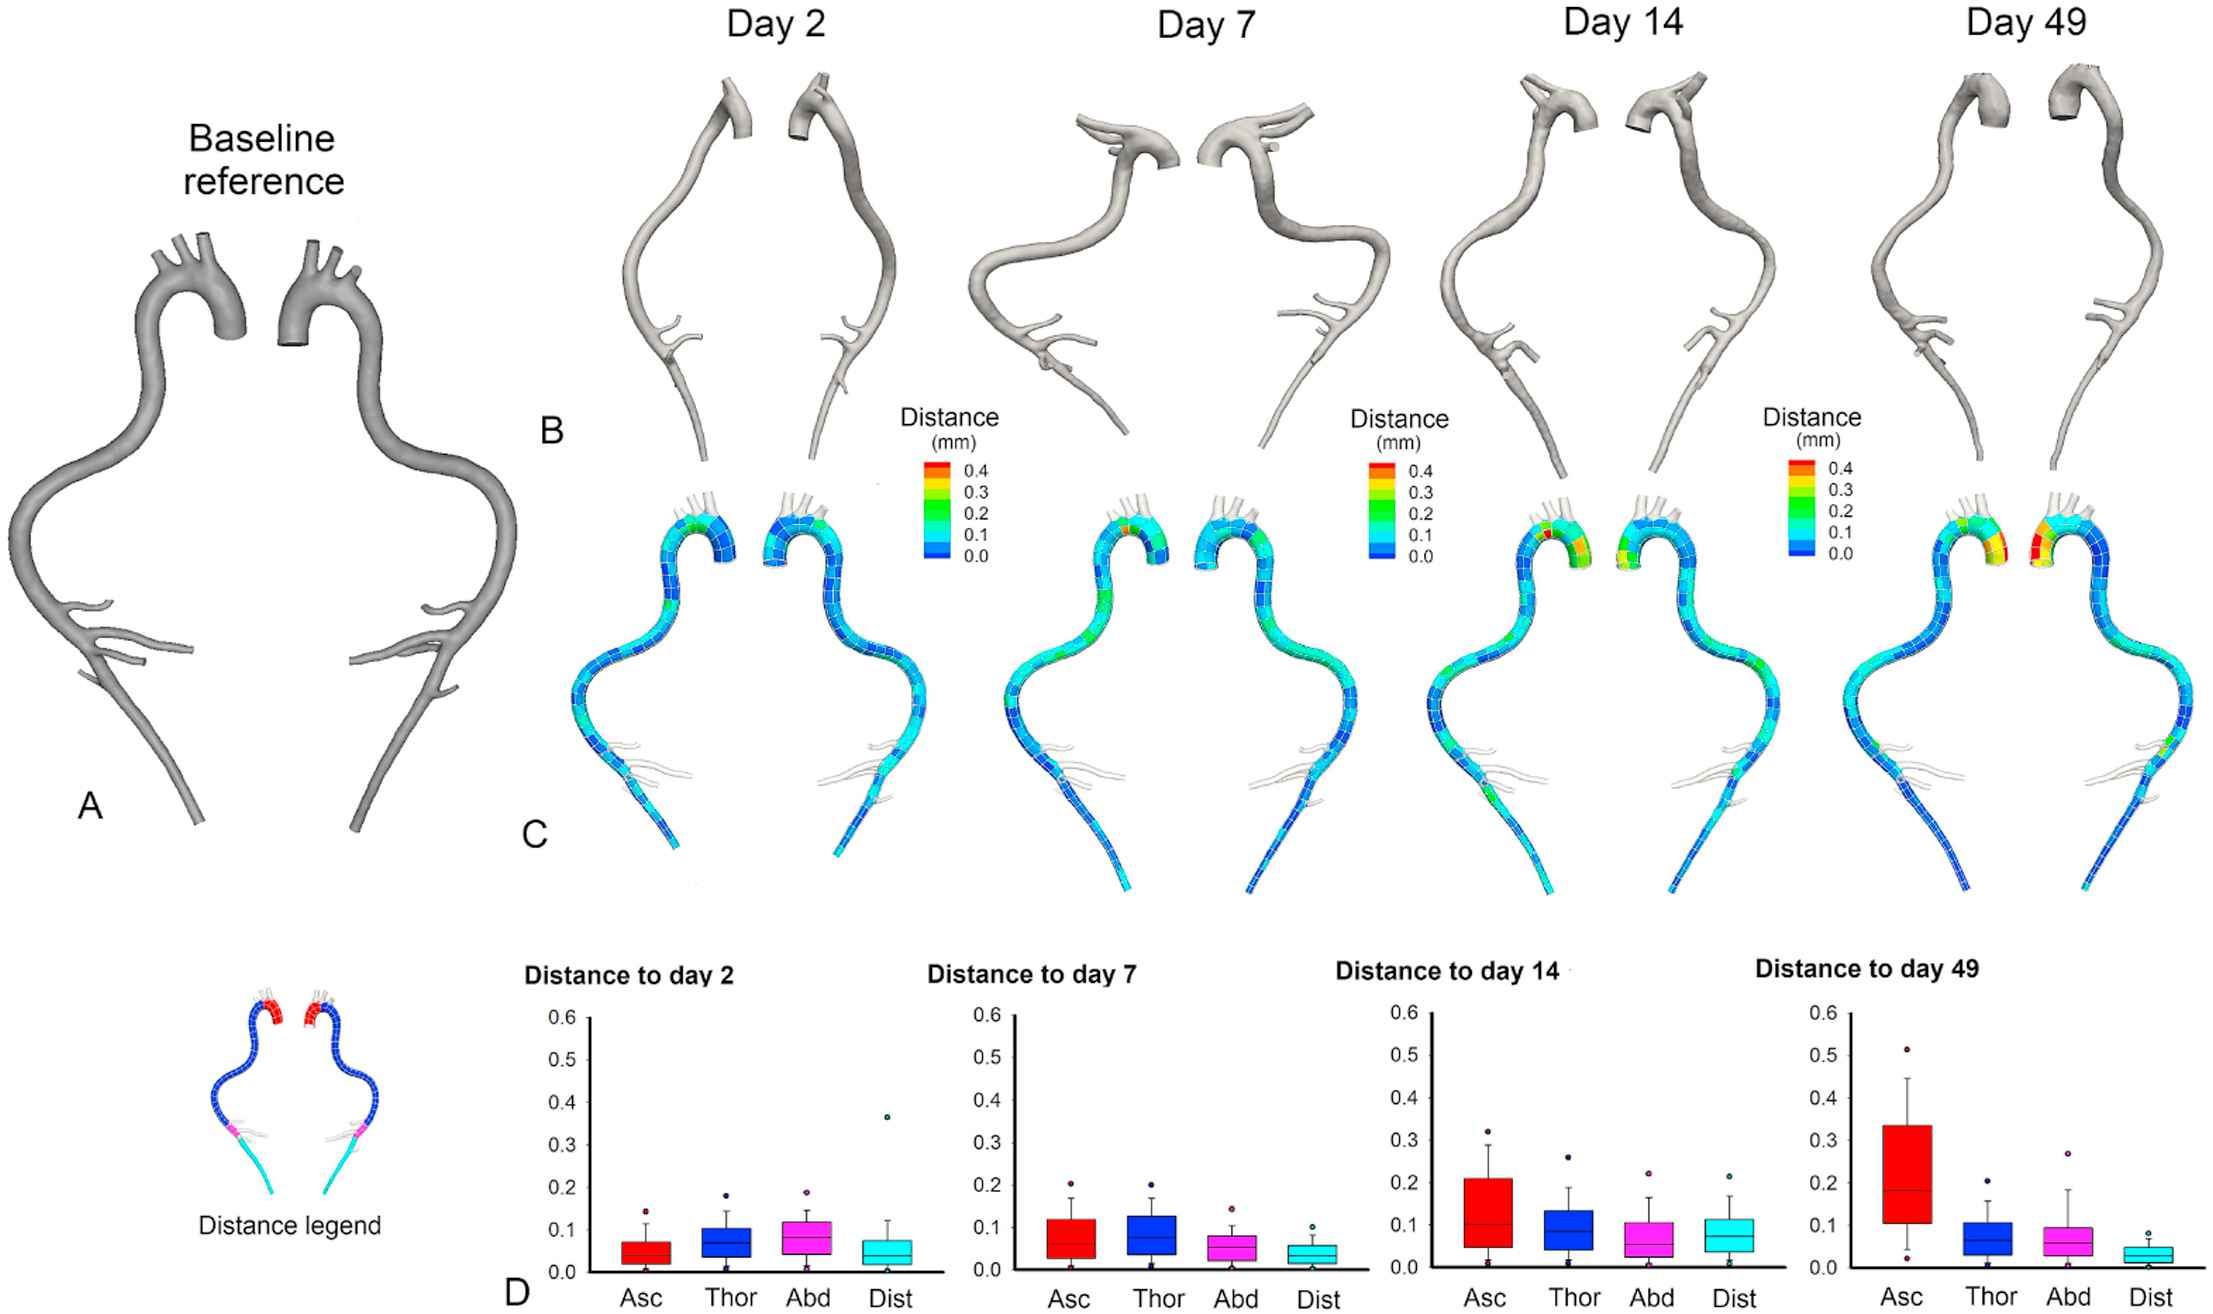
Geometry evolution over time based on in vivo micro-CT images in AA9. A. Baseline reference geometry. B. Evolution over time of the aortic geometry based on in vivo micro-CT scans. C. A distance map quantifies the local amount of dilatation in the intermediate and end stage geometries. The distance from the baseline geometry to the end-stage geometry is calculated in every single node of the baseline geometry. High distance values thus allow us to identify aneurysm location (at a later time point) on the baseline geometry. D. Box plots showing the distribution along the aorta of distance to the baseline geometry. All box plots are colored according to their aortic zone, as indicated in the legend on the left: red = ascending aorta, dark blue = thoracic aorta, pink = proximal abdominal aorta, light blue = distal abdominal aorta. The ascending aortic aneurysms can be observed to increase slowly over time, while the abdominal aneurysm is not distinguishable on micro-CT images. (For interpretation of the references to color in this figure legend, the reader is referred to the web version of this article.)
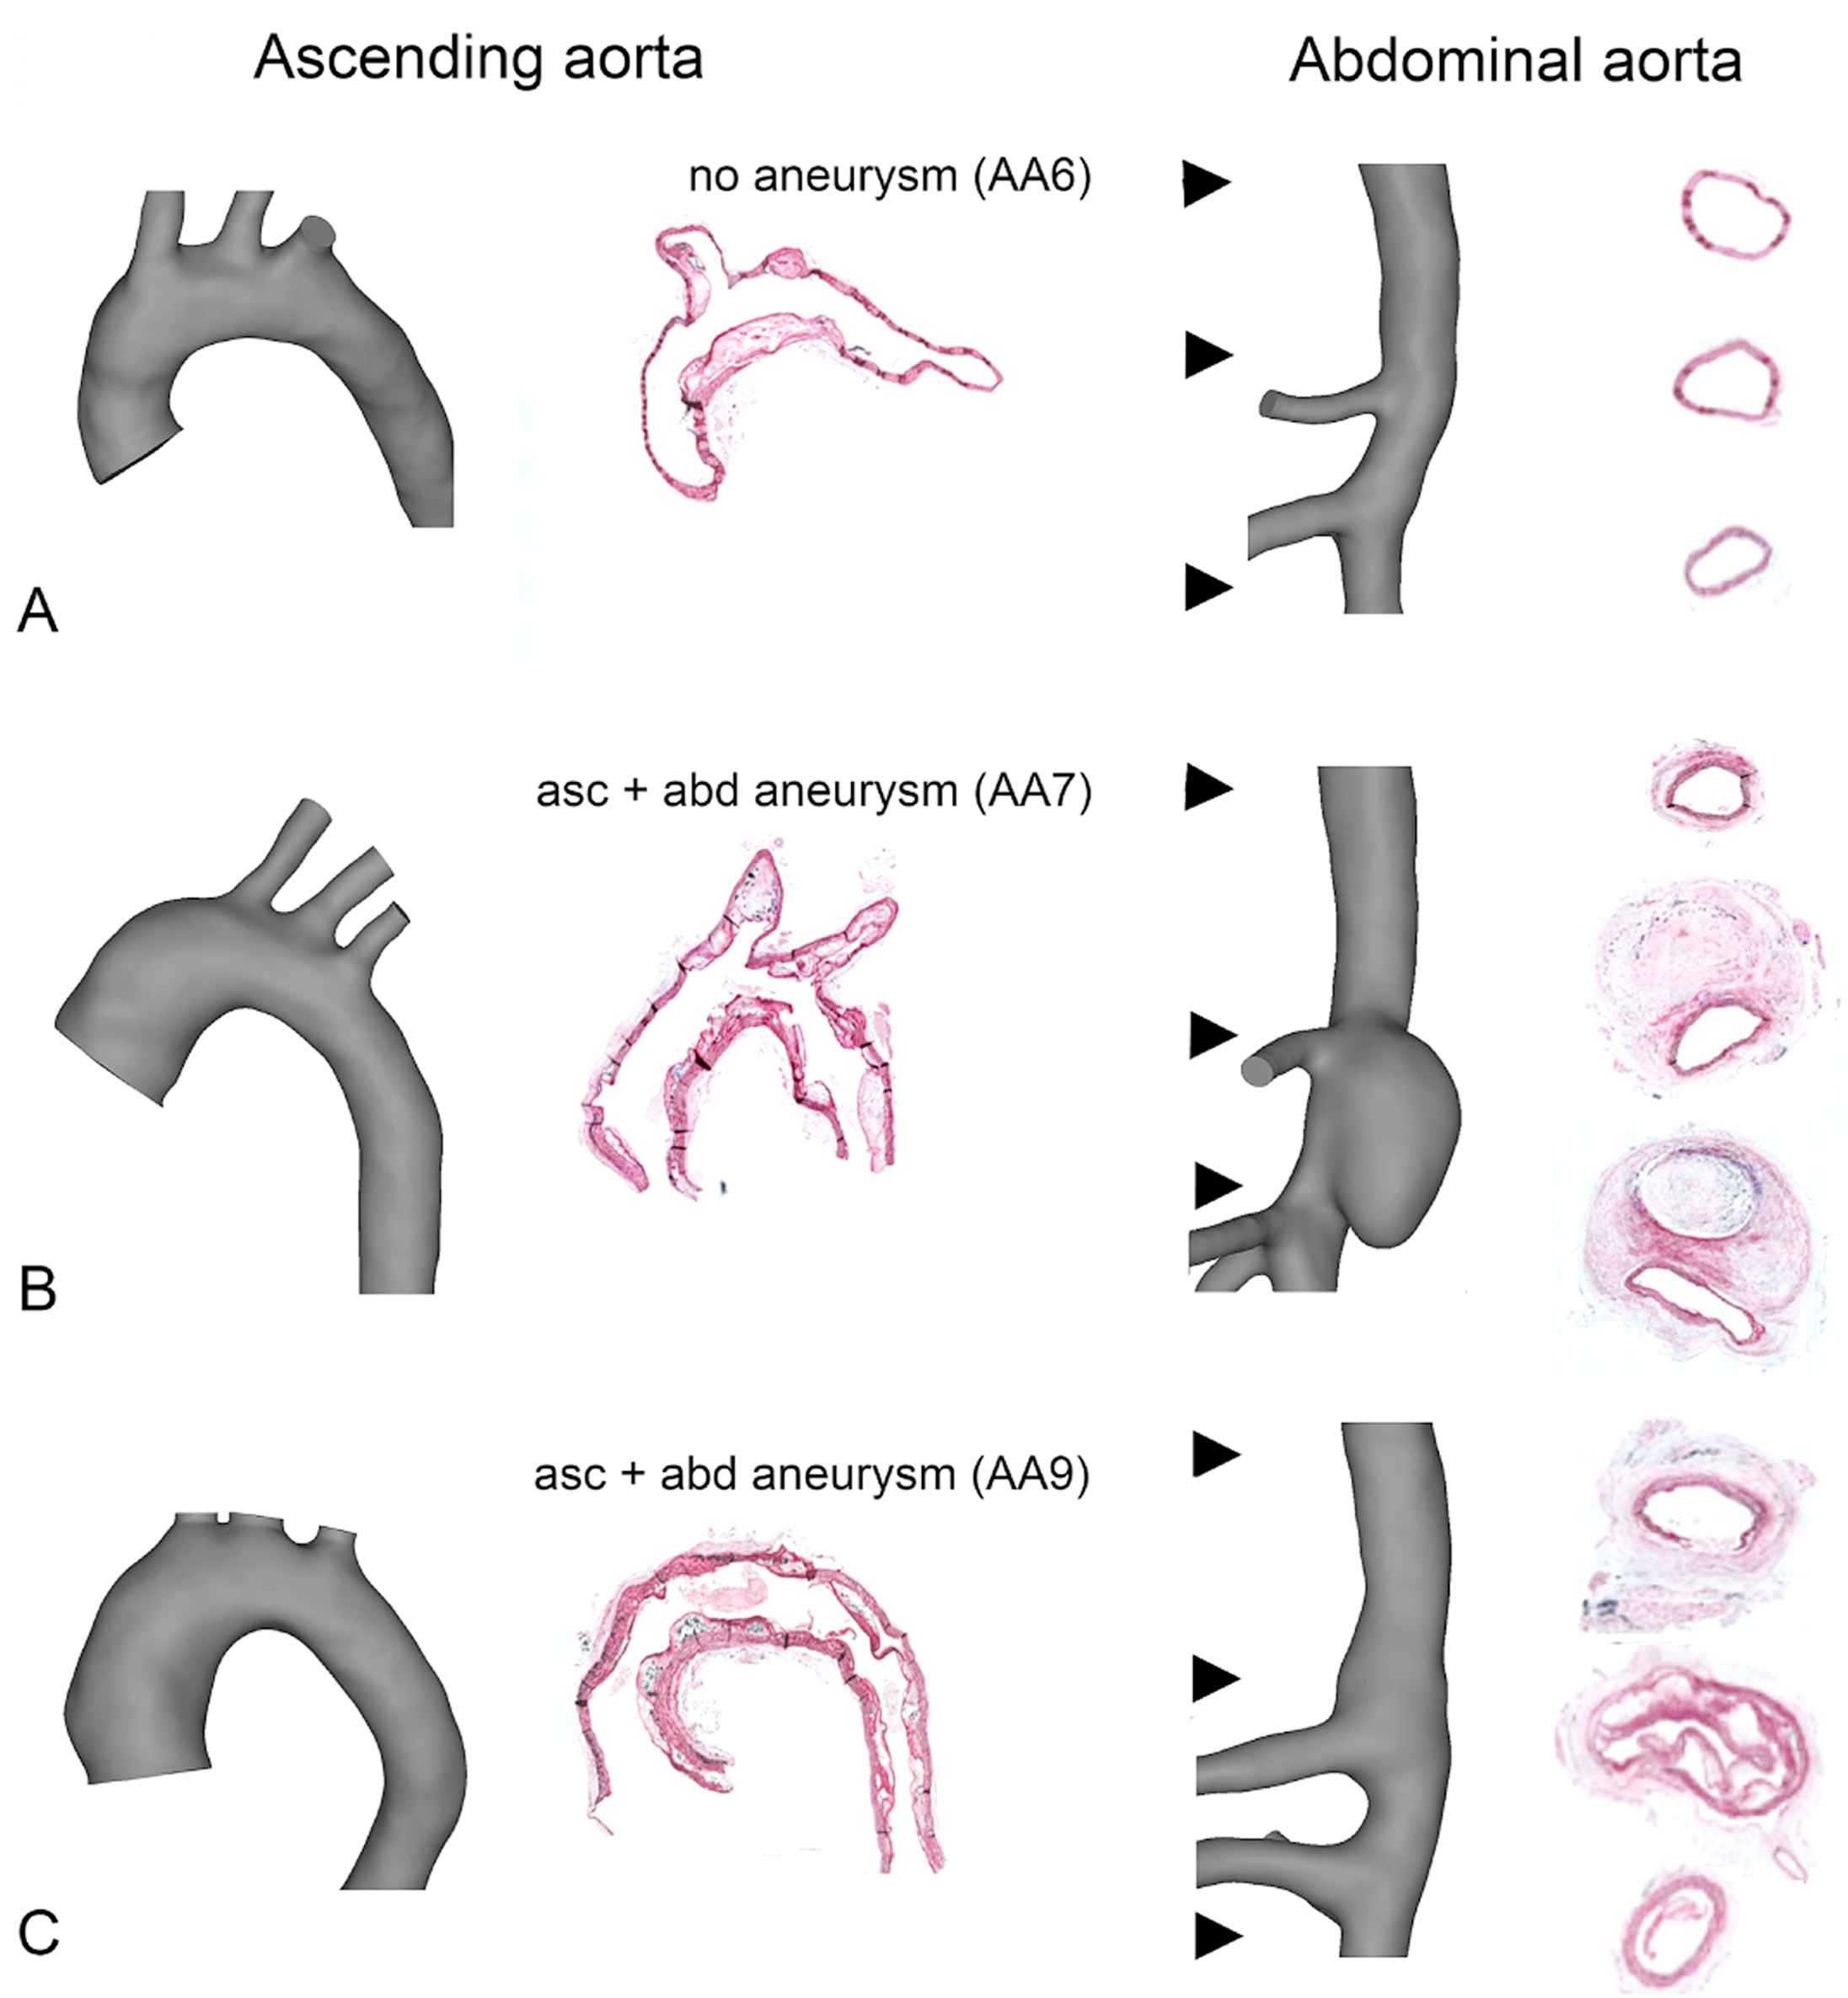
Histological orcein stainings and segmented micro-CT geometries in the ascending aorta (left panels) and abdominal (right panels) aorta. A. AA6: In animals that do not develop aortic aneurysm, no lumen dilatation is observed and the media is clearly delineated. B. AA7. The ascending aortic aneurysm shows a dilated aortic lumen. In the abdominal aorta, a false lumen appears and extensive wall remodeling occurs C. AA9. The ascending aortic aneurysm shows a dilated aortic lumen. In the abdominal aorta, wall remodeling occurs but the aortic lumen is not affected.
Aortic regurgitation and aneurysm formation
Ascending aortic flow measurements at intermediate time points revealed that ascending aortic aneurysm formation was associated with aortic valve insufficiency. At baseline, a small amount of backflow was present just after valve closure in all animals: 5.5 ± 2.0% in the animals not developing an ascending aortic aneurysm (AA6 and AA10) and 3.6 ± 4.8% in the animals that developed an ascending aortic aneurysm (AA7, AA8, AA9). However, from day 7 on all aneurysm developing animals also showed backflow in the ascending aorta in various degrees of severity (11.5 ± 6.2% at day 7, 19.8 ± 8.2% at day 14 and 11.9 ± 5.8% at day 49). This backflow was present throughout diastole, and not just after valve closure as was the case at baseline. As can be seen in Fig. 4 backflow remained low in the animals not developing an ascending aortic aneurysm, and moreover backflow in these animals is restricted to the moment just after valve closure (not shown). In none of the investigated animals backflow was observed in the abdominal aorta.
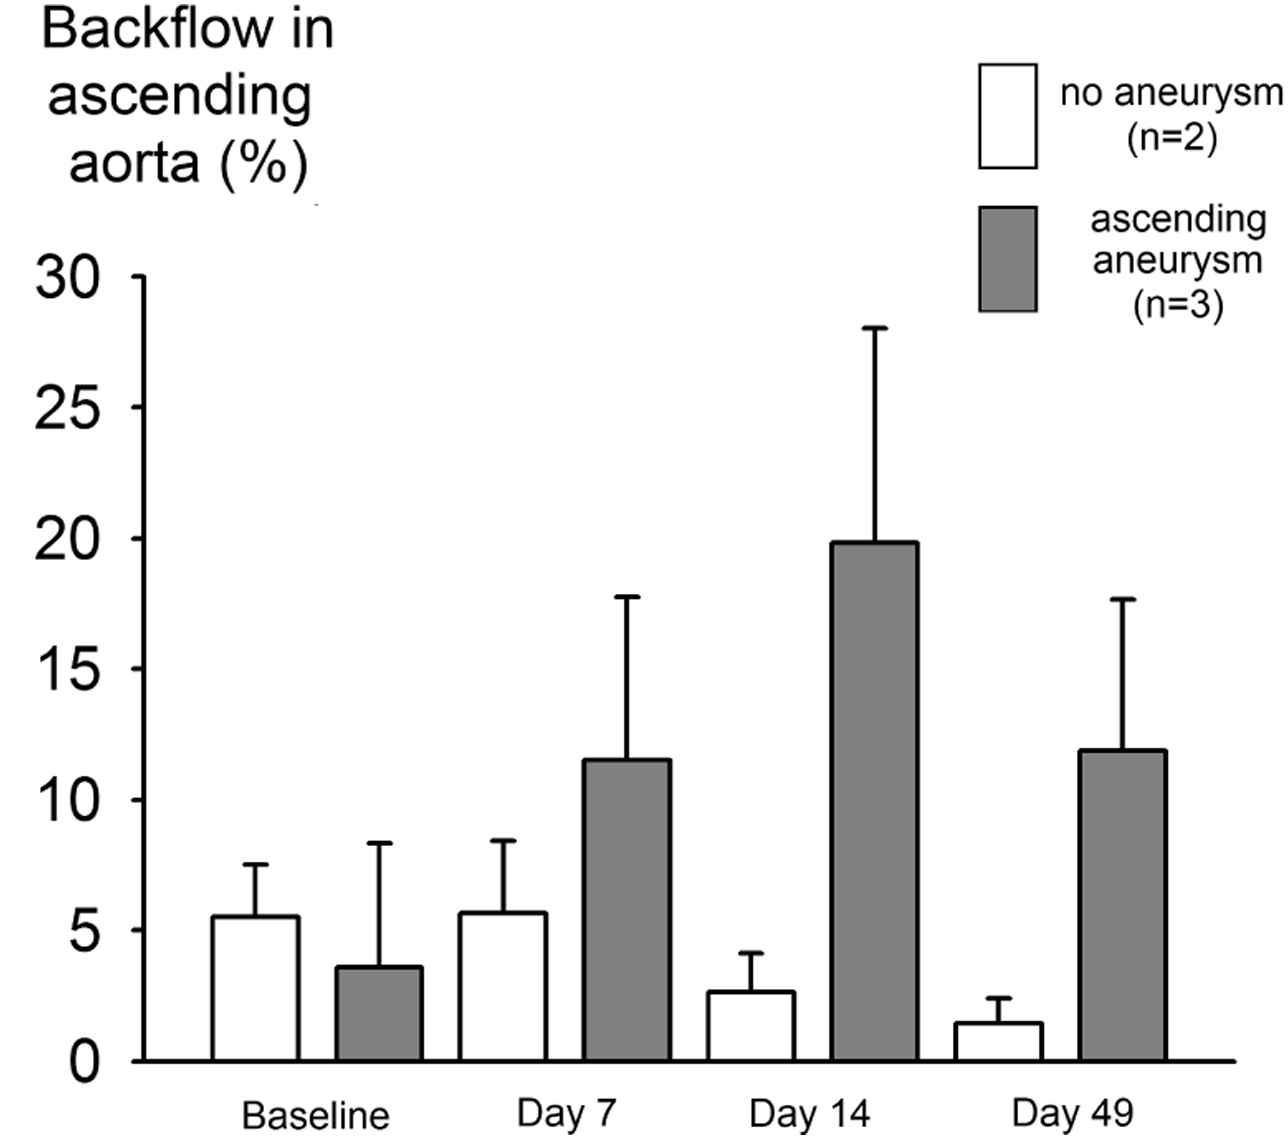
Diastolic aortic regurgitation occurs only in animals developing ascending aortic aneurysm. Pulsed Doppler velocity recordings were traced to obtain flow velocity waveforms in the ascending aorta. The boxes represent the ratio of negative flow (flowing back through the valve during diastole) over positive flow (ejected during systole), expressed as a percentage. At baseline, only a small amount of regurgitation is present in all animals. This backflow occurs just after valve closure (data not shown). As the aneurysm develops, more severe backflow is measured that persists throughout diastole. In animals not developing an ascending aortic aneurysm, backflow is much smaller and remains restricted to the moment just after valve closure.
PET and aneurysm formation
Figure 5 shows the results of a preliminary PET study that was conducted in 4 animals at 2 different timepoints. At day 14, an increased ascending aortic 18F-FDG uptake is found in all animals developing ascending aortic aneurysm (AA2: +25%, AA7: +136% and AA9: +93%) while no such increase could be detected in the only scanned animal not developing ascending aortic aneurysm (AA10: −33%). In the abdominal aorta the same holds: aneurysmatic animals show an increased 18F-FDG uptake (AA7: +90% and AA9: +110%) while non-aneurysmatic animals do not (AA2: −9%, AA10: −1%). In all aneurysmatic animals, the increase in 18F-FDG uptake is not restricted to the aneurysmatic zone, but is also found in neighboring thoracic (AA2: +17%, AA7: +135%, AA9: +216%) or distal aortic zones (AA7: +58%, AA9: +57%). PET does, however, not have a prognostic value at day 7. The ascending aortic 18F-FDG uptake (red histograms in Fig. 5A) at day 7 is slightly elevated in AA2 but not in AA7, AA9 and AA10. The abdominal 18F-FDG uptake (pink histograms in Fig. 5A) at day 7 is similar for all 4 imaged animals.
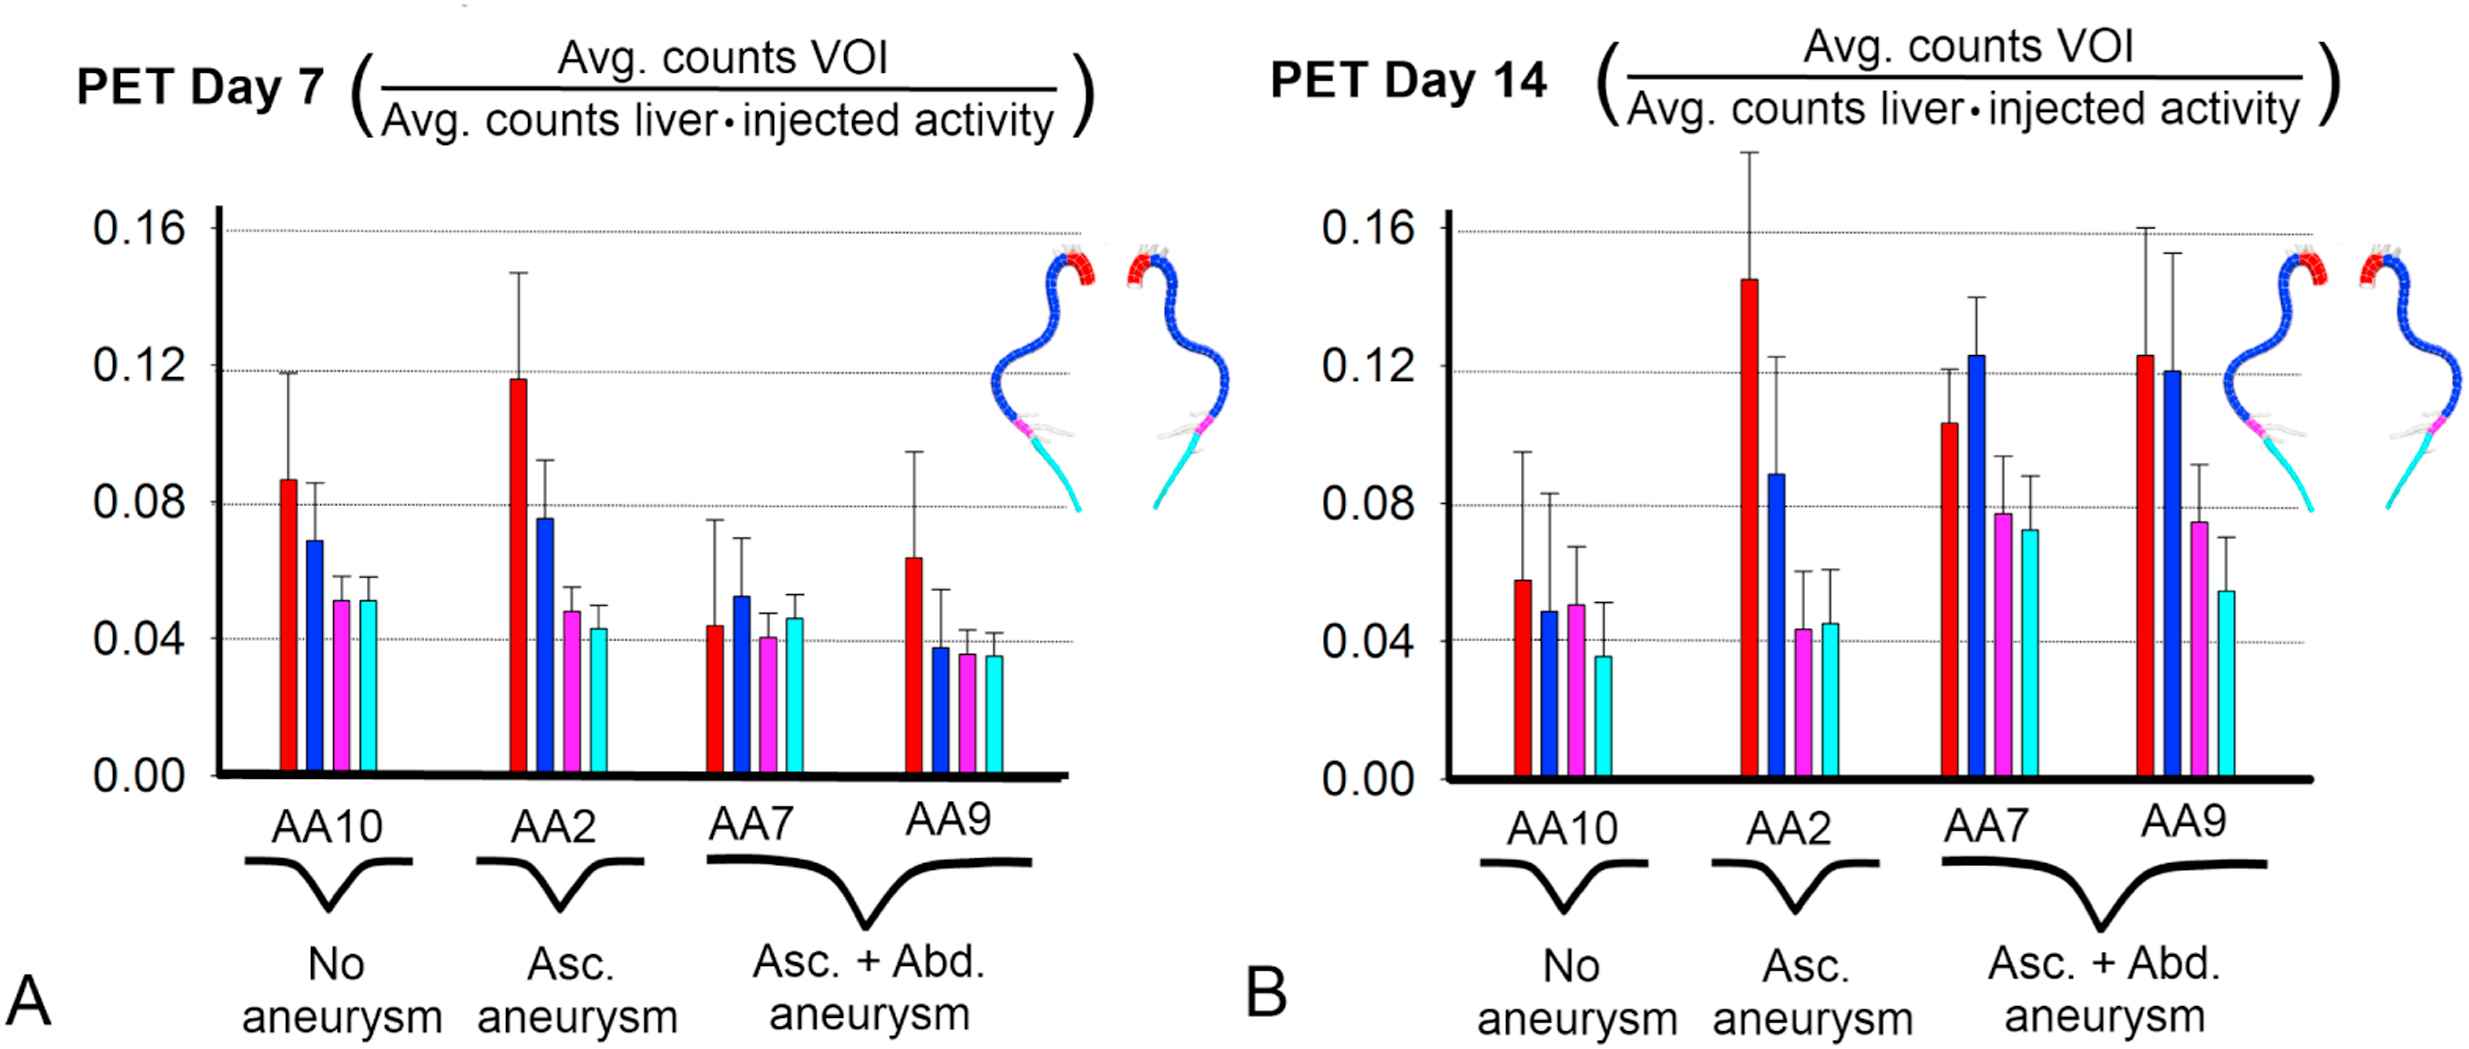
PET imaging 7 and 14 days after angiotensin II-infusion in 4 animals. Histograms are colored according to their volume of interest (VOI). VOIs are defined in the same aortic zones as for the hemodynamic analysis in Figures 1 and 2, as indicated in the legend on top: red = ascending aorta, dark blue = thoracic aorta, pink = proximal abdominal aorta, light blue = distal abdominal aorta. 18F-FDG uptake is quantified as the average number of counts in the VOI, and normalized by the average number of counts in the liver and the amount of injected activity. A. There is no difference between animals that later on develop aortic aneurysm and animals that don’t. B. 18F-FDG uptake is markedly increased in the ascending aorta for those animals developing ascending aortic aneurysm (AA2, AA7 and AA9) and in the abdominal aorta for those animals developing AAA (AA7 and AA9). In these animals, 18F-FDG uptake is also increased in neighboring zones. In animals that don’t develop aortic aneurysm (AA10 and the abdominal part of AA2) no such increased uptake was found. (For interpretation of the references to color in this figure legend, the reader is referred to the web version of this article.)
Discussion
Ascending versus abdominal aortic aneurysm
This is the first study in which the initial stages of ascending as well as abdominal aortic aneurysms are followed up closely within the same animal model. Our data suggest that a different mechanism is driving both aneurysm types: the increase in lumen diameter over time detected on micro-CT images and the aortic wall composition observed from histological stainings are different at both locations. These findings are consistent with the observations of Daugherty et al.,14 who described ‘highly contrasting pathologies’ between both aneurysm types in the angiotensin II-infused model. They reported that while AAAs are caused by a highly localized transmural elastin disruption combined with a highly focal medial macrophage accumulation, their ascending aortic counterparts exhibit extensive (non-transmural) elastin fragmentation, combined with (non-focal) macrophage accumulation throughout the medial layers. Interestingly, differences between ascending and abdominal aneurysm have also been reported in a human setting. For example, thrombus formation occurs in abdominal but not in ascending aneurysms in human patients.27,28,5
Aortic regurgitation and aneurysm formation
The observed ascending aortic backflow in Fig. 4 may be very important. These are, to the best of our knowledge, the first data to show that, in the angiotensin II-infused ApoE−/− mouse model, aortic valve insufficiency is present in mice developing an ascending aortic aneurysm. Both diastolic backflow and ascending aortic aneurysm are noticeable from day 7 on and evolve to a more severe stage over time. Unfortunately, we did not obtain data in all animals at day 2 or at later time points, so it is difficult to determine whether diastolic backflow is occurring first and aneurysm is a consequence of it, or vice versa.
PET and aneurysm formation
Positron Emission Tomography (PET) is a functional imaging technique that is used in a clinical setting to detect biological processes such as inflammation at an early stage. In human aortic aneurysms, an increased PET uptake of 18F-FDG, an analogue of glucose, is associated with increased inflammation and AAA wall instability.29–31 In small animals, this technique might therefore allow for the detection of aneurysmatic activity before it can be observed macroscopically on ultrasound or micro-CT images. In our preliminary PET study, limited by a small number of imaged subjects, we observed that 18F-FDG uptake is increased at day 14 in both aneurysmatic zones, indicating that inflammation is likely involved in ascending as well as abdominal aneurysm formation. Moreover PET confirmed aneurysm presence at day 14 with a high specificity, discriminating between aneurysmatic (increased uptake) and non-aneurysmatic (no increased uptake) animals in both the ascending and the abdominal aorta. At day 7 however, the ascending aortic PET signal was only elevated in one animal developing aneurysm (AA2), but not in two others (AA7 and AA9).
Additional scanning at earlier timepoints (between days 7 and 14) might increase the prognostic value for ascending aortic aneurysms. In the abdominal aorta, this might be more challenging since the onset of AAA appears to be more sudden than the ascending aorta (see Fig. 1) and one risks scanning too early or too late. PET analysis was performed in VOIs that matched the aortic zones used in the hemodynamic analysis, for reasons of uniformity. Qualitative evaluation of the original PET images revealed that the increased uptake of 18F-FDG in non-aneurysmatic zones of aneurysmatic animals is most likely related to a general increase in inflammation over the entire aorta (data not shown). The ascending aortic PET signal may also experience some influence of the vicinity of the heart.
Limitation of in vivo micro-CT
We have based the presence of aortic aneurysm on B-Mode ultrasound images and on a macroscopic evaluation of the aorta just after autopsy. In AA8 and AA9, the end stage abdominal aneurysm (present on B-Mode ultrasound (not shown), post-mortem and PET images) is hardly detectable on the 3D volume segmented from the micro-CT images. While indispensable to follow-up on aneurysm morphology at intermediate stages in vivo, micro-CT only visualizes the aortic lumen and does not allow us to assess wall properties. It is known that medial and adventitial remodeling occur in the abdominal aorta of this mouse model,15 which may in some cases cause significant differences between the circumferential shape of interior and exterior AAA wall. Most likely the AAA in these subjects consists predominantly of thrombus, and unlike in AA7 no blood is entering the aneurysmal lumen. Consequently, the calculated distance map in these particular cases may not correspond entirely to the actual aneurysmatic region. We conclude that contrast-enhanced micro-CT is better suited to follow-up on ascending aortic aneurysm than AAA, a finding that should be kept in mind for future studies.
Conclusion
We investigated whether new imaging techniques can be used to elucidate the differences between ascending and abdominal aneurysms in the angiotensin II - infused ApoE−/− mouse model. Longitudinal follow-up with micro-CT and histological analysis showed that the ascending aortic aneurysm grows slowly, while the abdominal aneurysm appears more abruptly. Furthermore diastolic backflow was detected from day 7 on in animals developing an ascending aortic aneurysm, while no backflow was present in the abdominal aorta. Whether aortic valve insufficiency precedes ascending aortic aneurysm formation remains to be elucidated. Finally, PET imaging showed increased 18F-FDG uptake at both ascending and abdominal aneurysmatic zones at day 14, but was not predictive at day 7. We conclude that longitudinal micro-CT, PET and ultrasound are promising techniques that should be further explored to demonstrate differences between ascending and abdominal aneurysms in the angiotensin II-infused ApoE−/− mouse model, especially in terms of hemodynamics and morphology.
Acknowledgment
The authors wish to acknowledge Philippe Joye and Scharon Bruneel from the Ghent University small animal imaging lab (INFINITY) for their assistance with the micro-CT and PET scans and Rita Van Den Bossche for her assistance with the histology. This research was funded by the Special Research Fund of the
References
Cite this article
TY  - JOUR
AU  - Bram Trachet
AU  - M. Renard
AU  - C. Van der Donckt
AU  - S. Deleye
AU  - J. Bols
AU  - G.R.Y. De Meyer
AU  - S. Staelens
AU  - B.L. Loeys
AU  - P. Segers
PY  - 2014
DA  - 2014/02/01
TI  - Longitudinal follow-up of ascending versus abdominal aortic aneurysm formation in angiotensin II-infused ApoE−/− mice
JO  - Artery Research
SP  - 16
EP  - 23
VL  - 8
IS  - 1
SN  - 1876-4401
UR  - https://doi.org/10.1016/j.artres.2014.01.001
DO  - 10.1016/j.artres.2014.01.001
ID  - Trachet2014
ER  -