
Quantification of arterial wall inhomogeneity size, distribution, and modulus contrast using FSI numerical pulse wave propagation
Present address: Mechanical Engineering Department at Stevens Institute of Technology, Hoboken, NJ 07030, USA.
- DOI
- 10.1016/j.artres.2014.01.006How to use a DOI?
- Keywords
- FSI simulations; Aortic wall inhomogeneities; Pulse wave velocity (PWV); Pulse wave imaging (PWI)
- Abstract
Changes in aortic wall material properties, such as stiffness, have been shown to accompany onset and progression of various cardiovascular pathologies. Pulse Wave velocity (PWV) and propagation along the aortic wall have been shown to depend on the wall stiffness (i.e. stiffer the wall, higher the PWV), and can potentially enhance the noninvasive diagnostic techniques. Conventional clinical methods involve a global examination of the pulse traveling between femoral and carotid arteries, to provide an average PWV estimate. Such methods may not prove effective in detecting focal wall changes as entailed by a range of cardiovascular diseases. A two-way-coupled fluid-structure interaction (FSI) simulation study of pulse wave propagation along inhomogeneous aortas with focal stiffening and softening has previously proved the model reliable. In this study, simulations are performed in inhomogeneous aortic walls with hard inclusions of different numbers, size and modulus in order to further characterize the effects of focal hardening on pulse wave propagation. Spatio-temporal maps of the wall displacement were used to analyze the regional pulse wave propagations and velocities. The findings showed that the quantitative markers – such as PWVs and r2s on the pre-inclusion forward, reflected and post-inclusion waves, and the width of the standing wave – as well as qualitative markers – such as diffracted reflection zone versus single reflection wave – allow the successful and reliable distinction between the changes in inclusion numbers, size and modulus. Future studies are needed to incorporate the wall softening and physiologically-relevant wall inhomogeneities such as those seen in calcifications or aneurysms.
- Copyright
- © 2014 Association for Research into Arterial Structure and Physiology. Published by Elsevier B.V. All rights reserved.
- Open Access
- This is an open access article distributed under the CC BY-NC license.
Introduction
Onset and progression of majority of cardiovascular diseases (CVDs) have been shown to be accompanied by variations in the vascular structural – and thus mechanical – properties. In particular, change in aortic wall stiffness has been reported as an independent indicator of CVDs such as aortic calcifications and aneurysm.1–3 Assessing arterial stiffness has been collectively and increasingly recommended to be an essential part of clinical diagnosis, therapy and follow up procedures.4,5 Based on the Moens–Korteweg relationship, the velocity of the aortic pulse wave has been shown related to the underlying wall stiffness – the stiffer the wall, the higher the pulse wave velocity (PWV)6,7 and therefore can be used as a surrogate to estimate wall stiffness. The method for estimating PWV currently used in clinical practice is based on measuring the temporal pulse pressure profiles at two distant sites such as carotid and femoral arteries,4,8 and obtain an average velocity as over-the-skin-measured distance divided by the time delay between the pulse profiles.9,10 The carotid-femoral-based methods are subject to inaccuracies primarily due to the incorrect arterial geometry and/or assuming a single longitudinal flow direction between the carotid and the femoral arteries, leading to underestimation or overestimation of the true traveled distance.4,11 Moreover, wall stiffness – and thus PWV – have been shown to vary regionally along the vascular branch,12 and therefore assuming an average PWV for the entire carotid-femoral segment might not represent meaningful assessments; particularly given that onset and progress of variety of CVDs have been shown to entail focal wall degradations.3,13,14 A detailed discussion of the limitations of global PWV methods are provided elsewhere.11 To overcome these problems and provide a regional estimate of PWV, the ultrasound-based method of Pulse Wave Imaging (PWI) has recently been developed by our group. The PWI feasibility studies have been shown in human aortas in vivo,15–17 human carotids in vivo,18 aneurysmal and hypertensive patients,19,20 normal and aneurysmal murine aortas,21,22 canine aorta ex vivo,23 experimental phantoms,24,25 in fully-coupled fluid-structure interaction (FSI) aortic simulations,25–29 and in comparison against applanation tonometry.30 However, the effective application of the PWI has been found more challenging in applications involving sites of high focal variations in wall composition, such as calcifications and aneurysms, where clear, homogeneous wave propagation would be replaced by highly disruptive, complex patterns of reflective waves.15,20 Obtaining precisely-controlled calcified samples in vivo may prove impossible, and therefore, simulation studies could be deemed as an efficient surrogate to gain further insights on the effects of wall inhomogeneities on the pulse wave propagation and velocity. Traditionally, Finite Element Method (FEM) simulations of vascular biomechanics have relied mostly on Solid-State (SS) modeling of blood vessels experiencing static or pulsatile internal pressure replicating the hemodynamic effects31; and were not suitable for studying the Fluid-Structure Interaction (FSI) effects in the aortic walls during the diseased conditions with altered hemodynamics such as vortex formation. Largely owing to the emergence of supercomputers over the past few decades, FSI simulations overcome this limitation by modeling both the fluid and solid domains and their interactions. Fully-coupled FSI simulations using patient-specific geometries and anisotropic finite strain constitutive relations have been carried out for healthy and diseased arteries,32,33 aiming at computing biomechanical properties such as fluid velocity and pressure, and wall displacement and stress.34–36 Previous studies on using Coupled Eulerian–Lagrangian (CEL) FSI simulations of aortic pulse wave propagation have been reported by our group and been validated against phantom and in vitro canine studies.23,25–28 In particular, the CEL simulations have been recently shown to reliably detect the existence of focal stiffening and softening of the aortic walls.26,37 In this study, the findings are extended to further examine the effects of wall focal stiffening in terms of the number, size and modulus of the hard inclusions, aiming to identify the markers on the wall displacement spatio-temporal maps that can potentially be used for diagnosis purposes on PWI in vivo.
Methods
An Intel® Xeon® with CPU @2.33 GHz and 32 GB RAM was used to perform 3D dynamic FSI simulations of pulse wave propagation along the aortic walls. The Coupled Eulerian–Lagrangian (CEL) explicit solver of Abaqus 6.10-1 (Simulia, RI, USA) was used to describe the fluid-structure interactions. Further details of the modeling parameters and assumptions are provided in the Supplement (also see previous works of the authors26).42–45
The first simulation was performed on a homogeneous aortic model with entire walls of modulus Ew as the reference (i.e. no inclusion model). To examine the effects of wall inhomogeneities, additional nine simulations were performed on walls of modulus Ew containing hard inclusions varying in number, size or modulus (Fig. 1). The number of inclusions was denoted by N and tested within the range of N = 1, 2, 3 and 4; each 10 mm apart. The size of the inclusion(s) was shown as S and tested in a range of S = 2, 5, 10 mm. The modulus of the inclusion(s), Ei, was characterized by the inclusion-to-wall modulus contrast MC = Ei/Ew and tested in a range of MC = 1.25, 1.5, 1.75 and 2. The inclusions were defined at a distance of 90 mm from the flow inlet, allowing for the full development of the forward wave. See Supplement for details of the PWV calculations.
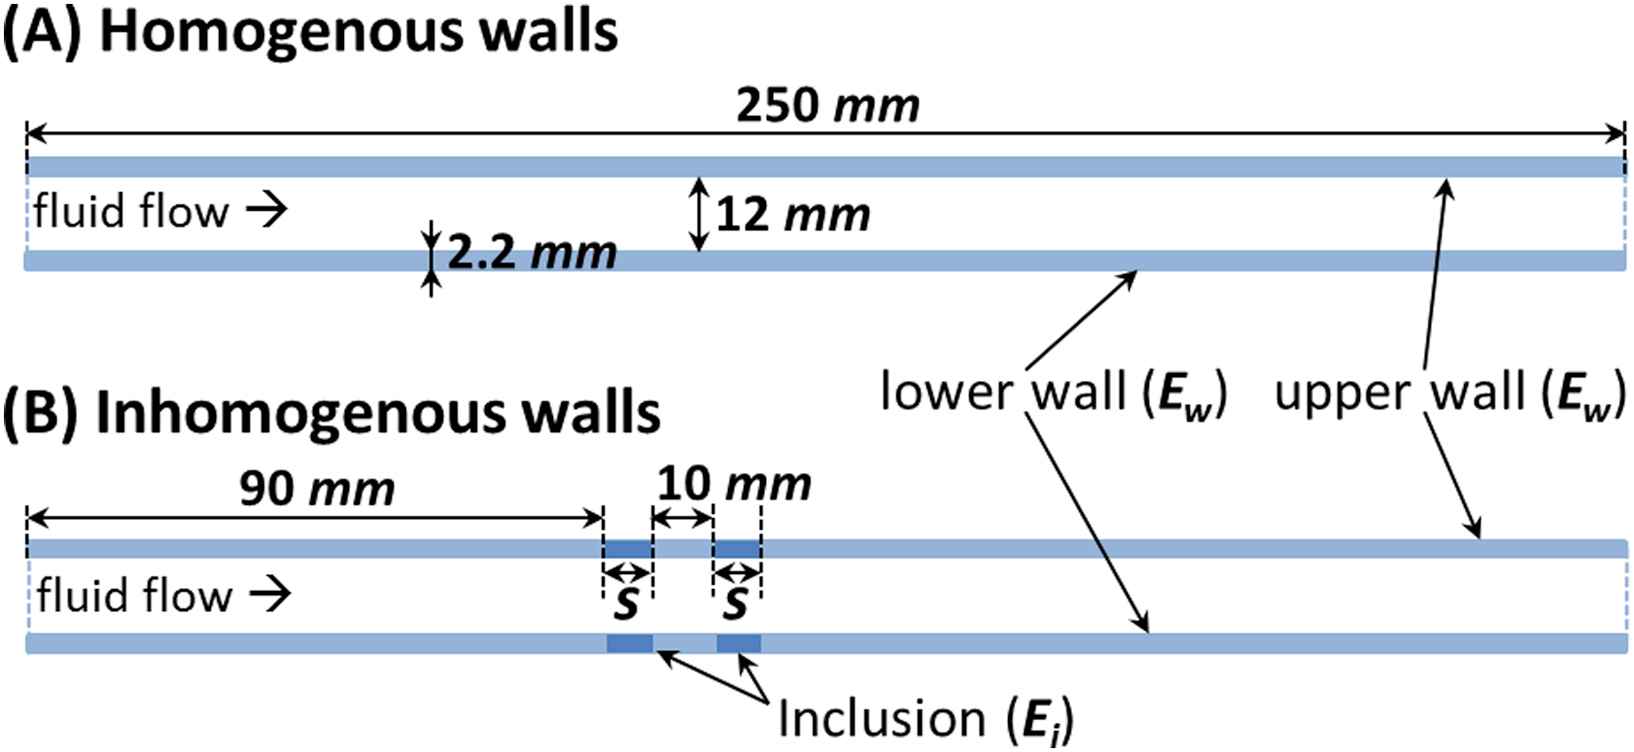
2D schematic of aortic models with (A) homogeneous and (B) inhomogeneous walls (S indicates the inclusion size).
Results
Homogeneous and inhomogeneous pulse wave propagations
Figure 2 illustrates the 3D waterfall plots of the upper wall motion obtained on homogeneous walls (Fig. 2(A)) as well as on three inhomogeneous walls with representative sets of inclusions number, size, and modulus contrast (Fig. 2(B)–(D), respectively). The wave propagations show the existence of forward waves that split into a portion that continues to travel forward and a portion that gets reflected at the site(s) of the inclusion(s) and travels in the reverse direction. Also, the low displacements of the wall at the site(s) of the hard inclusion(s) resulted in standing waves. More importantly, it was found that the patterns of the reflection and standing waves are different depending on the inclusion numbers, size and modulus. Further quantification of the wave propagation patterns is being performed on the 2D projections of the wall displacement maps as shown below.
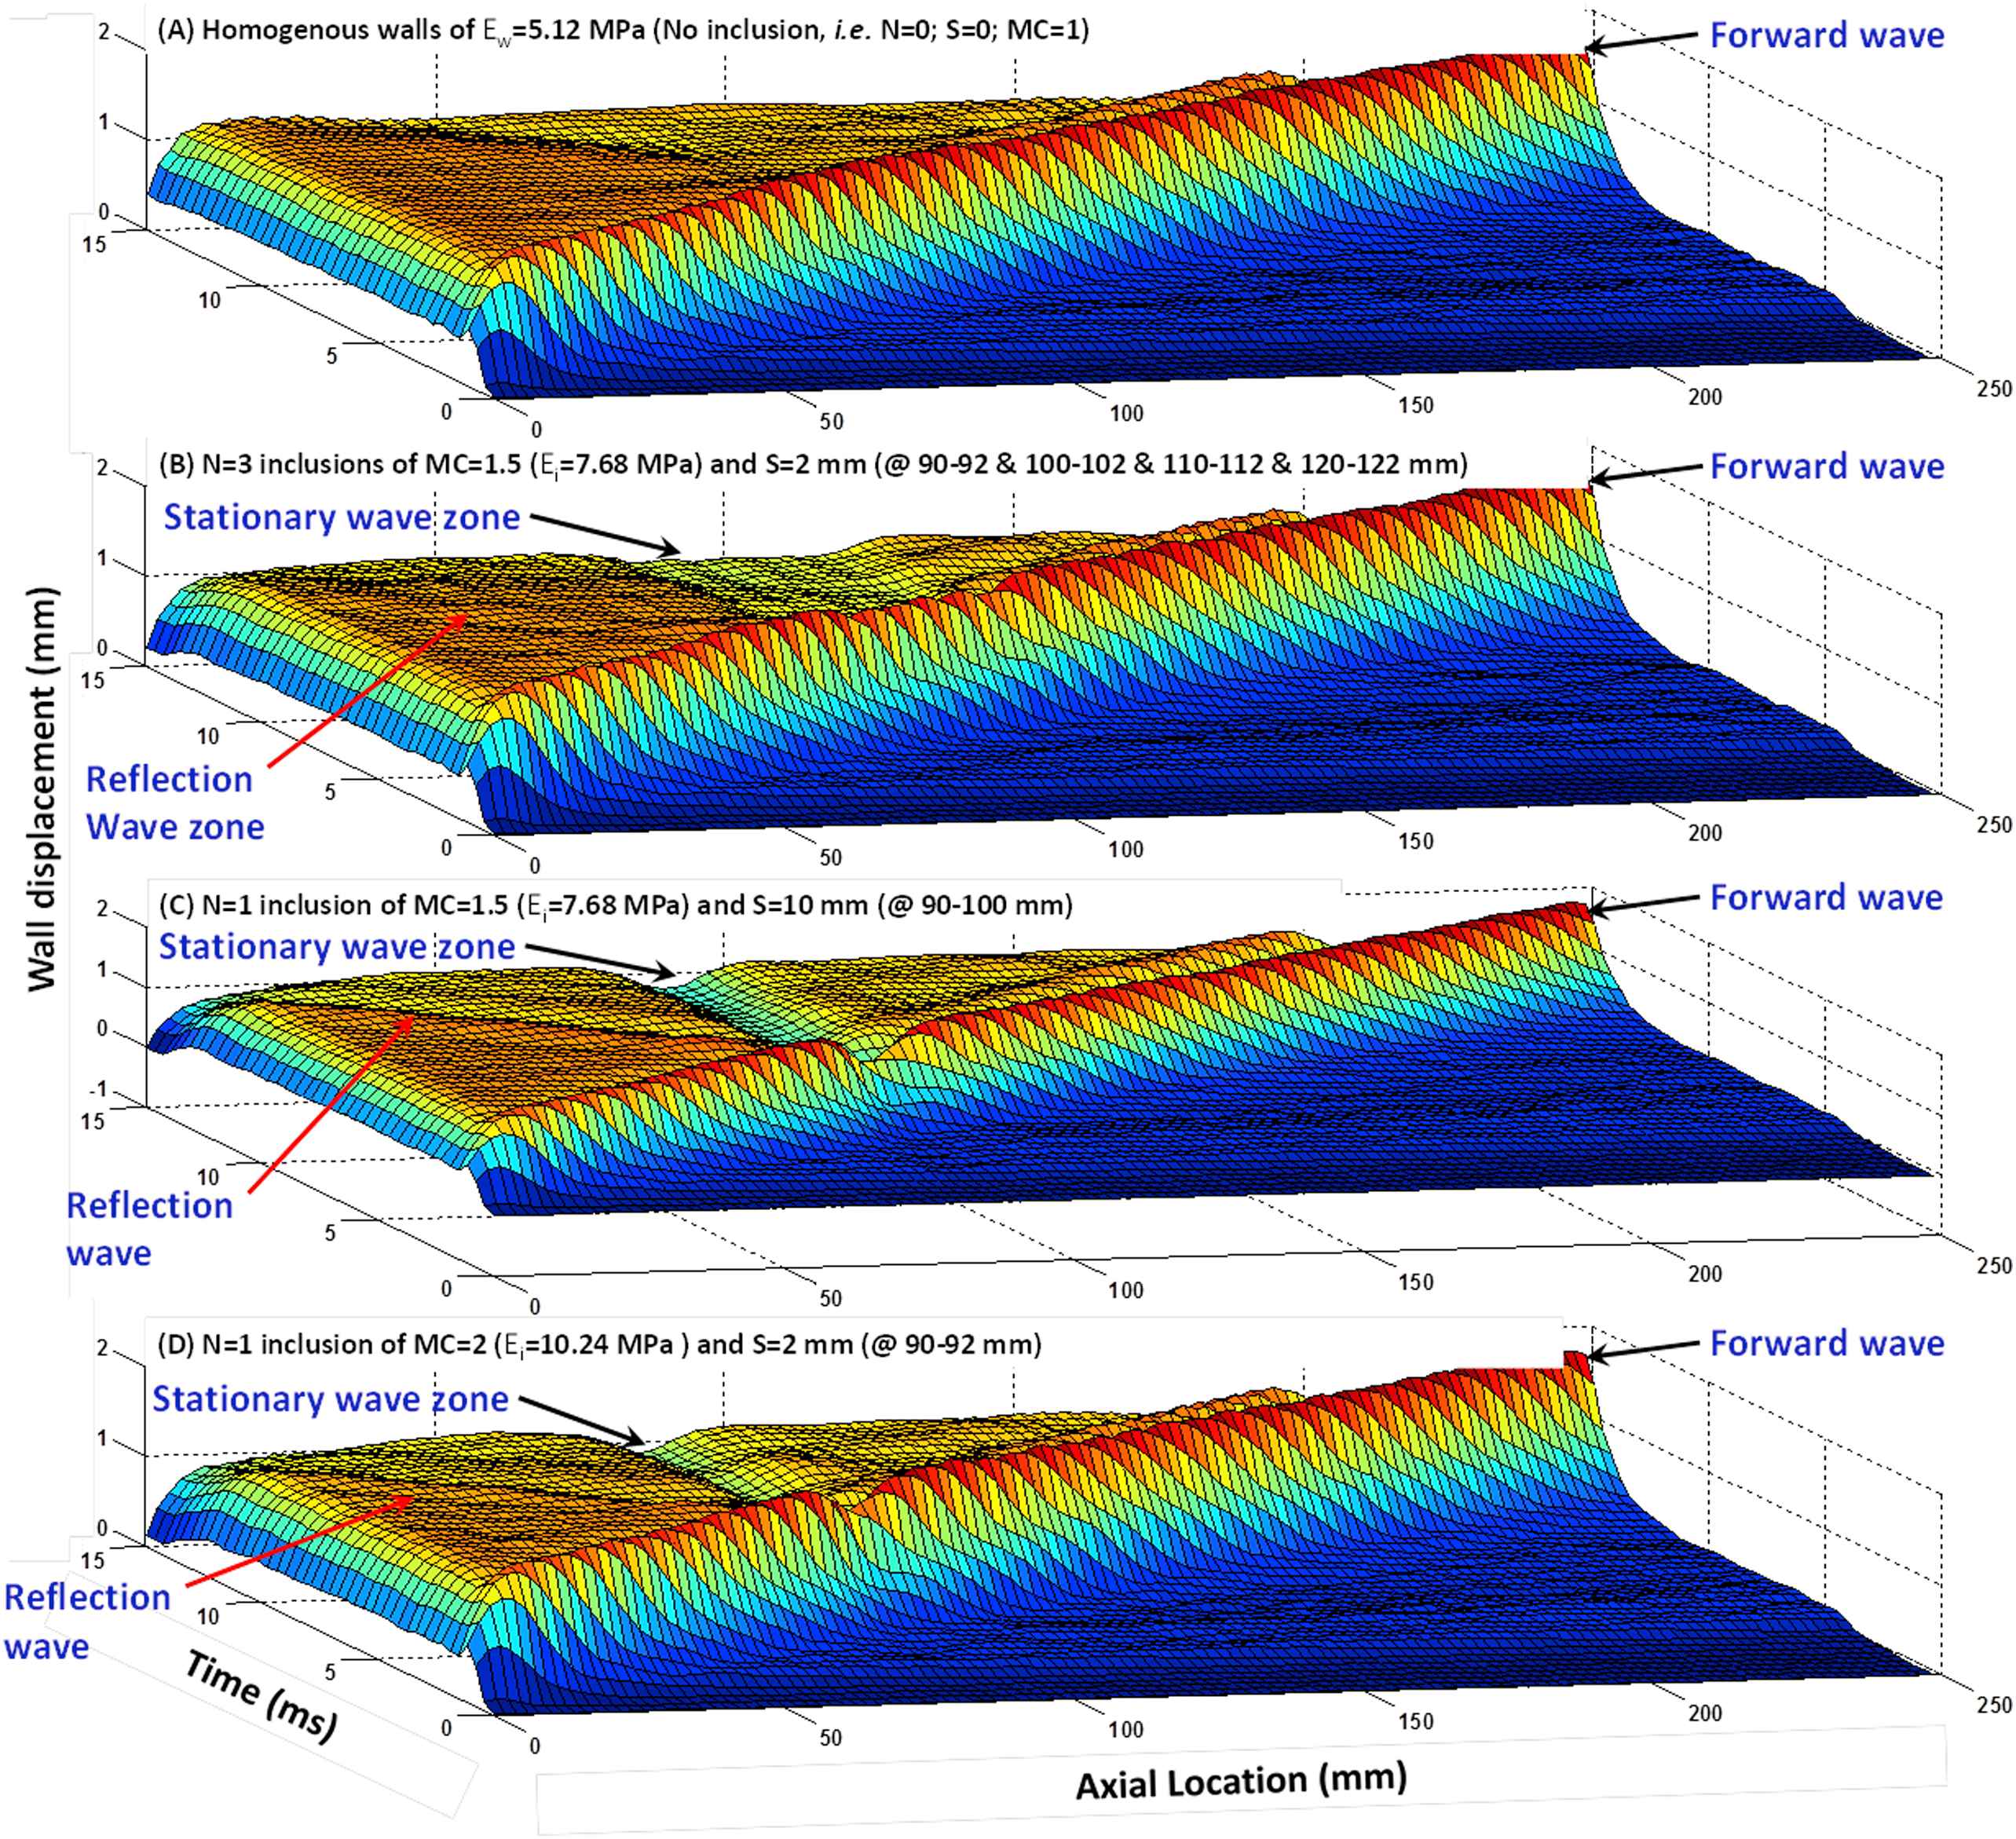
Surface map of the wall displacement showing the pulse wave propagation in (A) homogeneous wall (Ew = 5.12 MPa) with no inclusion, (B) wall with three inclusions of MC = 1.5 (Ei = 7.68 MPa) of size S = 2 mm, 10 mm apart, (C) wall with one inclusion (Ei = 7.68 MPa) of size S = 10 mm, and (D) wall with one S = 2 mm inclusion of MC = 2 (Ei = 10.24 MPa).
Effect of the number of inclusions
Figure 3(A)–(E) illustrate the wall displacement 2D spatio-temporal maps for walls (Ew = 5.12 MPa) containing N = 0 (homogeneous), 1, 2, 3 and 4 inclusions, respectively, of size S = 2 mm (10 mm apart) with MC = 1.5 (Ei = 7.68 MPa). The results showed that increasing the number of inclusions makes the reflection pattern changing from a clear single reflection wave for one inclusion to a disordered reflection zone for multiple inclusions. Additionally, the standing wave grows by increasing the number of inclusions. The effects of numbers of inclusion were quantified in terms of the width of the standing wave, the PWVs of the forward and reflected waves, and the linear correlation coefficients (r2s), Fig. 6(A), (D) and (G), respectively.
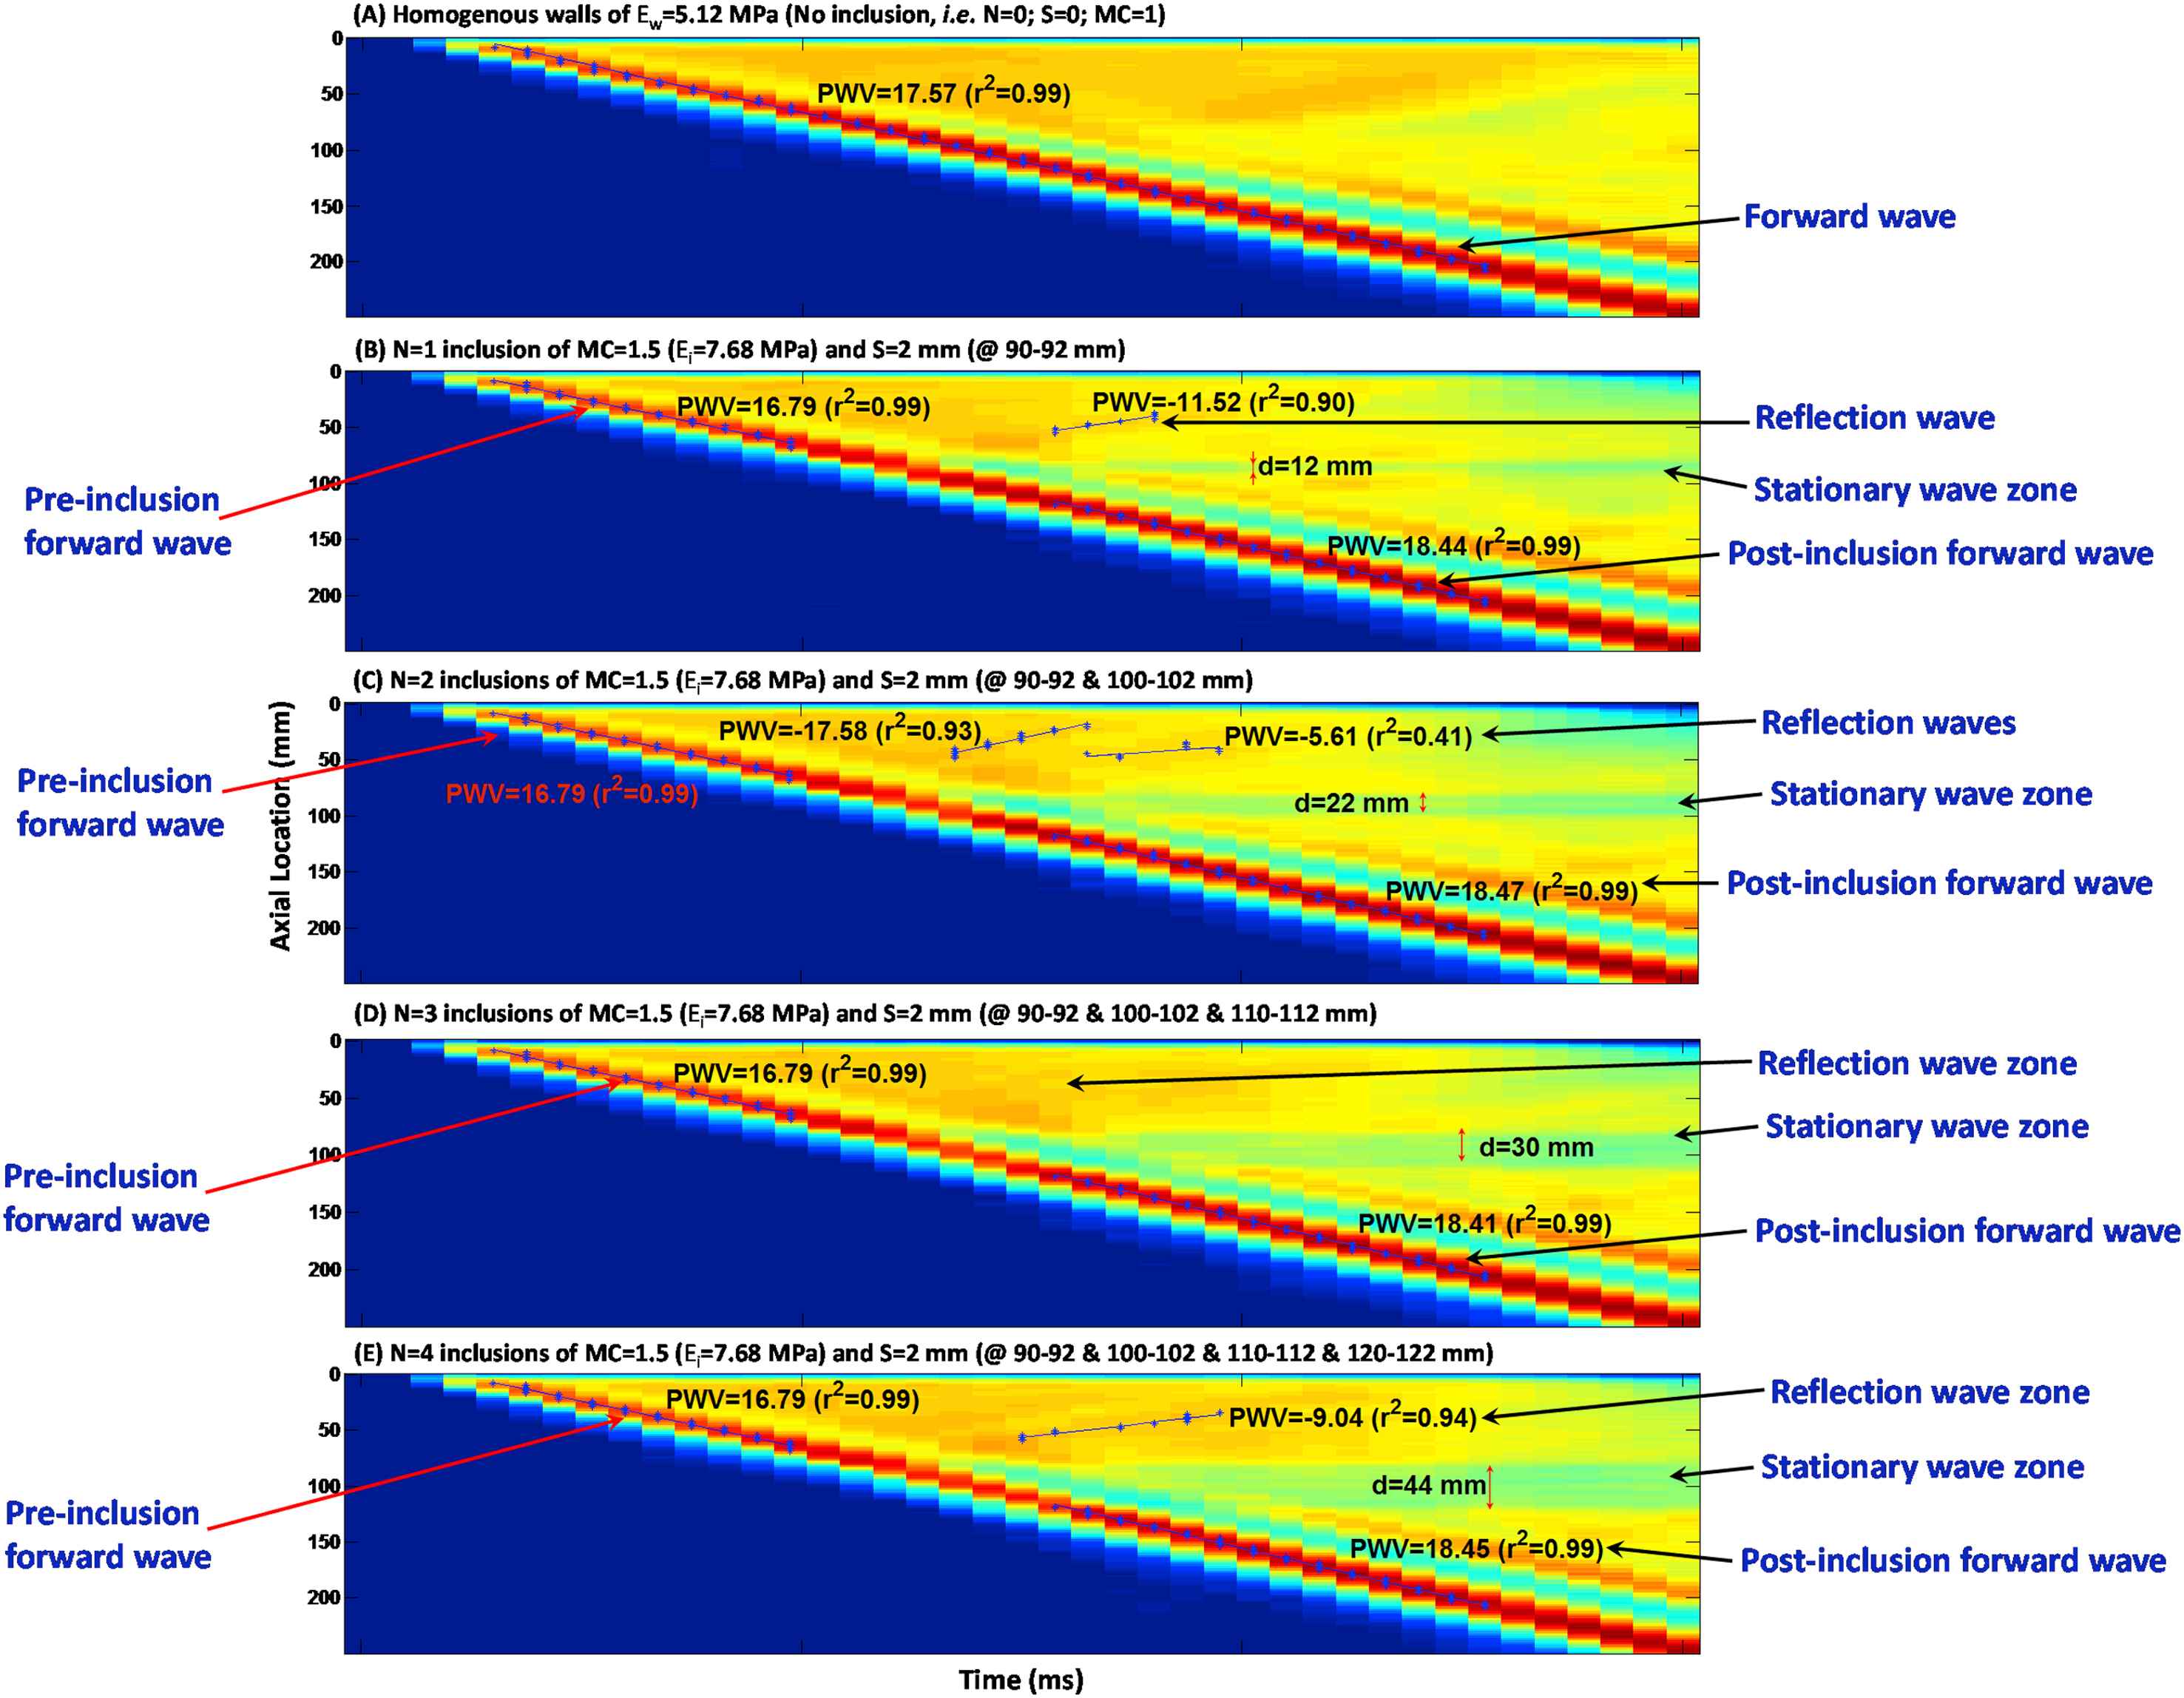
Effects of the number of inclusions: Spatio-temporal maps of the wall displacement of (A) homogeneous wall (Ew = 5.12 MPa) with no inclusions; and walls with N = (B) 1, (C) 2, (D) 3 and (E) 4 inclusions of MC = 1.5 (Ei = 7.68 MPa) and size S = 2 mm; 10 mm apart.
Effect of the inclusion size
Figure 4(A)–(D) illustrate the wall displacement spatio-temporal maps for walls (Ew = 5.12 MPa) containing no inclusion, as well as N = 1 inclusion of size S = 2, 5 and 10 mm, respectively, with MC = 1.5 (Ei = 7.68 MPa), in order to examine the effect of the inclusion size on the wave propagation. There is only one clear main reflection wave for all inclusion sizes, with a magnitude increasing with the increase of the inclusion size. The standing wave was also found to grow with the inclusion size. The effects of inclusion size were quantified in terms of the width of the standing wave, the PWVs of the forward and reflected waves, and the linear correlation coefficients (r2s), Fig. 6(B), (E) and (H), respectively.
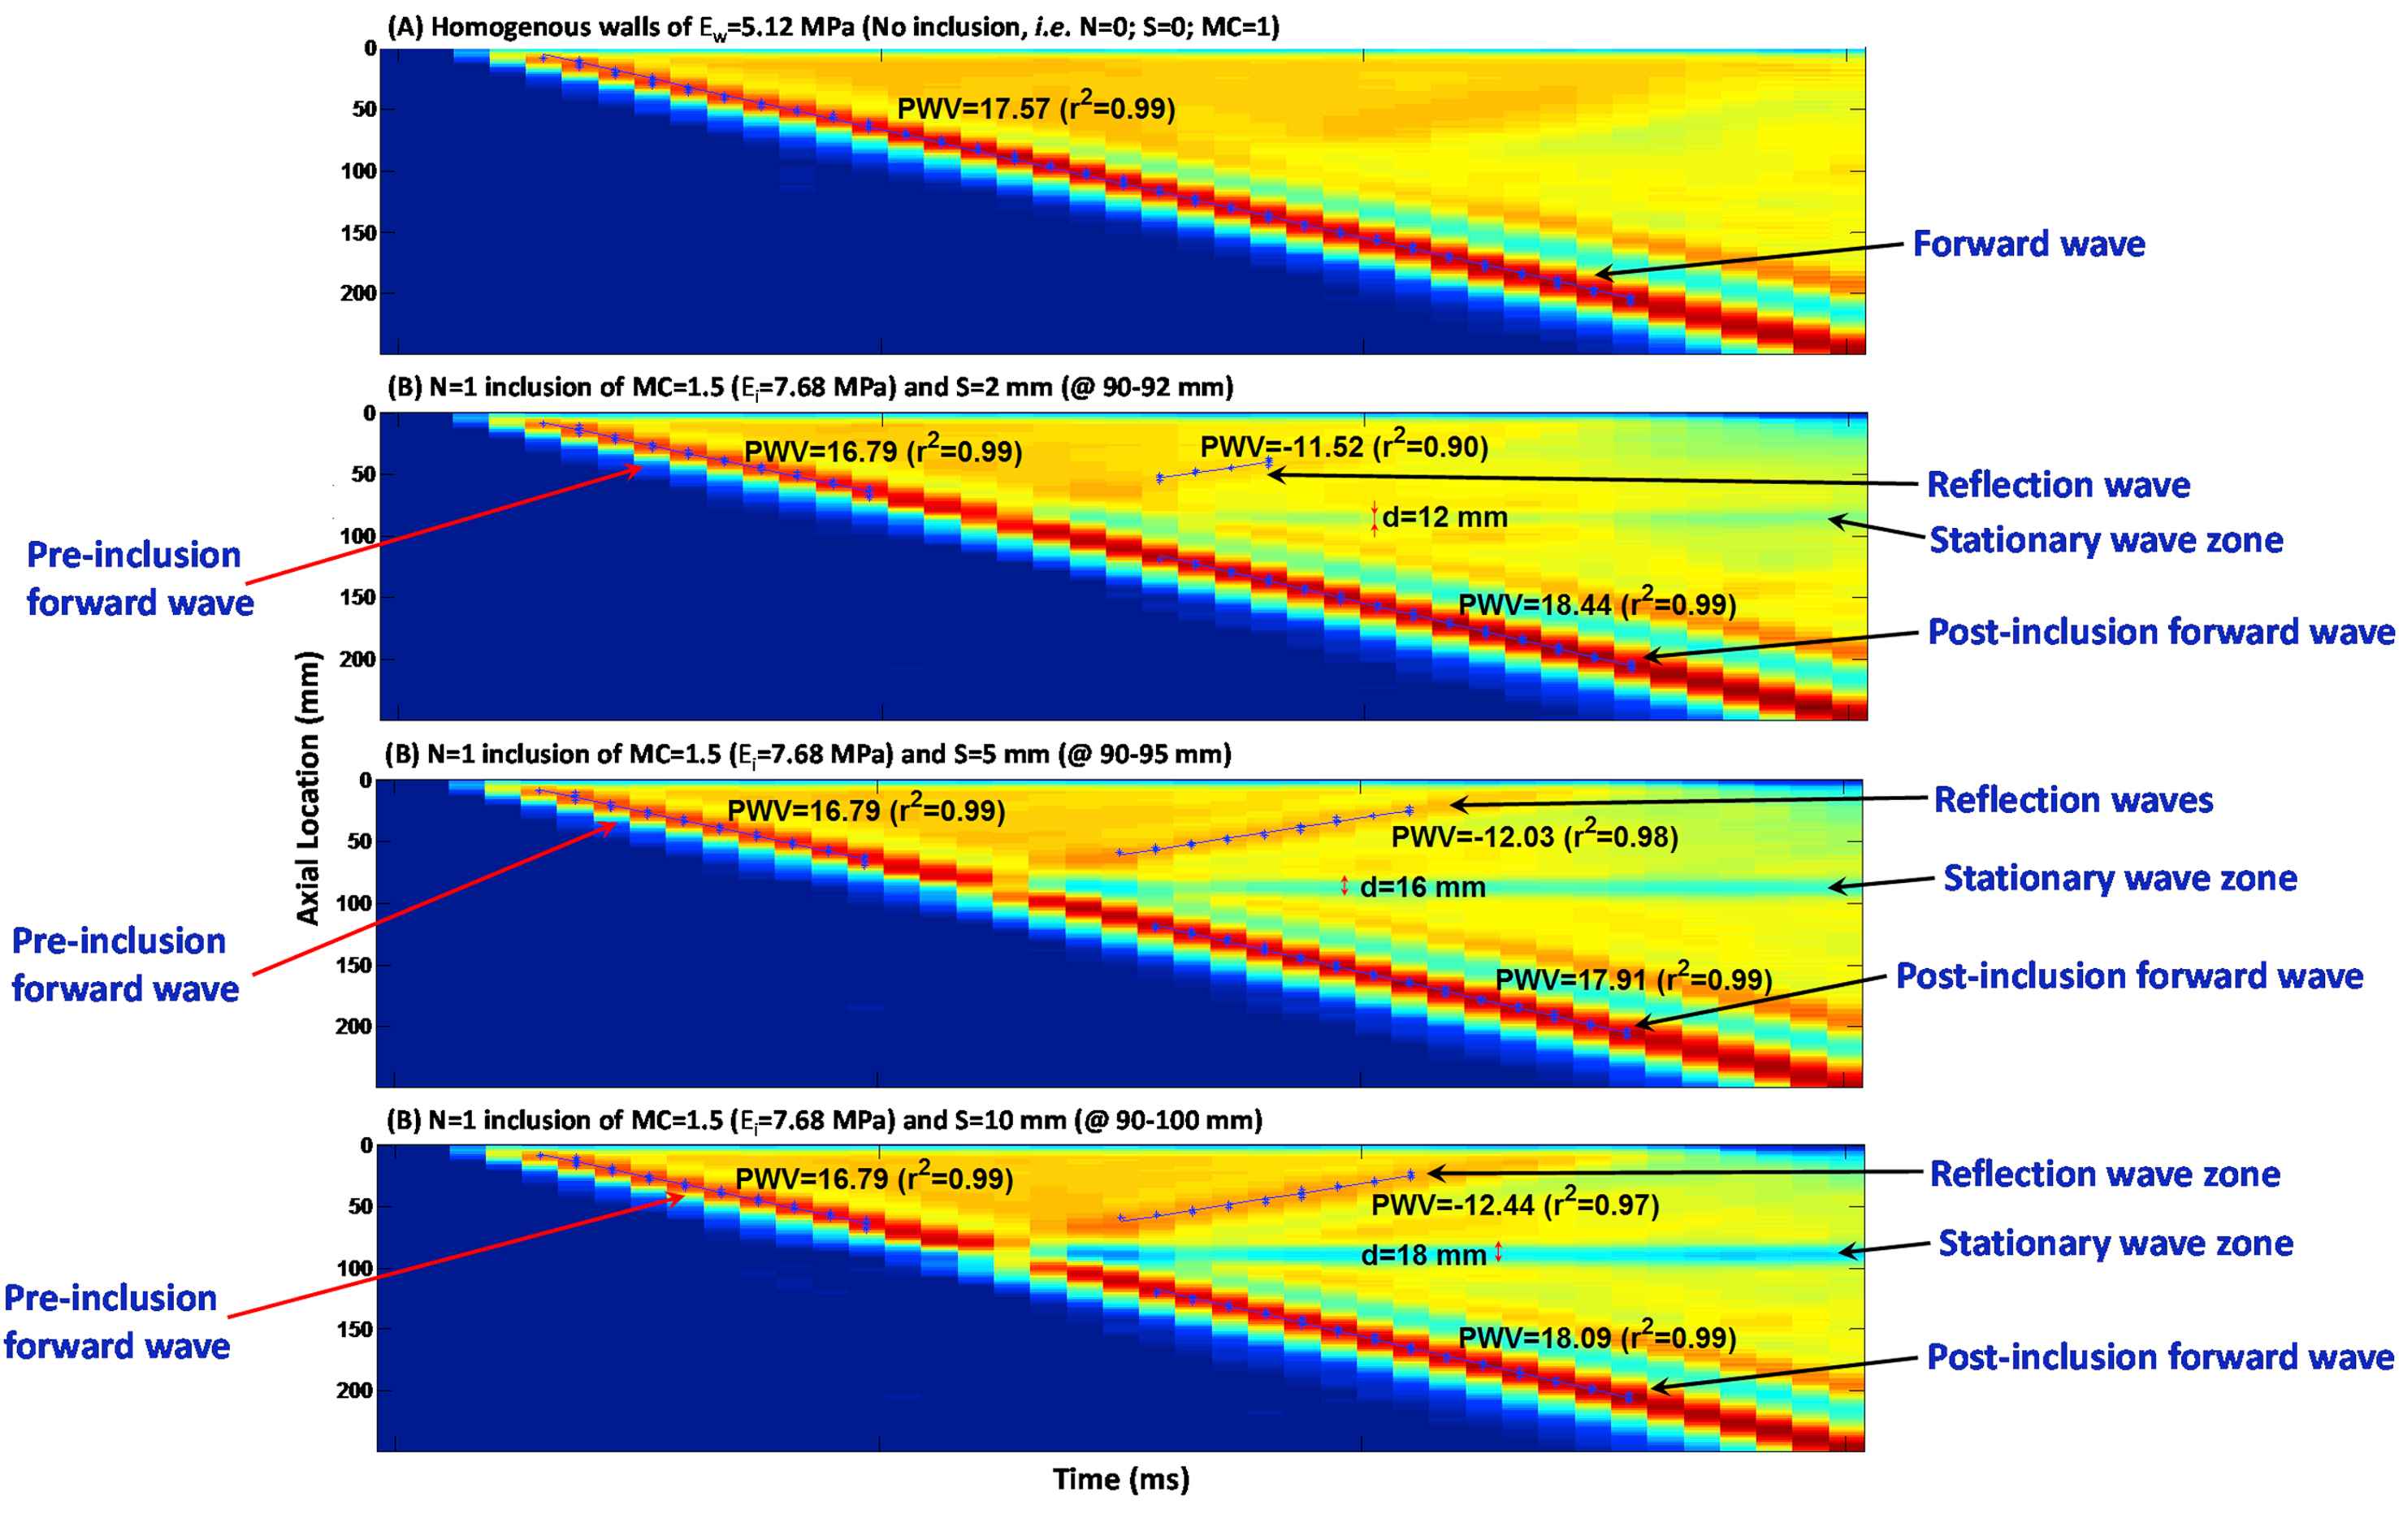
Effect of the inclusion size: Spatio-temporal maps of the wall displacement of (A) homogeneous wall (Ew = 5.12 MPa) with no inclusions; and walls with N = 1 inclusion with MC = 1.5 (Ei = 7.68 MPa) and size S of (B) 2, (C) 5, and (D) 10 mm.
Effects of inclusion modulus contrast
Figure 5(A)–(E) illustrate the wall displacement spatio-temporal maps for walls (Ew = 5.12 MPa) containing no inclusion, as well as N = 1 inclusion of S = 2 mm, with modulus contrast of MC = 1.25 (Ei = 6.4 MPa), 1.5 (Ei = 7.68 MPa), 1.75 (Ei = 8.96 MPa), and 2 (Ei = 10.24 MPa), respectively. There is only one clear main reflection wave observed for all inclusion sizes, with a magnitude increasing with the increase of the inclusion modulus.
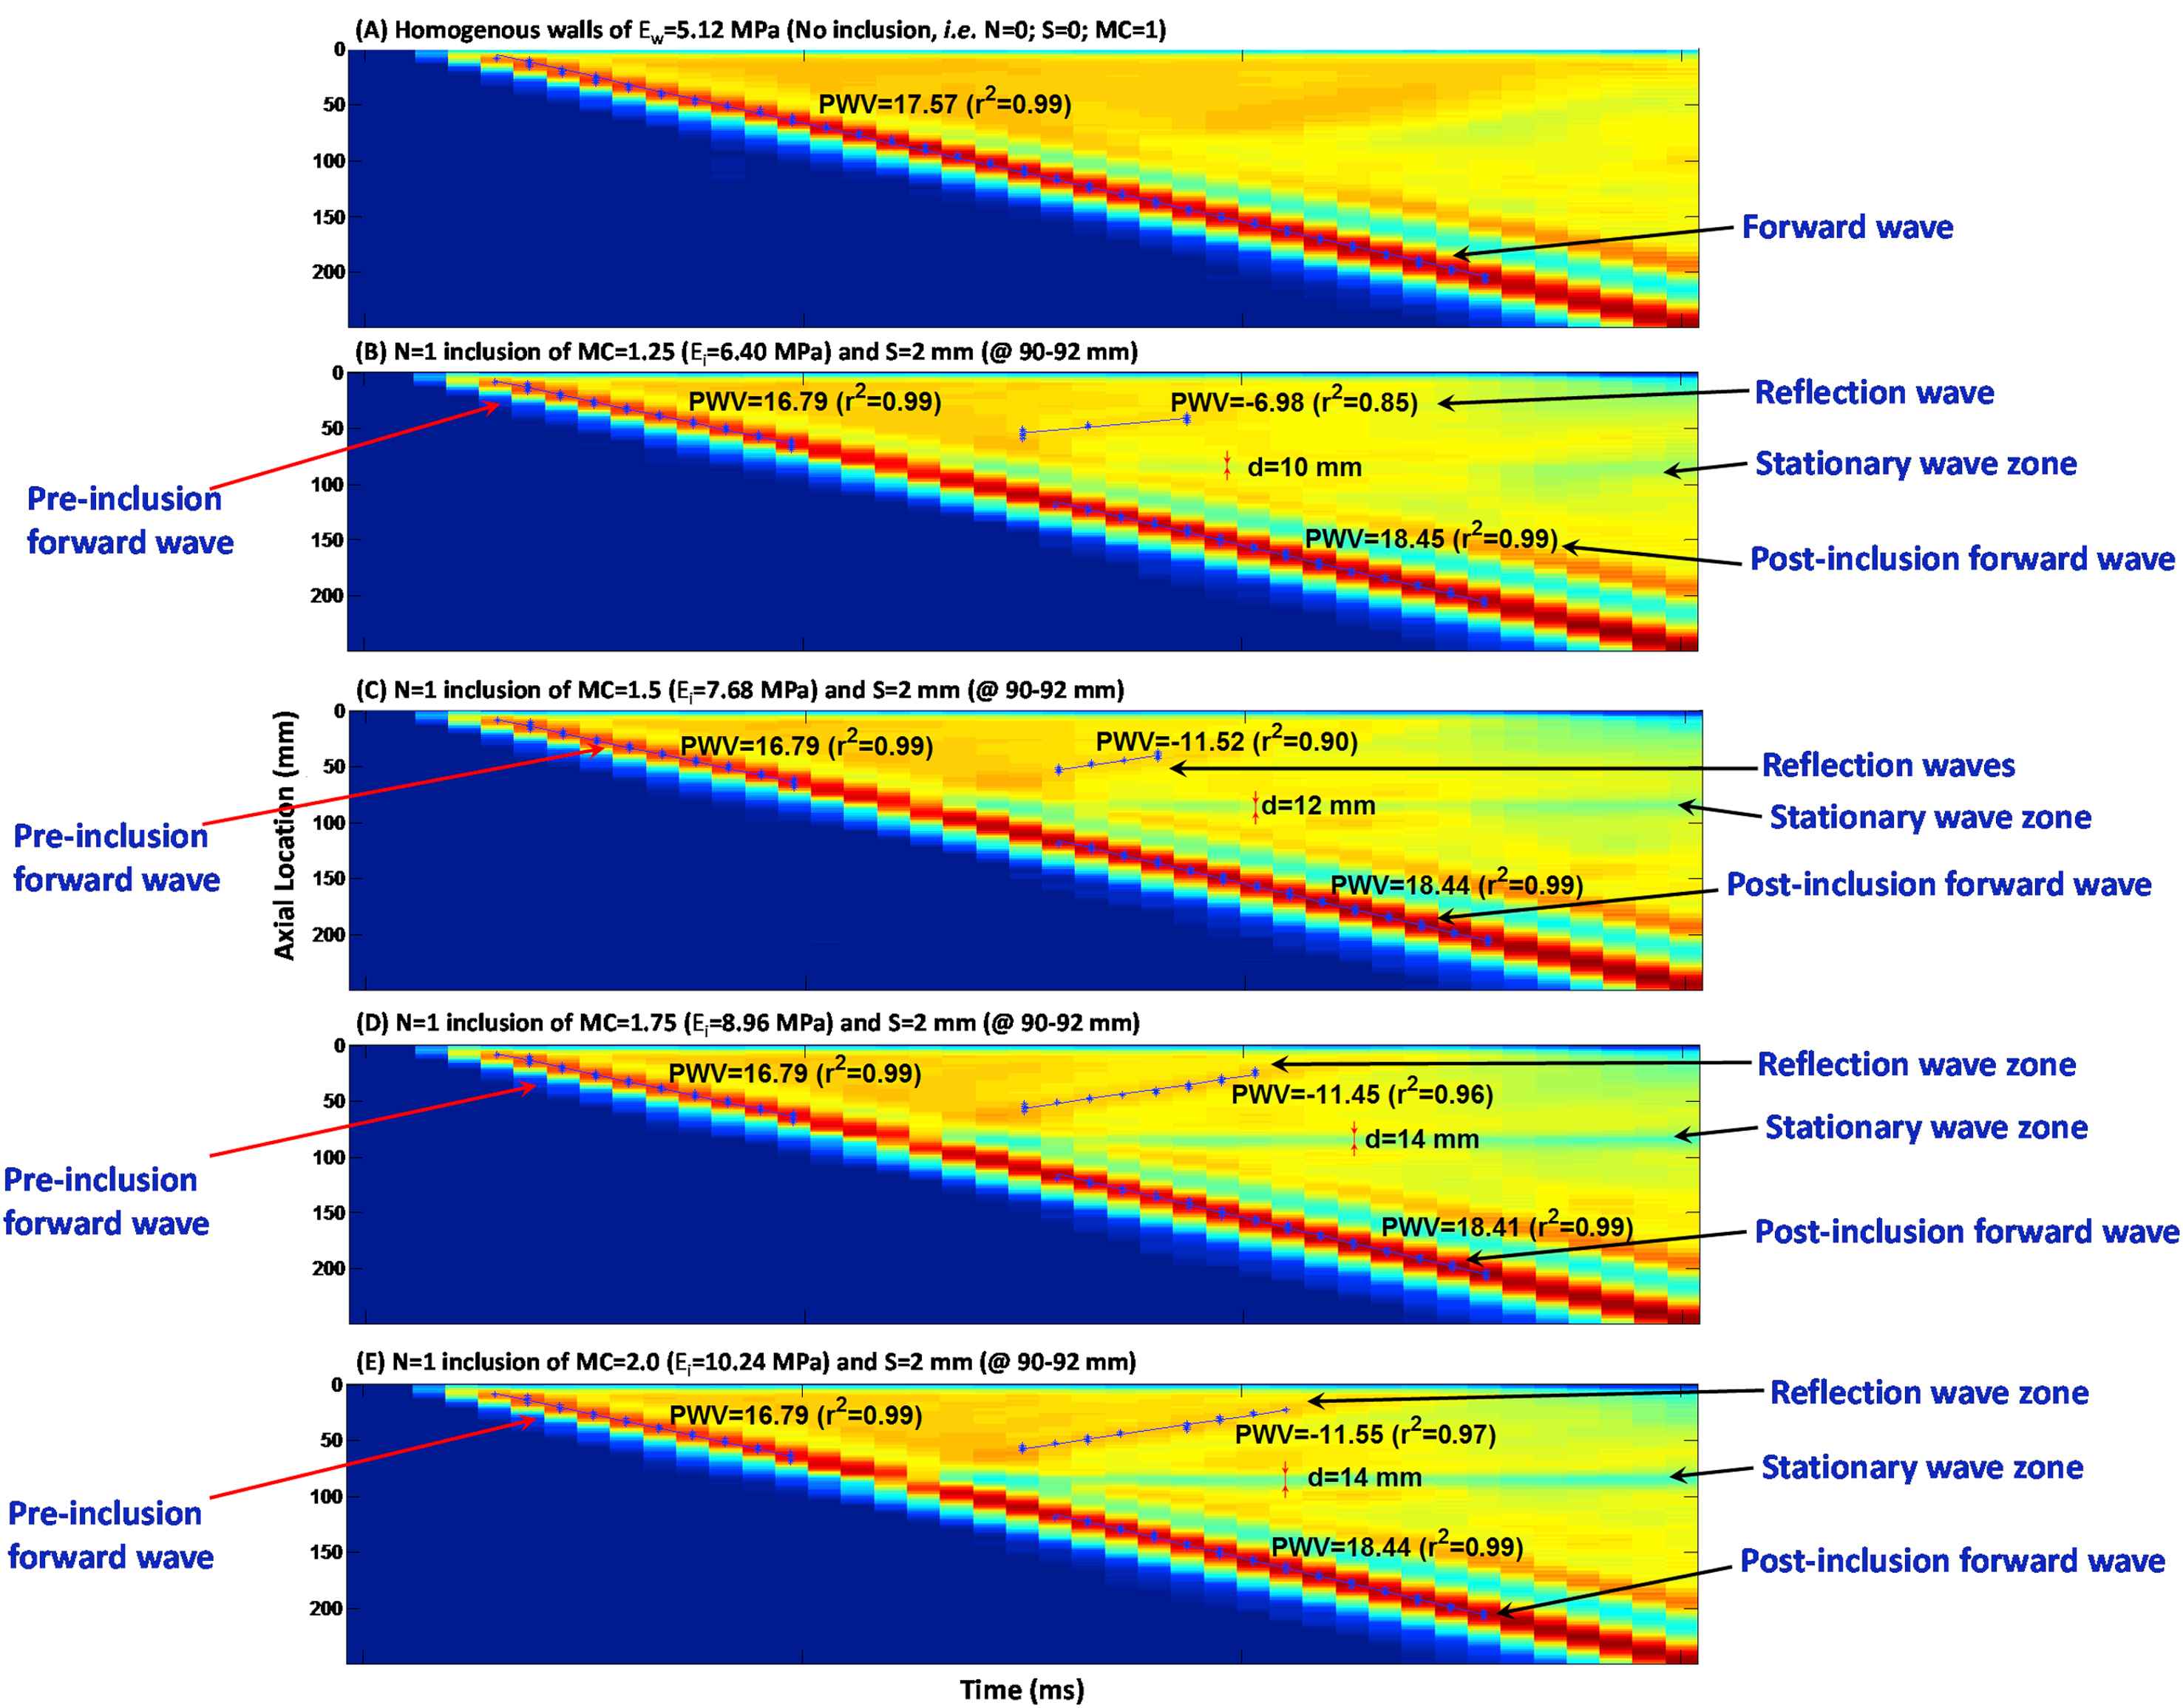
Effects of the inclusion modulus contrast: Spatio-temporal maps of the wall displacement of (A) homogeneous wall with no inclusions, i.e. MC = 1 (Ew = 5.12 MPa); and walls with one inclusion of S = 2 mm and MC of (B) 1.25 (Ei = 6.40 MPa), (C) 1.5 (Ei = 7.68 MPa), (D) 1.75 (Ei = 8.96), and (E) 2 (Ei = 10.24 MPa).
However, the width of the standing wave was not found significantly growing with the inclusion modulus. The effects of inclusion modulus were quantified in terms of the width of the standing wave, the PWVs of the forward and reflected waves, and the linear correlation coefficients (r2s), Fig. 6(C), (F) and (I), respectively.
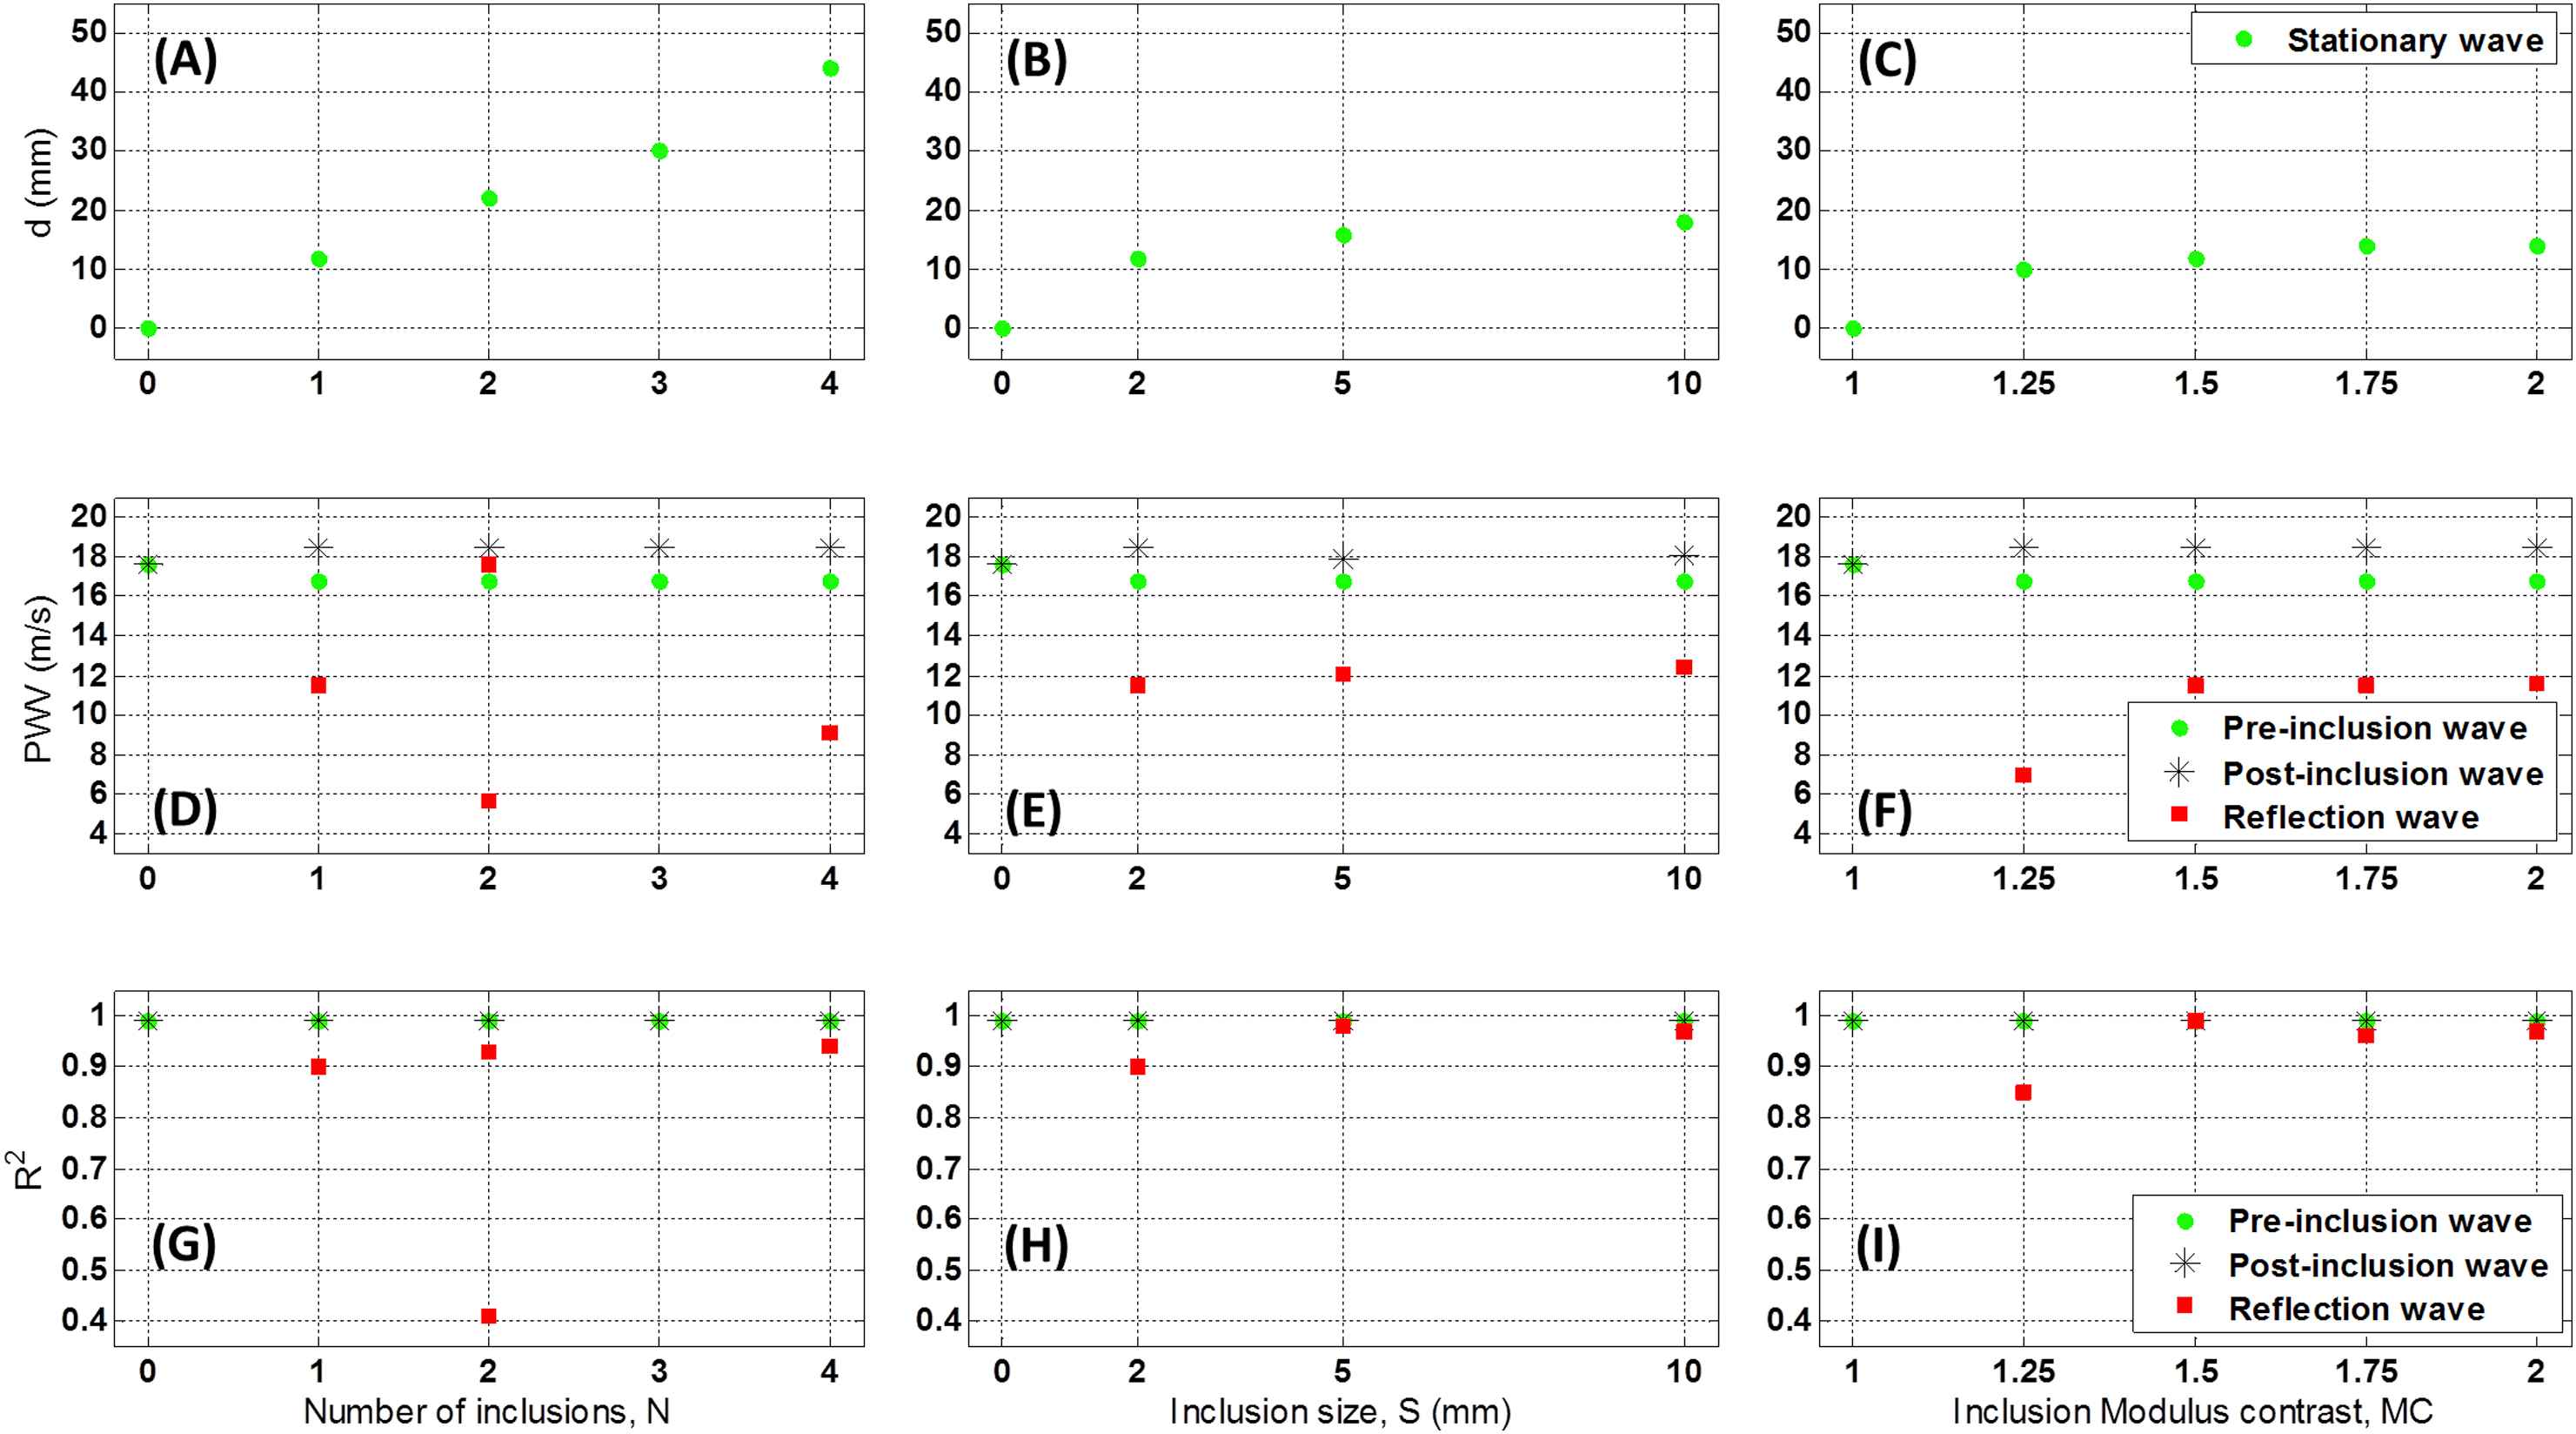
Effects of the number of inclusions (N), inclusion size (S), and inclusion modulus contrast (MC) on the width of the standing wave (d), (A)–(C), respectively; on the PWVs, (D)–(F), respectively; and on r2s, (G)–(I), respectively.
Quantified parameters
Figure 6 shows the quantified effects of number of inclusions (N), inclusion size (S), and inclusion modulus contrast (MC) on the width of the standing wave, PWV and r2. Fig. 6(A)–(C) show that the width of the standing wave correlates proportionally to the number of inclusions, but it changes only slightly as inclusion size or modulus varies.
The PWVs were measured on the pre-inclusion forward, reflection and post-inclusion forward waves (Fig. 6(D)–(F)). The results show that regardless of the inclusion numbers, size and modulus, the pre-inclusion PWVs decrease slightly on the inhomogeneous walls – compared to that of the forward wave on the homogeneous walls. Similarly, change in post-inclusion PWVs with for different inclusion parameters is found insignificant. Increasing the number of inclusions makes the reflection pattern changing from a clear single reflection wave for one inclusion to a diffracted reflection zone for multiple inclusions. Additionally, the standing wave grows by increasing the number of inclusions. On the effects of the change in inclusion size, only one clear main reflection wave is generated in all inclusion size cases, with a magnitude increasing with the increase of the inclusion size. The standing wave also grows by increasing the inclusion size. As far as the effects of change in inclusion modulus are concerned, only one clear main reflection wave is seen for all inclusion sizes, with a magnitude increasing with the increase of the inclusion modulus. However, the standing wave does not grow significantly by increasing the inclusion modulus. Furthermore, the pre-inclusion PWVs decrease slightly on the inhomogeneous walls, compared to that of the forward wave on the homogeneous walls; however, they do not change significantly as a function of inclusion numbers, size and modulus. Similarly, post-inclusion PWVs are also largely unaffected by changes in inclusion parameters. Finally, the number of inclusions changes the reflection patterns, where both increase and decrease in PWVs are seen on multiple, short, reflected waves. The reflection PWVs are found to increase – rather exponentially – with both inclusion size and modulus, while the r2s of the PWV fit remain extremely high (i.e. nearly 0.99) for all pre- and post-inclusion forward waves, indicating uniform propagations of the forward waves at the homogeneous regions of the wall outside the inclusion zone. However, the r2s on the reflected PWVs fit are found to decrease by decreases in the inclusion size and modulus, and to vary largely on multiple inclusions cases, dropping to as low as 0.40.
Discussion
The PWV estimation method currently used in clinical practice is based on obtaining an average velocity measured globally between two remote locations, typically the carotid and femoral arteries.4,8 Such average methods are prone to large inaccuracies caused by the lack of knowledge of the exact arterial geometry and the assumption of a single longitudinal flow direction. Yet, the most important drawback of such global methods is the lack of information on the regional PWVs along the vascular branch. Variety of cardiovascular diseases have been shown to entail focal wall degradations,3,13,14 and therefore the ability to detect regional PWVs has been shown essential for early diagnosis of such diseases.26
The ultrasound-based, noninvasive method of Pulse Wave Imaging (PWI) has been shown capable of providing regional PWVs and estimating focal changes in arterial wall modulus in various applications.16–18,20–23,25,26,29,30 The present study reports the use of finite element FSI dynamic simulations to obtain fluid-induced wall pulsatile motion and its propagation along homogeneous and inhomogeneous aortic walls, in order to shed more light on pulse wave propagation and velocity findings, and potentially serve as a guide for PWI in vivo. The FSI framework has previously been shown reliable in describing the pulse wave propagation on homogeneous walls of different modulus, yielding a PWV2-E linear correlation coefficient of 0.99 as hinted by the Moens–Korteweg relationship.26 The same study also showed that having soft and hard inclusions in the wall makes remarkable changes in the propagation of the forward and reflected waves, leading to evident markers in the spatio-temporal maps. Most importantly, it was concluded that the pre- and post-inclusion PWVs do not differ significantly, emphasizing even more on the necessity of a focal – as compared to global – pulse wave analysis. The aim of this study was to examine the effects of various hard inclusions on the pulse propagation in order to obtain qualitative and quantitative markers that can be used to characterize properties such as number of inclusions, and inclusion size and modulus.
Based on the simulation results, it was found that the quantitative and qualitative markers on the wall displacement spatio-temporal maps can be effectively used to infer on the properties of the wall inclusions and to distinguish between the changes in inclusion numbers, size and modulus. The propagation of the forward wave was not substantially affected by the inclusions as seen by the pre- and post-inclusion PWVs to differ only up to 5%. In the multi-inclusion cases, Fig. 3 shows that the change of a single reflection wave to a diffracted reflection zone, i.e. drop in r2 (Fig. 6(G)), is the most evident marker to detect the increase in the number of inclusions. Furthermore, the width of the standing wave was found to increase linearly with the number of inclusions, Fig. 6(A). Similarly, the width of the standing wave also increased with the increase in the inclusion size, Fig. 6(B). However, in this case the reflection remains as a single wave (Fig. 4) – as opposed to the diffracted zone seen for multiple inclusions, with a PWV that only changes up to 4% (Fig. 6(E)) – as opposed to that for the multiple inclusions with changes in reflected PWV up to 100% (Fig. 6(D)). Finally, the change in inclusion modulus contrast was found to be the least evident to be detected (Fig. 5), as all the qualitative and quantitative markers indicated lowest sensitivities to change in inclusion modulus. Increase in the magnitude of the wall displacements on the reflected wave (Fig. 5) is the primary indicator of the change in the modulus. The width of the standing wave was also found to increase slightly with the increase in the modulus contrast (Fig. 6(C)). Additionally, both the PWV and r2 on the reflected waves indicated remarkable changes, e.g. ∼64 % and 16.50 %, respectively, for the initial change in the modulus contrast from 1.25 to 1.5, but remained largely unchanged for higher changes in the modulus contrast. However, it should be noted that reflection patterns – as part of the whole wave propagation dynamics – are being affected by both the terminal boundaries (inlet and outlet wall constraints) as well as the wall inclusion properties. In addition, the interactions between the waves generated over multiple cycles would also add to the complexity of the reflective waves; to minimize the latter effect, having a relatively short simulation time in this study helped capturing only one wave cycle.
Finite-element, fully-coupled FSI dynamic simulations can be powerful and effective tools to study the fluid-induced pulsatile motions in the aortic walls under health and disease and to serve as a guide for PWI examination in vivo. However, performing fully physiologically-relevant simulations using physiological pressure/velocity waveforms, patient-specific geometries and realistic material properties (inhomogeneous, anisotropic, nonlinear, viscoelastic, etc.), may prove not readily feasible primarily due to the computational cost. Therefore, some level of tradeoff is typically required, such as those on the mesh size here (Fig. 7), in order to minimize the computational cost, while maintaining acceptable accuracy. The more detailed discussions on the limitations of the simulations used in this study are provided in a previous report by our group.26
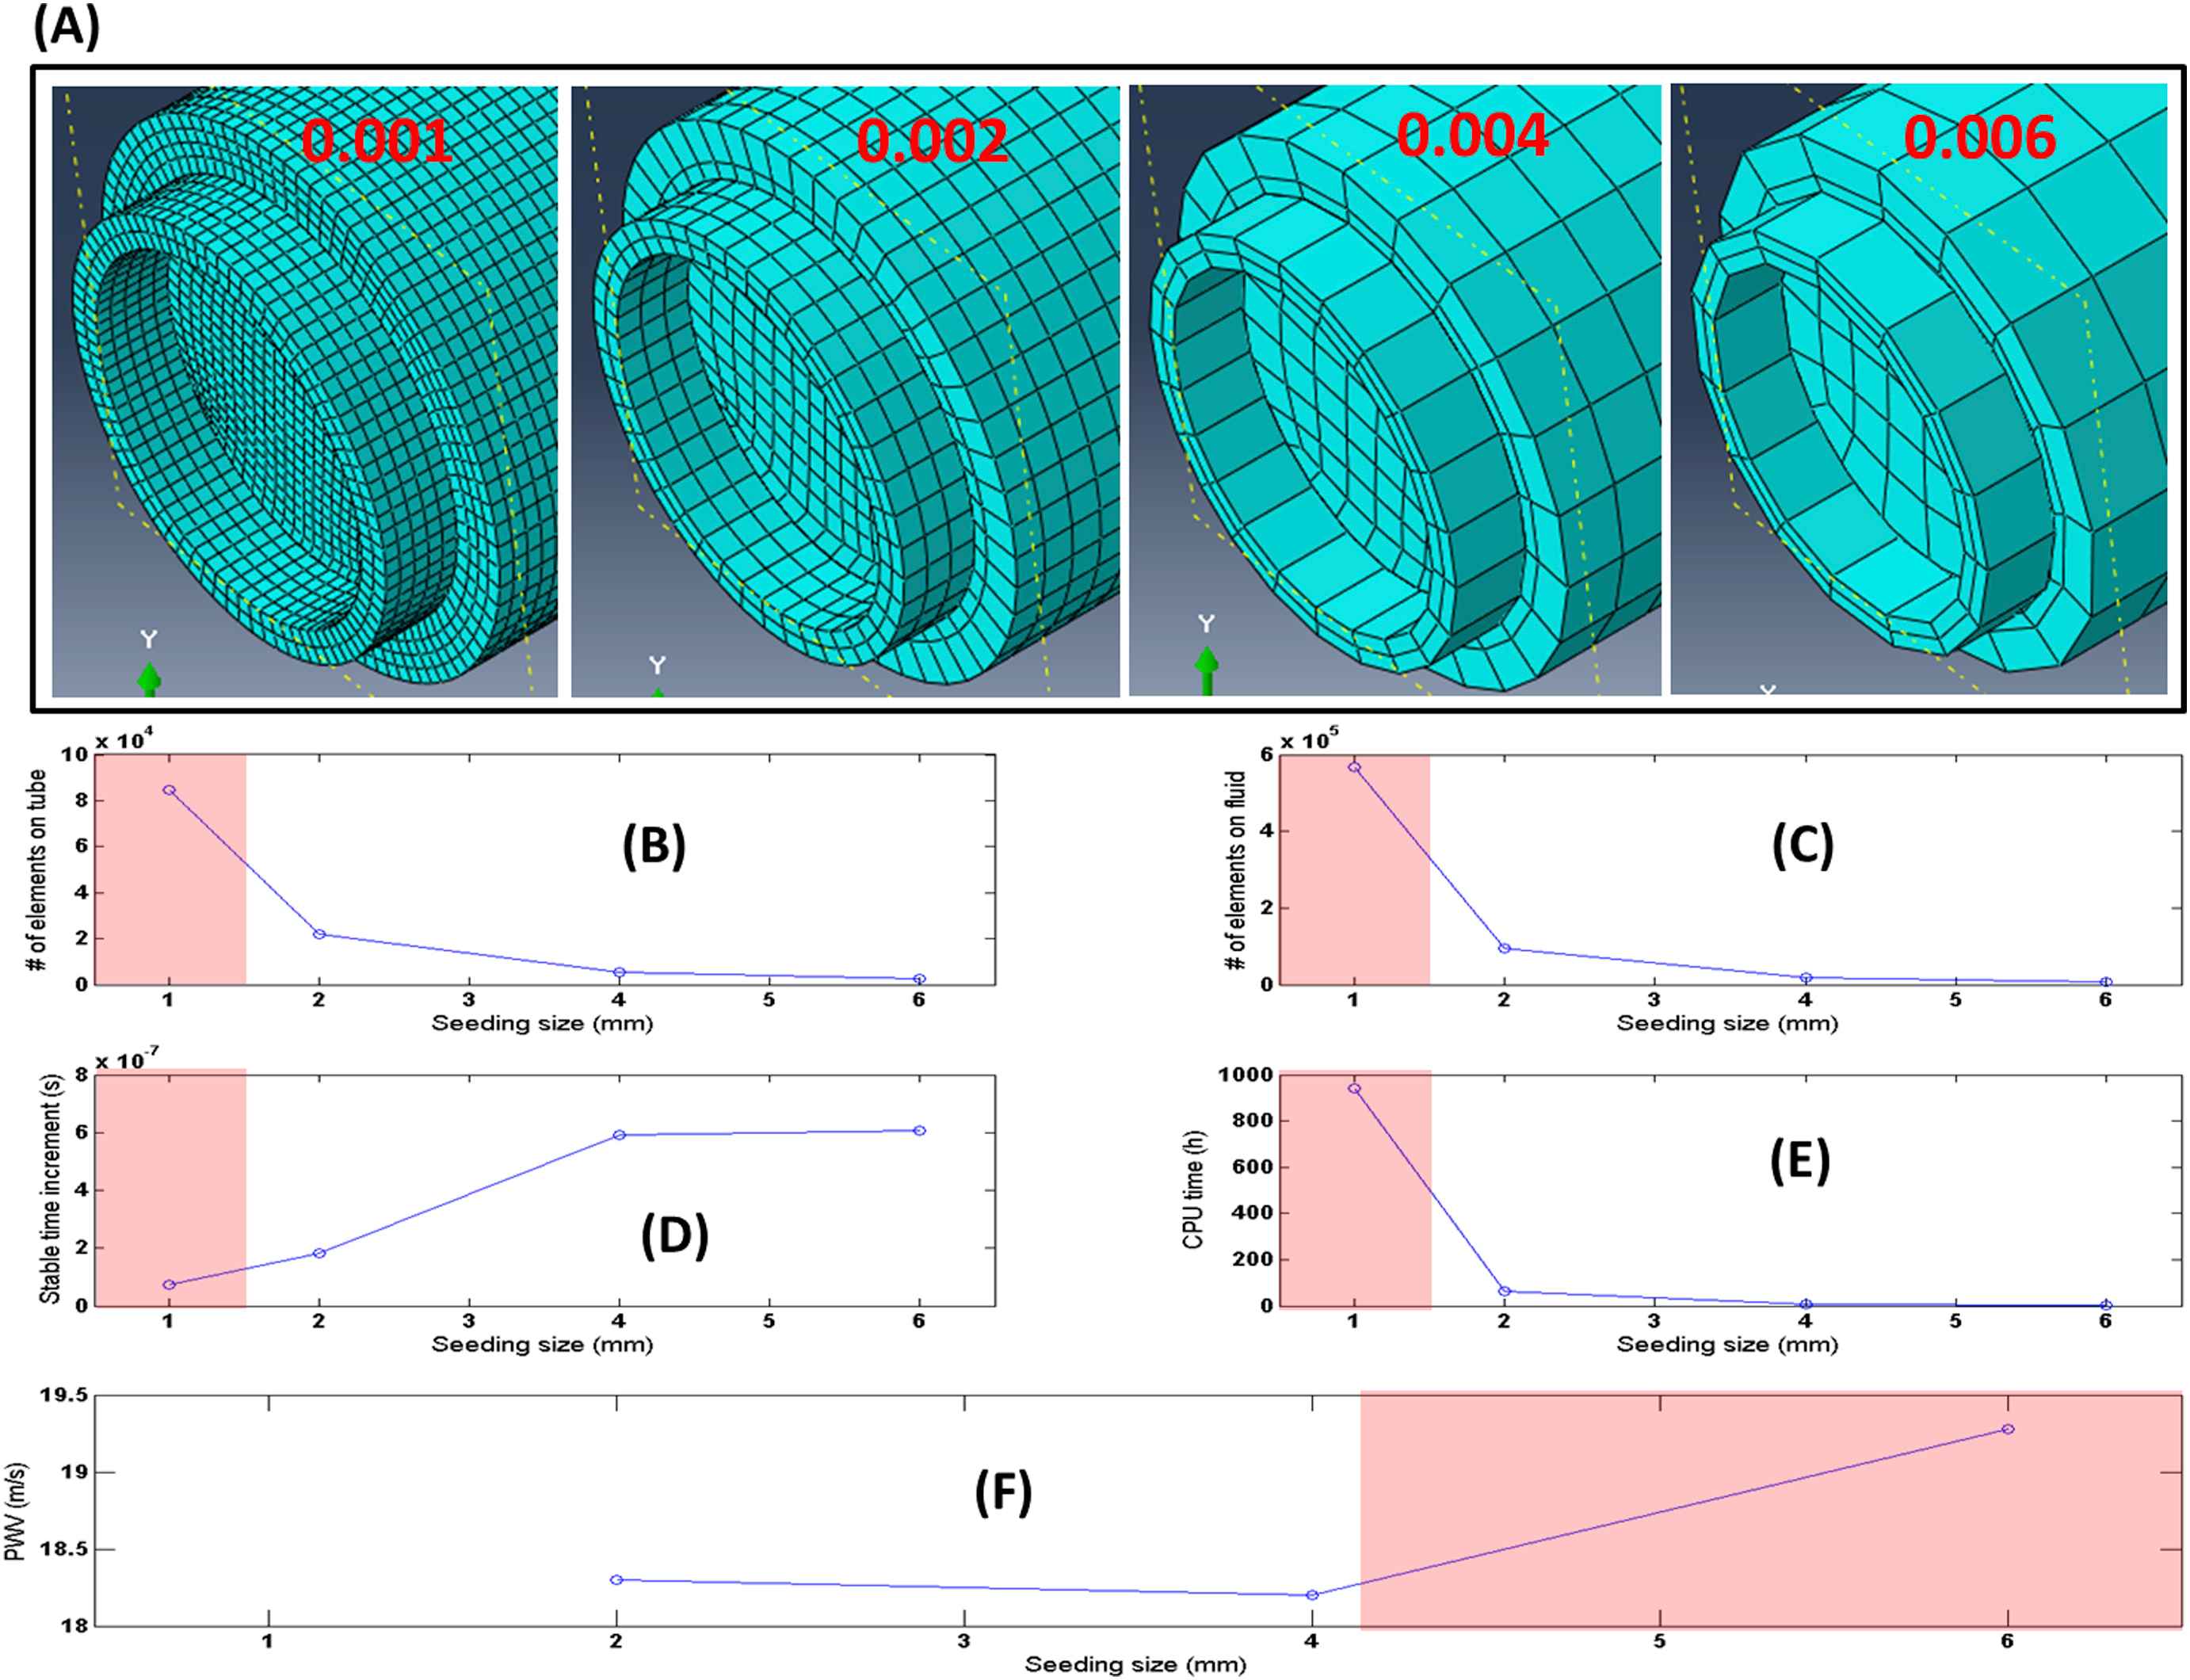
(A) Illustration of the mesh topologies for four increasing mesh seeding size of 0.001, 0.002, 0.004, 0.006 from left to right, respectively. (B)–(F) Number of Lagrangian elements, Number of Eulerian elements, Stable time increment, CPU time, and the computed PWV results, respectively, for the aforementioned mesh seeding sizes. In (B)–(F), regions in red shadow indicate the unfavorable seed sizes. (For interpretation of the references to color in this figure legend, the reader is referred to the web version of this article.)
The results presented here may constitute the first work – to the best of our knowledge – that conducts a parametric study on the effects of arterial wall inhomogeneities on the wave propagation, and establishes quantitative and qualitative markers to infer on the properties of the inhomogeneities, that can be used to enhance the understanding of PWI in vivo. Future work will be conducted on performing soft inclusion parametric simulations and obtaining relevant quantitative and qualitative markers on the pulse wave propagation. The findings on the soft and hard inclusions combined can eventually be used to analyze the simulation results on pathological patient-specific geometries and wall inhomogeneities such as those seen on atherosclerotic and aneurysmal blood vessels, for which both softening and hardening of the walls have been reported.38–41 The implications of the outcome are extended to early diagnosis of cardiovascular diseases at their onset when focal material changes initially occur.
Conclusion
Regional estimates of PWV, rather than global PWVs, have been proven critical in detecting focal changes in the aortic walls such as those taking place during the diseased conditions. In this study, FSI simulation of straight-geometry aortas was shown to constitute a reliable tool to obtain the wave propagations on aortas with homogeneous walls as well as those with wall inhomogeneities represented in the form of hard inclusions. The effects of number of inclusions, inclusion size and inclusion-to-wall modulus contrast on the pulse wave propagations were characterized in terms of qualitative parameters such as standing wave, reflection wave, diffracted reflection zone, and quantitative parameters such as PWV, linear correlation coefficient, with of the standing wave. The qualitative and quantitative markers, combined, were shown to be able to distinguish the nature of inhomogeneities, i.e. whether it is change in the inclusion numbers, size or modulus. The implications of the findings here can potentially extend to enhanced analysis of PWI applications on diseased arteries in vivo.
Acknowledgments
This study was supported in part by the
Appendix A
Supplementary data
Supplementary data related to this article can be found at
References
Cite this article
TY  - JOUR
AU  - Danial Shahmirzadi
AU  - Elisa E. Konofagou
PY  - 2014
DA  - 2014/03/01
TI  - Quantification of arterial wall inhomogeneity size, distribution, and modulus contrast using FSI numerical pulse wave propagation
JO  - Artery Research
SP  - 57
EP  - 65
VL  - 8
IS  - 2
SN  - 1876-4401
UR  - https://doi.org/10.1016/j.artres.2014.01.006
DO  - 10.1016/j.artres.2014.01.006
ID  - Shahmirzadi2014
ER  -